Embed Size (px)
Citation preview

IEK-3: Techno-Economic Systems Analysis
Die Energietransformation aus systemanalytischer Sicht
07.10.2020 | PROF. DETLEF STOLTEN
DHV-Symposium "Was nun? Die Herausforderungen des Klimawandels im Spiegel der Wissenschaft"
Bonn

IEK-3: Techno-Economic Systems Analysis
Setting the Scene

IEK-3: Techno-Economic Systems Analysis
Climate Change Mitigation Drives Green Hydrogen
Climate change CO2 equivalent
• Rising sea levels are posing a menace to the world economy• Storms increase in intensity, size, duration and water load• Extreme weather events like flooding and droughts increase• Harvests are going to decline (at the same time when the world population is expanding)
Local emissions
• PM2: small particulate matter reduces life quality, can reduce lifetime and cause cancer• NOx
Business opportunities
• Harnessing business opportunities through new and more efficient products• Legal and regulatory support is necessary since the system is tailored to the encumbents
The energy transition triggers great business opportunitiesObservation:If climate change gets tackled appropriately other issues are solved “by default“

IEK-3: Techno-Economic Systems Analysis
Basic Requirements for a Future Energy System• In 2050 CO2 emissions based on 1990 shall be reduced by 80-95 % in line w/ COP21• After the transition period energy should not be more expensive than today• Limited emissions shall be reduced
• Electricity, fuels and heat must be available with high reliability• All energy sectors need to be addressed• Teratogenic, carcinogenic and poisonous substances shall be avoided • Nuclear hazards to be considered• Radiative forcing to be considered (e.g. slip of methane w/ rf = 30) for new energy pathways
Paramount Topicso Storage
• Short term: grid stabilization (pumped hydro, batteries, gas storage etc)• Long term: compensate for sustainedly low power generation (only gas storage feasible)
o Transportation (from generation to consumption; connecting regions of different climate)o Compensation of fluctuating renewable inputo Spatial restrictionso Handling dichotomy between a very distributed (e.g. household PV) vs. very centralized
system (off-shore wind farms and coastal on-shore wind power generation) o Sector coupling

IEK-3: Techno-Economic Systems Analysis
Energy Pathways at a Glance

IEK-3: Techno-Economic Systems Analysis
An Approach of Ranking Renewable Energy Pathways
The simplest applicable energy pathways will in most cases turn out to be the most efficient, effective and cost effective
1. Direct use of power
2. Storage in batteries (grid stabilization)
3. Hydrogen storage (long-term storage, seasonal storage, trade of RE)
4. Methane storage
5. Liquid fuel production
• Power to chem comes in parallel
Quantitative storage requirements will probably be much higher than we anticipate today
All of the above mentioned storage options will be needed, owing to the limited applicability of the easier ones ( e.g. liquid jet fuel for aviation)
The complete energy chain needs to be considered for future decisions
Energy security requires substantial storage capacities – as implemented today

IEK-3: Techno-Economic Systems Analysis
The German Energy System

IEK-3: Techno-Economic Systems Analysis 8
Greenhouse Gas (GHG) Emissions in Germany Since 1990
[1] BMWi, Zahlen und Fakten Energiedaten - Nationale und Internationale Entwicklung. 2018: Berlin. [2] BRD, Energiekonzept für eine umweltschonende, zuverlässige und bezahlbare Energieversorgung. 2010: Berlin.[3] BMU, Klimaschutzplan 2050 - Klimaschutzpolitische Grundsätze und Ziele der Bundesregierung. 2016: Berlin.
GH
G e
mis
sion
com
pare
d to
199
0 [%
]
Total emissions[1] Sector specific emissions[1]
Today Today
Mitigation targets of the Federal Government 2010[2]
Mitigation targets according to Climate Action Plan 2016[3]
• Achieving mitigation targets requires contributions from all sectors• No GHG palpable CO2 reduction in the transportation sector since 1990
TransportationIndustryPowerHouseholds
Target to stop climate changeat +2 centigrade(80% scenario)

IEK-3: Techno-Economic Systems Analysis 9
Substitution of Fossil Energy Leads to Increased Power Demand
0
200
400
600
800
1000
1200
Heute 2050 2050Gro
ssPo
wer
Pro
duct
ion1
in T
Wh
German Power Sector
1 excluding import and export
38 %
90 %
99 %

IEK-3: Techno-Economic Systems Analysis 10
Energy Transportation from North to South is Inherent for Renewables in DETotal Generation Potential ofWind & Solar Power in TWh/a
Levelized Cost of Electricity ofWind & Solar Power in ct€/kWh

IEK-3: Techno-Economic Systems Analysis
Projected Input of Off-shore Power into the German Power Grid
11

IEK-3: Techno-Economic Systems Analysis
Energy Transportation and Distrubution is Essential
12
Expansion of the power transportation grid crucial− National grid expansion plan until 2030 first step in the right direction− DC-DC power lines from north to south desriable
Transformation of the natural gas transport grid to hydrogen bears a great opportunity− Large quanties can be transported− Wide coverage possible w/o interrrupting the NG gas grid− Short lead time e.g. 5 years for conversion otjher 0-20 years for building new power lines− Low cost, since pipelines exist
The distribution grids will be strained most- Additional electrical load from
o Passenger vehicleso Heat pumpso Direct electrical heating
IEK-3: Techno-Economic Systems Analysis 13
ES 2050 Study*
Wege für die Energiewende – Kosteneffiziente und klimagerechte Transformationsstrategien für das deutsche Energiesystem bis zum Jahr 2050. Schriften des Forschungszentrums Jülich, Reihe Energie & Umwelt/Energy & Environment, Band/Volume 499; Robinius M., Markewitz P., Lopion P., Kullmann F., Heuser P.-M., Syranidis K., Cerniauskas S., Schöb T., Reuß M., Ryberg S., Kotzur L., Caglayan D., Welder L., Linßen J., Grube T., Heinrichs H., Stenzel P., Stolten D.:https://juser.fz-juelich.de/record/877960/files/Energie_Umwelt_499.pdf
ES 2050kurz
ES 2050lang

IEK-3: Techno-Economic Systems Analysis
Approach: Cross-sectoral Cost-optimization of the Entire Energy System under CO2-Emission Constraints from Today through 2050
14
Development boundaries
2030 2040 2050Today
Ener
gy s
yste
m
over 2000 interrelations
Transformation Strategy:• Cross-sectoral• Cost-optimal• Technologically unbiased
Wege für die Energiewende – Kosteneffiziente und klimagerechte Transformationsstrategien für das deutsche Energiesystem bis zum Jahr 2050. Schriften des Forschungszentrums Jülich, Reihe Energie & Umwelt/Energy & Environment, Band/Volume 499; Robinius M., Markewitz P., Lopion P., Kullmann F., Heuser P.-M., Syranidis K., Cerniauskas S., Schöb T., Reuß M., Ryberg S., Kotzur L., Caglayan D., Welder L., Linßen J., Grube T., Heinrichs H., Stenzel P., Stolten D.:https://juser.fz-juelich.de/record/877960/files/Energie_Umwelt_499.pdf

IEK-3: Techno-Economic Systems Analysis 15
0
100
200
300
400
500
Heute 2050 2050
Inst
alle
dPo
wer
/ G
WIncrease of Renewable Energy
Swift Action in Installing Renewable Energy Devices is Required

IEK-3: Techno-Economic Systems Analysis
CO2 Abatement Strategies for 80% and 95% @ 2050 Differ Notably
16
0
200
400
600
800
1000
Heute 2050 2050
TWh
/ ann
um
Natural Gas Sector1
Erdg
as
H2
H2
Erdg
as
Hydrogen Grid 2050
1 electricity demand

IEK-3: Techno-Economic Systems Analysis
Power to X Technology Represents the Basis for Sector Coupling
17
0
200
400
600
800
Heute 2050 2050
Ener
gyD
eman
d / T
Wh
Power to Liquids (PtL1) & power based hydrogen (H2)
Today
H2
PtL
4,4 mn t
12 mn t
1 Power-to-Liquid-Fuels (syn. Diesel, Benzin, Kerosin)

IEK-3: Techno-Economic Systems Analysis 18
Energy Sector: Projected Installed Power in Germany
0
100
200
300
400
500
2020 2030 2040 2050
Pow
er in
stal
led
/ GW
0
100
200
300
400
500
2020 2030 2040 2050Pow
er in
stal
led
/ GW
WasserstoffWasserkraftWind (Offshore)Wind (Onshore)Freiflächen-PVDachflächen-PVBiomasseAbfälleErdgasErdölSteinkohleBraunkohle
306 GW
471 GW
renewables
~ 120 GW
1 https://www.windbranche.de/windenergie-ausbau/deutschland

IEK-3: Techno-Economic Systems Analysis
Hydrogen Demand Triples for the 95% Scenario (no industry feedstock considered)
19
46
88
Stahlindustrie(Direktreduktion)
Prozesswärmesonst. Industrie
in TWh
Industry Energy Demand
Scenario 80: Hydrogen demand of 4 mn t (mostly transport and industry) Scenario 95: Hydrogen demand of 12 mn t across all sectors (incl. process heat)
Steel industry(H2 – direct reduction)Process heat other industry
0
2
4
6
8
10
12
14
2030 2040 2050 2030 2040 2050
Hyd
roge
n in
mn
t
Buildings Industry Energy Mobility
Wege für die Energiewende – Kosteneffiziente und klimagerechte Transformationsstrategien für das deutsche Energiesystem bis zum Jahr 2050. Schriften des Forschungszentrums Jülich, Reihe Energie & Umwelt/Energy & Environment, Band/Volume 499; Robinius M., Markewitz P., Lopion P., Kullmann F., Heuser P.-M., Syranidis K., Cerniauskas S., Schöb T., Reuß M., Ryberg S., Kotzur L., Caglayan D., Welder L., Linßen J., Grube T., Heinrichs H., Stenzel P., Stolten D.:https://juser.fz-juelich.de/record/877960/files/Energie_Umwelt_499.pdf

IEK-3: Techno-Economic Systems Analysis
Hydrogen and Methane Demand
20
Scenario 80: Hydrogen occurs in mobility and industry only, NG demand rises in between before dropping in 2050
Scenario 95: H2 in all sectors infrastructure development & supply chain analysis needed
Met
hane
dem
and
in T
Wh
Scenario 95
Scenario 80
0
2
4
6
8
10
12
14
2030 2040 2050 2030 2040 2050
Hyd
roge
n in
mn
t
Buildings Industry Energy Mobility
Wege für die Energiewende – Kosteneffiziente und klimagerechte Transformationsstrategien für das deutsche Energiesystem bis zum Jahr 2050. Schriften des Forschungszentrums Jülich, Reihe Energie & Umwelt/Energy & Environment, Band/Volume 499; Robinius M., Markewitz P., Lopion P., Kullmann F., Heuser P.-M., Syranidis K., Cerniauskas S., Schöb T., Reuß M., Ryberg S., Kotzur L., Caglayan D., Welder L., Linßen J., Grube T., Heinrichs H., Stenzel P., Stolten D.:https://juser.fz-juelich.de/record/877960/files/Energie_Umwelt_499.pdf

IEK-3: Techno-Economic Systems Analysis
PhotovoltaicsWind Power
Renewable Energies: Installed Capacities & Tech. Potentials [1]
21
[1] Robinius, M., Markewitz, P., Lopion, P. et al. (2019): Kosteneffiziente und klimagerechte Transformationsstrategien für das deutsche Energiesystem bis zum Jahr 2050. (Kurzfassung) Forschungszentrum Jülich GmbH
[2] Fraunhofer ISE: https://energy-charts.de/power_inst_de.htm[3] Bundesnetzagentur: EEG-Anlagenstammdaten (https://www.marktstammdatenregister.de/MaStRApiDokumentation/)
0
100
200
300
400
500
600
700
Wind(onshore)
Wind(offshore)
PV(rooftop)
PV(open field)
Inst
. Cap
acity
in G
W
Tech. PotentialScenario 95Scenario 80
today [2]today [2] today [2] today [3]
620 GW
82 GW
190 GW246 GW
548
37 12
231153
3422
6346
10463

IEK-3: Techno-Economic Systems Analysis
Sector Coupling

IEK-3: Techno-Economic Systems Analysis
Sector Coupling: What is to be Coupled?
Energy sectors• Public power • Transportation• Industry• Residential
To be coupled• Public power to transport (direct via overhaead lines, batteries or indirect via hydrogen or PtL)• Public power to industry energy demand ( via Ac-AC; AC-gas; substituting proprietary power
generation of industry, coal, oil and natural gas)• Public power to industry matter demand (substituting coal, oil and natural gas incl. reformed
hydrogen; another 450 TWh)• Residental (via heat heat pumps or power via power based fuels for heating)
IEK-3: Techno-Economic Systems Analysis
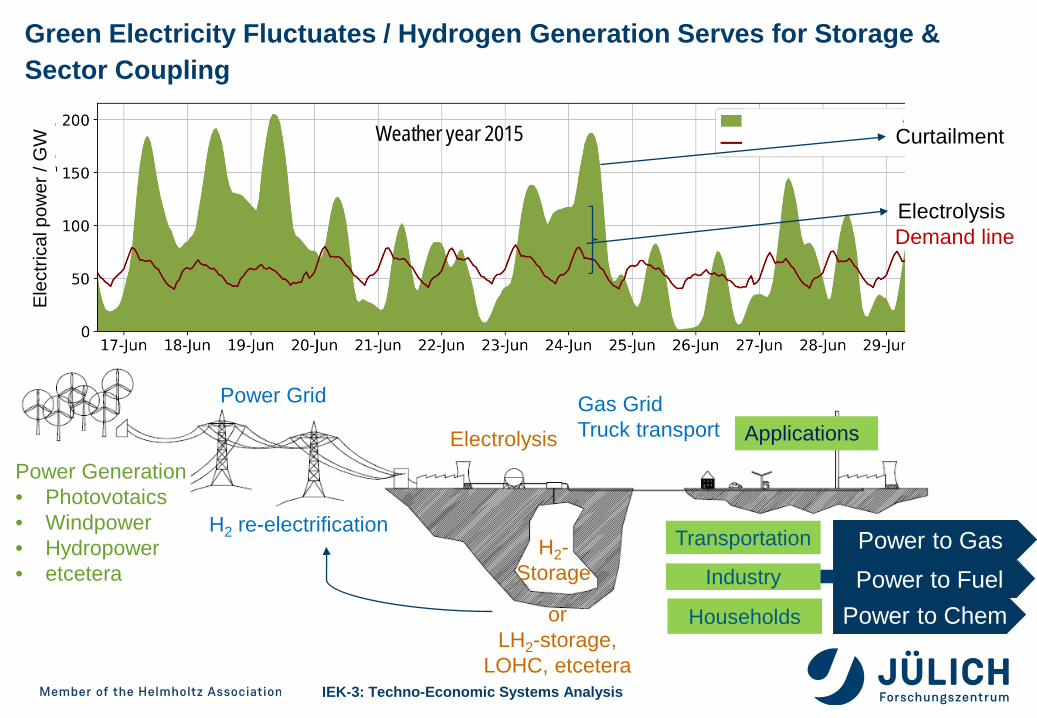
Power Grid Gas GridTruck transportElectrolysis
H2-Storage
Households
Transportation
Industry
Power to Chem
Power to GasPower to Fuel
Green Electricity Fluctuates / Hydrogen Generation Serves for Storage & Sector Coupling
Power Generation• Photovotaics• Windpower• Hydropower• etcetera
Applications
orLH2-storage,
LOHC, etcetera
H2 re-electrification
Curtailment
ElectrolysisDemand line
Elec
trica
lpow
er /
GW Weather year 2015
IEK-3: Techno-Economic Systems Analysis
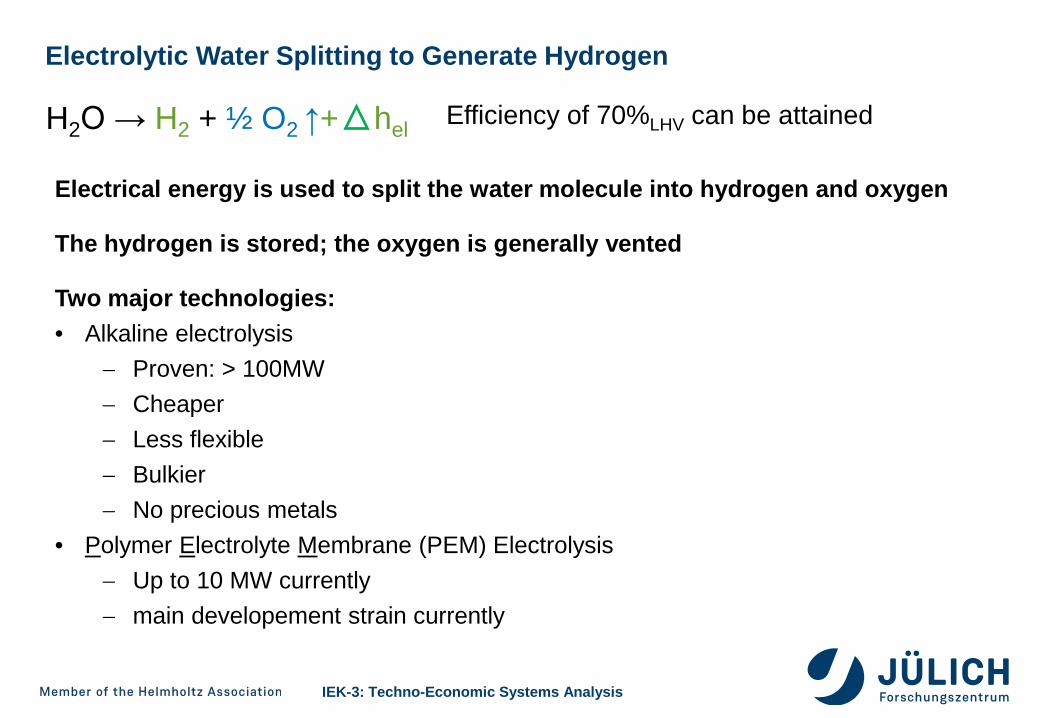
Electrolytic Water Splitting to Generate Hydrogen
Electrical energy is used to split the water molecule into hydrogen and oxygen
The hydrogen is stored; the oxygen is generally vented
Two major technologies:• Alkaline electrolysis
− Proven: > 100MW− Cheaper− Less flexible− Bulkier− No precious metals
• Polymer Electrolyte Membrane (PEM) Electrolysis − Up to 10 MW currently− main developement strain currently
H2O → H2 + ½ O2 ↑+ hel Efficiency of 70%LHV can be attained

IEK-3: Techno-Economic Systems Analysis
PFSA membranes:Ex. Nafion
Diaphragms:Ex. Zirfon
Acid (Nafion) Alkaline (KOH)Anode 2H2O 4H+ + O2 + 4e- 2OH- 1/2O2 + H2O + 2e-
Cathode 4H+ + 4e- 2H2 2H2O + 2e- 2OH- + H2
PEM and Alkaline Electrolysis in Detail

IEK-3: Techno-Economic Systems Analysis
Gasholders
Spherical gas vessels
Ground storage assemblies
Pipe storage facilities
Maximum pressure [bar] 1.01 - 1.5 5 - 20 40 - 1000 20 - 100Storage capacity [scm] < 6 x 10⁴ < 3 x10⁵ < 1 x 10⁴ < 9 x 10⁵
Invest/ storagecapacity ‡ [€/scm] ? 20 - 50 50 - 180 20 - 50
Near-Surface Gas Storage Facilities

IEK-3: Techno-Economic Systems Analysis
Depleted oil / gas fields
Aquifers Salt caverns Rock caverns / abandoned
mines
Working volume [scm] 1010 108 107 106
Cushion gas 50 % up to 80 % 20 - 30 % 20 - 30 %
Gas qualityreaction and contamination withgases present, microorganismand minerals
saturation with water vapor
Annual cycling cap. only seasonal seasonal & frequent
Gaseous Hydrogen: Geologic Gas Storage Facilities
Investment in rock salt caverns: approx. 40 ct/kWh installed capacity

IEK-3: Techno-Economic Systems Analysis
Liquid Hydrogen
Great mass storage option, if• LH2 can easily be transported by truck, train or ship
Liquefaction• Current energy loss of liquefaction >30% of hydrogen energy content• Future systems have a potential of 7 kWh/kg or 21% loss• Current plants 150 l/h – 20000l/h (up to 47 MW)• Specific evaporation low for large storage tanks• Evaporated H2 can be used and is not lost in most cases• Current plants amount to at most 40 MW H2 • Hence, current H2 liquefaction is NOT being done centrally in the sense of
energy systems

IEK-3: Techno-Economic Systems Analysis
Lulls of 2- 3 Weeks are to be Expected in Central Europe
30
European electricity grid considered
Hydrogen Storage has the Potential to Furnish the Energy Demand during Lulls

IEK-3: Techno-Economic Systems Analysis
Worldwide H2 Allocation (Reference Scenario) - Flows in million tons
31
4.21
39.9
4.5 4.0 1.1
26.4
9.0
6.332.8
31.036.8
8.8
10.8
3.6
2.5
8.83.6
Germany Japan Europe USA China India Southeast AsiaDemand in Mt/a 4.57 6.7 31.4 41.7 70.9 36.8 38.1Import cost in €/kg 3.61 3.83 3.86 3.68 4.05 3.84 3.99
4.0
18.7
12.2
North AmericaUSA
C. & S. AmericaBrazil
EuropeAfricaMiddle EastEurasiaAsia Pacific
ChinaIndiaJapan H2 flows in Mt
24.7
38.1
IEK-3: Techno-Economic Systems Analysis
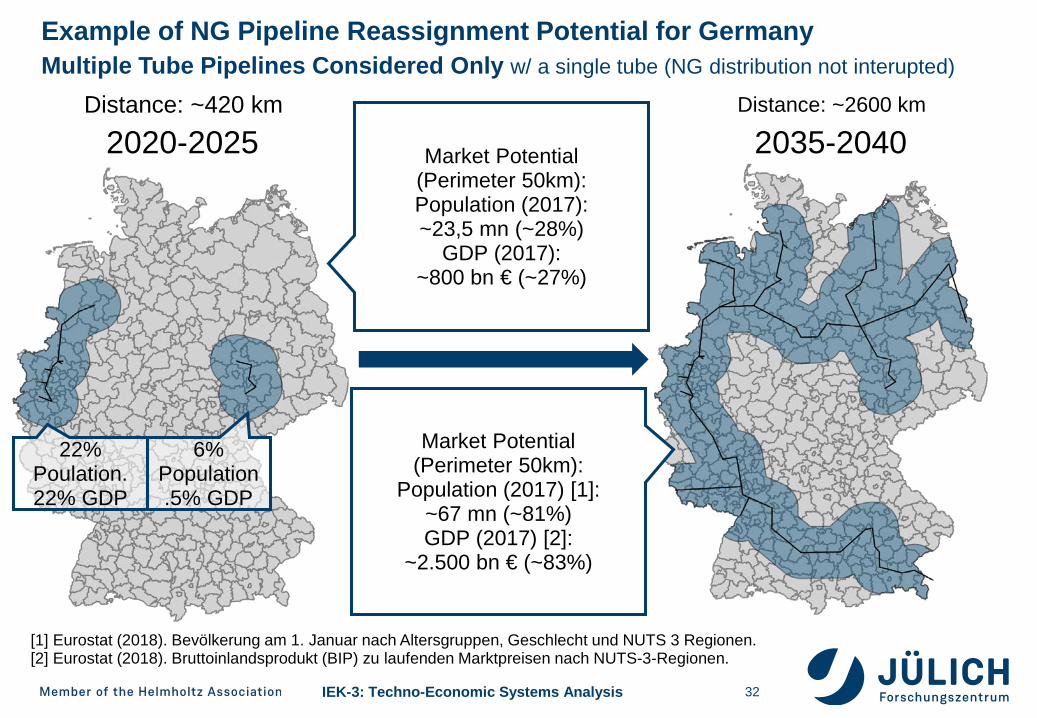
Example of NG Pipeline Reassignment Potential for GermanyMultiple Tube Pipelines Considered Only w/ a single tube (NG distribution not interupted)
32
2020-2025 2035-2040Market Potential(Perimeter 50km):Population (2017):~23,5 mn (~28%)
GDP (2017):~800 bn € (~27%)
Market Potential(Perimeter 50km):
Population (2017) [1]:~67 mn (~81%)GDP (2017) [2]:
~2.500 bn € (~83%)
[1] Eurostat (2018). Bevölkerung am 1. Januar nach Altersgruppen, Geschlecht und NUTS 3 Regionen.[2] Eurostat (2018). Bruttoinlandsprodukt (BIP) zu laufenden Marktpreisen nach NUTS-3-Regionen.
22%Poulation.22% GDP
6% Population.5% GDP
Distance: ~420 km Distance: ~2600 km

IEK-3: Techno-Economic Systems Analysis
Final Geospatial Results: Scenario for 20 million FCV
GH2-Pipeline LH2-TrailerGH2-Trailer GH2-TrailerGH2-Pipeline

IEK-3: Techno-Economic Systems Analysis
Transportation Application as an Example (numbers for passenger vehicles)
34
Combustion engine (bio-fuels)Efficiency: 50 % x 25 % = 13 %
(W2T) (T2W)
Battery vehicle (renewable electricity)Efficiency: 80 % x 85 % = 68 %
(W2T) (T2W)
Fuel cell vehicle (renewable electricity)Efficiency: 63 % x 60 % = 38 %
(W2T) (T2W)
Combustion engine (CO2-based fuels)Efficiency: 70 % x 50 % x 25 % = 9 %
(H2) (plant) (T2W)T2W: tank-to-wheelW2T: well-to-tankW2W: well-to-WheelW2W = total efficincy
Today‘sW2W Effciency
≈18%w/ combustion
engines
Furthermore:Trucks (from LDV to HDV)Local Trains (cruising range 600 to 1000 km)

IEK-3: Techno-Economic Systems Analysis
Fuel Cells are on the Market
Emission-free transportartion from paasenger vehicles via trains to long haul trucks
750 km cruising range
400 km cruising range
34 t truck
600 km cruising range
327 passengers
© Hyundai © Alstom © Hyundai
35

IEK-3: Techno-Economic Systems Analysis
Thank You for Your [email protected]
ISBN: 978-3-527-33238-02016
ISBN: 978-3-527-33012-62012
ISBN: 978-3-527-33240-3 2016
ISBN: 978-3-527-33239-72013
ISBN: 978-3-527-33002-72010