Embed Size (px)
Citation preview
Department of English
Bachelor Degree Project
English Linguistics
Autumn 2018
Supervisor: Raphaël Domange
Differences in attitudes towards RP and GA A study of Swedish university students with
English as their L2
Robert Vidén
Differences in attitudes
towards RP and GA A study of Swedish university students with English
as their L2
Robert Vidén
Abstract
The purpose of this study is to broaden our understanding of the
attitudes Swedish university students hold towards RP and GA.
Although several studies have been conducted on the topic, none have
sought to describe the three components traditionally assumed in the
mentalist approach to language attitudes. The present study aims to
bridge this gap. This was done by investigating students at Stockholm
university using the verbal guise method. The present study found that
students of Stockholm university with English as their L2 think that
RP sounds more arrogant and boring, but also more responsible,
gentle and intelligent than GA. The investigated population also felt
more irritation while listening to RP than GA. They also felt more
trust and liking for speakers of GA than of RP. Lastly, there were also
differences regarding the accent the investigated population perceives
it uses. GA was heavily favored in this respect. The findings of the
present study could help to solve educational issues such as finding
which English accents are suitable or most suitable for teaching.
Keywords
Attitude, Cognitive, Affective, Conative, Belief, Feelings,
Behavioural tendencies, Statement, Trait, Sentiment, Accent, RP, GA.
Contents
1.0 Introduction ............................................................................................................... 1
2.0 Background ............................................................................................................... 2
2.1 What are attitudes? ................................................................................................. 2
2.2 Theoretical and methodological challenges in language attitude research .......................... 3
2.3 Previous studies on language attitudes in second language research ................................ 5
3.0 Research questions ..................................................................................................... 8
4.0 Method ..................................................................................................................... 9
4.1 Data...................................................................................................................... 9
4.2 Analysis ............................................................................................................... 12
5.0 Results and Discussion .............................................................................................. 12
5.1 Cognitive evaluations ............................................................................................. 13
5.2 Affective evaluations .............................................................................................. 15
5.3 Conative responses ................................................................................................ 17
5.4 Further discussion ................................................................................................. 18
6.0 Conclusion ............................................................................................................... 20
References .................................................................................................................... 21
Appendix 1 ................................................................................................................... 23

1
1.0 Introduction
Attitudes have been the focus of a great deal of research in the social sciences. Research on
this concept has been conducted by social psychologists since the 1920s (McKenzie, 2010, p.
19). Even though attitudes have been studied for a long time, the very foundation of attitude
research such as what constitutes an attitude is still highly debated. In the early years of
attitude studies, the difficulty in defining attitudes led some to argue that the concept of
attitudes was unsuitable for scientific research (Bain, 1928, p. 940). In 1928, Bain listed
reasons for sociology being ridiculed by the scientific community, and among these were “the
inaccuracy, indefiniteness, and anarchistic confusion of our concepts. […] We cannot do valid
scientific research until we know what we are talking about” (Bain, 1928, p. 942). According
to Bain, attitudes are a good example of a concept that is ill-defined or even undefined, used
in a pseudo-scientific manner (Bain, 1928, p. 942). In the contemporary debate, the question
discussed is not whether we can study attitudes, but rather how we should do it (Garett, 2010,
p. 20). According to Agheyisi and Fishman (1970), the definitions used in this domain of
research often reflect certain research interests (p. 137). Therefore, certain definitions are
more prone to be adopted in certain fields of attitude research. In language attitude research,
which will be the focus of this study, attitudes are often defined as pro/con evaluations of
certain language varieties and speakers of these (Carrie, 2016, p. 429). By using this type of
pro/con definition, researchers often end up only measuring the sum of participants feelings
towards the attitude object, even though attitudes are generally said to consist of beliefs and
behavioral tendencies too (Agheyisi and Fishman, 1970, p. 137). The reason for using this
pro/con definition of the term ‘attitude’ is most likely because of the many theoretical
challenges that stem from its complexity (Garett, 2010, p. 20).
Despite difficulties, there have been attempts at defining attitudes more adequately. For
instance, the 3-components model, which challenges the rather monolithic definition of
attitudes as pro or con, has yielded fruitful results. A recent example of this is Carrie (2016).
By using this 3-component model instead of a pro/con definition, she found attitudes such as
whether a language variety was perceived to be irritating, boring or sound arrogant. These
types of detailed findings are lost when using a pro/con definition of attitude, therefore
limiting the practical use of such studies. While a significant amount of research has been
conducted on attitudes towards English in Sweden, the 3 components model has not yet been
used. The present study aims to bridge this gap.
2
Considering that research in this domain has targeted only one of the three components of
attitude, the purpose of the present study is to broaden the scientific community’s
understanding of the attitudes that Swedish university students with English as their L2 hold
towards RP and GA. To accomplish this, 50 Swedish university students were asked to rate
recordings of a GA speaker and an RP speaker. The findings suggest that the investigated
population found RP more arrogant and boring, but also more responsible, gentle and
intelligent than GA. Also, the respondents expressed more irritation while listening to RP than
GA, and felt more trust and liking for speakers of GA than of RP. Lastly, they perceived
themselves as using GA to a larger extent than RP. The findings of the present study could
help to solve educational issues such as which English accents are suitable or most suitable
for teaching.
2.0 Background
2.1 What are attitudes?
According to Agheyisi and Fishman (1970), “[t]he concept ‘attitude’ has been variously
defined and characterized by almost every theorist or researcher who has concerned himself
with attitude studies” (p. 137). The definition used often reflects particular research interests,
or the theoretical approach adopted (McKenzie, 2010, p. 19). In general, the term attitude
refers to a social and socio-psychological concept, and historically, researchers of attitudes
have adopted either a so-called mentalist approach or a behaviorist approach (McKenzie,
2010, pp. 19-21).
The behaviorist approach views attitudes as the sole dependent variable in behavior.
(McKenzie, 2010, p. 21). This view of attitudes was first formulated by Bain in 1928
(Agheyisi and Fishman, 1970, p. 138). Previous use of the term attitude was according to
Bain either undefined or too reliant on subjective experiences, which he thought made it
unsuitable for scientific research (1928, pp. 942, 950). The strength of the behaviorist
approach is that it makes the study of attitudes relatively straightforward at the level of
analysis, unlike the mentalist approach (Agheyisi and Fishman, 1970, p. 138). Also, evidence
suggests that there is a strong correlation between attitudes and behavior. However, the
behavioristic approach has received critique for being an unreliable approach in the study of
attitudes since human behavior is to some extent unpredictable. (McKenzie, 2010, p. 21). For
3
instance, some studies show certain individuals having a positive attitude towards an object
while also displaying a negative behavior towards it (Garett, 2010, p. 6).
The mentalist approach views attitudes as a mental and neural state of readiness, thus
implying “that they are not directly observable but have to be inferred from the subject´s
introspection” (Agheyisi and Fishman, 1970, p. 138). Today, it is the principal theoretical
approach to the investigation of attitudes (McKenzie, 2010, p. 21). The mental and neural
state of readiness, now more readily defined as “an internal state of readiness” will affect the
responses of the individual when aroused by stimulation of some sort” (McKenzie, 2010, p.
21). Also, mentalists view attitude as having a tripartite structure, with cognitive, affective
and conative components (Carrie, 2016, p. 430). The cognitive component refers to an
individual’s beliefs about X. The affective component refers to an individual’s feelings
towards X and the conative component refers to an individual’s perception of their behavioral
tendencies towards X (McKenzie (2010, p. 22). However, it should be noted that all three
components are not necessarily represented in an attitude towards a certain entity (McKenzie
(2010, p. 22). One advantage to using the mentalist approach instead of the behaviorist
approach is that attitude “still remains an independent variable in the form of a latent
psychological constant which is not tied to the specific external stimulus situations in which
the responses are made” (Agheyisi and Fishman, 1970, p. 138). Therefore, it allows
researchers to use their findings to explain how the investigated population might think, feel
and behave in other similar situations (Alexander and Norman, 1966, pp. 280-281). This is
arguably a major advantage, however, using the mentalist approach does come with several
challenges that will be discussed further in the context of language attitude studies.
2.2 Theoretical and methodological challenges in language attitude research
The study of language attitudes began in 1960 with Lambert, Hodgson, Gardner, and
Fillenbaum who asked French and English-speaking Canadians to evaluate speakers of both
languages regarding physical attributes, but also mental and emotional traits (Carrie, 2016, p.
430). Since then, the procedure of obtaining data in language attitudes research has undergone
little change. However, the research instruments, i.e., the scales or questions used in the
evaluation of speakers, have varied a great deal. This variation is generally the result of
researchers defining their object of study differently or the lack of a standardized instrument
of language evaluation. The use of varying research instruments has caused the comparability
between language attitude studies to be impaired.
4
Attempts to standardize the tools for evaluation of language attitudes have been made by
Zahn and Hopper (1985). Statements from several different studies were tested in regard to
how meaningful they were for undergraduate university students in the southwestern United
States. All the statements were designed to measure the cognitive aspect of attitudes in a
certain language variety, so even though attitudes were never defined explicitly, it is evident
that attitudes were thought of as consisting solely of beliefs in this study. The 30 most
meaningful statements were then chosen to constitute the new instrument for the evaluation of
language (Zahn and Hopper, 1985, pp. 118-119). The attempt was arguably unsuccessful for
two reasons. Firstly, the 30 statements were by no means exhaustive regarding all the
different beliefs one can have about language. Therefore, it is likely that some researchers
would want to know about beliefs that are not reflected in these statements. Secondly, Garett
(2010, p. 56) argues that there is no universal set of statements that is applicable in the study
of every population since different sets of statements are meaningful to different populations.
Therefore, even if researchers who equate attitudes with belief or simply want to study beliefs
in language use these statements, some of those statements will most likely not be meaningful
to their investigated population. Because of this, it is unlikely that a standardized instrument
for language attitude research will ever be accepted by the scientific community.
The challenge of defining the object of study in language attitude research appears to have a
long history. Agheyisi and Fishman (1970) argue that even though attitudes are said to include
three components, researchers usually only measure one of them, this being the affective
component (p. 139). Not including all three components could be a way of avoiding a
significant problem in the mentalist approach. According to Agheyisi and Fishman (1970), a
major criticism of the multi-component view of attitudes is the impossibility of determining
the organization and interrelation of the various attitude components an individual hold to a
certain attitude object (p. 139). By reducing attitudes to one component, the problem is
avoided.
Defining attitude as a mono-component concept has been the subject of some contemporary
critique. Carrie argues that:
A prevailing limitation of language attitude studies is that they rely on general, one-dimensional
definitions of ‘attitude’. They rarely acknowledge the complexity of the construct by distinguishing
between its various components. (Carrie, 2016, p. 428)
5
Instead of using a monolithic definition of language attitude, Carrie suggests the following
definition: “[O]ne’s evaluation of and disposition towards a speech variety and its speakers,
consisting of thoughts, feelings and behavioural tendencies” (2016, p. 430). This definition is
for speech variety and speakers, but these can be replaced with any other attitude objects. It
should be noted that Carrie´s definition brings nothing new into the theoretical framework of
language attitudes but derives ultimately from the mentalist approach to attitudes. However,
by using it herself and presenting it, she hopes to offer a more theoretically informed
definition of language attitude by including attitude’s tripartite structure into the definition
(2016, p. 443).
Despite differences in how researchers define their object of study, the large amount of
research still allows for some generalizations to be made in the field of language attitude
research. For instance, if one study has measured the affective part of Y’s attitude towards X,
this result can be compared with another study that has researched the cognitive parts of Y’s
attitude towards X. Therefore, the ability to do this is largely dependent on the amount of
research done about the attitude object. As an example, evidence suggests that depending on
which English accent is perceived as the standard in a certain population, the attitudes of this
population towards different English accents differ (Carrie, 2016, p. 430). Also, in an EFL
context, which will be the focus of this study, there seems to be a general preference for RP in
Europe and a preference for GA outside of Europe (Carrie, 2016, p. 433). In the following
section, the practical value of such language attitude generalizations will be explored. Also,
some previous language attitude research of students with English as their L2 will be
discussed.
2.3 Previous studies on language attitudes in second language research
Carrie (2016) investigated the attitudes Spanish university students with English as their L2
hold towards RP and GA. Most notably, she found that speakers of RP were thought to be
more competent than speakers of GA. However, GA speakers were thought to be more
socially attractive. Also, she found that participants felt more positively towards GA speakers,
but most of them still desired to emulate RP speech, rather than GA (Carrie, 2016, p. 442). It
should be noted that some of her findings were difficult to reconcile. For instance, she found
that university students felt a liking for RP and GA speakers while also feeling a high degree
of irritation when listening to them. Also, she found that the higher degree of boredom
university students felt while listening to a speaker, the higher degree of interest was felt
6
while listening to them (Carrie, 2016, p. 440). Even so, this study is important for the present
study in several ways. Firstly, some of the research instruments she used will be reused in this
study. Secondly, the present investigation relies on the same working definition of language
attitudes. Moreover, lastly, by comparing the findings of the present study with studies such
as Carrie´s, generalizations can be made which constitute the practical value of such research.
[The] language variety employed by a given speaker can have wide-ranging social implications,
including influencing job hiring and career progression, teachers’ perceptions of their students’
educational abilities and the perceived persuasiveness and credibility of the message itself. (McKenzie
and Carrie, 2018, pp. 3-4)
This passage illustrates several fields in which language attitude research could be considered
valuable. If we can discover more about attitudes towards language varieties or accents, we
can also use this knowledge to influence the many areas that it affects. Furthermore, in an
EFL context, Carrie argues that language attitude studies provide invaluable insight regarding
the status of English, but also the preferences of EFL learners (2016, p. 429). The value of
such insight is arguably important in countries where English is used in the educational
system.
According to Bolton and Kuteeva, “universities across Europe have increasingly adopted the
use of English at various levels of learning” (2012, p. 429). Sweden is one of the countries in
Europe that offers the most university education in English (Bolton and Kuteeva, 2012, p.
429. Since English is gaining more room in Swedish education, the type of English spoken in
teaching situations becomes increasingly important. Negative comments from students at
Stockholm university regarding the English accents of their teachers dominate across different
faculties and disciplines; this led some of them to also give a negative assessment of having
lectures in English (Bolton and Kuteeva, 2012, p. 435). Because of this, the accent used when
speaking English has become a matter of didactics. The findings of Bolton and Kuteeva
(2012) point to the fact that a majority of the negative comments regards non-native accents
(p. 435). These findings suggest that a native accent might be best suited for teaching in a
Swedish context. If putting the mixed mid-Atlantic accent aside, the most commonly used
accents in Sweden are RP and GA (Modiano, 1993, p. 39). Research on student´s attitudes
toward these accents is arguably an intuitive start in finding an optimal teaching accent. In
Sweden, there are already some studies of Swedish students´ attitudes towards RP and GA,
but these are few.
7
Modiano (1993) asked 125 Swedish university students which English accent sounded most
pleasant to the ear. 64 of them answered RP, and 45 answered GA (pp. 44-45). He returned to
the topic in 2002, this time asking Swedish upper secondary school students which English
accent they preferred. 61.3% answered that they preferred GA and 33.3% of the student’s
preferred RP (Modiano and Söderlund, 2002, p. 152). The shift in students´ preference from
RP to GA is seen as “striking evidence of the ongoing Americanization” (Modiano and
Söderlund, 2002, p. 152). This shift that these two studies supposedly show is somewhat
questionable. The questions used in the questionnaires do not match, and since “which accent
do you find most pleasant to the ear” is not equivalent to “which accent do you prefer”, the
comparison between them may be found objectionable. Also, the findings from these studies
arguably say little about the participants´ attitude towards the two accents. The details of the
participant’s attitude are lost when not looking at a specific aspect of the attitude, i.e., the
cognitive, affective or conative. Even though the studies carried out by Modiano has some
validity issues, the findings still provide some evidence of a significant change in Swedish
university students preference from RP towards GA.
Axelsson (2002) also investigated Swedish university students’ attitudes towards RP and GA
by asking 149 participants about the accent they preferred and why. 54% answered that they
preferred RP and 25% answered that they preferred GA. The answer to which accent they
preferred and why was to be specified on a single row on the questionnaire, thus leaving only
a short space to answer why they preferred the chosen accent (Axelsson, 2002, p. 146). The
short answers are evident in the results of the study where she lists some of the reasons
advanced by the participants (Axelsson, 2002, p. 143). Apart from a possible problem in not
giving the participants enough space to provide an elaborated answer, Axelsson does not
specify how many participants agree with each observed attitude. Also, she does not specify if
she excluded any answers. Furthermore, she claims that she had investigated the attitudes
towards these accents in 1992 and that “no student had anything positive to say about AmE”
(Axelsson, 2002, p. 142), referring to GA accent. This statement is interesting since Modiano
found that 45% of Swedish university students preferred GA in 1993. As to the results of her
study from 2000, the data also conflicts with what Modiano found in 2002.
Mobärg (2002) also investigated student’s attitudes towards RP and GA but focused on high
school students. Mobärg had 198 students read three different texts to see whether they read it
in an RP or a GA accent. The first was an action dialogue, the second a fairy tale and the third
a word list. Mobärg found that 61% of the students read the action dialogue in RP, 62% read
8
the fairytale in RP, and 71% read the word list in RP (Mobärg, 2002, p. 121). From this result,
Mobärg concluded that the students associated GA with informal speech styles and RP with
formal speech styles (Mobärg, 2002, p. 128). This corresponds to the traditional Labovian
approach to style variation as a function of attention paid to speech. Although this method has
proved effective in sociolinguistics, this approach has definite behaviorist underpinnings (Gal,
2016). Although, as mentioned above, behaviorist methods have been largely rejected in
attitude studies, those results should not be dismissed fully. According to Carrie, the
psychological process of similar attraction prompts individuals to express solidarity towards
an accent through speech (2016, p. 441). Since Mobärg finds most speakers to pronounce the
words in RP, this should indicate that they feel more positively towards RP.
A more recent study investigated Swedish upper secondary school students´ attitudes towards
four different accents, including RP and GA. Attitudes were inferred by having the
participants listen to recordings of the different accents and asking them to rate the speakers
on 22 different traits (Sahlström, 2005). Since she had the participants rate the speakers on
these many different traits, the detail in her findings was relatively large. Unfortunately, only
a few of these cognitive traits are the same as the ones I will be testing in this study. It may
nevertheless prove a useful source for comparison for the results of the present study.
3.0 Research questions
As I have shown in the previous section, several studies have attempted to research the
attitudes of Swedish students towards RP and GA. However, due to the longstanding
theoretical challenges that reside in language attitude research, the research instruments
employed in these studies vary a great deal. This variance renders the comparability between
the studies somewhat problematic. Also, no previous research on this topic in Sweden has
included all three components of attitude in their working definition of attitudes. These
monolithic definitions have led to findings that either lack in detail or findings that only
reflect a single component of attitude. Keeping this in mind, the research questions were
devised as follows:
9
Do Swedish university students with English as their L2 have different attitudes towards RP
and GA? If yes, what are the differences?
The working definition of ‘language attitude’ in this study will be the same as the one that
Carrie uses in her study. “[O]ne’s evaluation of and disposition towards a speech variety and
its speakers, consisting of thoughts, feelings and behavioural tendencies” (2016, p. 430). A
definition such as this one acknowledges the complexity of language attitudes and using it
should, therefore, produce results that reflect language attitude in more detail than the
monolithic definitions do. The method used to investigate this is described in the following
section.
4.0 Method
According to McKenzie and Carrie (2018), the verbal guise method has been widely used in
language attitude research and has shown to provide a high degree of consistency concerning
the data collected (p. 3). This method constitutes a methodological framework for collecting
data in language attitude research. Respondents in this method are first asked to listen to a
recording at least one time. In research about accents, each recording consists of a different
individual talking in the investigated accent. After that, the respondent is asked to fill in
attitude rating scales concerning certain statements about the speaker in the recording (Garett,
2010, p. 41). The result produced from having the respondent answer the attitude rating scales
are thought to represent the attitude towards the accent and its the speaker (McKenzie, 2010,
p. 46). The following section is a detailed account for what the data is, how it was collected,
what the tools for collection are and how they were designed.
4.1 Data
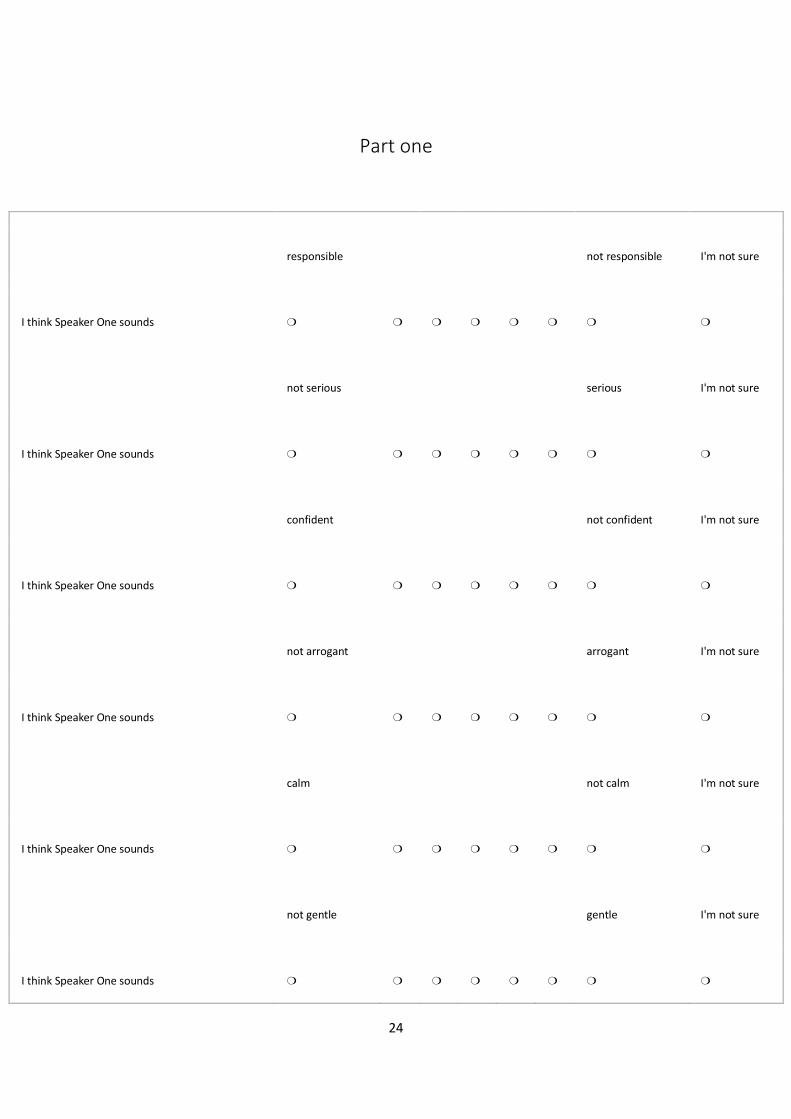
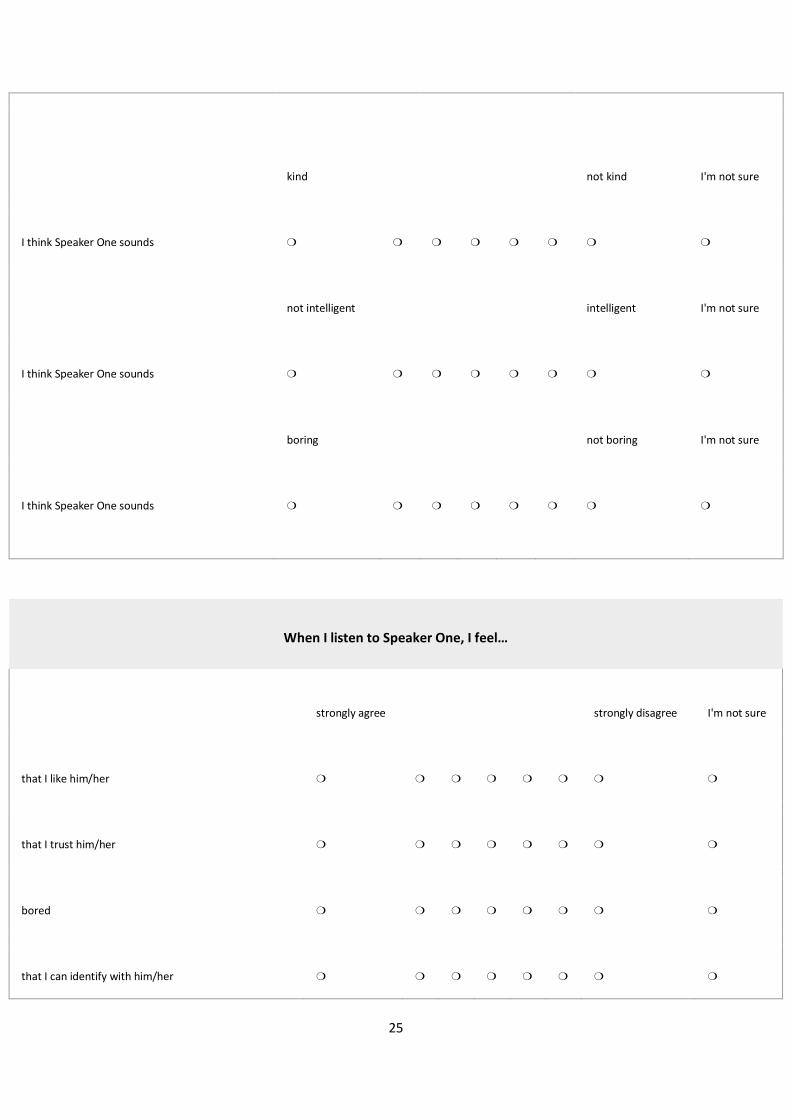
The questionnaire used was adopted from Carrie (2016), except for the part with questions
about background information. The statements in this questionnaire consist of nine traits
designed to measure the cognitive component of attitude, eight sentiments to measure the
affective component and two statements to measure the conative component. The full detail of
these statements can be found in Appendix 1. According to Garett, using the same statements
as other studies is advantageous in several ways (2010, p. 56). The main reason for using the
same statements as Carrie is that her study shares the same theoretical approach and definition
10
of attitude as this study. This similarity arguably lowers the risk of the definition or theoretical
approach conflicting with the research instrument. It is important to note that the statements
included in this questionnaire should not be thought of as exhaustive. For instance, a
participant might have strong feelings towards the tested accent, involving sentiments that
have not been tested in this study.
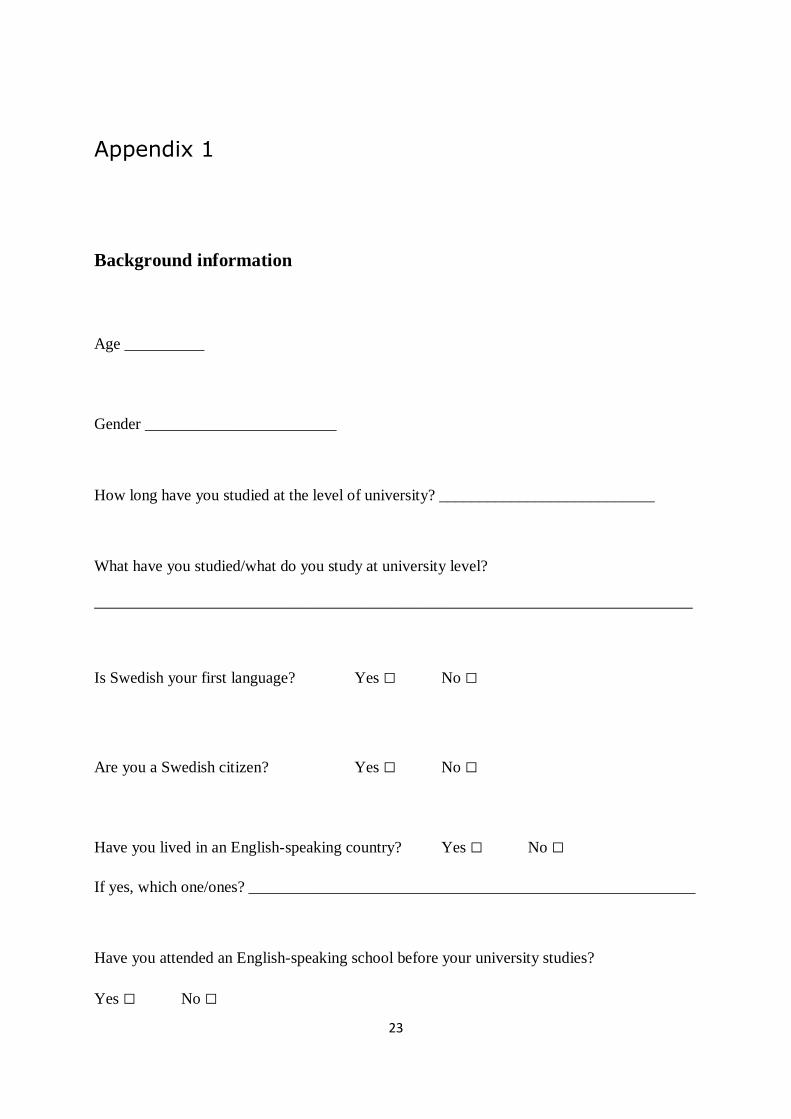
Furthermore, a section asking for background information was added to the questionnaire.
This section was added to ensure that the sample size would not consist of a hidden
overrepresentation of a certain type of student. Such an overrepresentation could take the
form of a bias towards a certain gender or age. However, also, in qualities that could affect
responses to a great extent, such as having lived in English-speaking countries or attended
English speaking schools. The questions regarding whether the participants have Swedish as
their first language and whether they are a Swedish citizen were added as a formality, the
participants were asked these questions before partaking in the test to avoid unnecessary
testing.
The recordings that were used in collecting the data were not adopted from Carrie (2016).
However, in order to have increased comparability with the results, an attempt was made to
adopt the recording she used. Unfortunately, since I was not able to obtain speaker consent,
this was unsuccessful. Therefore, the recordings were selected from other studies. Two
recordings were used, one with spoken language in RP and one with GA. The criteria for
choosing these recordings were that they should be in in the appropriate accent and that the
speakers should be of the same sex. Also, attention was paid to the fact that they should be
comparable in terms of quality, speech rate, and volume. The RP speech was selected from
Brulard, Carr, and Durand (2015) and the GA from Hughes, Trudgill and Watt (2012). Since
the topics of conversation in these recordings could potentially influence the responses of the
participant, shorter excerpts were selected to increase the neutrality of the topic. The RP
recording chosen is 29 seconds long, and the GA recording is 30 seconds. Both recordings
have female speakers.
The target population consisted at students of Stockholm University with English as their L2.
According to Bolton and Kuteeva, Stockholm University is “one of the largest universities in
Sweden, with more than 50,000 undergraduate and Master’s students, of which around 24,000
were full-time students and 1800 research degree students” (2012, p. 433). This and the fact
that the university is in Sweden´s capital city arguably makes it a good place to conduct this
11
research. The data was collected in the campus library because it attracts students from
different faculties.
Before the data was collected, the research instruments were tested. Dornyei argues that one
should always pilot the research instruments before launching a project. This is done to ensure
a high-quality outcome within a specific context (2016, p. 75). This was done on 5 individuals
that match the target population of this study. The data collected from this pilot study showed
two alarming concerns. Firstly, two participants felt that it was difficult to agree or disagree
with the statement about whether they felt that they could identify with the speaker. This was
because the statement was difficult to understand. The statement about identification was not
removed before collecting the data since an option for “I am not sure” is available for the
participant. Secondly, a slight humming was reported to be disturbing in the background of
the GA recording. Therefore, the GA recording did not match the criteria of being comparable
to the RP recording in terms of sound quality. The humming reported in the GA recording
was reduced to a great extent by the supervisor of this project, thus eliminating the issue.
The collection of the data was conducted in the following manner: students in Stockholm
university main library were arbitrarily asked to participate in the study and selected if they
matched the criteria for this study and agreed to participate. They were then led to one of the
group rooms in the library where the test was conducted. Firstly, the participants were asked
to answer the background information sheet. Secondly, in accordance with the verbal guise
method, students were first exposed to either the RP or GA recording twice in a row. Whether
the GA or RP recording was played first alternated between each participant. Carrie argues
that listening to a recording of this length twice is sufficient exposure for participants to be
able to evaluate the speaker (2016, p. 435). After being exposed to the first recording twice,
students were asked to respond to the various statements in the questionnaire. After
responding to these statements, this procedure was repeated, but now with the unheard
recording. Lastly, participants were asked to read and sign a consent form.
Data was collected from 50 participants. Dörnyei argues that sample sizes should be thought
of as the larger, the better (2016, p. 99). However, the rule of thumb seems to be a sample size
of at least 30 in quantitative studies in order to achieve normal distribution (Dörnyei, 2016,
pp. 99-100). A sample size of 50 was chosen since it matched this criterion and was
considered to be feasible given the timeframe of this study. While it is usually advisable to
have sample strictly balanced in terms of gender, the present study opted for a quota-based
12
distribution of 20 males and 30 females. This choice was made to better reflect the gender
distribution of students as reported by Stockholm University (Sifferfakta, 2017)
The data mostly consists of responses to the various statement about the speaker in the
recordings. These responses are either “I am not sure” or to what degree participants agree
with a certain statement on a 7-point scale. Also, some data consists of responses to the
background questions posed in the questionnaire. In the next section, I will describe how this
data was analyzed.
4.2 Analysis
The analysis of the data is fairly simple. Responses to each statement designed to measure the
affective and conative component of attitude generate a score according to the form described
by Dornyei, i.e. “’strongly agree’ = 7 … ‘strongly disagree’ = 1” (2016, p. 105). Data on the
cognitive component generate a score according to the same form as the Likert scales, even
though it is a semantic differential scale, i.e. ‘responsible’ = 7… ‘not responsible’ = 1. The
response “I am not sure” is not counted. The mean score calculated from the responses of a
statement either reflect a part of how the investigated population thinks, feels or perceive as
behaving in regard to the investigated accent. These scores are then compared to find
differences in the students’ attitudes to RP and GA. This type of score system is used in Carrie
(2016) and using it in the present study will therefore increase the comparability of the
findings.
5.0 Results and Discussion
The results and discussion presented in this section are subdivided into four different sections.
These sections are Cognitive evaluation, Affective evaluation, Conative responses, and
Further discussion. In the first three sections, results are presented, but also discussed in the
context of studies conducted in Sweden. These studies are conducted in a similar context, but
to a large degree in a differing manner, rendering their findings difficult to translate to the
findings of the present study. In the last section, the most important findings are summarized
and discussed in the context of Carrie (2016). This study is conducted in a different context
but is similar in terms of theoretical approach and definition of the object of study. Therefore,
the findings in her study translate well to the findings of the present study.
13
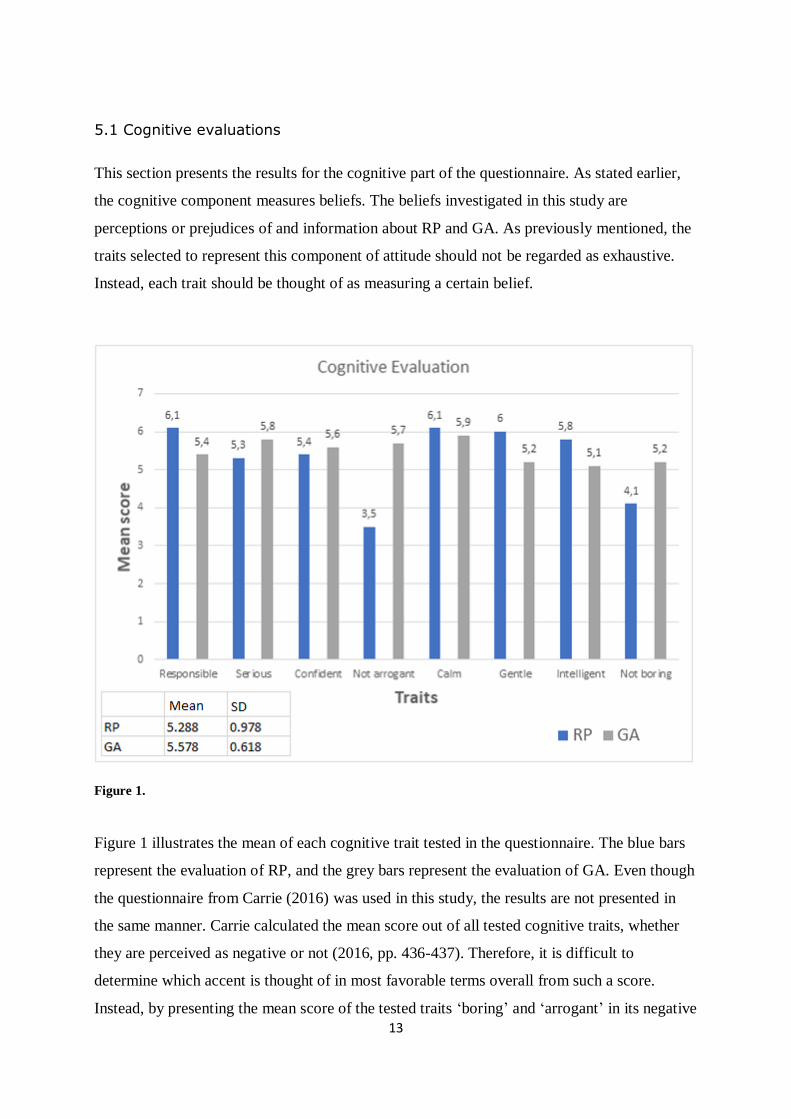
5.1 Cognitive evaluations
This section presents the results for the cognitive part of the questionnaire. As stated earlier,
the cognitive component measures beliefs. The beliefs investigated in this study are
perceptions or prejudices of and information about RP and GA. As previously mentioned, the
traits selected to represent this component of attitude should not be regarded as exhaustive.
Instead, each trait should be thought of as measuring a certain belief.
Figure 1.
Figure 1 illustrates the mean of each cognitive trait tested in the questionnaire. The blue bars
represent the evaluation of RP, and the grey bars represent the evaluation of GA. Even though
the questionnaire from Carrie (2016) was used in this study, the results are not presented in
the same manner. Carrie calculated the mean score out of all tested cognitive traits, whether
they are perceived as negative or not (2016, pp. 436-437). Therefore, it is difficult to
determine which accent is thought of in most favorable terms overall from such a score.
Instead, by presenting the mean score of the tested traits ‘boring’ and ‘arrogant’ in its negative
14
form (not arrogant and not boring) as in figure 1, the mean score of all the tested cognitive
traits better reflect which accent is most favored overall in terms of students’ cognitive part of
attitude. Also, Figure 1 provides the mean and standard deviation for all cognitive traits tested
combined.
The mean of all tested cognitive traits is 5.578 for the GA accent and 5.288 for the RP accent.
This result suggests that Swedish university students with English as their L2 think of GA in
slightly more positive terms than RP. Furthermore, the standard deviation is 0.978 RP and
0.618 for GA. The standard deviation reflects a difference in spread between the evaluated
traits related to each accent. As shown in Figure 1, the mean score of the traits responsible
(6.1), calm (6.1) and gentle (6.0) was more than any mean score generated by the cognitive
evaluation of GA. However, some mean scores that reflect the cognitive evaluation of RP
were also far below that of any mean score that reflects the cognitive evaluation of GA, these
being the traits ‘not arrogant’ (3.5) and ‘not boring’ (4.1).
As Figure one illustrates, there is a difference to some degree in every investigated trait. Since
little research has been done on Swedes´ attitude to RP and GA that translates well into the
findings of the present study, it is difficult to say whether the differences found in the present
study are expected or surprising. Even so, there is some previous research done in Sweden
that is comparable. Sahlström (2005) tested several cognitive traits that were to a large degree
different from what has been tested in this study. However, she did test arrogance,
intelligence, and confidence. Her study showed that individuals who spoke RP were believed
to be much more arrogant than individuals who spoke GA (Sahlström, 2005, pp. 30-31).
Sahlström´s findings correspond to the findings of this study. As shown in figure 1, there
seems to be an average 2.2-point difference in arrogance between RP and GA, where RP is
believed to sound more arrogant. She found no difference regarding the trait of intelligence
(Sahlström, 2005, pp. 30-31). The findings of the present study found a 0.7-point difference
where the RP speaker was believed to be more intelligent than the GA speaker. Also,
Sahlström found a difference in confidence, where RP was thought to sound more confident
than GA (Sahlström, 2005, pp. 30-31), while the present study found no difference. As
mentioned in the background section, Modiano (2002) suggests that attitudes towards RP and
GA can fluctuate a great deal over nine years. Since there are 13 years between the present
study and that of Sahlström, a difference in findings is not surprising. Also, the age and
geographical diversity of university students are arguably quite different from that of upper
15
secondary students. Despite this distance in population, the findings of Sahlström do support a
prejudice towards the RP accent as sounding more arrogant than GA.
Some other notable differences in beliefs about RP and GA are that RP speakers are
considered to be more responsible (0.7-point difference) and gentler (0.8-point difference)
than GA. Also, GA speakers were thought of as less boring than RP speakers with a 1.1-point
difference. However, there is no previous research done on Swedish students that can support
these findings.
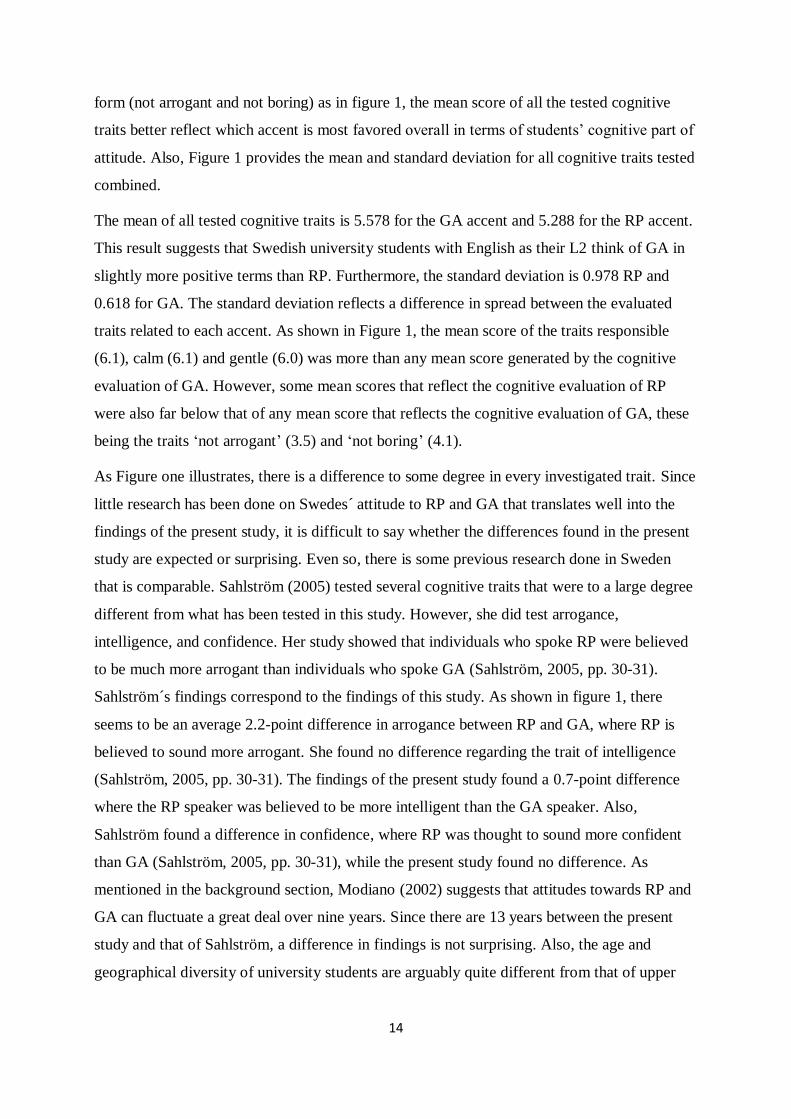
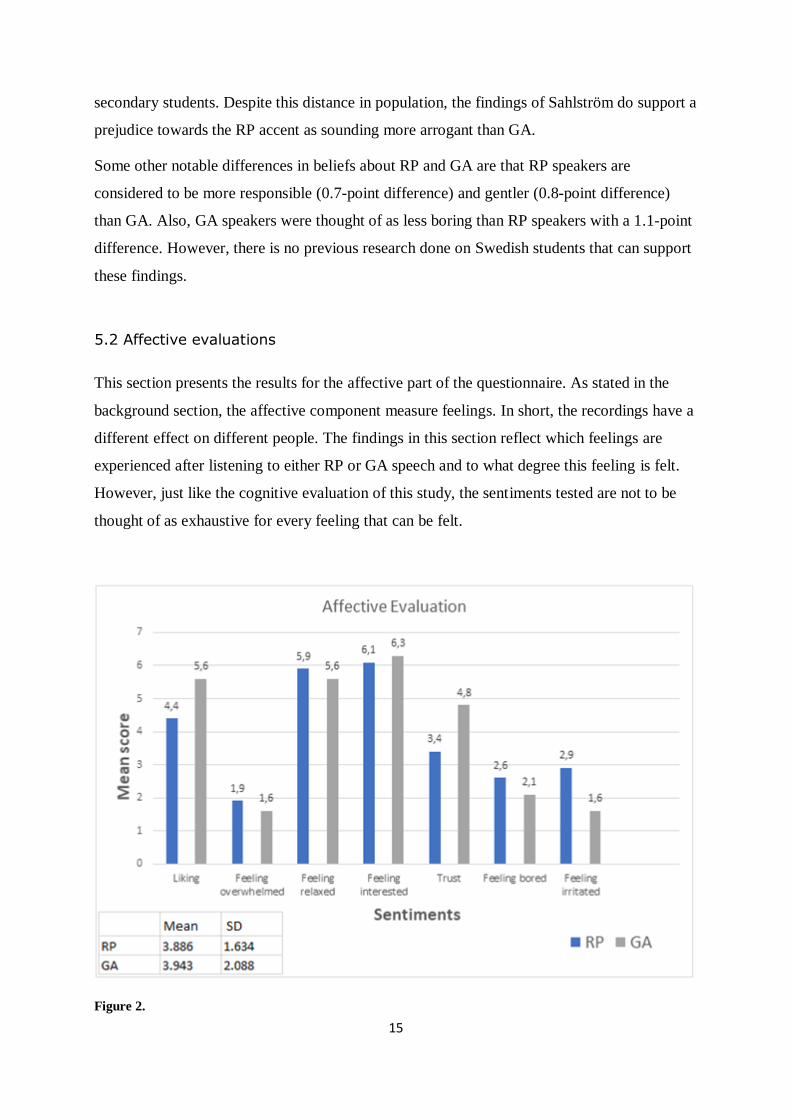
5.2 Affective evaluations
This section presents the results for the affective part of the questionnaire. As stated in the
background section, the affective component measure feelings. In short, the recordings have a
different effect on different people. The findings in this section reflect which feelings are
experienced after listening to either RP or GA speech and to what degree this feeling is felt.
However, just like the cognitive evaluation of this study, the sentiments tested are not to be
thought of as exhaustive for every feeling that can be felt.
Figure 2.
16
Figure 2 illustrates the mean of each affective sentiment that was tested in the questionnaire.
As in Figure 1, the blue bars represent the evaluation of RP, and the grey bars represent the
evaluation of GA. Also, Figure 1 provides the mean and standard deviation for all affective
sentiments tested combined. The mean score for RP is 3.886 and for GA 3.943. Furthermore,
the standard deviation is 1.634 for RP and 2.088 for GA.
As shown in figure 2, the result from the question about whether students felt that they could
identify with the speaker was removed. As discussed in the background section, different
sentiments are meaningful to different populations. The sentiment of identity seems not to be
meaningful in a Swedish context. Seventeen participants chose the option of responding “I am
not sure” to this question. This finding could suggest that they have no formed attitude
regarding this specific statement. However, since some of the participants of the pilot study
stated that they found the sentiment difficult to understand, it is arguably more likely that this
is the case.
The mean of all these sentiment ratings tells us little about any preference for either GA or
RP. The tested sentiments that together generate this score are a mix of positive and negative
ones, such as ‘Liking’ and ‘Feeling bored’. For instance, if most of the investigated
population express liking for an accent, it is unlikely that they would express that they feel
bored by it. Therefore, this mix is also the cause of the relatively high standard deviation,
since data become more spread out.
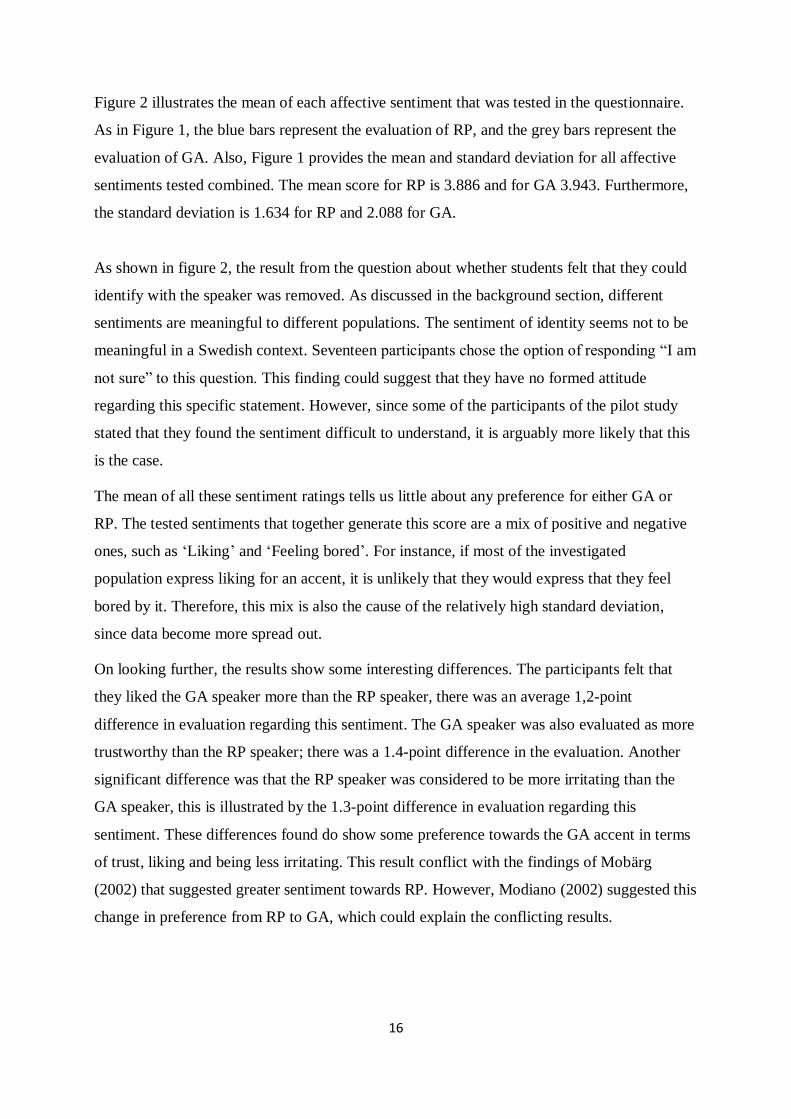
On looking further, the results show some interesting differences. The participants felt that
they liked the GA speaker more than the RP speaker, there was an average 1,2-point
difference in evaluation regarding this sentiment. The GA speaker was also evaluated as more
trustworthy than the RP speaker; there was a 1.4-point difference in the evaluation. Another
significant difference was that the RP speaker was considered to be more irritating than the
GA speaker, this is illustrated by the 1.3-point difference in evaluation regarding this
sentiment. These differences found do show some preference towards the GA accent in terms
of trust, liking and being less irritating. This result conflict with the findings of Mobärg
(2002) that suggested greater sentiment towards RP. However, Modiano (2002) suggested this
change in preference from RP to GA, which could explain the conflicting results.
17
5.3 Conative responses
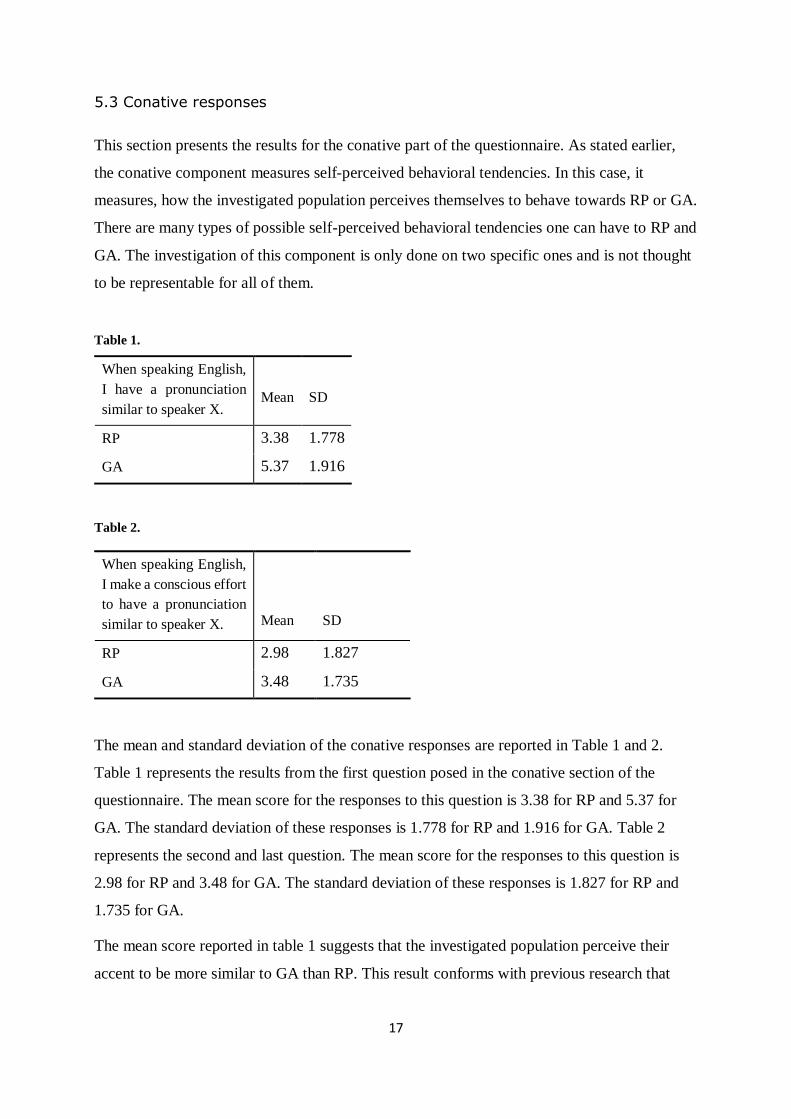
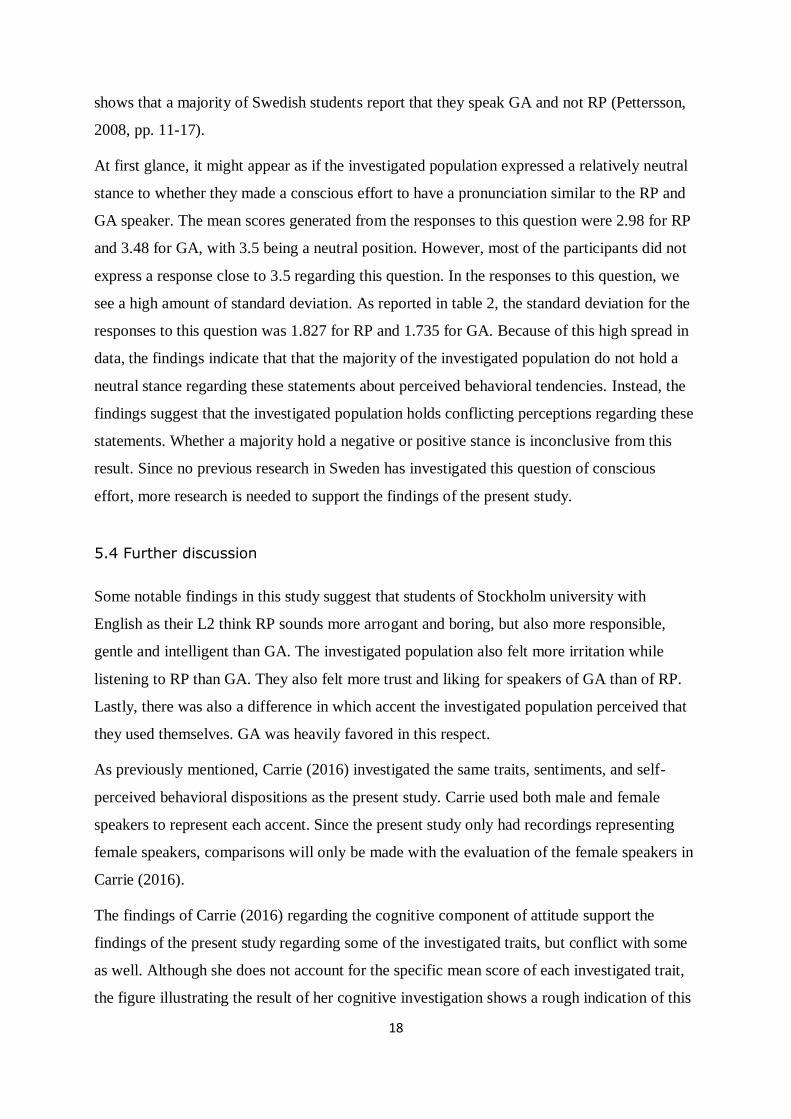
This section presents the results for the conative part of the questionnaire. As stated earlier,
the conative component measures self-perceived behavioral tendencies. In this case, it
measures, how the investigated population perceives themselves to behave towards RP or GA.
There are many types of possible self-perceived behavioral tendencies one can have to RP and
GA. The investigation of this component is only done on two specific ones and is not thought
to be representable for all of them.
Table 1.
When speaking English,
I have a pronunciation
similar to speaker X.
Mean
SD
RP 3.38 1.778
GA 5.37 1.916
Table 2.
When speaking English,
I make a conscious effort
to have a pronunciation
similar to speaker X.
Mean
SD
RP 2.98 1.827
GA 3.48 1.735
The mean and standard deviation of the conative responses are reported in Table 1 and 2.
Table 1 represents the results from the first question posed in the conative section of the
questionnaire. The mean score for the responses to this question is 3.38 for RP and 5.37 for
GA. The standard deviation of these responses is 1.778 for RP and 1.916 for GA. Table 2
represents the second and last question. The mean score for the responses to this question is
2.98 for RP and 3.48 for GA. The standard deviation of these responses is 1.827 for RP and
1.735 for GA.
The mean score reported in table 1 suggests that the investigated population perceive their
accent to be more similar to GA than RP. This result conforms with previous research that
18
shows that a majority of Swedish students report that they speak GA and not RP (Pettersson,
2008, pp. 11-17).
At first glance, it might appear as if the investigated population expressed a relatively neutral
stance to whether they made a conscious effort to have a pronunciation similar to the RP and
GA speaker. The mean scores generated from the responses to this question were 2.98 for RP
and 3.48 for GA, with 3.5 being a neutral position. However, most of the participants did not
express a response close to 3.5 regarding this question. In the responses to this question, we
see a high amount of standard deviation. As reported in table 2, the standard deviation for the
responses to this question was 1.827 for RP and 1.735 for GA. Because of this high spread in
data, the findings indicate that that the majority of the investigated population do not hold a
neutral stance regarding these statements about perceived behavioral tendencies. Instead, the
findings suggest that the investigated population holds conflicting perceptions regarding these
statements. Whether a majority hold a negative or positive stance is inconclusive from this
result. Since no previous research in Sweden has investigated this question of conscious
effort, more research is needed to support the findings of the present study.
5.4 Further discussion
Some notable findings in this study suggest that students of Stockholm university with
English as their L2 think RP sounds more arrogant and boring, but also more responsible,
gentle and intelligent than GA. The investigated population also felt more irritation while
listening to RP than GA. They also felt more trust and liking for speakers of GA than of RP.
Lastly, there was also a difference in which accent the investigated population perceived that
they used themselves. GA was heavily favored in this respect.
As previously mentioned, Carrie (2016) investigated the same traits, sentiments, and self-
perceived behavioral dispositions as the present study. Carrie used both male and female
speakers to represent each accent. Since the present study only had recordings representing
female speakers, comparisons will only be made with the evaluation of the female speakers in
Carrie (2016).
The findings of Carrie (2016) regarding the cognitive component of attitude support the
findings of the present study regarding some of the investigated traits, but conflict with some
as well. Although she does not account for the specific mean score of each investigated trait,
the figure illustrating the result of her cognitive investigation shows a rough indication of this
19
(Carrie, 2016, p. 337). Her findings suggest that both RP and GA is thought to be arrogant and
boring but did not find evidence that one accent is thought of as more boring or arrogant than
another (Carrie, 2016, p. 337). In contrast to this, the present study found that the investigated
population did not think of these accents as boring or arrogant, but still thought RP sounded
more arrogant than GA. Also, the present study found that RP was believed to sound more
responsible, gentle and intelligent. Although Carrie (2016) did not find any difference in
belief that RP sounded more responsible, she did find that RP was thought to sound gentler
and more intelligent than GA (p. 337).
As for the affective component of attitude, the present study found that not much irritation
was felt when listening to RP or GA, but that more irritation was felt when listening to RP
than GA. This finding was not supported by Carrie (2016) who found that a high degree of
irritation was reported when listening to both accents, more precisely, a mean score of 6 out
of 7 was generated by the responses to this sentiment (p. 440). With 7 reflecting a mean of
‘Strongly agree’, this is arguably a strong reaction.
Regarding the conative component of attitude, the present study found that the investigated
population perceived themselves to use GA to a greater extent than RP. Carrie (2016) found
no such difference (p. 441).
In conclusion, the most notable findings of the present study contrast with those found by
Carrie (2016). The only notable findings of the present study that are supported by Carrie
(2016) is that RP was thought to sound gentler and more intelligent than GA. Furthermore, the
overall results of the present study arguably conflict with the previously mentioned
generalization that Europeans prefer RP to GA. However, as we have seen, language attitude
research can tell us more than which accent is preferred or not preferred. Although RP was
not preferred overall, the findings of the present study suggest that RP was preferred
regarding some tested statements. For instance, the investigated population felt slightly more
relaxed when listening to RP than GA. Also, RP was thought to sound more responsible,
calm, gentle and intelligent. These findings show the importance of investigating attitudes
through the 3-component model as has been done in the present study. If the accents had been
studied with a pro/con or a mono-component definition, the findings of the present study
would have been much more limited.
20
6.0 Conclusion
The present study has been an investigation of the differences in attitude that Swedish
university students hold towards RP and GA. The purpose was to broaden the scientific
community´s understanding of this population regarding their attitudes to the accents in
question. This was successful. By using the 3-component model in the investigation of these
attitudes, the findings of the present study are in greater detail compared to the findings of
previous studies on the topic. The investigation conducted was on students at Stockholm
University. The position of this university as one of the largest in Sweden and that it is in the
capital city increase the representativeness of the findings. However, it is questionable
whether these results are representative for all of Sweden. The lack of nationwide
representativeness is partly due to the extent of this study, but partly since most of the
previous research that exists on this topic does not translate well to the findings of the present
study. Therefore, any strong nationwide generalizations are not possible to make from these
findings. However, some findings could be supported by previous research, such as the
findings that RP is thought to sound gentler, more intelligent but also more arrogant.
Furthermore, the finding that more students perceive themselves to speak GA than RP was in
accordance with previous research in a Swedish context.
Some notable findings could not be supported by previous research, but are of value to
resolve educational issues, so should be further investigated. As mentioned in the background
section of the present study, negative comments from students of Stockholm University
regarding the English accents of their teachers prevail across different faculties and
disciplines. Finding which accents are suitable or even optimal for teaching would, therefore,
be beneficial for the students that attend this university. Essentially, some of the findings of
the present study could be regarded as valuable in finding such an accent. However, further
investigation into the various statements tested in this study is needed to strengthen the
findings. Since English is used while learning at various levels of education, more research is
needed outside the scope of university students as well. Also, investigations comparing non-
native accents with RP or GA should be conducted. Such research would likely show even
greater differences and thus further illustrate the impact the use of various accents can have in
an educational context.
21
References
Agheyisi, R., & Fishman, J. A. (1970). Language Attitude Studies: A Brief Survey of Methodological
Approaches. Anthropological Linguistics, 12(5), 137-157.
Alexander, C. Norman Jr. (1966). Attitude as a Scientific Concept. Social Forces, 45(2). 278-81.
Axelsson, M.W. (2002). “Refined” or “Relaxed” English Pronunciation: Usage and Attitudes among
Swedish University Students. In M. Modiano (Ed), Studies in Mid-Atlantic English (pp. 132-146).
Gävle : Högskolan i Gävle.
Bain, R. (1928). An Attitude on Attitude Research. American Journal of Sociology, 33(6), 940-57.
Brulard, I, Carr, P. & Durand, J. (Eds.). (2015). La Prononciation de l’anglais contemporain dans le
monde: Variation et structure. Toulouse: Presses Universitaires du Midi.
Carrie, E. (2016). ‘British is professional, American is urban’: Attitudes towards English reference accents in Spain. International Journal of Applied Linguistics, 27(2), 427-447.
doi:10.1111/ijal.12139
Dornyei, Z. (2016). Research methods in applied linguistics: Quantitative, qualitative, and mixed
methodologies. Oxford: Oxford University Press.
Gal, S. (2016). Labov in anthropology. Journal of sociolinguistics, 20(4), 453-463.
Garett, P. (2010). Attitudes to Language. Cambridge: Cambridge University Press.
Hughes, A., Trudgill, P. & Watt, D.J.L. (2012). English accents & dialects: an introduction to social
and regional varieties of English in the British Isles. (5th ed.) London: Hodder Education.
Kingsley Bolton & Maria Kuteeva. (2012) English as an academic language at a Swedish university:
parallel language use and the ‘threat’ of English. Journal of Multilingual and Multicultural
Development, 33:5, 429-447.
McKenzie, R & Carrie, E. (2018), Implicit–explicit attitudinal discrepancy and the investigation of
language attitude change in progress. Journal of Multilingual and Multicultural Development, 39(9),
830-844.
McKenzie, R. (2015). UK university students’ folk perceptions of spoken variation in English: the role
of explicit and implicit attitudes. International Journal of the Sociology of Language, 2015(236),
31-53.
McKenzie, R. M. (2010) The social psychology of English as a global language: attitudes, awareness
and identity in the Japanese context. London: Springer.
Mobärg, M. (2002). RP or GA? On Swedish School Students Choice of English Pronunciation. In M.
Modiano (Ed), Studies in Mid-Atlantic English (pp. 119-131). Gävle : Högskolan i Gävle.
Modiano, M. (1993). American English and higher education in Sweden. American studies in
Scandinavia, 25(1), 37-47.
Pettersson, J. (2008). British, American or Mid-Atlantic English: What accent do Swedish learners use
and where do they get their influences from?. Karlstad: Karlstads universitet.
Sahlström, C. (2005). Upper Secondary Students’ Assessment of Four Women Speaking Four Different
Varieties of English. Karlstad: Karlstads universitet.
Stockholm University. (2017). Sifferfakta. Retrieved December 5, 2018, from https://www.su.se/om-
oss/fakta/sifferfakta

22
Söderlund, M. & Modiano, M. (2002). Swedish Upper Secondary School Students and their Attitudes
Towards AmE, BrE and Mid-Atlantic English. In M. Modiano (Ed), Studies in Mid-Atlantic English
(pp. 147-171). Gävle : Högskolan i Gävle.
Zahn. C. J & Hopper. R. (1985) Measuring Language Attitudes: The Speech Evaluation Instrument.
Journal of Language and Social Psychology, 4(2), 113-123.
23
Appendix 1
Background information
Age __________
Gender ________________________
How long have you studied at the level of university? ___________________________
What have you studied/what do you study at university level?
___________________________________________________________________________
Is Swedish your first language? Yes □ No □
Are you a Swedish citizen? Yes □ No □
Have you lived in an English-speaking country? Yes □ No □
If yes, which one/ones? ________________________________________________________
Have you attended an English-speaking school before your university studies?
Yes □ No □
24
Part one
responsible
not responsible I'm not sure
I think Speaker One sounds ❍ ❍ ❍ ❍ ❍ ❍ ❍ ❍
not serious
serious I'm not sure
I think Speaker One sounds ❍ ❍ ❍ ❍ ❍ ❍ ❍ ❍
confident
not confident I'm not sure
I think Speaker One sounds ❍ ❍ ❍ ❍ ❍ ❍ ❍ ❍
not arrogant
arrogant I'm not sure
I think Speaker One sounds ❍ ❍ ❍ ❍ ❍ ❍ ❍ ❍
calm
not calm I'm not sure
I think Speaker One sounds ❍ ❍ ❍ ❍ ❍ ❍ ❍ ❍
not gentle
gentle I'm not sure
I think Speaker One sounds ❍ ❍ ❍ ❍ ❍ ❍ ❍ ❍
25
kind
not kind
I'm not sure
I think Speaker One sounds ❍ ❍ ❍ ❍ ❍ ❍ ❍ ❍
not intelligent
intelligent I'm not sure
I think Speaker One sounds ❍ ❍ ❍ ❍ ❍ ❍ ❍ ❍
boring
not boring I'm not sure
I think Speaker One sounds ❍ ❍ ❍ ❍ ❍ ❍ ❍ ❍
When I listen to Speaker One, I feel…
strongly agree
strongly disagree I'm not sure
that I like him/her ❍ ❍ ❍ ❍ ❍ ❍ ❍ ❍
that I trust him/her ❍ ❍ ❍ ❍ ❍ ❍ ❍ ❍
bored ❍ ❍ ❍ ❍ ❍ ❍ ❍ ❍
that I can identify with him/her ❍ ❍ ❍ ❍ ❍ ❍ ❍ ❍
26
When I listen to Speaker One, I feel…
relaxed ❍ ❍ ❍ ❍ ❍ ❍ ❍ ❍
interested ❍ ❍ ❍ ❍ ❍ ❍ ❍ ❍
overwhelmed ❍ ❍ ❍ ❍ ❍ ❍ ❍ ❍
irritated ❍ ❍ ❍ ❍ ❍ ❍ ❍ ❍
When speaking in English, I have a pronunciation similar to Speaker One.
certainly false
certainly true
❍ ❍ ❍ ❍ ❍ ❍ ❍
When speaking in English, I make a conscious effort to have a pronunciation similar to Speaker One.
certainly true
certainly false
❍ ❍ ❍ ❍ ❍ ❍ ❍
27
Part two
responsible
not responsible I'm not sure
I think Speaker One sounds ❍ ❍ ❍ ❍ ❍ ❍ ❍ ❍
not serious
serious I'm not sure
I think Speaker One sounds ❍ ❍ ❍ ❍ ❍ ❍ ❍ ❍
confident
not confident I'm not sure
I think Speaker One sounds ❍ ❍ ❍ ❍ ❍ ❍ ❍ ❍
not arrogant
arrogant I'm not sure
I think Speaker One sounds ❍ ❍ ❍ ❍ ❍ ❍ ❍ ❍
calm
not calm I'm not sure
I think Speaker One sounds ❍ ❍ ❍ ❍ ❍ ❍ ❍ ❍
not gentle
gentle
I'm not sure
28
I think Speaker One sounds ❍ ❍ ❍ ❍ ❍ ❍ ❍ ❍
kind
not kind I'm not sure
I think Speaker One sounds ❍ ❍ ❍ ❍ ❍ ❍ ❍ ❍
not intelligent
intelligent I'm not sure
I think Speaker One sounds ❍ ❍ ❍ ❍ ❍ ❍ ❍ ❍
boring
not boring I'm not sure
I think Speaker One sounds ❍ ❍ ❍ ❍ ❍ ❍ ❍ ❍
When I listen to Speaker One, I feel…
strongly agree
strongly disagree I'm not sure
that I like him/her ❍ ❍ ❍ ❍ ❍ ❍ ❍ ❍
that I trust him/her ❍ ❍ ❍ ❍ ❍ ❍ ❍ ❍
bored ❍ ❍ ❍ ❍ ❍ ❍ ❍ ❍
that I can identify with him/her ❍ ❍ ❍ ❍ ❍ ❍ ❍ ❍
29
When I listen to Speaker One, I feel…
relaxed ❍ ❍ ❍ ❍ ❍ ❍ ❍ ❍
interested ❍ ❍ ❍ ❍ ❍ ❍ ❍ ❍
overwhelmed ❍ ❍ ❍ ❍ ❍ ❍ ❍ ❍
irritated ❍ ❍ ❍ ❍ ❍ ❍ ❍ ❍
When speaking in English, I have a pronunciation similar to Speaker One.
certainly false
certainly true
❍ ❍ ❍ ❍ ❍ ❍ ❍
When speaking in English, I make a conscious effort to have a pronunciation similar to Speaker One.
certainly true
certainly false
❍ ❍ ❍ ❍ ❍ ❍ ❍
Information om deltagande i forskarstudie om skriftlig produktion i engelska, hösttermin 2018
30
Jag heter Robert Vidén och är student vid Stockholms universitet. Just nu håller jag på med en studie om
svenska universitetsstudenters attityder till engelska accenter. Detta brev innehåller information om min studie
och vad det innebär att delta.
Studiens syfte och genomförande
Studien handlar attityder till engelska accenter. Du har nu fått lyssna på inspelade konversationer som är tänka
att reflektera dessa dialekter. De svar du angivit i relation till dessa inspelningar kommer att analyseras för att
vi ska kunna bilda en uppfattning om din attityd till dessa accenter.
Etik och sekretess
Studien följer noga de etiska föreskrifter som gäller för god forskningssed. Allt insamlat material behandlas
med största aktsamhet och förvaras på ett säkert sätt. Materialet kommer bara att användas i forskningssyfte
och samtliga medverkande elever och lärare, samt skola, kommer att vara anonyma i de sammanhang där
studien presenteras och publiceras. Om du har frågor eller önskar mer information är du välkommen att
kontakta mig på mejl.
Student Handledare
[email protected] [email protected]
Medgivande
Genom att kryssa för ”Ja” och skriva under detta dokument du ditt medgivande till att informationen får
användas till denna studie enligt ovanstående beskrivning. Ett ”Nej” innebär att informationen inte används.
Ja, jag tillåter att informationen jag lämnat får användas i denna studie.
Nej, jag tillåter inte att informationen jag lämnat får användas i denna studie.
_____________________________________ namn
_____________________________________ underskrift
_____________________________________ Ort och datum


Stockholms universitet
106 91 Stockholm
Telefon: 08–16 20 00
www.su.se