Embed Size (px)
Citation preview
Arla Kytölä
Differences in images and attitudes created by fashion branding between Spain and Finland Case study: Zara
Helsinki Metropolia University of Applied Sciences
Bachelor of Business and Administration
European Management
Thesis
03 May 2013
Abstract
Author(s) Title Number of Pages Date
Arla Kytölä Images and attitudes created by branding between Spain and Finland 40 pages + 4 Appendices 03 May 13
Degree Bachelor of Business and Administration
Degree Programme European Management
Specialisation option European Management
Instructor(s)
Krystal Sirota, lecturer
The research problem of the thesis was to study the difference between images and atti-tudes created by fashion brands in Spain and Finland. The research problem was ap-proached in the form of a case study, and using Zara as the brand. The research question was: “What kind of images and attitudes has Zara’s brand created in Finland and Spain?” A quantitative survey was used to gather primary data, and books, e-journals and articles were used for secondary data. The findings from the study suggested that there are dif-ferences in fashion consumption of Finnish and Spanish consumers. The main findings were the slight differences in money spending habits, as the Spanish consumers spend a bit more money on fashion on a monthly basis than Finnish consumers do. Additionally, the Spanish consumers were found to value Zara more than the Finnish consumers. How-ever, there was no connection between Spanish respondents’ greater value of Zara and Zara being a Spanish brand. Similarly, there was no consumer nationalism towards Zara found from the part of Finnish respondents. The survey found out that the main reasons for respondents from both countries to visit Zara were price, quality, selection and trendy designs.
Keywords Fashion, branding, consumer behaviour, Finland, Spain, Zara
Table of contents
1 Introduction 1
2 Branding 2
2.1 Definition 2
2.2 Emotional and functional domains of brand 2
2.3 Emotions and brands affecting consumer choice 3
2.4 Brand equity 4
2.5 Customer-Based Brand Equity 6
2.6 Brand awareness, salience, attitude & loyalty 8
2.7 Lovemarks 9
2.8 Brands in the Fashion industry 11
3 Consumer behavior 11
3.1 Definition 11
3.2 Classical model of consumer choice 12
3.3 Advertising 15
4 The impact of culture in branding and consumer behavior 15
4.1 Masculine, feminine, collective and individual cultures 15
4.2 Culture and consumer behavior 17
4.3 Brand personality 18
5 Methodology 18
5.1 Data collection and sampling 19
5.2 Data analysis 21
5.3 Ethical issues and limitations of the research 22
6 Case study: Zara 22
6.1 Inditex Group 22
6.2 Zara 23
7 Analysis 27
7.1 Demographics 27
7.2 Fashion consumption habits 28
7.3 Attitudes towards Zara 30
7.4 Zara and its competitors 32
8 Conclusions and recommendations for further studies 34
8.1 Conclusions 34
8.2 Recommendations for further studies 37
References 38
Appendices
Appendix 1. Questionnaire in English
Appendix 2. Questionnaire translated into Finnish
Appendix 3. Questionnaire translated into Spanish
Appendix 4. Complete list of pie charts according to the survey
List of figures
Figure 1. Pyramid of CBBE. (Keller 2008: 136) 7
Figure 2.CBBE according to Percy and Elliott (2007: 86-87) 8
Figure 3. Differences between a brand and a lovemark. (Roberts 2004: 70) 10
Figure 4. The front page of Lovemarks website. (Lovemarks 2013a) 10
Figure 5 Classical Model of Consumer Behavior. (Elliot & Percy 2007: 6) 12
Figure 6 Finnish and Spanish cultures. (De Mooji 2005: 116) 16
Figure 7 Zara's signature shopping bag. (Kytölä 2013) 24
Figure 8. Zara shop windows at Aleksanterinkatu. (Kytölä 2013) 25
Figure 9. Zara's Lovemark profile with comments. (Lovemark 2013e) 26
Figure 10. Age breakdown of Finnish respondents. 27
Figure 11. Age breakdown of Spanish respondents. 28
Figure 12. Finnish respondents' monthly average consumption on fashion. 29
Figure 13. Spanish respondents' monthly average consumption on fashion. 29
Figure 14. Zara and its competitors (Finland) 32
Figure 15. Zara and its competitors (Spain) 33
Figure 16. Why would Finnish respondents choose Zara. 33
Figure 17. Why would Spanish respondents choose Zara. 34
Figure 18. Core brand associations of Zara. (Keller 2008: 121) 36
1
1 Introduction
The idea of research was established when the writer started thinking about the brand-
ing differences between Finland and Spain. There are Spanish clothing store chains in
Finland and an increasing number of Finnish clothing brands sold in Spain, yet the
branding in retail fashion industry between the two countries has not been studied.
Calvo Dopico and Clavo Porral (2012) have studied the brand equity in fashion mar-
kets, but the geographical focus of their study was on Northern Spain, whereas Hakala,
Svensson and Vincze studied brand equity and top-of-mind awareness comparing the
USA, Finland, France and Sweden.
The research problem of the thesis was to study the difference between images and
attitudes created by fashion brands in Spain and Finland. The research problem was
approached in the form of a case study, and using Zara as the brand. The exact re-
search question was: “What kind of images and attitudes has Zara’s brand created in
Finland and Spain?” The main research problem was the lack of detailed studies about
the branding attitudes and images between the two countries.
A quantitative survey was used as a research method to gather primary data, and
books, e-journals and articles were used to gather secondary data. During the research
some differences between the Finnish and Spanish consumers and their consumption
on fashion were found. The main differences were Spanish respondents’ slightly bigger
spending on fashion, and their more frequent visits to Zara. It was also discovered that
Spanish respondents valued Zara more, but according to survey there was no connec-
tion to Zara being a domestic mark for the Spanish. Similarly, no consumer nationalism
towards Zara was found amongst the Finnish respondents. According to the findings
from the survey, the main reasons for Finnish and Spanish respondents to choose Zara
were price, quality, the selection and the trendiness of their designs.
2
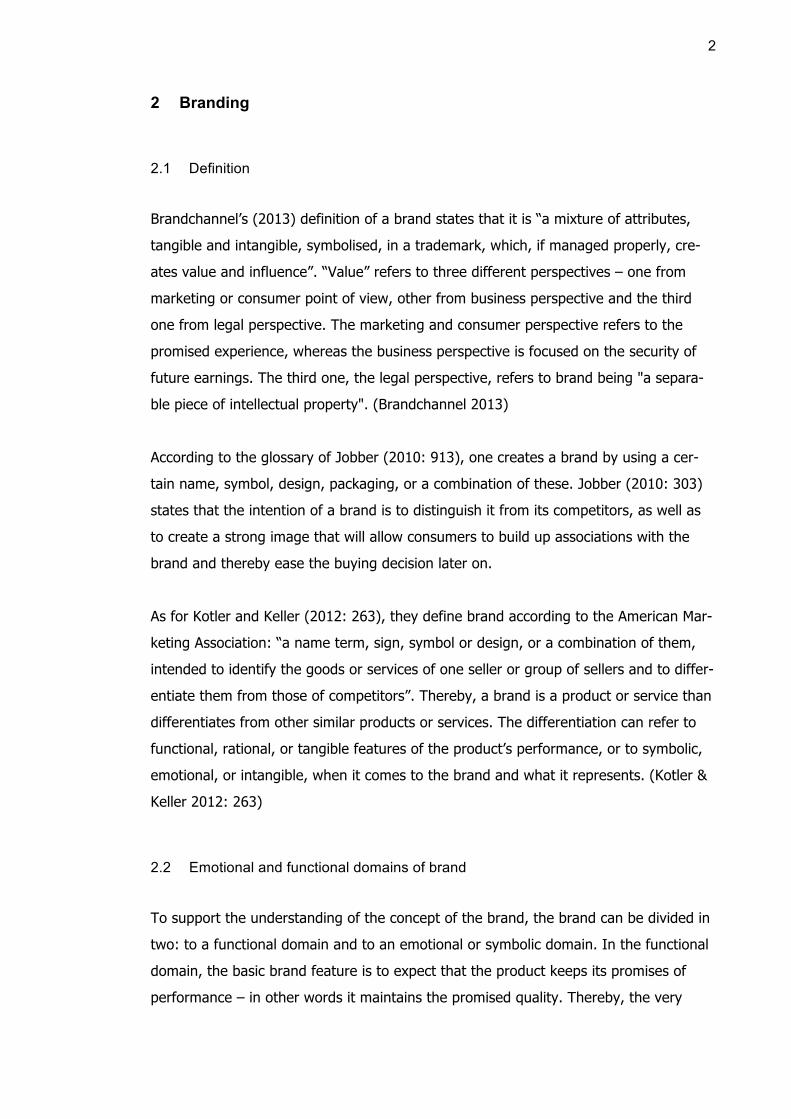
2 Branding
2.1 Definition
Brandchannel’s (2013) definition of a brand states that it is “a mixture of attributes,
tangible and intangible, symbolised, in a trademark, which, if managed properly, cre-
ates value and influence”. “Value” refers to three different perspectives – one from
marketing or consumer point of view, other from business perspective and the third
one from legal perspective. The marketing and consumer perspective refers to the
promised experience, whereas the business perspective is focused on the security of
future earnings. The third one, the legal perspective, refers to brand being "a separa-
ble piece of intellectual property". (Brandchannel 2013)
According to the glossary of Jobber (2010: 913), one creates a brand by using a cer-
tain name, symbol, design, packaging, or a combination of these. Jobber (2010: 303)
states that the intention of a brand is to distinguish it from its competitors, as well as
to create a strong image that will allow consumers to build up associations with the
brand and thereby ease the buying decision later on.
As for Kotler and Keller (2012: 263), they define brand according to the American Mar-
keting Association: “a name term, sign, symbol or design, or a combination of them,
intended to identify the goods or services of one seller or group of sellers and to differ-
entiate them from those of competitors”. Thereby, a brand is a product or service than
differentiates from other similar products or services. The differentiation can refer to
functional, rational, or tangible features of the product’s performance, or to symbolic,
emotional, or intangible, when it comes to the brand and what it represents. (Kotler &
Keller 2012: 263)
2.2 Emotional and functional domains of brand
To support the understanding of the concept of the brand, the brand can be divided in
two: to a functional domain and to an emotional or symbolic domain. In the functional
domain, the basic brand feature is to expect that the product keeps its promises of
performance – in other words it maintains the promised quality. Thereby, the very
3
basic consumer benefit is the brand replicating a simple satisfaction of a functional
need and thereby solving a problem the consumer has had. Additionally, the functional
domain enables the consumer to feel relieved, as the product brings the prime benefit
to them, and thereby provides the consumer with a level of certainty in the uncertain
world. In the long run, this makes the choice easy for the consumer, and eventually
evolves into habitual behavior, as buying something that has been found to work as
promised makes sense to the consumer. (Elliott & Percy 2007: 4)
For the easy choice to be triggered by the functional domain and to evolve into a safe
choice, one must develop a trust relationship with the brand. Once the trust relation-
ship with the brand has been developed, the functional domain has turned into an
emotional or symbolic domain. The more involved one is with the decision to purchase
something, the more the buying decision is driven by emotional processes. This leads
the consumer benefit turning into a safe choice. (Elliott & Percy 2007: 5)
2.3 Emotions and brands affecting consumer choice
There are six primary emotions, which are surprise, anger, fear, disgust, sadness, and
joy, and these primary emotions are independent of cultural considerations. (Ekman
1992 cited in Elliott & Percy 2007: 20) In addition to the primary emotions, there is a
list of other emotions that are activated by the associations made with the emotion and
experienced through experience. (cf. Damasio 1999 cited in Elliott and Percy 2007: 21)
According to the traditional models of consumer behavior, emotions are guided and
directed by cognition, whereas emotion is guided by behavior. Yet, as the acknowl-
edgement of low-involvement purchasing has increased, it has created concepts such
as the process of affect-referral. (Elliott & Percy 2007: 21) Affect referral process ena-
bles the consumer to remember the feelings they have experienced with a brand and
to associate those feelings with the brand. (Hoyer & McInnis 2008: 264) For example,
when a consumer comes across with McDonald’s name, he might be reminded of the
good memories he has experienced there and thereby decide to go and get a ham-
burger. In other words, the taken decision is actually prompted by the associated good
feelings rather than the product itself. Hoyer and McInnis (2008: 264) also point out
4
that affect is likely to be an important part of the decision process – especially, when
the buy is hedonic instead of functional.
Another idea against the traditional consumer behavior models was created by Zajonc
(1980 cited in Elliot & Percy 2007: 21) and suggested that emotion would play a cen-
tral role when it comes to developing preferences, and sometimes even come before
cognition rather than just being a separate processing system.
In addition to cognitive associations – such as features or benefits – a consumer will be
reminded of their emotional memories and feelings of a brand. Although positive emo-
tional memories will not be able to override any negative cognitive associations in deci-
sions related to brands, the emotional significance of a brand influences on the atten-
tion paid to the brand – also in the form of advertising. Moreover, advertising is able to
instruct consumers on how to feel about different products and services by “emotional-
izing” them. (Elliott & Percy 2007: 33)
Brand associations are important for marketers to study. They use core brand associa-
tions when hoping to collect information about the associations made with the brand.
Core brand associations refer to attributes and benefits of a brand that describe its 5 to
10 most important aspects. Brand associations can be studied by asking consumers to
draw a mind map of the brand or to list words that come into their mind when thinking
about the brand in question. Thereby, the marketers manage to gather information by
looking for the associations that come up most frequently. (Keller 2008: 121)
2.4 Brand equity
Brand equity signifies the value brought to the product by the brand and its name.
(Elliott & Percy 2007: 80-81) Brandchannel’s (2013) glossary defines brand equity as a
sum of all the qualities of a brand “drawn from all relevant stakeholders, that results in
personal commitment to and demand for the brand; these differentiating thoughts and
feelings make the brand valued and valuable.” Arvidsson (2006 cited in Hakala, Svens-
son & Vincze 2012) argues that the value of brand exists in its equity, and thereby the
brand equity is the key concept when it comes to the evaluation of the marketing per-
formance of an organization.
5
Thereby, today’s business world considers the brand equity and the ability to create
brands as a major dynamic power. (Hakala, Svensson & Vincze 2012) Brand equity can
be divided into two main perspectives: financial (also known as company-based) and
consumer-based brand equity. The financial brand equity is based on brand’s financial
value and focuses on the monetary value of the brand in terms of prices, market share
and profitability. The consumer-based brand equity refers to the value the consumers
have towards the brand. (Kotler & Keller 2006, Fetscherin 2010 and Myers 2003 cited
in Hakala, Svensson & Vincze 2012)
According to Elliot and Percy (2007: 84-86), brand equity arises from the consumer’s
awareness, which triggers the positive memories associated to the brand. The positive
associations create affection that the consumer starts feeling towards the trusted
brand. This affection can rarely be rationally explained. For example, many consumers
prefer either Coca-Cola or Pepsi and reason their preference by saying the taste of the
brand of their choice just simply is better. However, blind tastes often prove the
statement wrong and yet the consumers stick with the brand of their choice. That is all
due to the run of brand awareness leading to the formation of mental image of the
brand and ending up to building preferences and brand loyalty for the brand. (Elliott &
Percy 2007: 84-86)
The sense of familiarity the consumer feels towards the brand is the foundation of
brand awareness. When a consumer is familiar with a brand, they are more likely to
remember them while shopping than e.g. details of an advert informing them about a
new product of a different brand. Still, brand awareness is important only for inten-
tional brand purchases. When someone is buying a product and they are not interested
in the brands available (even though they might be familiar with the brands in ques-
tion), there is simply no brand equity for this consumer in the product category in
question. (Aaker 1998 and Zajonc 1968 cited in Elliott & Percy 2007: 86)
6
2.5 Customer-Based Brand Equity
Keller (2008: 48) emphasizes the importance of another model of viewing brand equi-
ty: the customer-based brand equity (CBBE), which studies the brand equity from the
approach of the consumer. Similarly to Elliott and Percy’s (2007) theory of brands and
emotions, Keller (2008) says that the power of brands rests upon the experiences of
the consumers in the form of what they have learned, felt, seen and heard about the
brand. Thereby, the consumers must have positive experiences with the brand in order
for the brand image to get linked to the positive feelings.
Positive customer-based brand equity can have far-reaching effects, as customers
might be more accepting towards the brand’s new products, increasing prices, and
withdrawal of advertising. They also might be more likely to go and look for the brand
from new distribution channels. A brand has reached positive customer-based brand
equity, when the customers are responding more positively to the brand’s product or
the way it is marketed than to those of an unidentified brand. Naturally, when the
brand has negative customer-based brand equity, the consumers’ reaction is exactly
the opposite and they respond less favorably to the product of the unpleasant brand
than to those of an unidentified competitor. (Keller 2008: 48)
The main points of the above-mention definition are “differential effect”, “brand
knowledge”, and “consumer response to marketing”. Firstly, as brand equity arises
from differences in consumer responses, the branded product would be categorized as
a common version of the product, if no difference were to occur – and the competition
would be based on price only. Secondly, the consumer’s knowledge about the brand is
formed by their own experiences in the form of what they have learnt, felt, seen and
heard about the brand. Thereby, even though marketing activities can have a great
influence on consumers, the most important factor in terms of brand equity will be the
consumers’ personal experiences. Lastly, the consumer response to marketing is re-
flected by perceptions, preferences and behavior, which are all related to the aspects
of the marketing of the brand. (Keller 2008: 48-49) Again, similar to the theory by El-
liott and Percy (2007), Keller (2008) points out that the easiest way to look at the cus-
tomer-based brand equity would be a case of a blind testing or product sampling,
where the consumers are made to test different refreshments in a blind test.
7
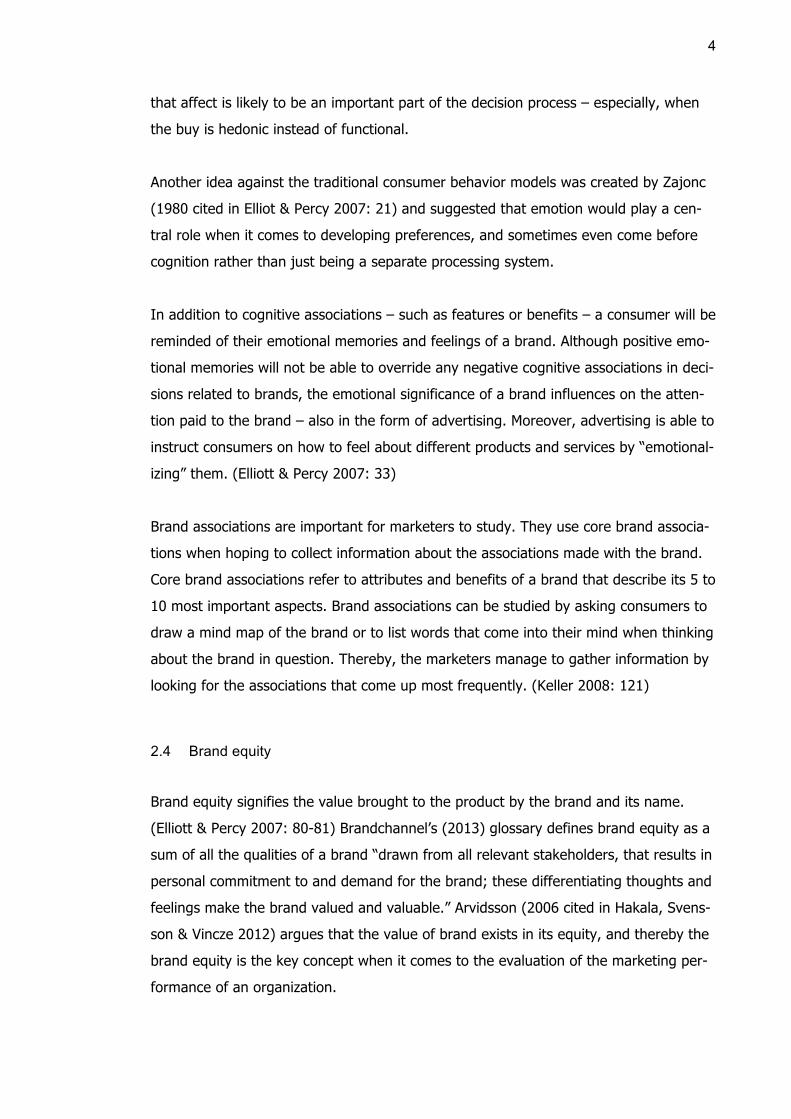
Figure 1. Pyramid of CBBE. (Keller 2008: 136)
According to Keller (2008: 60, 136-137) customer-based brand equity can be studied in
the form of a pyramid (see figure 1) that can be viewed from two different points of
views or routes: a rational and an emotional one. In total, the pyramid has four differ-
ent levels:
At the bottom of the pyramid lies salience, which refers to the awareness of the brand
– for example, how easily or how often a consumer is reminded of the brand in differ-
ent situations. Brand salience also studies to what extent a brand is top-of-mind and is
it easily recalled or recognized.
The second level is about strategic links of tangible and intangible brand associations.
The rational side is called performance and includes features such as price, primary
characteristic and secondary features, and product reliability. The emotional side is
called imagery and it consists of aspects of user profiles, purchase and usage situa-
tions, and experiences.
The third level of the pyramid is about brand identification and brand meaning in the
form of customer responses. The level is divided between judgments (rational side)
8
that cover features such as quality and credibility; and feelings (emotional side), which
consist of different feelings evoked by the brand (e.g. warmth, fun, security, etc.).
On the top of the pyramid lays resonance, where the consumers have already estab-
lished a loyalty relationship with the brand.
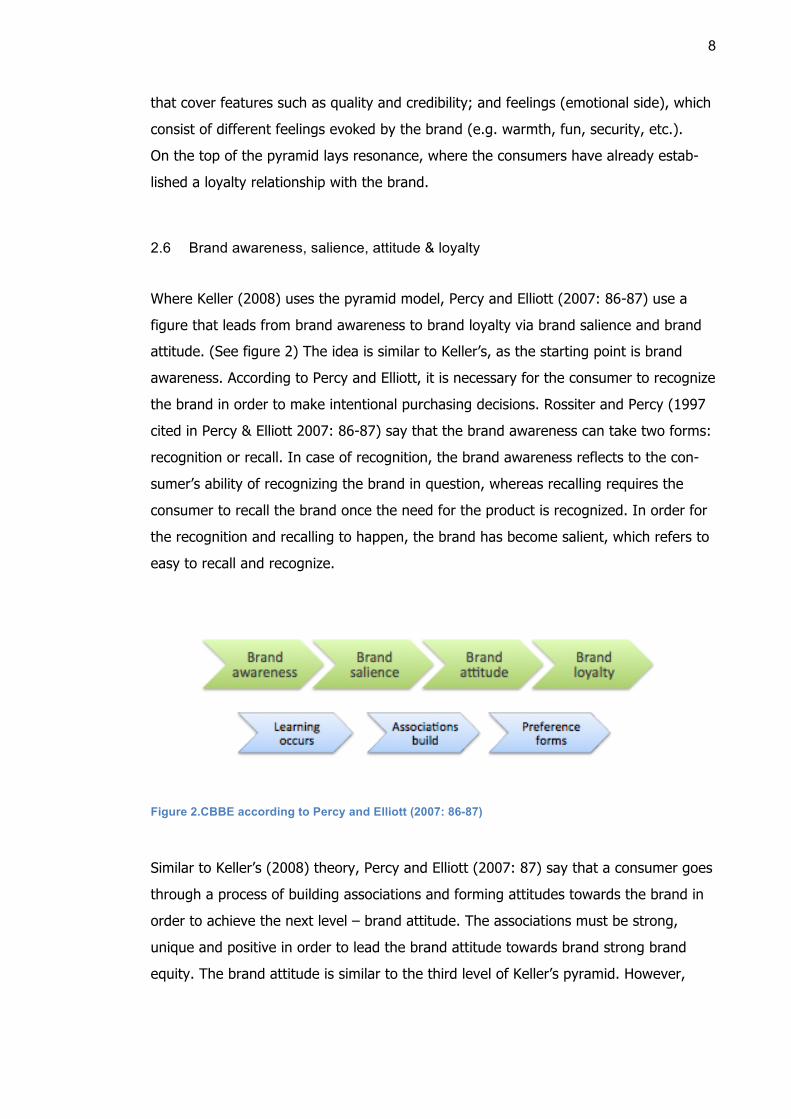
2.6 Brand awareness, salience, attitude & loyalty
Where Keller (2008) uses the pyramid model, Percy and Elliott (2007: 86-87) use a
figure that leads from brand awareness to brand loyalty via brand salience and brand
attitude. (See figure 2) The idea is similar to Keller’s, as the starting point is brand
awareness. According to Percy and Elliott, it is necessary for the consumer to recognize
the brand in order to make intentional purchasing decisions. Rossiter and Percy (1997
cited in Percy & Elliott 2007: 86-87) say that the brand awareness can take two forms:
recognition or recall. In case of recognition, the brand awareness reflects to the con-
sumer’s ability of recognizing the brand in question, whereas recalling requires the
consumer to recall the brand once the need for the product is recognized. In order for
the recognition and recalling to happen, the brand has become salient, which refers to
easy to recall and recognize.
Figure 2.CBBE according to Percy and Elliott (2007: 86-87)
Similar to Keller’s (2008) theory, Percy and Elliott (2007: 87) say that a consumer goes
through a process of building associations and forming attitudes towards the brand in
order to achieve the next level – brand attitude. The associations must be strong,
unique and positive in order to lead the brand attitude towards brand strong brand
equity. The brand attitude is similar to the third level of Keller’s pyramid. However,
9
Percy and Elliott emphasize more the interaction between the rational and emotional
side than Keller does. Percy and Elliott (2007: 89-90) also write that upon the consum-
er’s new experiences of the brand the old knowledge and assumptions are called into
working memory together with emotional associations of the experience.
The last phase of Percy and Elliott’s (2007: 87-91) figure is also brand loyalty, similar
to Keller’s pyramid. Once the brand equity strengthens, the consumer will be shifted
from the phase of brand attitude to brand loyalty. This requires the consumer to build
up that strong preference towards the brand that he would be reluctant to change the
brand.
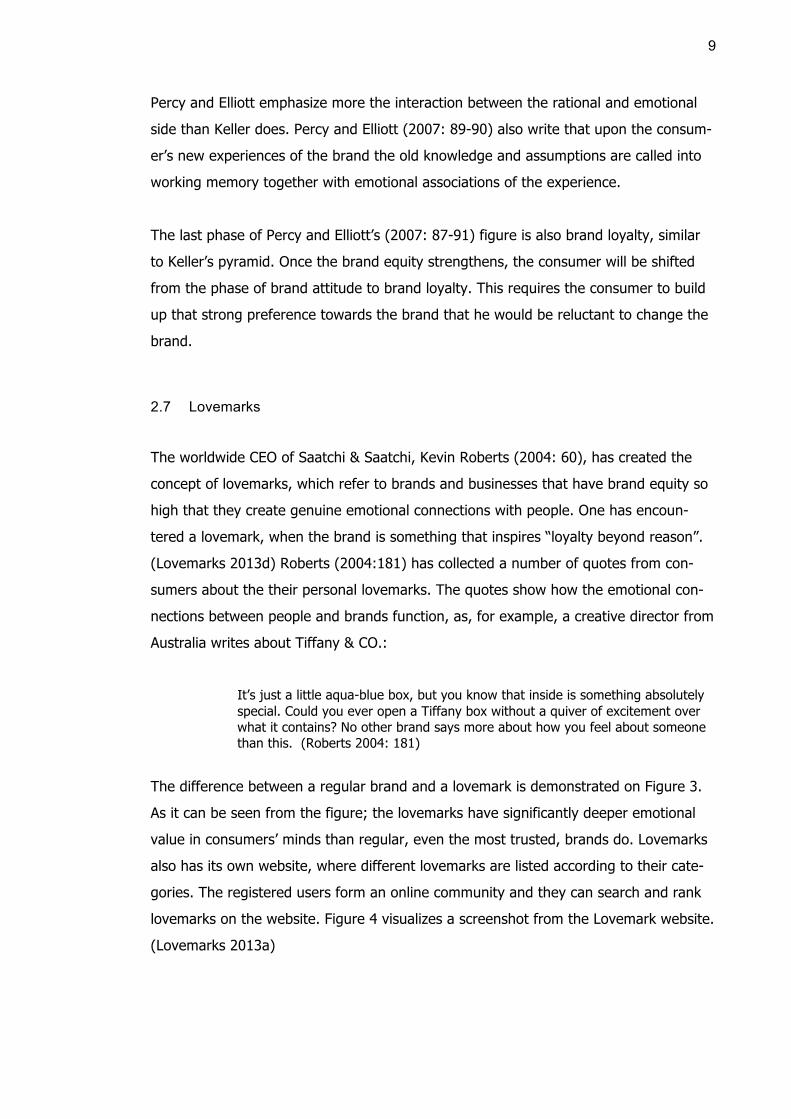
2.7 Lovemarks
The worldwide CEO of Saatchi & Saatchi, Kevin Roberts (2004: 60), has created the
concept of lovemarks, which refer to brands and businesses that have brand equity so
high that they create genuine emotional connections with people. One has encoun-
tered a lovemark, when the brand is something that inspires “loyalty beyond reason”.
(Lovemarks 2013d) Roberts (2004:181) has collected a number of quotes from con-
sumers about the their personal lovemarks. The quotes show how the emotional con-
nections between people and brands function, as, for example, a creative director from
Australia writes about Tiffany & CO.:
It’s just a little aqua-blue box, but you know that inside is something absolutely special. Could you ever open a Tiffany box without a quiver of excitement over what it contains? No other brand says more about how you feel about someone than this. (Roberts 2004: 181)
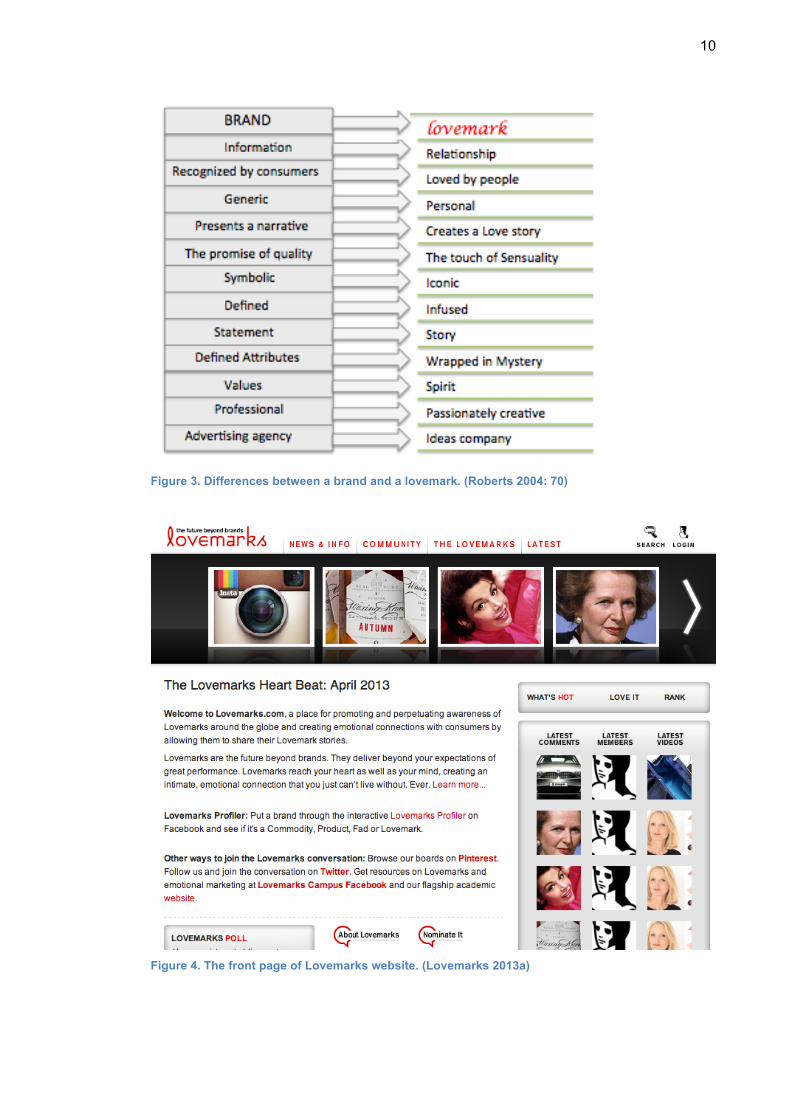
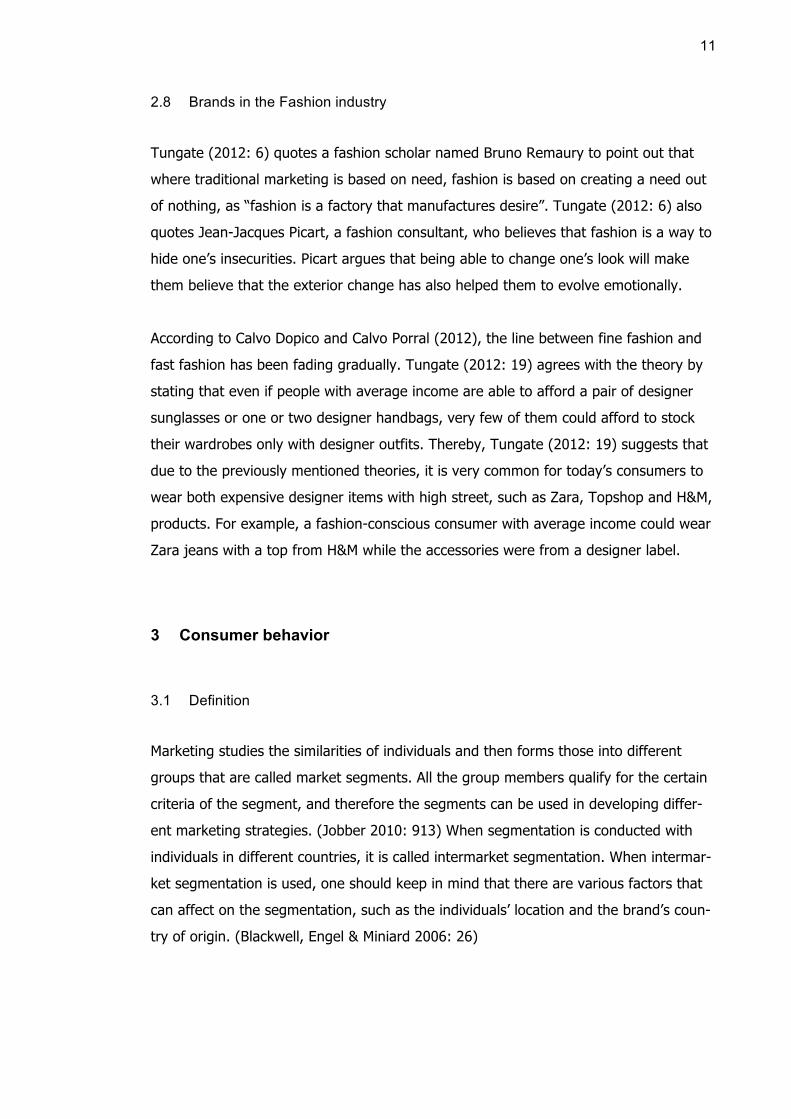
The difference between a regular brand and a lovemark is demonstrated on Figure 3.
As it can be seen from the figure; the lovemarks have significantly deeper emotional
value in consumers’ minds than regular, even the most trusted, brands do. Lovemarks
also has its own website, where different lovemarks are listed according to their cate-
gories. The registered users form an online community and they can search and rank
lovemarks on the website. Figure 4 visualizes a screenshot from the Lovemark website.
(Lovemarks 2013a)
10
Figure 3. Differences between a brand and a lovemark. (Roberts 2004: 70)
Figure 4. The front page of Lovemarks website. (Lovemarks 2013a)
11
2.8 Brands in the Fashion industry
Tungate (2012: 6) quotes a fashion scholar named Bruno Remaury to point out that
where traditional marketing is based on need, fashion is based on creating a need out
of nothing, as “fashion is a factory that manufactures desire”. Tungate (2012: 6) also
quotes Jean-Jacques Picart, a fashion consultant, who believes that fashion is a way to
hide one’s insecurities. Picart argues that being able to change one’s look will make
them believe that the exterior change has also helped them to evolve emotionally.
According to Calvo Dopico and Calvo Porral (2012), the line between fine fashion and
fast fashion has been fading gradually. Tungate (2012: 19) agrees with the theory by
stating that even if people with average income are able to afford a pair of designer
sunglasses or one or two designer handbags, very few of them could afford to stock
their wardrobes only with designer outfits. Thereby, Tungate (2012: 19) suggests that
due to the previously mentioned theories, it is very common for today’s consumers to
wear both expensive designer items with high street, such as Zara, Topshop and H&M,
products. For example, a fashion-conscious consumer with average income could wear
Zara jeans with a top from H&M while the accessories were from a designer label.
3 Consumer behavior
3.1 Definition
Marketing studies the similarities of individuals and then forms those into different
groups that are called market segments. All the group members qualify for the certain
criteria of the segment, and therefore the segments can be used in developing differ-
ent marketing strategies. (Jobber 2010: 913) When segmentation is conducted with
individuals in different countries, it is called intermarket segmentation. When intermar-
ket segmentation is used, one should keep in mind that there are various factors that
can affect on the segmentation, such as the individuals’ location and the brand’s coun-
try of origin. (Blackwell, Engel & Miniard 2006: 26)
12
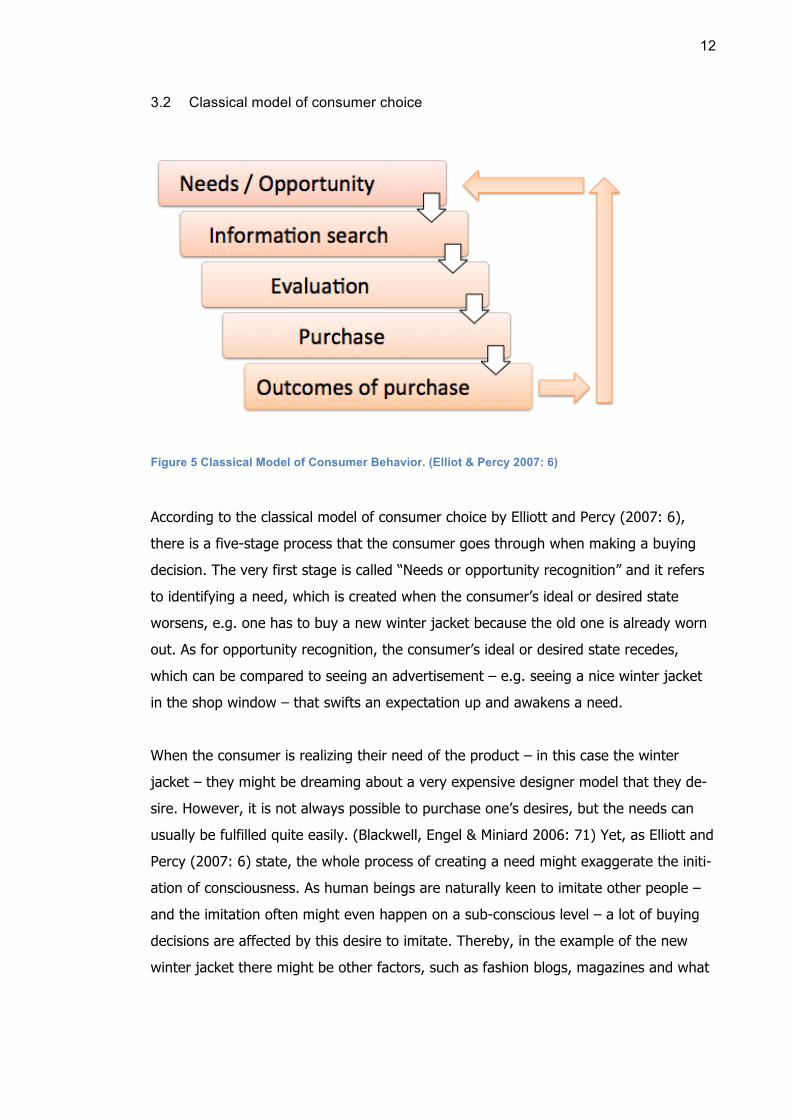
3.2 Classical model of consumer choice
Figure 5 Classical Model of Consumer Behavior. (Elliot & Percy 2007: 6)
According to the classical model of consumer choice by Elliott and Percy (2007: 6),
there is a five-stage process that the consumer goes through when making a buying
decision. The very first stage is called “Needs or opportunity recognition” and it refers
to identifying a need, which is created when the consumer’s ideal or desired state
worsens, e.g. one has to buy a new winter jacket because the old one is already worn
out. As for opportunity recognition, the consumer’s ideal or desired state recedes,
which can be compared to seeing an advertisement – e.g. seeing a nice winter jacket
in the shop window – that swifts an expectation up and awakens a need.
When the consumer is realizing their need of the product – in this case the winter
jacket – they might be dreaming about a very expensive designer model that they de-
sire. However, it is not always possible to purchase one’s desires, but the needs can
usually be fulfilled quite easily. (Blackwell, Engel & Miniard 2006: 71) Yet, as Elliott and
Percy (2007: 6) state, the whole process of creating a need might exaggerate the initi-
ation of consciousness. As human beings are naturally keen to imitate other people –
and the imitation often might even happen on a sub-conscious level – a lot of buying
decisions are affected by this desire to imitate. Thereby, in the example of the new
winter jacket there might be other factors, such as fashion blogs, magazines and what
13
the other people are wearing on the streets that will have an effect on the person’s
buying decision.
The second stage is called “Information search”. At this stage, the consumer is looking
for information about the object of their need. The consumer might use two different
types of searches: internal, which includes searching knowledge from memory; and
external search where the information is searched from surroundings, such as family
and friends. (Elliott & Percy 2007: 6-7) The search can also be extended to active re-
search of publications, reviews and advertisements, as well as passive reception of
information around the consumer. (Blackwell, Engel & Miniard 2006: 74)
Generally, if both internal and external search types are used, the internal search is
usually the one substituting the external search. (Elliott & Percy 2007: 6-7) Similarly,
Blackwell, Engel and Miniard (2006: 74-76) agree that the information search is greatly
affected by a number of variables that also include prior brand perceptions and cus-
tomer satisfactions, and a happy customer is not likely to expand his or her search to
include the competing brands’ products unlike an unhappy one is. Thereby, it can be
argued that positive experiences of the brand have a significant value. Likewise, in the
example of the winter jacket, the consumer would be more likely to choose a winter
jacket from a brand that he or she has been happy with before, and to avoid a brand
that has disappointed him or her.
The third stage is “Evaluation of alternatives”. This is the stage where the consumer
evaluates and compares any alternatives he or she has. The product attributes, func-
tional, symbolic and emotional form the evaluative criteria that will guide the consum-
er’s buying decision. (Elliott & Percy 2007: 7-8) The product attributes also translate
into “the standards and specifications used to compare different products and brands”.
(Blackwell, Engel & Miniard 2006: 80)
Furthermore, the product attributes can be divided into two different groups: salient
attributes and determinant attributes. Salient attributes refer to characteristics such as
price and variability, as well as to the features that do not change significantly between
the same kinds of products. The determinant attributes, then, are the ones to determi-
nate which brand the consumer ends up choosing. Still, the attributes that are moni-
14
tored by the consumers the most are price, quality and size, and radical changes in
these attributes might have an effect on their brand choices. (Blackwell, Engel & Min-
iard 2006: 80-81)
On the other hand, Elliott and Percy (2007: 7-8) say that in the recent years the con-
sumers have moved more towards easy, simplified decisions in order to shortcut the
cognitive process caused by making a choice. These simplified decisions are also
known as “rules of thumb”. Some of these shortcut-decisions seem inaccurate, and
cause the consumers to follow simple rules, such as buying what their parents used to
buy or choosing the cheapest brand. Additionally, the consumers are struggling with
comparing prices and quantities, they start to implement common “market beliefs”.
These beliefs feature a variety of different brand beliefs, such as the belief of an af-
fordable own-label brand products being the same as the more expensive brand lead-
ers, and the only difference being the label and the price.
The fourth stage is called “Purchase” and its two main important aspects are the pre-
planning of the purchase and the place of purchase. A number of factors can interfere
with the intention of purchasing and the actual purchase, and thereby the major factor
in the purchase stage is time. The faster the consumer completes the purchase, the
less of risk for him or her to change his or her mind and choose another brand. (Elliott
& Percy 2007: 8-9)
The fifth and final stage is “Outcomes of the purchase”. This post-consumption evalua-
tion can be measured by simply asking the consumer whether he or she is satisfied or
dissatisfied with the product. (Elliott & Percy 2007: 8-9) When the consumer’s expecta-
tions are fulfilled, he has experienced satisfaction. Dissatisfaction occurs when the ex-
perience does not match with the consumer’s expectation. This is an important stage,
as the consumer will return to evaluating his or her previous experience with the brand
the next time he goes through the information search stage. (Blackwell, Engel & Min-
iard 2006: 83-84)
The classical model of consumer choice normally only applies to products of high cus-
tomer involvement. (Elliott & Percy 2007: 11) Customer involvement refers to the ac-
tions an individual is willing to take prior to the buying the product, and its goal is to
15
minimize the risks and maximize the benefits of the product’s purchase and use.
(Blackwell, Engel & Miniard 2006: 93) Factors that make a product into a high-
involvement-product are price, frequency of purchase, symbolic meaning, social visibil-
ity, time commitment, potential for harm and technical complexity. (Elliott & Percy
2007: 11)
Most of the consumers are not very aware of different brands and have a very limited
number of brands memorized. The average consumer can recall 7 (plus or minus 2)
brands from their memory, whereas in low-involvement categories this number is clos-
er to 4 (plus or minus 1). (Elliott & Percy 2007: 11)
3.3 Advertising
Kotler and Keller (2012: 500) define advertising as paid presentation and promotion of
ideas, goods or services communicated via prime media (e.g. television, radio, news-
papers, etc.). Advertising is considered as an important part of the marketing commu-
nication mix, as it can reach potential consumers that are geographically spread out.
(Kotler and Keller 2012: 500) As advertising should be frequent and constant, compa-
nies should reserve big enough advertising budget. This can often be very expensive,
but it is very important for the company to get visibility. (Kotler & Keller 2012: 527 and
Jobber 2010: 473)
4 The impact of culture in branding and consumer behavior
4.1 Masculine, feminine, collective and individual cultures
According to Hofstede (1984 cited in Blackwell, Miniard & Engel 2006: 442), culture
can be divided into four different dimensions that are common in 66 countries. Two of
these dimensions are masculinity-femininity and individualism-collectivism. In a mascu-
line society achievement and success are highly valued, whereas a feminine society
values caring for others and the quality of life. A feminine society idealizes modest
ways of living and as a contrary to a masculine society it believes that a good quality of
life is a lot more important than winning. (De Mooij 2005: 61-65)
16
An individual culture means an “I and my immediate family” –type of culture, where
individualism and individual decisions are highly valued. Instead, a collective culture
means a “we-culture” where people are a part of a bigger group (also called “in-
group”; the size of the group varying from the extended family to the whole neighbor-
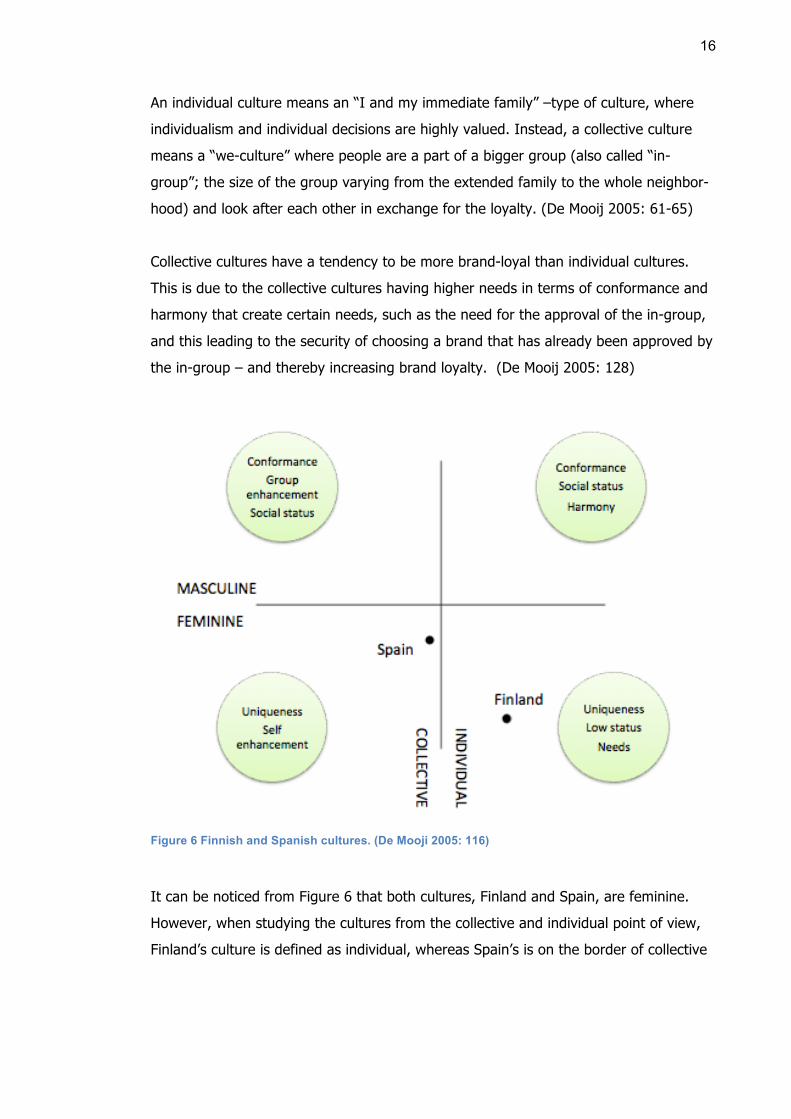
hood) and look after each other in exchange for the loyalty. (De Mooij 2005: 61-65)
Collective cultures have a tendency to be more brand-loyal than individual cultures.
This is due to the collective cultures having higher needs in terms of conformance and
harmony that create certain needs, such as the need for the approval of the in-group,
and this leading to the security of choosing a brand that has already been approved by
the in-group – and thereby increasing brand loyalty. (De Mooij 2005: 128)
Figure 6 Finnish and Spanish cultures. (De Mooji 2005: 116)
It can be noticed from Figure 6 that both cultures, Finland and Spain, are feminine.
However, when studying the cultures from the collective and individual point of view,
Finland’s culture is defined as individual, whereas Spain’s is on the border of collective
17
and individual – yet leaning more towards collective than individual. (See figure 6) (De
Mooij 2005: 115-116)
4.2 Culture and consumer behavior
According to Wang (2005 cited in Laforet 2010: 250), consumer nationalism can have
a significant impact on corporate reputation in international markets. The consumer
nationalism refers to expressing brand’s national identity and thereby can lead to con-
sumers favoring or rejecting the brand due to its origin. Wang also lists four different
factors that affect international brands and can cause conflicts in terms of the national-
ity of the brand:
− National association, which refers to the level of associations made with the in-
ternational brand’s nationality. The higher this level is, bigger the vulnerability
to consumer nationalism.
− As consumer familiarity or visibility of the brand grows, so do the chances of
the brand becoming a target of consumer nationalism.
Likeability can save the brand from becoming a target of consumer nationalism. Likea-
bility refers to the level consumers like the brand – the more liked the brand, the more
difficult it will be for consumer nationalism to have an effect on it, if the consumers
find out that the brand’s country of origin is one they dislike. Magnitude refers to the
competiveness of the marketplace – the more competitive the marketplace is, more
likely it is for the brand to suffer from consumer nationalism. (Wang 2005 cited in
Laforet 2010: 250) However, according to Laforet (2010: 250), it possible for the
brands to recover quickly from the damage caused by consumer nationalism, once the
nationalistic movement is over.
When it comes to favoring national brands in Finland, a research conducted by Hakala,
Svensson & Vincze (2012) reveals that the majority (40%) of the sample representing
Finnish consumers was neutral when asked about buying domestically produced prod-
ucts, whereas 25% somewhat agreed and 15% somewhat disagreed with the state-
ment.
18
4.3 Brand personality
Consumers often experience and see brands as if they had characteristics of a person.
(Elliott & Percy 2007: 64) Levy (1959 cited in Elliott and Percy 2007: 64) said that a
brand personality includes demographic categories such as gender, age and class,
whereas Aaker (1997 cited in Elliott and Percy 2007: 64) reasoned that personality
traits could also be associated with the brand indirectly, i.e. in the form of brand name,
symbol, price or advertising stylistics. Elliot and Percy (2007: 64) remark that newer
works have pointed some parts of brands’ personal meanings being socially construct-
ed and varying across cultures. Another and more recent metaphorical thinking sug-
gests that consumers can take their affection for brands even further and create rela-
tions that are similar to interpersonal relationships with brands. (Fournier 1998 cited in
Elliott and Percy 2007: 64-65) A good example of creating an interpersonal-like rela-
tionship with a brand is lovemarks, as explained on page 8. A lovemark, in this case
Apple, can be described as it follows:
After 14 years, I’m still in Love. To be honest, I don’t know why I feel this way. I’ve simply never wanted to give the others a go. I don’t even really know what the differences are… Well, apart from the looks! I’ve been told both do almost the same things – one way or another. But would they feel the same in the dark? Perhaps deep down I know it’s the way you learn to handle them, how readily they respond to your needs, the way they do it. Or maybe there’s more to it? Richard Briers/George Clooney. PC/Apple Mac. What sort of idiot would divorce their soul mate? Apple Mac – you are my Lovemark. (Roberts 2004: 179)
As the quote about Apple as a lovemark clearly shows the affection the person has
towards Apple, it supports Fournier’s (1998 cited in Elliott and Percy 2007: 64-65) the-
ory about forming strong relationships with a brand well. The person’s affection to-
wards the brand can be noticed throughout the quote, especially when the person
compares his or her brand loyalty to a marriage and states that changing the Apple
brand to another one would be equal to divorcing one’s soul mate.
5 Methodology
The research was conducted from February 2013 to May 2013. Fisher’s (2010: 5) “Pro-
cess of doing a dissertation” which includes five different phases was applied to the
thesis methodology. The first phase involved choosing a topic and designing the pro-
19
ject, and this phase was carried out in February and March 2013. The second and third
phases involved writing a critical literature review and developing conceptual frame-
works and theories; both phases were completed during the months of March and April
2013. The last three phases, which included collecting and analyzing research material
(4), drawing conclusions (5) and writing up the thesis (6) were carried out in April
2013.
The research question of the thesis was: “What kind of images and attitudes has Zara’s
brand created in Finland and Spain?” The research question had a few supportive sub-
questions, such as: “Does consumer behavior differ between the two countries in
terms of consumption of fashion?” and “Have the possible differences been affected by
branding?” As the research question and its sub-questions require a sample to present
a population of two different countries, a quantitative method to collect primary data in
the form of a questionnaire was chosen. Quantitative questionnaires are suitable for
the collection of great amounts of data from large populations in the most time-
effective way. (Sanders et al. 2007: 138) In order to create the quantitative question-
naire theoretical information from secondary sources and a critical literature review
were necessary. As the research question and thus the topic were focused on branding
from the consumers’ point of view, the literature review emphasized on branding and
consumer behavior theories.
5.1 Data collection and sampling
The study uses both primary and secondary data. A quantitative questionnaire was
compiled at the beginning of the research to gather primary data. The original ques-
tions were created in English and later translated into Finnish and Spanish to ensure
that all the respondents were able to complete the questionnaire in their first language
and thereby understand the questions correctly, thus the risk of misunderstandings
was minimized. The writer translated both of the surveys, as she is a native speaker of
Finnish and has a good knowledge of Spanish. To ensure the correct use of terminolo-
gy, a native Spanish speaker proofread the Spanish translation before publishing the
survey. The survey was a self-administered, Internet-mediated questionnaire, as it
allowed easy conducting of a geographically dispersed sample. (Sanders et al. 2007:
358) The survey was published on an online survey service webpage, Survey-
20
monkey.com, using a premium account of the PLUS-status. The data was collected
from March 27th until April 24th 2013, thus it allowed the respondents more than four
weeks to complete the questionnaire. The questions were multiple-choice questions,
and depending on the question it was possible to choose only one or multiple options.
In addition to multiple-choice questions, the surveys included statements where the
respondent was guided to choose a response that best suited their opinion.
The survey consisted of questions from four categories: demographic, fashion con-
sumption, attitudes towards Zara, and competition. The demographic category covered
the age, the gender, the education level and the country of origin of the respondent.
Demographic data was collected so any findings due to respondents’ age, sex and edu-
cation were possible to be discovered. The country of origin only had two options (Fin-
land and Spain), as they were the countries to be studied, and the question was asked
in order to ensure all the respondents originated from one of the two countries. The
last demographic question asked respondents to leave their contact information if they
were willing to answer possible further questions. The last question was added to the
survey as backup; in case any findings would develop questions that required an addi-
tional qualitative study.
The second part of the questionnaire studied the respondents’ consumption habits in
terms of fashion. The questions asked about the respondents’ monthly average spend-
ing on fashion items: clothes, shoes, and accessories, and how often respondents visit
Zara, and how often they end up purchasing something. The questions about the con-
sumption habits were asked in order to identify the respondents’ consumption on fash-
ion items and their familiarity with Zara. Later the consumption findings could be ap-
plied to the findings about respondents’ attitudes towards Zara in order to discover
Zara’s brand equity amongst the respondents. Respondents’ attitudes towards Zara
were studied in the third part of the questionnaire. The attitudes were first asked in
terms of fashion, price, quality, and later to find out their preferences in terms of Za-
ra’s selection.
The fourth and last category was about Zara’s competition. The questions asked the
respondents to identify which stores they would not choose over Zara, and later identi-
fy the reasons why they would prefer Zara over the chosen stores. For more detailed
21
analyses, please see information about Zara’s competitors on page 22. These questions
were asked to find out differences between Finnish and Spanish consumers when it
comes to choosing Zara over other brands. The reasons were asked in order to discov-
er how the respondents would describe Zara. Question 14 (“Do you prefer Zara
over…”) had some differences in the alternative answers between the two question-
naires, as Finland and Spain do not have identical offering in the fashion retail markets.
Similarly, in question 15 (“Which of the following are the reasons you would choose
Zara over any of the above-mentioned stores?”) the Finnish survey had only seven
alternative answers, whereas the Spanish survey had eight, as an alternative “Zara
being a domestic brand” was added to the alternatives. (For the complete list of the
questions, please see appendix 1) The sample was gathered by sharing both of the
questionnaires through the writer’s academic and professional networks.
Prior to creating the questionnaire, a critical literature review of secondary resources
was carefully gathered and the main theories were applied to create the questionnaire.
The literature was mainly accessed via Metropolia Business School’s library services
and online databases.
5.2 Data analysis
Data analysis is used to interpret huge amounts of data into coherently presented con-
clusions. (Sanders et al. 2007: 152) Thereby, the information gathered through the
surveys was analyzed and compared. Some parts of the information gathered through
the surveys were analyzed on different levels (e.g. filtering genders to discover more
findings). The theories discussed on chapters three and four were adapted and used to
help interpreting the findings mostly in conclusion chapter, but also throughout the
findings. The data is presented in form of pie charts, as a pie chart is a good tool when
multiple parts of information are compared. (Fisher 2010: 229) As pie charts are often
overused in theses, (Fisher 2010: 229) only pie charts that were the most essential
ones in terms of illustrating the information were used in the chapter. The rest of the
pie charts were added as appendices, and can be found from appendix 4.
22
5.3 Ethical issues and limitations of the research
There were no major ethical issues to be considered with the research, as the survey
was anonymous and no personal data was gathered. Furthermore the writer was in
contact with Zara on April 8th via an online “Contact us” form, and received their ap-
proval via email to use the company as a case study in the thesis.
The main limitation of the research was to find enough appropriate respondents for the
survey, as the desired amount of respondents would have been 100 for each question-
naire. Unfortunately, neither of the questionnaires reached a sample size of 100 re-
spondents. While the Finnish questionnaire managed to reach 91 respondents, the
response-rate of the Spanish questionnaire was remarkably lower – only 42 respond-
ents. Moreover, while the Spanish survey reached almost an even number of females
(54.8%) and males (45.2%), the majority of the Finnish respondents were female
(79,1%) and male respondents were a minority (20,9%). Another limitations were the
lack of previous studies in consumer behavior focusing on Finland and Spain, and the
use of an anonymous online questionnaire. Using an anonymous online questionnaire,
it is never completely sure that all the respondents qualify, e.g. in terms of country of
origin. Additionally, as there are only four Zara stores in Finland, and three of the
stores are located in the Helsinki area and one in Turku, not all Finnish respondents
were very familiar with Zara, unless they were from the Helsinki area or Turku.
6 Case study: Zara
6.1 Inditex Group
Zara is the flagship store of the Spanish company called Inditex (Industria del Diseño
Textil, SA) Group – one of the world’s largest fashion retailers. The first Zara store was
opened in 1975 in Northwestern Spain in a city called A Coruña – where the Inditex
Group headquarters are still located. Inditex’s store formats are Zara, Pull & Bear, Mas-
simo Dutti, Bershka, Stradivarius, Oysho, Zara Home and Uterqüe; and it has 6009
stores in 86 different countries on five continents. The Inditex Group consists of over
100 companies that operate in the fields of textile design, manufacturing and distribu-
tion. In 2012, the Inditex Group employed 120,314 people, and its net sales were
23
15,946 million Euros producing a net profit of 2,361 million Euros. (Inditex Group
2013a) Zara, however, is still the cornerstone of the company, as it provides 70% of
the group’s income. (Tungate 2012: 40)
6.2 Zara
Although the first Zara store was opened already in 1975 in Spain, the internationaliza-
tion of Zara did not happen until 1989, when the first Zara store outside of Spain was
opened in Oporto, Portugal. (Tungate 2012: 40) Currently Zara’s 1751 stores are locat-
ed in 86 countries all over the world (Inditex Group 2013b) and its success has made it
fast fashion’s world-leading brand. (Calvo Dopico & Calvo Porral, 2013) Out of the total
number of Zara’s stores, there are 332 stores located all around Spain, and four in Fin-
land: three stores in Helsinki area, and one in Turku. Originally Zara came to Finland in
2002 and was franchised by Stockmann, but in the January 2013 Stockmann sold the
subsidiary back to Inditex. (Bhose 2013)
The unique key to Zara’s success is its innovative business model that allows it to re-
spond rapidly to new trends. Zara has simplified all its processes, which thereby has
allowed the company to shorten the production times of its designs remarkably. (Mar-
tinez 2012: 58) When a new clothing design has been photographed during the fashion
week, it normally takes months before the garment arrives to department stores, while
it is only a matter of weeks until a reproduction of the design arrives to Zara’s stores.
(Tungate 2012: 40) Additionally, unlike most of its competitors, Zara has not moved its
production to Asia but continued it in Spain. Zara headquarters collect data from all of
its stores continuously, as at the end of each day the store managers use Zara’s mar-
keting information system to report what consumers are buying, asking for, and avoid-
ing. Thereby, the design and distribution departments can be informed about the cur-
rent trends immediately. (Jobber 2010: 643) The store managers are strategically very
important to Zara, as they are expected to carefully examine the tastes and prefer-
ences of customers visiting the store. Thereby, different Zara stores normally have
different stocks, as the stocking is done based on the preferences of each store’s clien-
tele. (Tungate 2012: 41)
24
According to Lopez and Fan (2009), Zara’s main competitors are H&M (Hennes & Mau-
ritz AB) and Gap, Inc. H&M has almost 2900 stores in 49 different markets, 149 of the-
se being located in Spain and 53 in Finland; (H&M 2013) whereas Gap does not have
any owned outlets in Spain nor Finland. (Gap, Inc. 2013) Guillén (2011) lists Benetton,
Gap, and The Limited as Zara’s main competitors, but also adds that the only competi-
tor that has a potential to keep up with Zara would be H&M. Out of Guillén’s (2011) list
of Zara’s competitors, only Benetton stores can be found from Spain and Finland, as
the Limited stores are located only in the U.S. (The Limited, 2013)
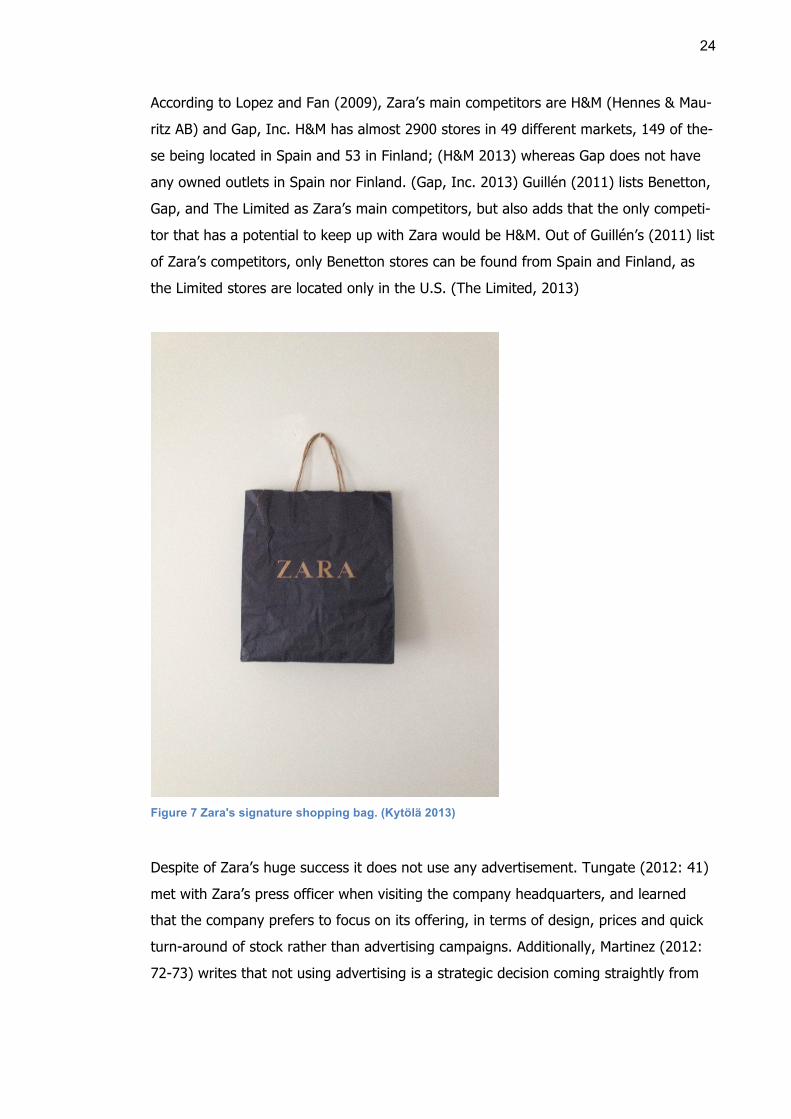
Figure 7 Zara's signature shopping bag. (Kytölä 2013)
Despite of Zara’s huge success it does not use any advertisement. Tungate (2012: 41)
met with Zara’s press officer when visiting the company headquarters, and learned
that the company prefers to focus on its offering, in terms of design, prices and quick
turn-around of stock rather than advertising campaigns. Additionally, Martinez (2012:
72-73) writes that not using advertising is a strategic decision coming straightly from
25
the founder, Amancio Ortega. Ortega had a clear idea of advertising campaigns – he
did not want to overuse traditional advertising. Thereby, Zara’s advertisements can
never be seen on television or found from the billboards, as the company still empha-
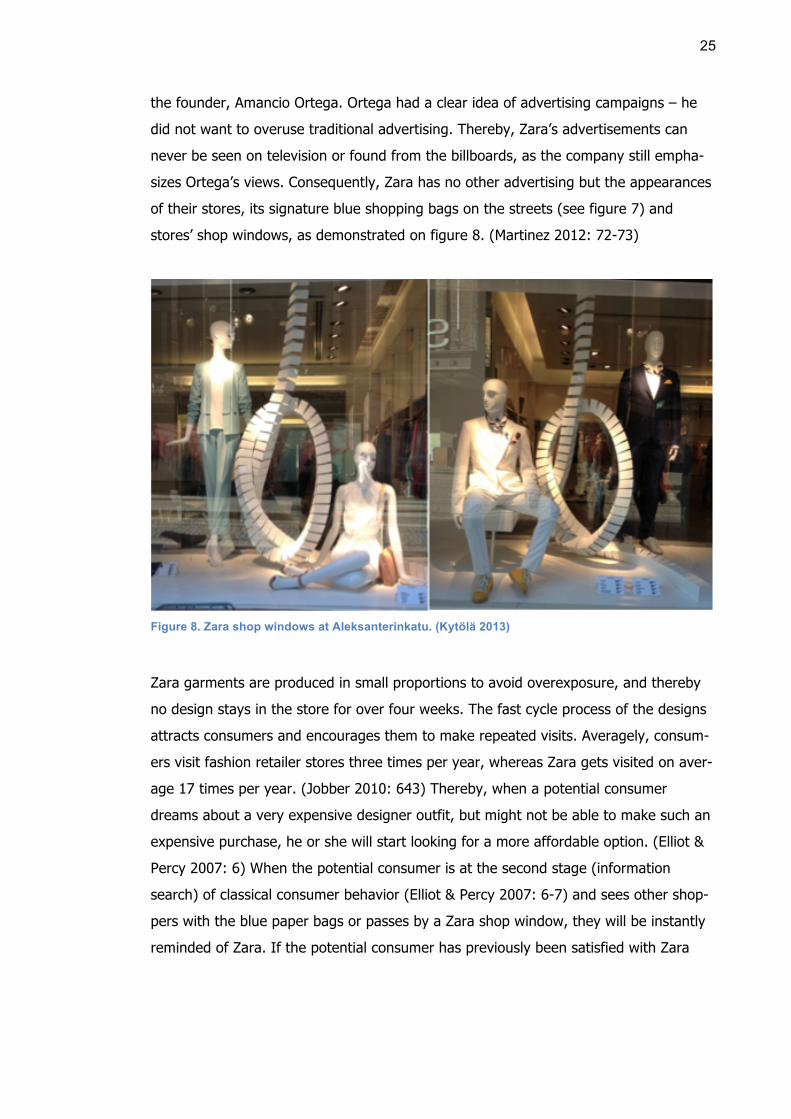
sizes Ortega’s views. Consequently, Zara has no other advertising but the appearances
of their stores, its signature blue shopping bags on the streets (see figure 7) and
stores’ shop windows, as demonstrated on figure 8. (Martinez 2012: 72-73)
Figure 8. Zara shop windows at Aleksanterinkatu. (Kytölä 2013)
Zara garments are produced in small proportions to avoid overexposure, and thereby
no design stays in the store for over four weeks. The fast cycle process of the designs
attracts consumers and encourages them to make repeated visits. Averagely, consum-
ers visit fashion retailer stores three times per year, whereas Zara gets visited on aver-
age 17 times per year. (Jobber 2010: 643) Thereby, when a potential consumer
dreams about a very expensive designer outfit, but might not be able to make such an
expensive purchase, he or she will start looking for a more affordable option. (Elliot &
Percy 2007: 6) When the potential consumer is at the second stage (information
search) of classical consumer behavior (Elliot & Percy 2007: 6-7) and sees other shop-
pers with the blue paper bags or passes by a Zara shop window, they will be instantly
reminded of Zara. If the potential consumer has previously been satisfied with Zara
26
and its products, being reminded of the brand might lead him or her to a purchasing
decision. (Blackwell, Engel and Miniard 2006: 74-76)
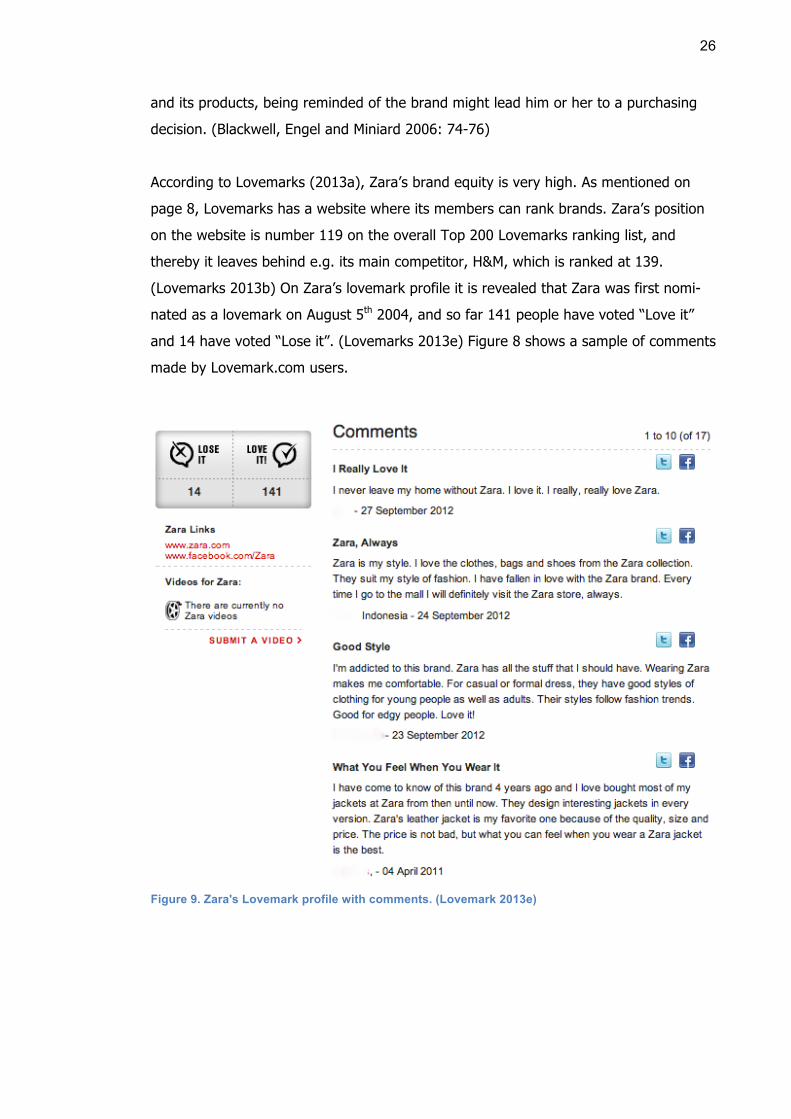
According to Lovemarks (2013a), Zara’s brand equity is very high. As mentioned on
page 8, Lovemarks has a website where its members can rank brands. Zara’s position
on the website is number 119 on the overall Top 200 Lovemarks ranking list, and
thereby it leaves behind e.g. its main competitor, H&M, which is ranked at 139.
(Lovemarks 2013b) On Zara’s lovemark profile it is revealed that Zara was first nomi-
nated as a lovemark on August 5th 2004, and so far 141 people have voted “Love it”
and 14 have voted “Lose it”. (Lovemarks 2013e) Figure 8 shows a sample of comments
made by Lovemark.com users.
Figure 9. Zara's Lovemark profile with comments. (Lovemark 2013e)
27
7 Analysis
Pie charts that were most essential in order to provide a clear presentation of the find-
ings are included as visuals in the analysis section. The complete collection of the pie
charts can be found from appendix 4. If not otherwise specified, the blue pie charts
refer to findings from the Finnish survey, and the orange pie charts refer to those of
the Spanish survey.
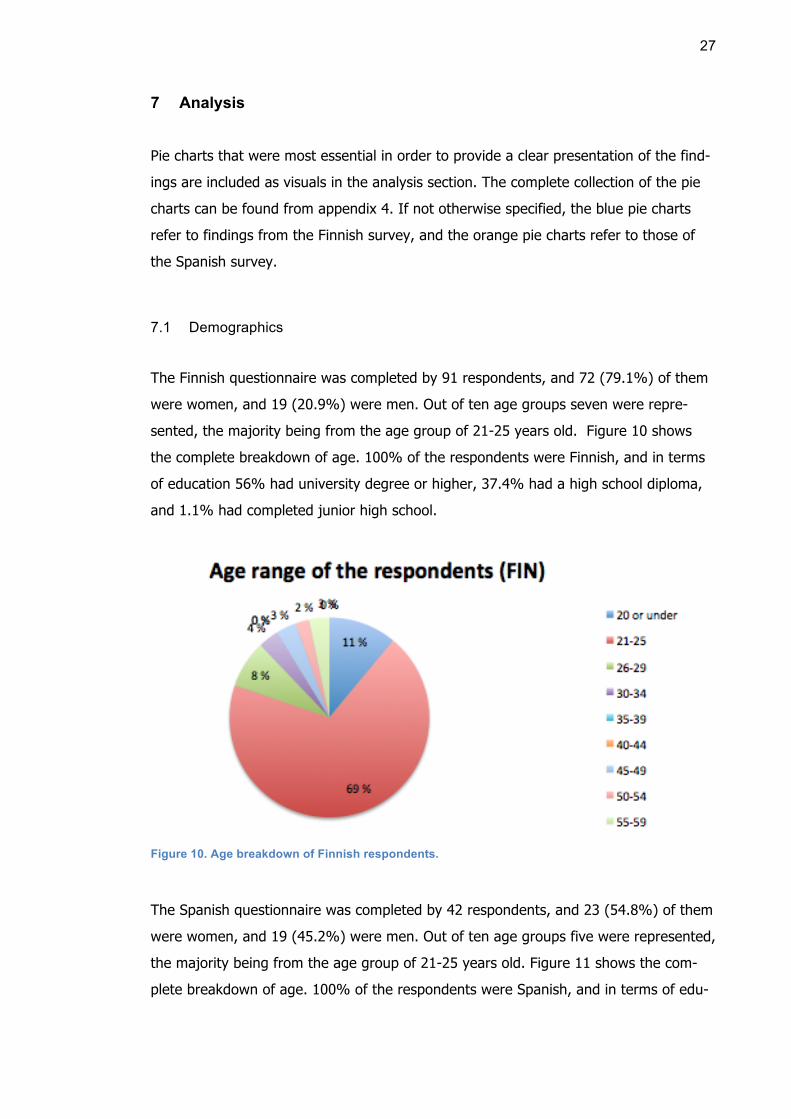
7.1 Demographics
The Finnish questionnaire was completed by 91 respondents, and 72 (79.1%) of them
were women, and 19 (20.9%) were men. Out of ten age groups seven were repre-
sented, the majority being from the age group of 21-25 years old. Figure 10 shows
the complete breakdown of age. 100% of the respondents were Finnish, and in terms
of education 56% had university degree or higher, 37.4% had a high school diploma,
and 1.1% had completed junior high school.
Figure 10. Age breakdown of Finnish respondents.
The Spanish questionnaire was completed by 42 respondents, and 23 (54.8%) of them
were women, and 19 (45.2%) were men. Out of ten age groups five were represented,
the majority being from the age group of 21-25 years old. Figure 11 shows the com-
plete breakdown of age. 100% of the respondents were Spanish, and in terms of edu-
28
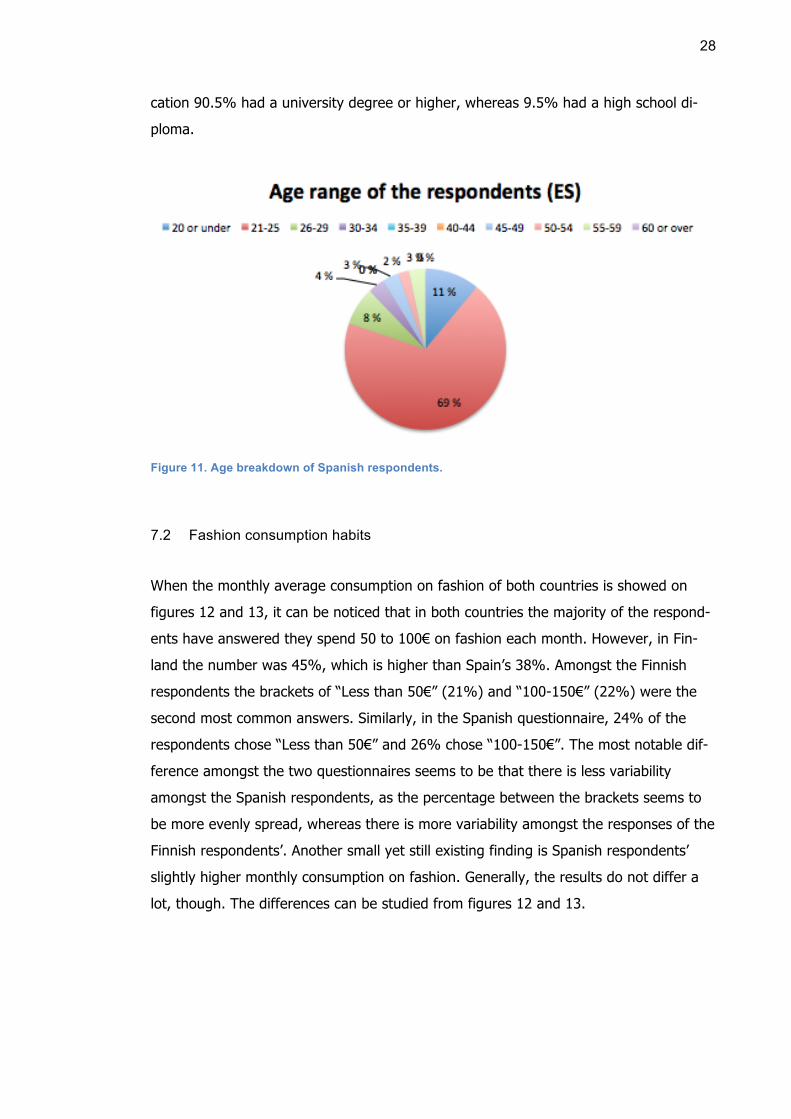
cation 90.5% had a university degree or higher, whereas 9.5% had a high school di-
ploma.
Figure 11. Age breakdown of Spanish respondents.
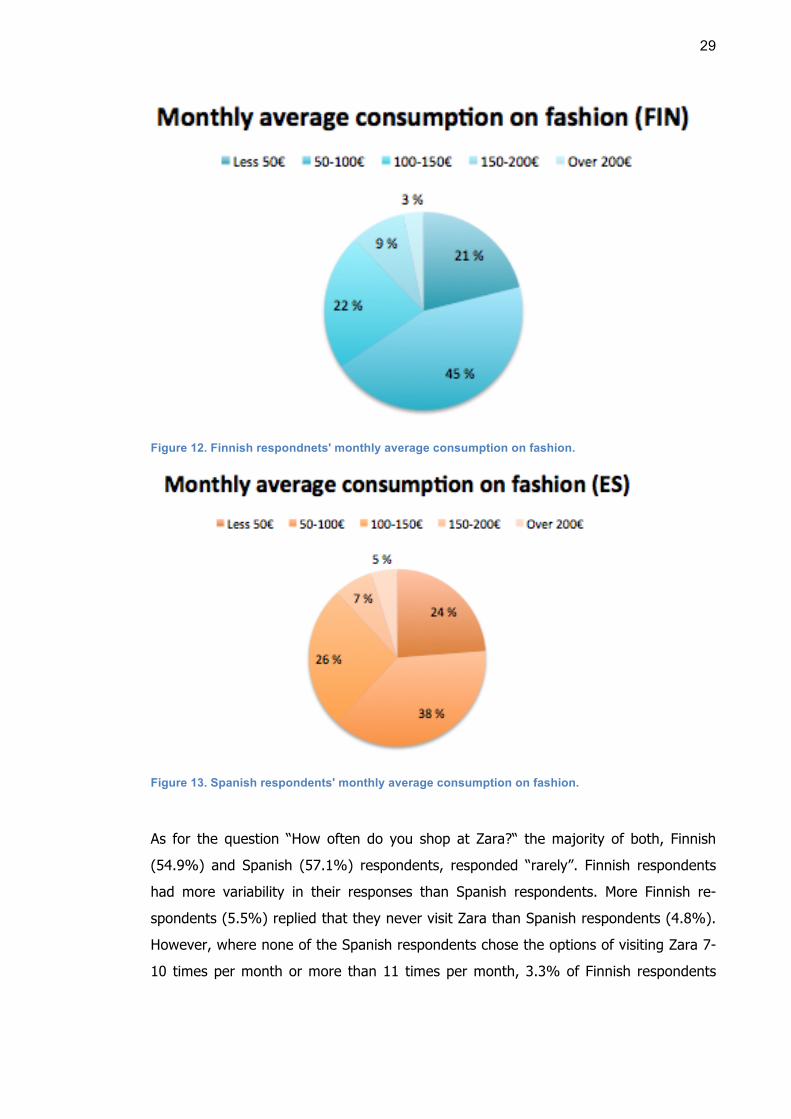
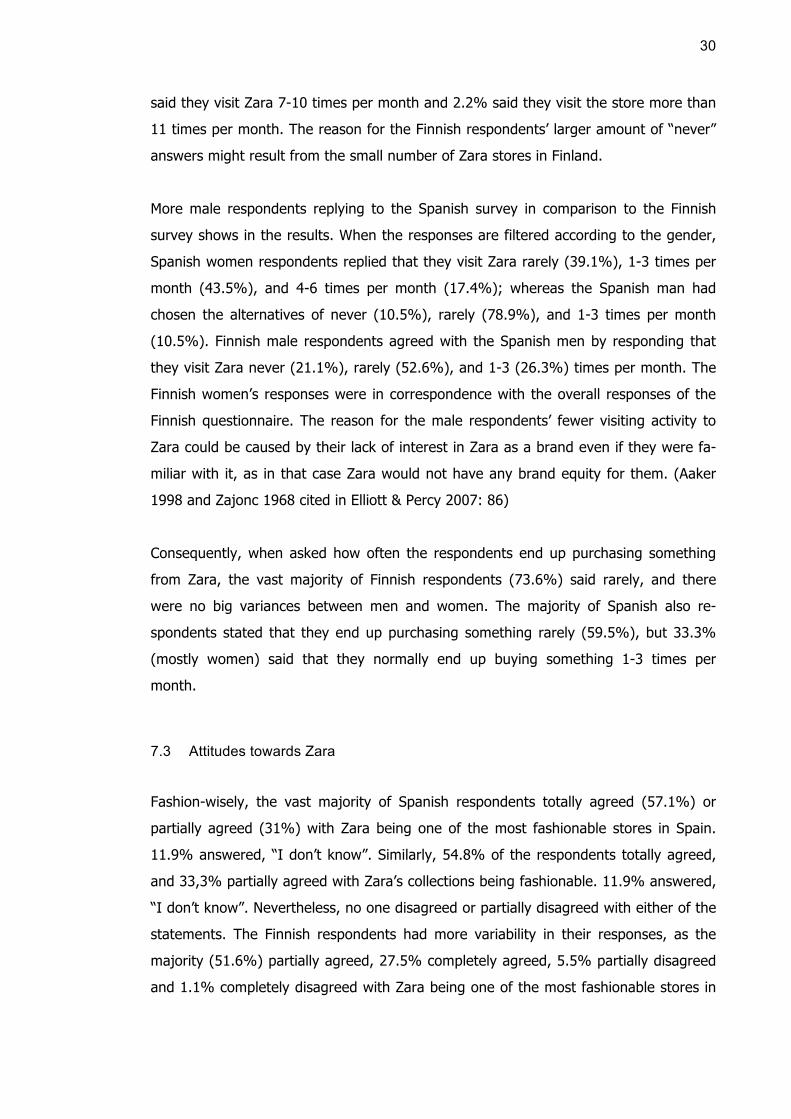
7.2 Fashion consumption habits
When the monthly average consumption on fashion of both countries is showed on
figures 12 and 13, it can be noticed that in both countries the majority of the respond-
ents have answered they spend 50 to 100€ on fashion each month. However, in Fin-
land the number was 45%, which is higher than Spain’s 38%. Amongst the Finnish
respondents the brackets of “Less than 50€” (21%) and “100-150€” (22%) were the
second most common answers. Similarly, in the Spanish questionnaire, 24% of the
respondents chose “Less than 50€” and 26% chose “100-150€”. The most notable dif-
ference amongst the two questionnaires seems to be that there is less variability
amongst the Spanish respondents, as the percentage between the brackets seems to
be more evenly spread, whereas there is more variability amongst the responses of the
Finnish respondents’. Another small yet still existing finding is Spanish respondents’
slightly higher monthly consumption on fashion. Generally, the results do not differ a
lot, though. The differences can be studied from figures 12 and 13.
29
Figure 12. Finnish respondnets' monthly average consumption on fashion.
Figure 13. Spanish respondents' monthly average consumption on fashion.
As for the question “How often do you shop at Zara?“ the majority of both, Finnish
(54.9%) and Spanish (57.1%) respondents, responded “rarely”. Finnish respondents
had more variability in their responses than Spanish respondents. More Finnish re-
spondents (5.5%) replied that they never visit Zara than Spanish respondents (4.8%).
However, where none of the Spanish respondents chose the options of visiting Zara 7-
10 times per month or more than 11 times per month, 3.3% of Finnish respondents
30
said they visit Zara 7-10 times per month and 2.2% said they visit the store more than
11 times per month. The reason for the Finnish respondents’ larger amount of “never”
answers might result from the small number of Zara stores in Finland.
More male respondents replying to the Spanish survey in comparison to the Finnish
survey shows in the results. When the responses are filtered according to the gender,
Spanish women respondents replied that they visit Zara rarely (39.1%), 1-3 times per
month (43.5%), and 4-6 times per month (17.4%); whereas the Spanish man had
chosen the alternatives of never (10.5%), rarely (78.9%), and 1-3 times per month
(10.5%). Finnish male respondents agreed with the Spanish men by responding that
they visit Zara never (21.1%), rarely (52.6%), and 1-3 (26.3%) times per month. The
Finnish women’s responses were in correspondence with the overall responses of the
Finnish questionnaire. The reason for the male respondents’ fewer visiting activity to
Zara could be caused by their lack of interest in Zara as a brand even if they were fa-
miliar with it, as in that case Zara would not have any brand equity for them. (Aaker
1998 and Zajonc 1968 cited in Elliott & Percy 2007: 86)
Consequently, when asked how often the respondents end up purchasing something
from Zara, the vast majority of Finnish respondents (73.6%) said rarely, and there
were no big variances between men and women. The majority of Spanish also re-
spondents stated that they end up purchasing something rarely (59.5%), but 33.3%
(mostly women) said that they normally end up buying something 1-3 times per
month.
7.3 Attitudes towards Zara
Fashion-wisely, the vast majority of Spanish respondents totally agreed (57.1%) or
partially agreed (31%) with Zara being one of the most fashionable stores in Spain.
11.9% answered, “I don’t know”. Similarly, 54.8% of the respondents totally agreed,
and 33,3% partially agreed with Zara’s collections being fashionable. 11.9% answered,
“I don’t know”. Nevertheless, no one disagreed or partially disagreed with either of the
statements. The Finnish respondents had more variability in their responses, as the
majority (51.6%) partially agreed, 27.5% completely agreed, 5.5% partially disagreed
and 1.1% completely disagreed with Zara being one of the most fashionable stores in
31
Finland. 14,3% answered, “I don’t know”. Again the majority of Finnish respondents
(49.5%) partially agreed with the statement of Zara’s collections being fashionable.
37.4% agreed partially with the statement, 9.9% answered, “I don’t know”, and 3.3%
partially disagreed. Thereby, it can be conclude the Spanish respondents find Zara and
its collections more fashionable than the Finnish respondents.
The majority of both, Finnish (71.4%) and Spanish (71.4%), respondents agreed to
Zara’s prices being normal. 23.1% of Finnish and 19% of Spanish respondents found
the prices expensive, whereas 5.5% of Finnish and 9.5% of Spanish respondents
thought the price to be low. The quality of Zara’s products divided opinions amongst
respondents from both countries. The statement was “In your opinion, Zara’s products
are of high quality”, and out of Finnish respondents 9.9% agreed, 50.5% partially
agreed, 19.8% partially disagreed, and 3.3 completely disagreed with the statement.
The majority of Spanish respondents (50%) also partially agreed, 7.1% agreed with it,
26.2% partially disagreed, and 4.8% completely disagreed with the statement. 16.5%
of Finnish and 11.9% of Spanish respondents answered, “I don’t know”. The majority
of Finnish (47.3%) and 26.2% of Spanish respondents thought that the price of Zara’s
products is mostly in correspondence to their quality, whereas 31% of Spanish re-
spondents stated the price of Zara products being slightly in correspondence to their
quality. Both Finnish (84.6%) and Spanish (90.5%) respondents preferred the clothing
department in Zara to its other departments.
When asked why would the respondents usually choose Zara, the most common rea-
sons for the Finns were just visiting the store but not having anything special in mind
(37.4%), having no specific reason to visit Zara as it is just a store amongst others
(25.3%), and because they liked the brand (18.7%). 11% of Finnish respondents
chose Zara because the respondents were familiar with Zara and its products that were
of high quality, and 7.7% chose Zara because they were looking for a specific item and
believed that Zara would have it. Looking for a specific item and believing that Zara
would have it was the most common reason for Spanish respondents (28.6%) to
choose Zara. 23.8% of Spanish respondents said they were just visiting the store with-
out having anything special in mind, and the same amount said Zara is just a store
amongst others so they would not have a specific reason to visit it. Being familiar with
32
Zara and thinking its products to be of high quality was the reason for 16.7% of Span-
ish respondents, and 7.1% stated their reason was because they liked the brand.
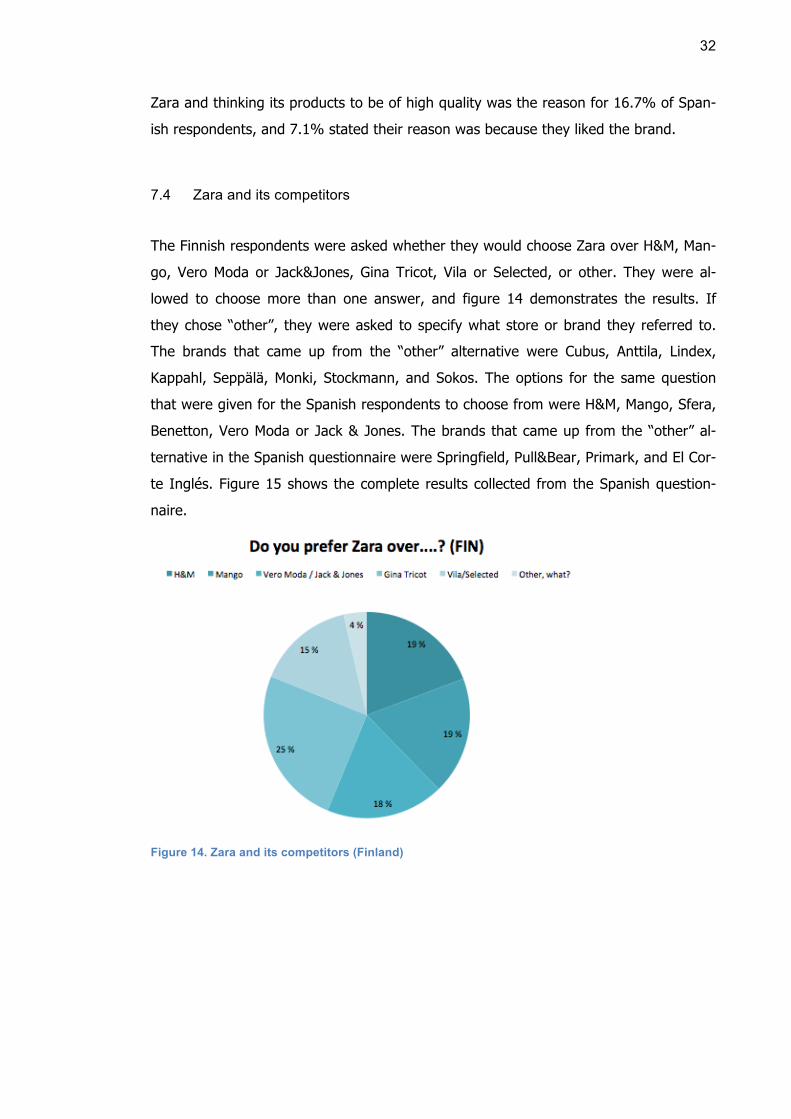
7.4 Zara and its competitors
The Finnish respondents were asked whether they would choose Zara over H&M, Man-
go, Vero Moda or Jack&Jones, Gina Tricot, Vila or Selected, or other. They were al-
lowed to choose more than one answer, and figure 14 demonstrates the results. If
they chose “other”, they were asked to specify what store or brand they referred to.
The brands that came up from the “other” alternative were Cubus, Anttila, Lindex,
Kappahl, Seppälä, Monki, Stockmann, and Sokos. The options for the same question
that were given for the Spanish respondents to choose from were H&M, Mango, Sfera,
Benetton, Vero Moda or Jack & Jones. The brands that came up from the “other” al-
ternative in the Spanish questionnaire were Springfield, Pull&Bear, Primark, and El Cor-
te Inglés. Figure 15 shows the complete results collected from the Spanish question-
naire.
Figure 14. Zara and its competitors (Finland)
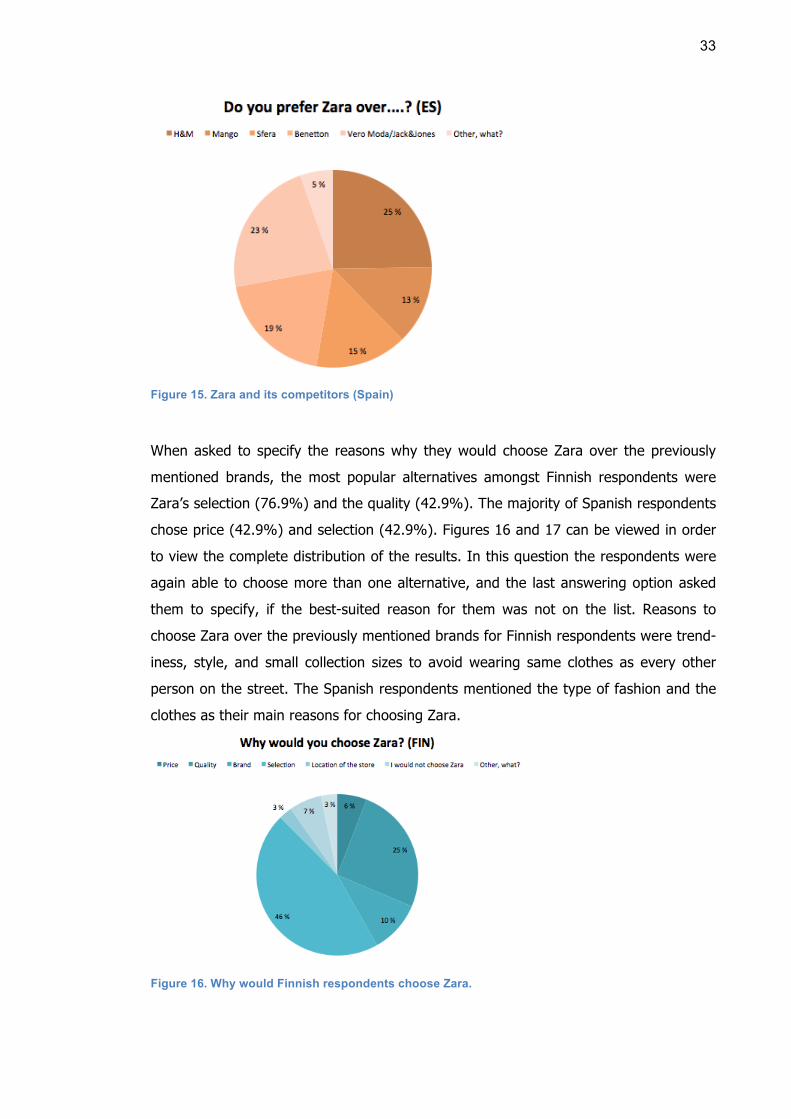
33
Figure 15. Zara and its competitors (Spain)
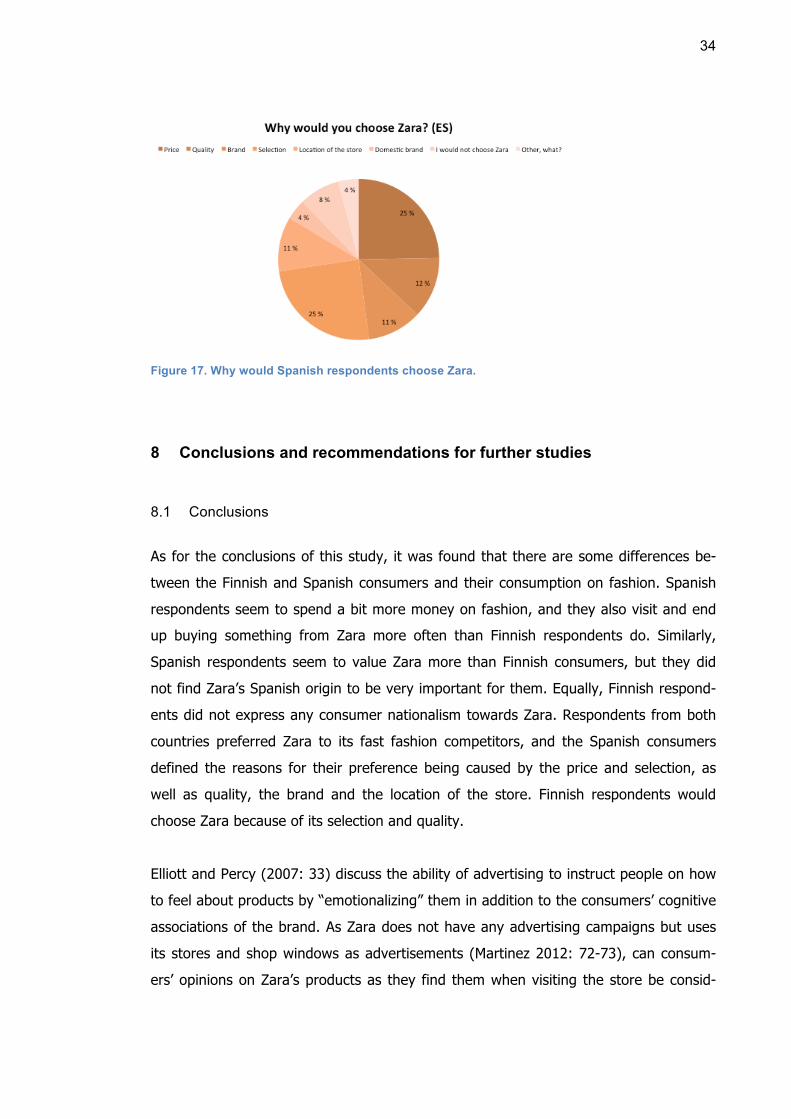
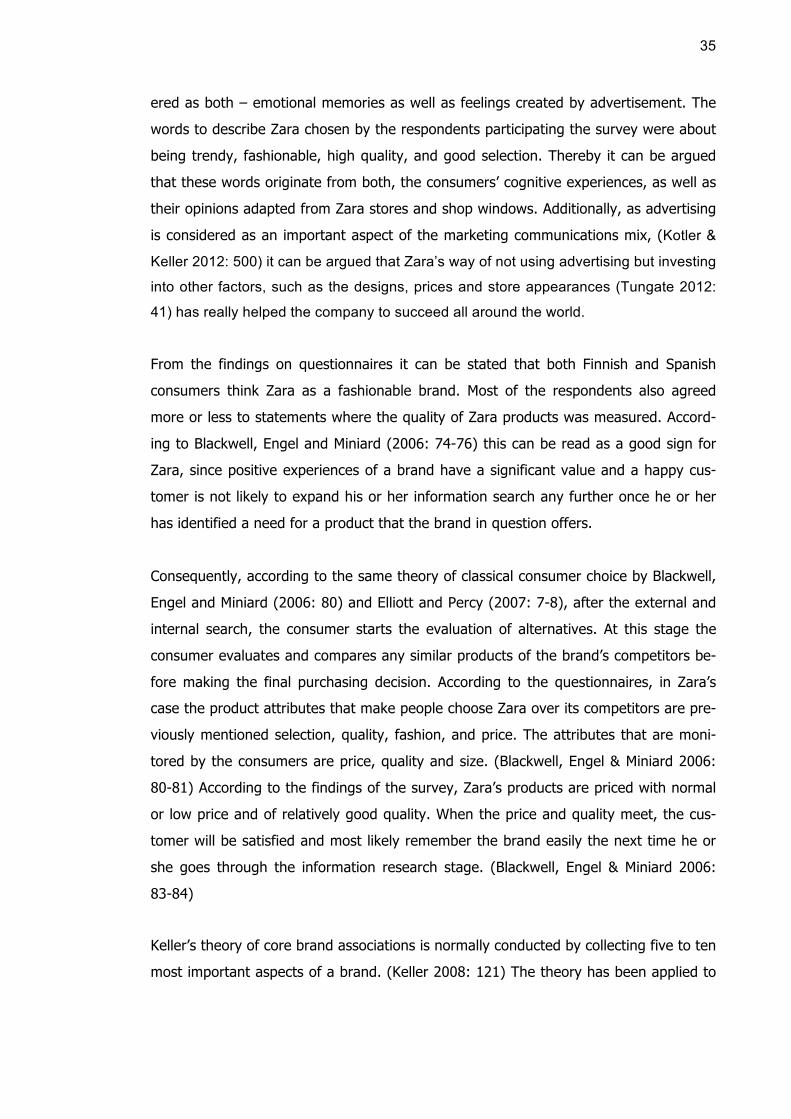
When asked to specify the reasons why they would choose Zara over the previously
mentioned brands, the most popular alternatives amongst Finnish respondents were
Zara’s selection (76.9%) and the quality (42.9%). The majority of Spanish respondents
chose price (42.9%) and selection (42.9%). Figures 16 and 17 can be viewed in order
to view the complete distribution of the results. In this question the respondents were
again able to choose more than one alternative, and the last answering option asked
them to specify, if the best-suited reason for them was not on the list. Reasons to
choose Zara over the previously mentioned brands for Finnish respondents were trend-
iness, style, and small collection sizes to avoid wearing same clothes as every other
person on the street. The Spanish respondents mentioned the type of fashion and the
clothes as their main reasons for choosing Zara.
Figure 16. Why would Finnish respondents choose Zara.
34
Figure 17. Why would Spanish respondents choose Zara.
8 Conclusions and recommendations for further studies
8.1 Conclusions
As for the conclusions of this study, it was found that there are some differences be-
tween the Finnish and Spanish consumers and their consumption on fashion. Spanish
respondents seem to spend a bit more money on fashion, and they also visit and end
up buying something from Zara more often than Finnish respondents do. Similarly,
Spanish respondents seem to value Zara more than Finnish consumers, but they did
not find Zara’s Spanish origin to be very important for them. Equally, Finnish respond-
ents did not express any consumer nationalism towards Zara. Respondents from both
countries preferred Zara to its fast fashion competitors, and the Spanish consumers
defined the reasons for their preference being caused by the price and selection, as
well as quality, the brand and the location of the store. Finnish respondents would
choose Zara because of its selection and quality.
Elliott and Percy (2007: 33) discuss the ability of advertising to instruct people on how
to feel about products by “emotionalizing” them in addition to the consumers’ cognitive
associations of the brand. As Zara does not have any advertising campaigns but uses
its stores and shop windows as advertisements (Martinez 2012: 72-73), can consum-
ers’ opinions on Zara’s products as they find them when visiting the store be consid-
35
ered as both – emotional memories as well as feelings created by advertisement. The
words to describe Zara chosen by the respondents participating the survey were about
being trendy, fashionable, high quality, and good selection. Thereby it can be argued
that these words originate from both, the consumers’ cognitive experiences, as well as
their opinions adapted from Zara stores and shop windows. Additionally, as advertising
is considered as an important aspect of the marketing communications mix, (Kotler &
Keller 2012: 500) it can be argued that Zara’s way of not using advertising but investing
into other factors, such as the designs, prices and store appearances (Tungate 2012:
41) has really helped the company to succeed all around the world.
From the findings on questionnaires it can be stated that both Finnish and Spanish
consumers think Zara as a fashionable brand. Most of the respondents also agreed
more or less to statements where the quality of Zara products was measured. Accord-
ing to Blackwell, Engel and Miniard (2006: 74-76) this can be read as a good sign for
Zara, since positive experiences of a brand have a significant value and a happy cus-
tomer is not likely to expand his or her information search any further once he or her
has identified a need for a product that the brand in question offers.
Consequently, according to the same theory of classical consumer choice by Blackwell,
Engel and Miniard (2006: 80) and Elliott and Percy (2007: 7-8), after the external and
internal search, the consumer starts the evaluation of alternatives. At this stage the
consumer evaluates and compares any similar products of the brand’s competitors be-
fore making the final purchasing decision. According to the questionnaires, in Zara’s
case the product attributes that make people choose Zara over its competitors are pre-
viously mentioned selection, quality, fashion, and price. The attributes that are moni-
tored by the consumers are price, quality and size. (Blackwell, Engel & Miniard 2006:
80-81) According to the findings of the survey, Zara’s products are priced with normal
or low price and of relatively good quality. When the price and quality meet, the cus-
tomer will be satisfied and most likely remember the brand easily the next time he or
she goes through the information research stage. (Blackwell, Engel & Miniard 2006:
83-84)
Keller’s theory of core brand associations is normally conducted by collecting five to ten
most important aspects of a brand. (Keller 2008: 121) The theory has been applied to
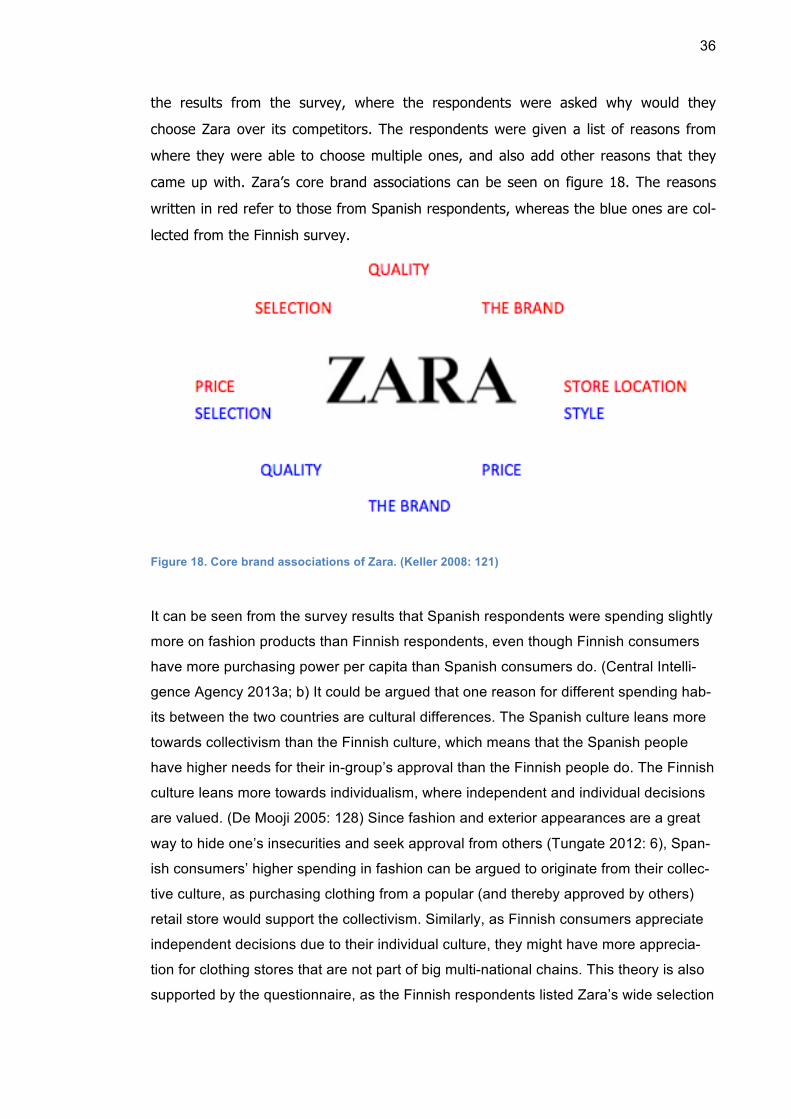
36
the results from the survey, where the respondents were asked why would they
choose Zara over its competitors. The respondents were given a list of reasons from
where they were able to choose multiple ones, and also add other reasons that they
came up with. Zara’s core brand associations can be seen on figure 18. The reasons
written in red refer to those from Spanish respondents, whereas the blue ones are col-
lected from the Finnish survey.
Figure 18. Core brand associations of Zara. (Keller 2008: 121)
It can be seen from the survey results that Spanish respondents were spending slightly
more on fashion products than Finnish respondents, even though Finnish consumers
have more purchasing power per capita than Spanish consumers do. (Central Intelli-
gence Agency 2013a; b) It could be argued that one reason for different spending hab-
its between the two countries are cultural differences. The Spanish culture leans more
towards collectivism than the Finnish culture, which means that the Spanish people
have higher needs for their in-group’s approval than the Finnish people do. The Finnish
culture leans more towards individualism, where independent and individual decisions
are valued. (De Mooji 2005: 128) Since fashion and exterior appearances are a great
way to hide one’s insecurities and seek approval from others (Tungate 2012: 6), Span-
ish consumers’ higher spending in fashion can be argued to originate from their collec-
tive culture, as purchasing clothing from a popular (and thereby approved by others)
retail store would support the collectivism. Similarly, as Finnish consumers appreciate
independent decisions due to their individual culture, they might have more apprecia-
tion for clothing stores that are not part of big multi-national chains. This theory is also
supported by the questionnaire, as the Finnish respondents listed Zara’s wide selection
37
as their number one option to visit the store. Zara’s selections are wide yet produced in
small proportions, and they change rapidly (Jobber 2010: 643), which might add Finn-
ish consumers interest towards Zara in comparison with its competitors. The question-
naire supports this, as Finnish respondents preferred Zara to other fast fashion retail
stores, as H&M, Gina Tricot, Mango, Vero Moda or Jack and Jones, and Vila.
8.2 Recommendations for further studies
There were a few themes arising during the research process that could be studied in
the future. The main theme was related to Hakala, Svensson, and Vincze’s (2012) find-
ings in their research, where Finnish consumers had neutral opinions about buying
domestically produced products. A recommended subject to research and study would
be a more detailed analysis about the Finnish consumers’ attitudes towards fast fash-
ion brands and their origins. Since all the major fast fashion brands in the Finnish mar-
kets are foreign, a study about Finnish consumers preferences in terms of the origin of
the brand would be a good subject to study.
38
References
Bhose, C. 2013. Stockmann eroon Zarasta Suomessa. Kauppalehti. [online] January
30, 2013. Available at:
http://www.kauppalehti.fi/etusivu/stockmann+eroon+zarasta+suomessa/201301350927
[Accessed on May 2 2013]
Blackwell, R.; Engel, J. and Miniard, P., 2006. Consumer Behavior. 10th ed. Mason: Thomson Higher Education. Brandchannel, 2013. Brandcareers – glossary. [online] Available at: http://www.brandchannel.com/education_glossary.asp [Accessed on March 25 2013] Calvo Domingo, D. and Calvo Porral, C., 2012. Sources of equity in fashion markets. [e-journal] Journal of Product & Brand Management, 21(6): 391–403. Available at: http://dx.doi.org/10.1108/10610421211264883 [Accessed on April 27, 2013] Central Intelligence Agency, 2013a. The world fact book: Spain. [online] Available at: https://www.cia.gov/library/publications/the-world-factbook/geos/sp.html [Accessed on May 2 2013] Central Intelligence Agency, 2013b. The world fact book: Finland. [online] Available at: https://www.cia.gov/library/publications/the-world-factbook/geos/fi.html [Accessed on May 2 2013] De Mooij, M., 2005. Global Marketing and Advertising: Understanding Cultural Para-doxes. 2nd ed. Thousand Oaks: Sage Publications, Inc. Elliott, R. and Percy, L., 2007. Strategic Brand Management. Oxford: Oxford University Press. Fisher, C. 2010. Researching and writing a dissertation – An essential guide for busi-ness students. 3rd edition. Harlow: Pearson Education Limited. Gap, Inc. 2013. About us – Key facts. [online] Available at: http://www.gapinc.com/content/gapinc/html/aboutus/keyfacts.html [Accessed on April 28, 2013] Guillén, F., 2011. El éxito internacional de Zara. El País. [online] July 17, 2011. Availa-ble at: http://elpais.com/diario/2011/07/17/negocio/1310907804_850215.html [Ac-cessed April 28, 2013] H&M, 2013. About H&M – Our markets. [online] Available at: http://about.hm.com/AboutSection/en/About/Facts-About-HM/About-HM/Sales-Markets.html [Accessed on April 28, 2013] Hakala, U., Svensson, J. and Vincze, Z., 2012. Consumer-based brand equity and top-of-mind awareness: a cross country analysis. [e-journal] Journal of Product & Brand
39
Management, 21 (6): 439-451. Available at: http://dx.doi.org/10.1108/10610421211264928 [Accessed on April 27, 2013] Hoyer, W. and MacInnis, D., 2008. Consumer Behavior. 5th ed. Mason: South Western Educational Publishing. Inditex Group, 2013a. Who we are – Our group. [online] Available at: http://www.inditex.com/en/who_we_are/our_group [Accessed on April 24, 2013] Inditex Group, 2013b. Who we are – Zara. [online] Available at: http://www.inditex.com/en/who_we_are/concepts/zara [Accessed on April 24, 2013] Inditex Group, 2013c. Who we are – Stores around the world. [online] Available at: http://www.inditex.es/en/who_we_are/stores/ [Accessed on April 28, 2013] Jobber, D., 2010. Principles and Practice of Marketing. 6th ed. Berkshire: McGraw-Hill Higher Education. Keller, K., 2008. Strategic Brand Management: Building, Measuring, and Managing Brand Equity. 3rd ed. Upper Saddle River: Pearson Education, Inc. Kotler, P. and Keller, K., 2012. Marketing Management. 14th ed. Harlow: Pearson Edu-cation Limited. Kytölä, A., 2013. Photos of Zara. [photograph] Laforet, S., 2010. Managing Brands. Berkshire: McGraw-Hill Higher Education. Lopez, C. and Fan, Y., 2009. Internationalisation of the Spanish fashion brand Zara. [e-journal] Journal of Fashion Marketing and Management, 13(6): 279-296. Available at: http://www.emeraldinsight.com/1361-2026.htm [Accessed on April 28, 2013] Lovemarks, 2013a. Lovemarks. [online] Available at: http://www.lovemarks.com/ [Ac-cessed on April 19, 2013] Lovemarks, 2013b. The Top 200 Lovemarks. [online] Available at: http://www.lovemarks.com/index.php?pageID=20015&additions=1&require=200 [Ac-cessed on April 19, 2013] Lovemarks, 2013c. Retail and Shopping Top 50. [online] Available at: http://www.lovemarks.com/index.php?pageID=20015&lmcategoryid=12&additions=2&require=100 [Accessed on April 19, 2013] Lovemarks, 2013d. About Lovemarks. [online] Available at: http://www.lovemarks.com/index.php?pageID=20020 [Accessed April 27, 2013] Lovemarks, 2013e. Zara. [online] Available at: http://www.lovemarks.com/index.php?pageID=20015&lovemarkid=1086 [Accessed April 28, 2013] Martinez, D., 2012. Zara – Visión y estrategia de AMANCIO ORTEGA. Barcelona: Conecta.
40
Roberts, K., 2004. Lovemarks: the Future Beyond Brands. New York: PowerHouse Books. Saunders, M., Lewis, P. and Thornhill, A., 2007. Research Methods for Business Stu-dents. 4th ed. Harlow: Pearson Education Limited. The Limited, 2013. The Limited Store Locator. [online] Available at: http://www.thelimited.com/on/demandware.store/Sites-ltd-Site/default/Stores-Find [Ac-cessed April 28, 2013] Tungate, M., 2012. Fashion Brands – Branding style from Armani to Zara. 3rd ed. Lon-don: Kogan Page Limited.
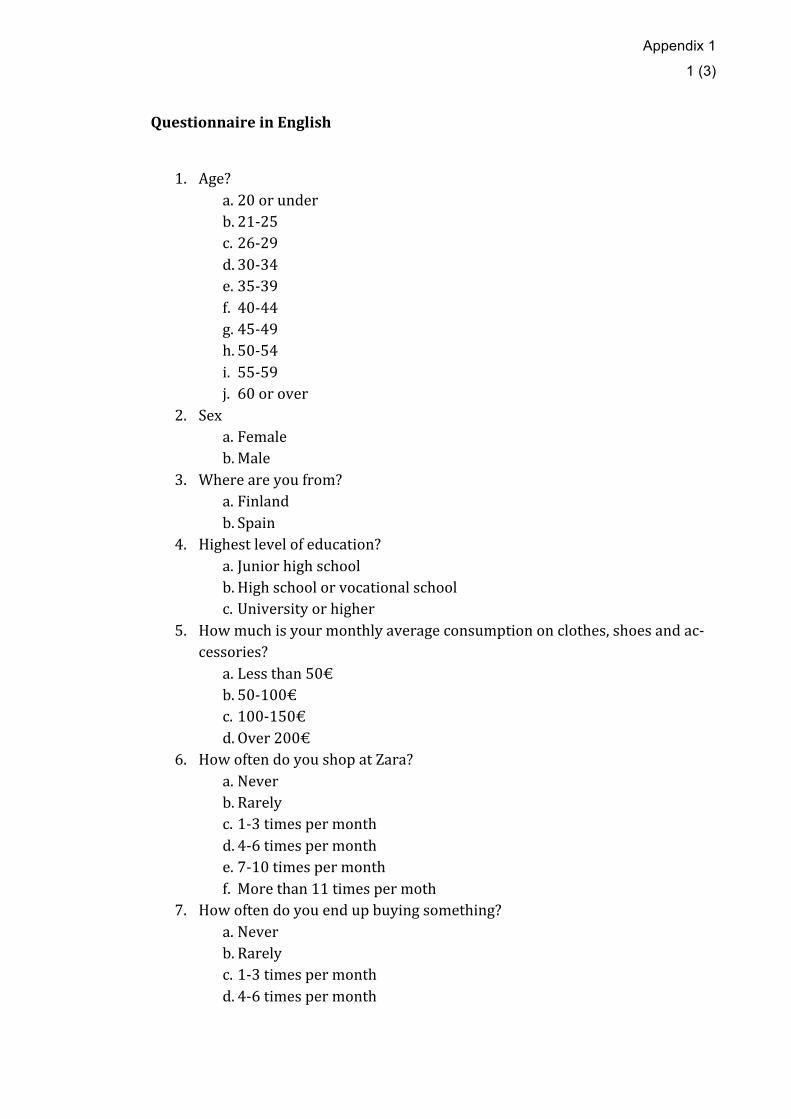
Appendix 1
1 (3)
Questionnaire in English
1. Age? a. 20 or under b. 21-‐25 c. 26-‐29 d. 30-‐34 e. 35-‐39 f. 40-‐44 g. 45-‐49 h. 50-‐54 i. 55-‐59 j. 60 or over
2. Sex a. Female b. Male
3. Where are you from? a. Finland b. Spain
4. Highest level of education? a. Junior high school b. High school or vocational school c. University or higher
5. How much is your monthly average consumption on clothes, shoes and ac-‐cessories?
a. Less than 50€ b. 50-‐100€ c. 100-‐150€ d. Over 200€
6. How often do you shop at Zara? a. Never b. Rarely c. 1-‐3 times per month d. 4-‐6 times per month e. 7-‐10 times per month f. More than 11 times per moth
7. How often do you end up buying something? a. Never b. Rarely c. 1-‐3 times per month d. 4-‐6 times per month
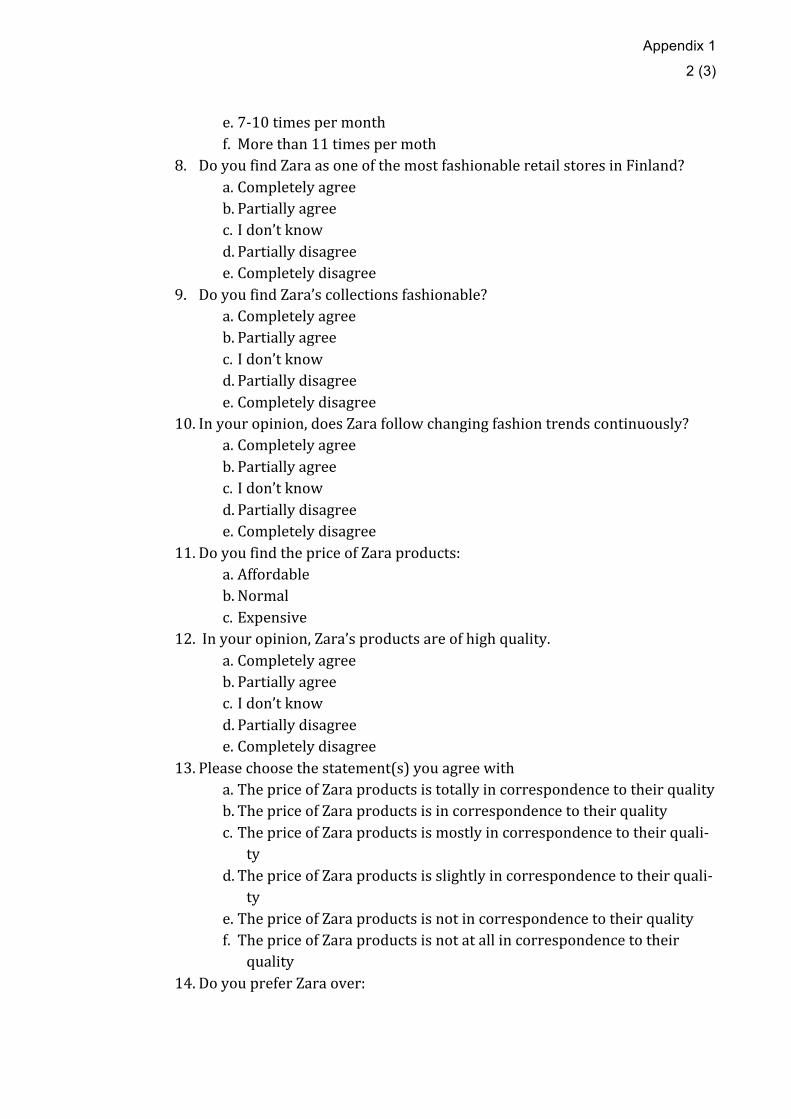
Appendix 1
2 (3)
e. 7-‐10 times per month f. More than 11 times per moth
8. Do you find Zara as one of the most fashionable retail stores in Finland? a. Completely agree b. Partially agree c. I don’t know d. Partially disagree e. Completely disagree
9. Do you find Zara’s collections fashionable? a. Completely agree b. Partially agree c. I don’t know d. Partially disagree e. Completely disagree
10. In your opinion, does Zara follow changing fashion trends continuously? a. Completely agree b. Partially agree c. I don’t know d. Partially disagree e. Completely disagree
11. Do you find the price of Zara products: a. Affordable b. Normal c. Expensive
12. In your opinion, Zara’s products are of high quality. a. Completely agree b. Partially agree c. I don’t know d. Partially disagree e. Completely disagree
13. Please choose the statement(s) you agree with a. The price of Zara products is totally in correspondence to their quality b. The price of Zara products is in correspondence to their quality c. The price of Zara products is mostly in correspondence to their quali-‐
ty d. The price of Zara products is slightly in correspondence to their quali-‐
ty e. The price of Zara products is not in correspondence to their quality f. The price of Zara products is not at all in correspondence to their
quality 14. Do you prefer Zara over:
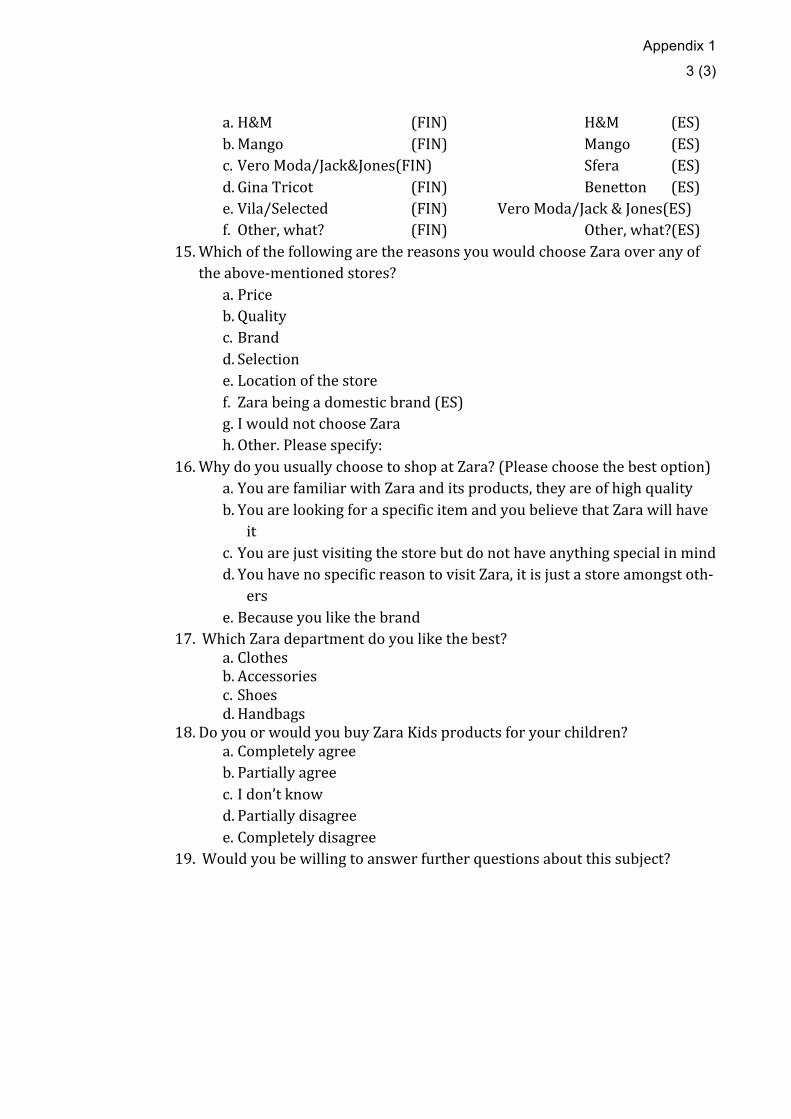
Appendix 1
3 (3)
a. H&M (FIN) H&M (ES) b. Mango (FIN) Mango (ES) c. Vero Moda/Jack&Jones(FIN) Sfera (ES) d. Gina Tricot (FIN) Benetton (ES) e. Vila/Selected (FIN) Vero Moda/Jack & Jones(ES) f. Other, what? (FIN) Other, what?(ES)
15. Which of the following are the reasons you would choose Zara over any of the above-‐mentioned stores?
a. Price b. Quality c. Brand d. Selection e. Location of the store f. Zara being a domestic brand (ES) g. I would not choose Zara h. Other. Please specify:
16. Why do you usually choose to shop at Zara? (Please choose the best option) a. You are familiar with Zara and its products, they are of high quality b. You are looking for a specific item and you believe that Zara will have
it c. You are just visiting the store but do not have anything special in mind d. You have no specific reason to visit Zara, it is just a store amongst oth-‐
ers e. Because you like the brand
17. Which Zara department do you like the best? a. Clothes b. Accessories c. Shoes d. Handbags
18. Do you or would you buy Zara Kids products for your children? a. Completely agree b. Partially agree c. I don’t know d. Partially disagree e. Completely disagree
19. Would you be willing to answer further questions about this subject?
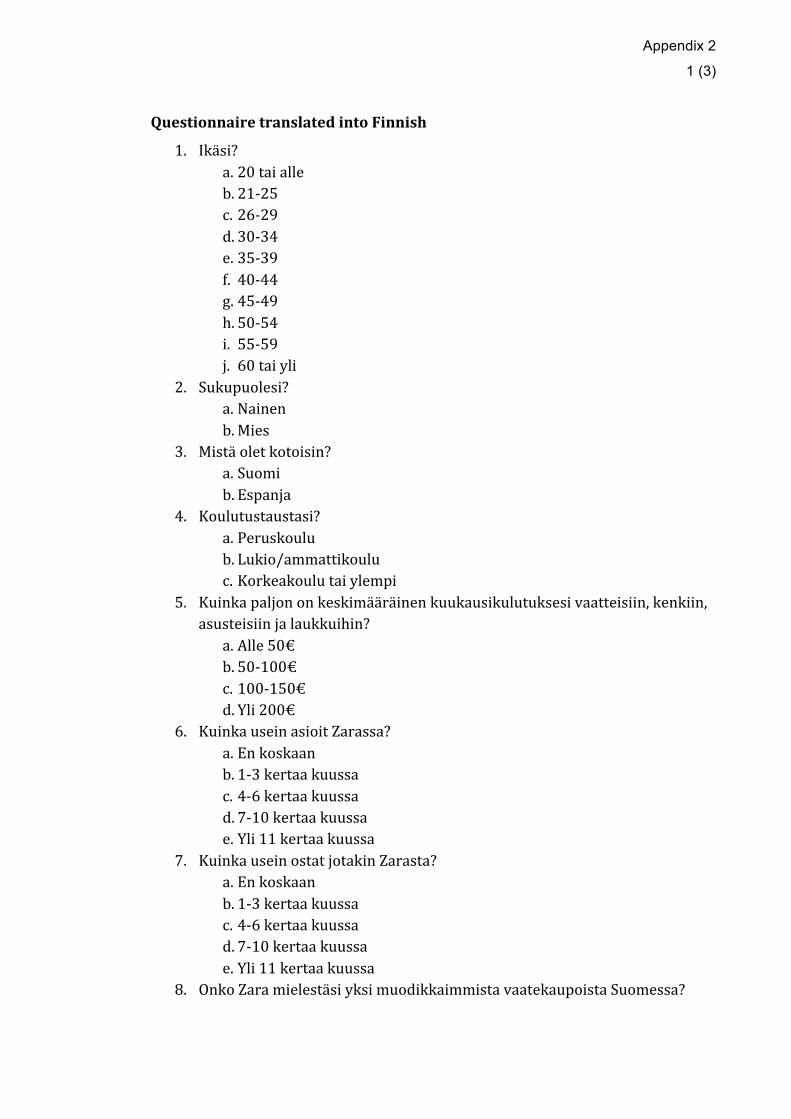
Appendix 2
1 (3)
Questionnaire translated into Finnish
1. Ikäsi? a. 20 tai alle b. 21-‐25 c. 26-‐29 d. 30-‐34 e. 35-‐39 f. 40-‐44 g. 45-‐49 h. 50-‐54 i. 55-‐59 j. 60 tai yli
2. Sukupuolesi? a. Nainen b. Mies
3. Mistä olet kotoisin? a. Suomi b. Espanja
4. Koulutustaustasi? a. Peruskoulu b. Lukio/ammattikoulu c. Korkeakoulu tai ylempi
5. Kuinka paljon on keskimääräinen kuukausikulutuksesi vaatteisiin, kenkiin, asusteisiin ja laukkuihin?
a. Alle 50€ b. 50-‐100€ c. 100-‐150€ d. Yli 200€
6. Kuinka usein asioit Zarassa? a. En koskaan b. 1-‐3 kertaa kuussa c. 4-‐6 kertaa kuussa d. 7-‐10 kertaa kuussa e. Yli 11 kertaa kuussa
7. Kuinka usein ostat jotakin Zarasta? a. En koskaan b. 1-‐3 kertaa kuussa c. 4-‐6 kertaa kuussa d. 7-‐10 kertaa kuussa e. Yli 11 kertaa kuussa
8. Onko Zara mielestäsi yksi muodikkaimmista vaatekaupoista Suomessa?
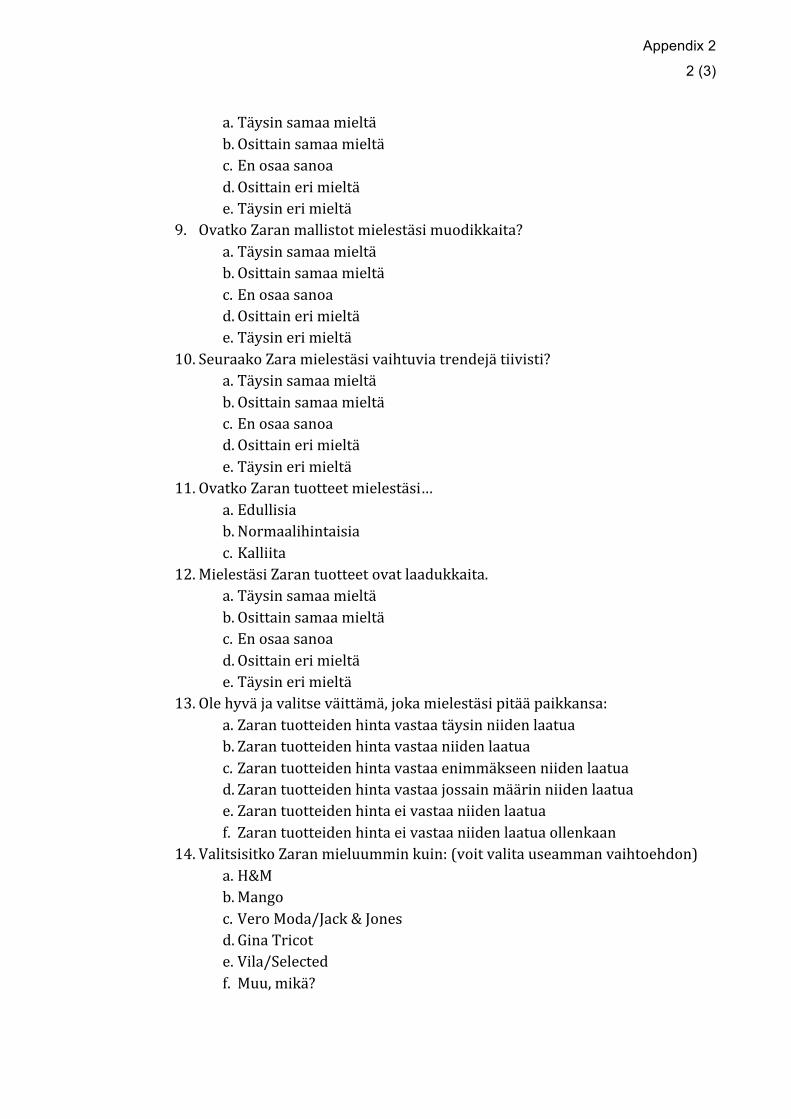
Appendix 2
2 (3)
a. Täysin samaa mieltä b. Osittain samaa mieltä c. En osaa sanoa d. Osittain eri mieltä e. Täysin eri mieltä
9. Ovatko Zaran mallistot mielestäsi muodikkaita? a. Täysin samaa mieltä b. Osittain samaa mieltä c. En osaa sanoa d. Osittain eri mieltä e. Täysin eri mieltä
10. Seuraako Zara mielestäsi vaihtuvia trendejä tiivisti? a. Täysin samaa mieltä b. Osittain samaa mieltä c. En osaa sanoa d. Osittain eri mieltä e. Täysin eri mieltä
11. Ovatko Zaran tuotteet mielestäsi… a. Edullisia b. Normaalihintaisia c. Kalliita
12. Mielestäsi Zaran tuotteet ovat laadukkaita. a. Täysin samaa mieltä b. Osittain samaa mieltä c. En osaa sanoa d. Osittain eri mieltä e. Täysin eri mieltä
13. Ole hyvä ja valitse väittämä, joka mielestäsi pitää paikkansa: a. Zaran tuotteiden hinta vastaa täysin niiden laatua b. Zaran tuotteiden hinta vastaa niiden laatua c. Zaran tuotteiden hinta vastaa enimmäkseen niiden laatua d. Zaran tuotteiden hinta vastaa jossain määrin niiden laatua e. Zaran tuotteiden hinta ei vastaa niiden laatua f. Zaran tuotteiden hinta ei vastaa niiden laatua ollenkaan
14. Valitsisitko Zaran mieluummin kuin: (voit valita useamman vaihtoehdon) a. H&M b. Mango c. Vero Moda/Jack & Jones d. Gina Tricot e. Vila/Selected f. Muu, mikä?
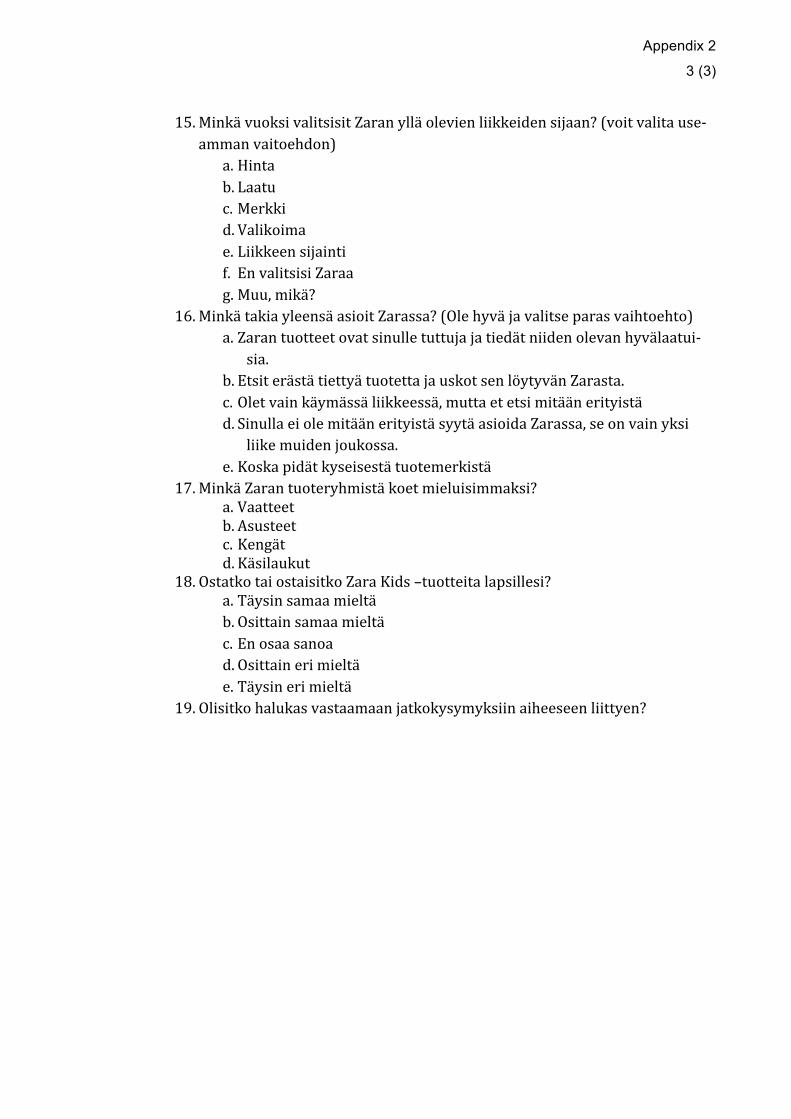
Appendix 2
3 (3)
15. Minkä vuoksi valitsisit Zaran yllä olevien liikkeiden sijaan? (voit valita use-‐amman vaitoehdon)
a. Hinta b. Laatu c. Merkki d. Valikoima e. Liikkeen sijainti f. En valitsisi Zaraa g. Muu, mikä?
16. Minkä takia yleensä asioit Zarassa? (Ole hyvä ja valitse paras vaihtoehto) a. Zaran tuotteet ovat sinulle tuttuja ja tiedät niiden olevan hyvälaatui-‐
sia. b. Etsit erästä tiettyä tuotetta ja uskot sen löytyvän Zarasta. c. Olet vain käymässä liikkeessä, mutta et etsi mitään erityistä d. Sinulla ei ole mitään erityistä syytä asioida Zarassa, se on vain yksi
liike muiden joukossa. e. Koska pidät kyseisestä tuotemerkistä
17. Minkä Zaran tuoteryhmistä koet mieluisimmaksi? a. Vaatteet b. Asusteet c. Kengät d. Käsilaukut
18. Ostatko tai ostaisitko Zara Kids –tuotteita lapsillesi? a. Täysin samaa mieltä b. Osittain samaa mieltä c. En osaa sanoa d. Osittain eri mieltä e. Täysin eri mieltä
19. Olisitko halukas vastaamaan jatkokysymyksiin aiheeseen liittyen?
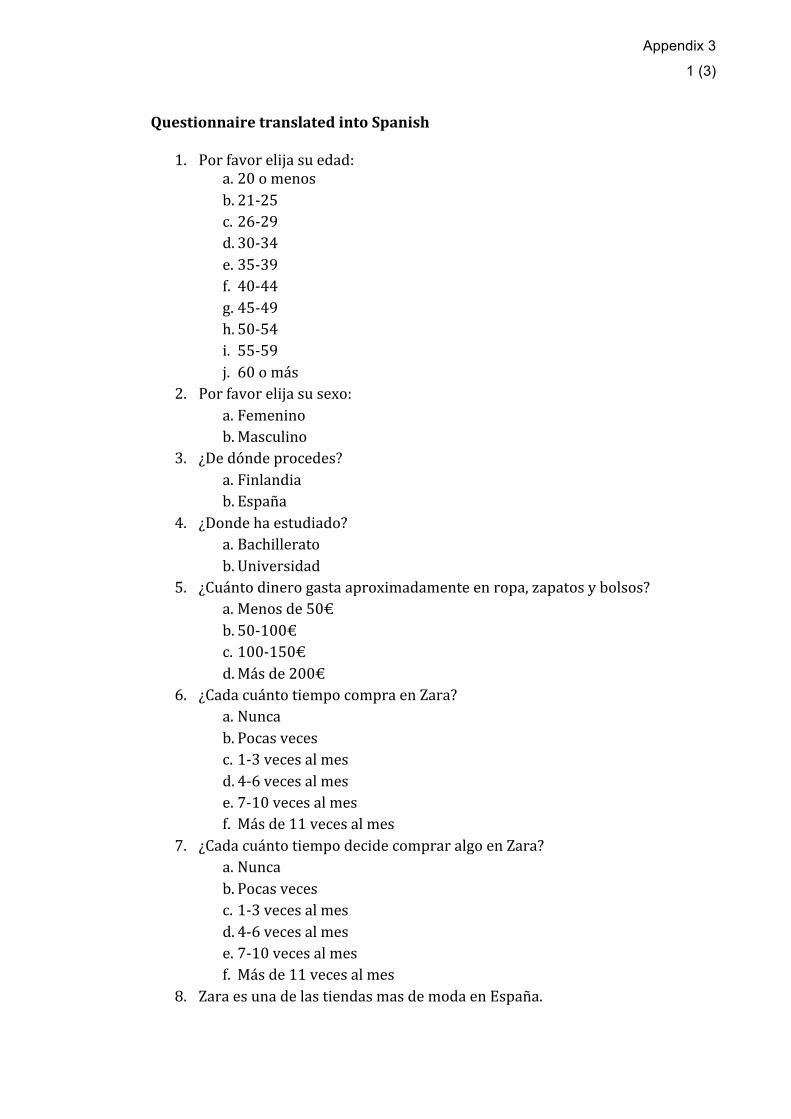
Appendix 3
1 (3)
Questionnaire translated into Spanish
1. Por favor elija su edad: a. 20 o menos b. 21-‐25 c. 26-‐29 d. 30-‐34 e. 35-‐39 f. 40-‐44 g. 45-‐49 h. 50-‐54 i. 55-‐59 j. 60 o más
2. Por favor elija su sexo: a. Femenino b. Masculino
3. ¿De dónde procedes? a. Finlandia b. España
4. ¿Donde ha estudiado? a. Bachillerato b. Universidad
5. ¿Cuánto dinero gasta aproximadamente en ropa, zapatos y bolsos? a. Menos de 50€ b. 50-‐100€ c. 100-‐150€ d. Más de 200€
6. ¿Cada cuánto tiempo compra en Zara? a. Nunca b. Pocas veces c. 1-‐3 veces al mes d. 4-‐6 veces al mes e. 7-‐10 veces al mes f. Más de 11 veces al mes
7. ¿Cada cuánto tiempo decide comprar algo en Zara? a. Nunca b. Pocas veces c. 1-‐3 veces al mes d. 4-‐6 veces al mes e. 7-‐10 veces al mes f. Más de 11 veces al mes
8. Zara es una de las tiendas mas de moda en España.
Appendix 3
2 (3)
a. Estoy completamente de acuerdo b. Estoy parcialmente de acuerdo c. No sé d. Estoy parcialmente en desacuerdo e. Estoy completamente en desacuerdo
9. Las colecciones de Zara están a actualizadas de acuerdo con la moda. a. Estoy completamente de acuerdo b. Estoy parcialmente de acuerdo c. No sé d. Estoy parcialmente en desacuerdo e. Estoy completamente en desacuerdo
10. Zara se adapta continuamente a la moda. a. Estoy completamente de acuerdo b. Estoy parcialmente de acuerdo c. No sé d. Estoy parcialmente en desacuerdo e. Estoy completamente en desacuerdo
11. Piensa que los productos de Zara se encuentran… a. A un precio bajo b. A un precio normal c. A un precio alto
12. Los productos de Zara son de alta calidad. a. Estoy completamente de acuerdo b. Estoy parcialmente de acuerdo c. No sé d. Estoy parcialmente en desacuerdo e. Estoy completamente en desacuerdo
13. Por favor elija la afirmación más valida: a. El precio de los productos de Zara corresponde directamente con su
calidad b. El precio de los productos de Zara se corresponde con su calidad c. El precio de los productos de Zara se corresponde principalmente con
su calidad d. El precio de los productos de Zara se corresponde más o menos con su
calidad e. El precio de los productos de Zara no corresponde con su calidad f. El precio de los productos de Zara no corresponde en nada con su ca-‐
lidad 14. Prefiere usted Zara en vez de: (se puede elegir más de una alternativa)
a. H&M b. Mango
Appendix 3
3 (3)
c. Sfera d. Benetton e. Vero Moda / Jack&Jones f. Otro, cuál?
15. ¿Por qué prefiere Zara en vez de las otras opciones que están en la pregunta anterior? (se puede elegir más de una opción)
a. Precio b. Calidad c. La marca d. Selección e. La localización de la tienda f. Porque Zara es una marca nacional g. No prefiero Zara h. Otro, cuál?
16. ¿Por qué razón hace usted compras en Zara habitualmente? (Por favor elija la mejor opción)
a. Los productos de Zara son familiares para usted y sabe que son de ca-‐lidad
b. Busca usted solo un producto en concreto y cree que lo venden en Za-‐ra
c. Visita la tienda pero no busca nada en particular d. No tiene una razón particular, solamente es una tienda entre otras e. Porque le gusta la marca en particular
17. ¿Qué departamento prefiere? a. Ropa b. Complementos c. Zapatos d. Bolsos
18. ¿Compra o compraría usted los productos de Zara Kids para sus hijos? a. Estoy completamente de acuerdo b. Estoy parcialmente de acuerdo c. No sé d. Estoy parcialmente en desacuerdo e. Estoy completamente en desacuerdo
19. ¿Tiene ganas de contestar a unas preguntas más sobre la tema?
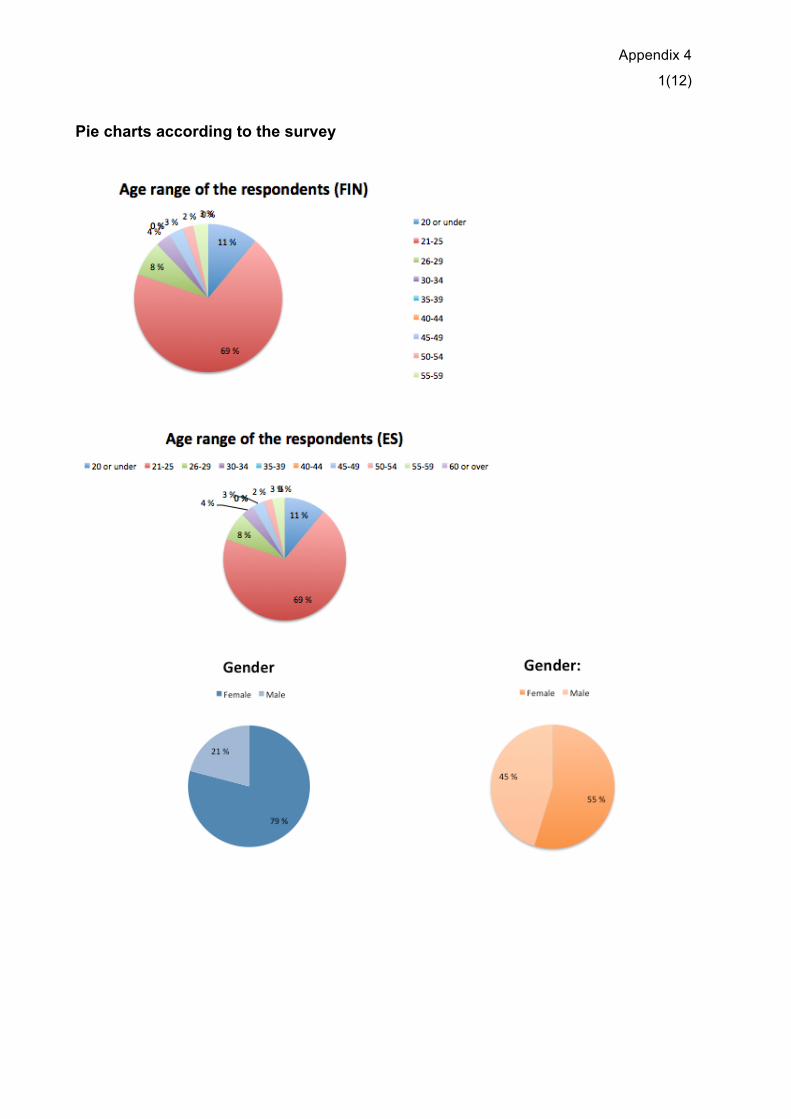
Appendix 4
1(12)
Pie charts according to the survey
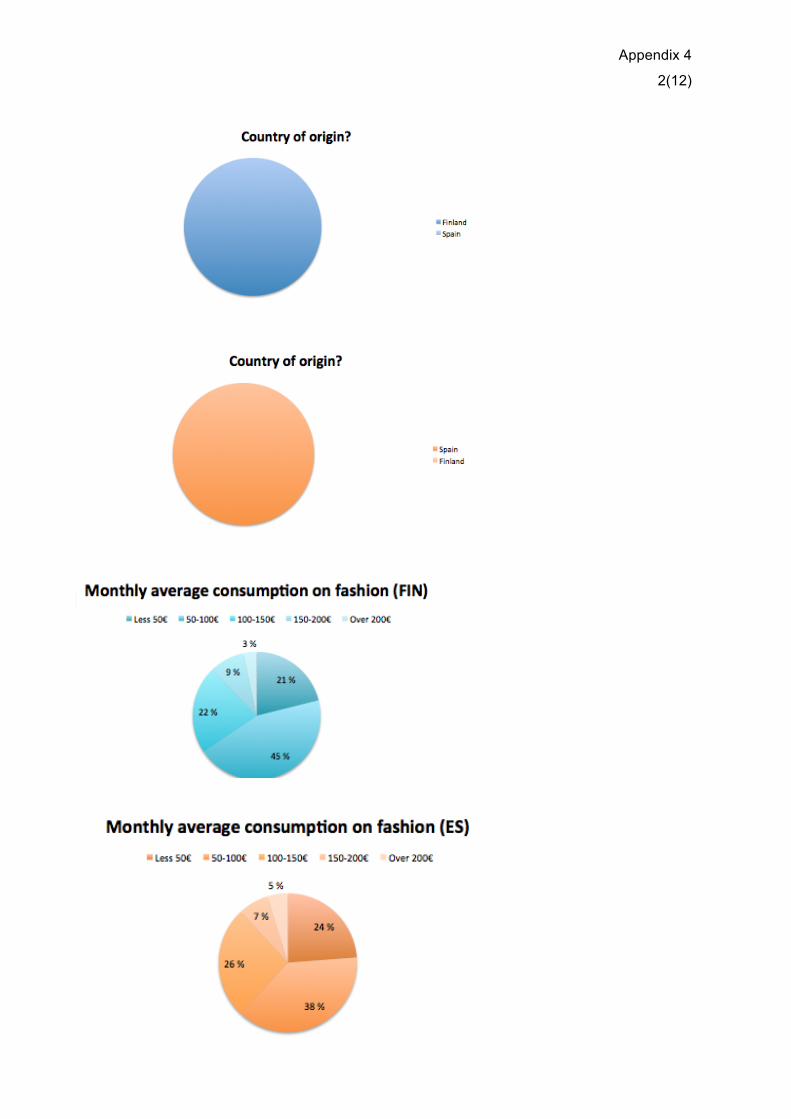
Appendix 4
2(12)
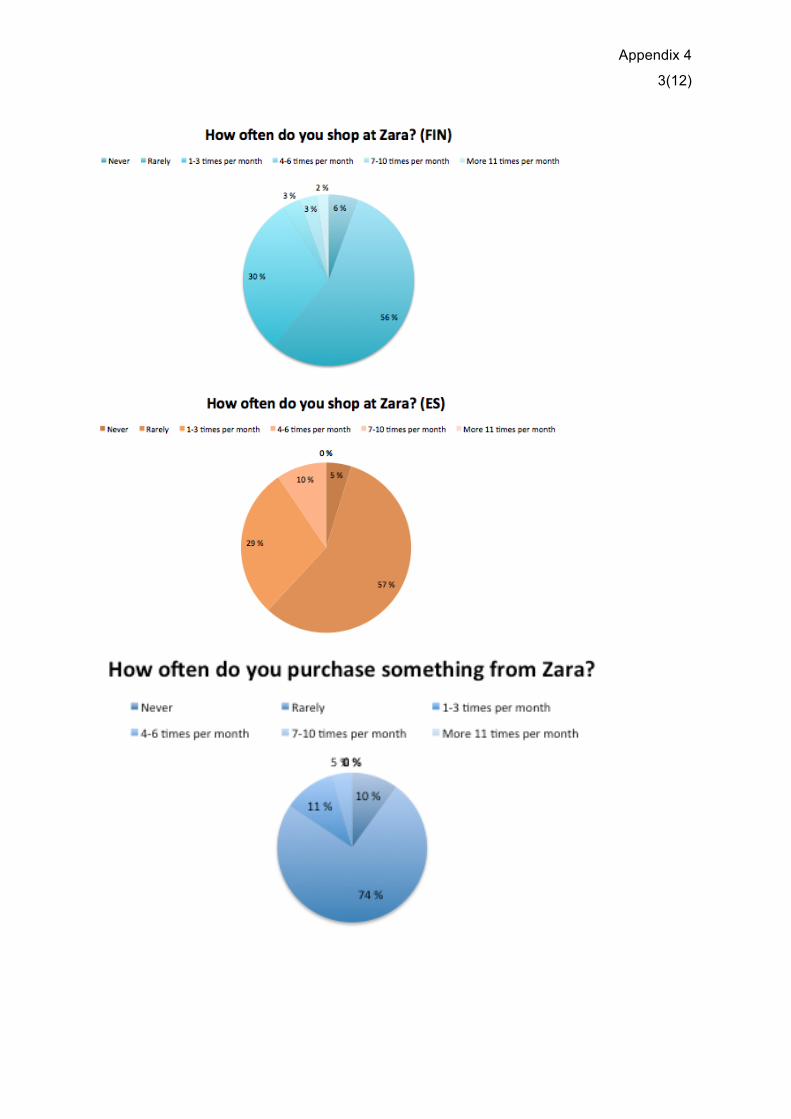
Appendix 4
3(12)
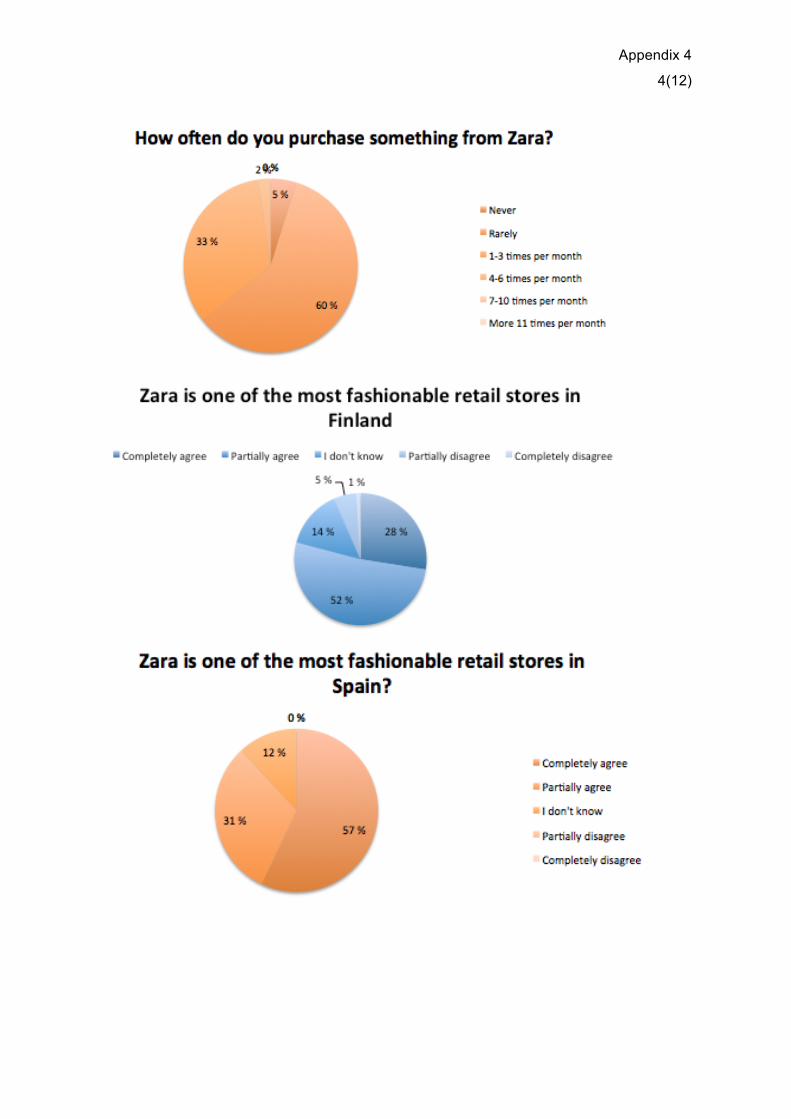
Appendix 4
4(12)
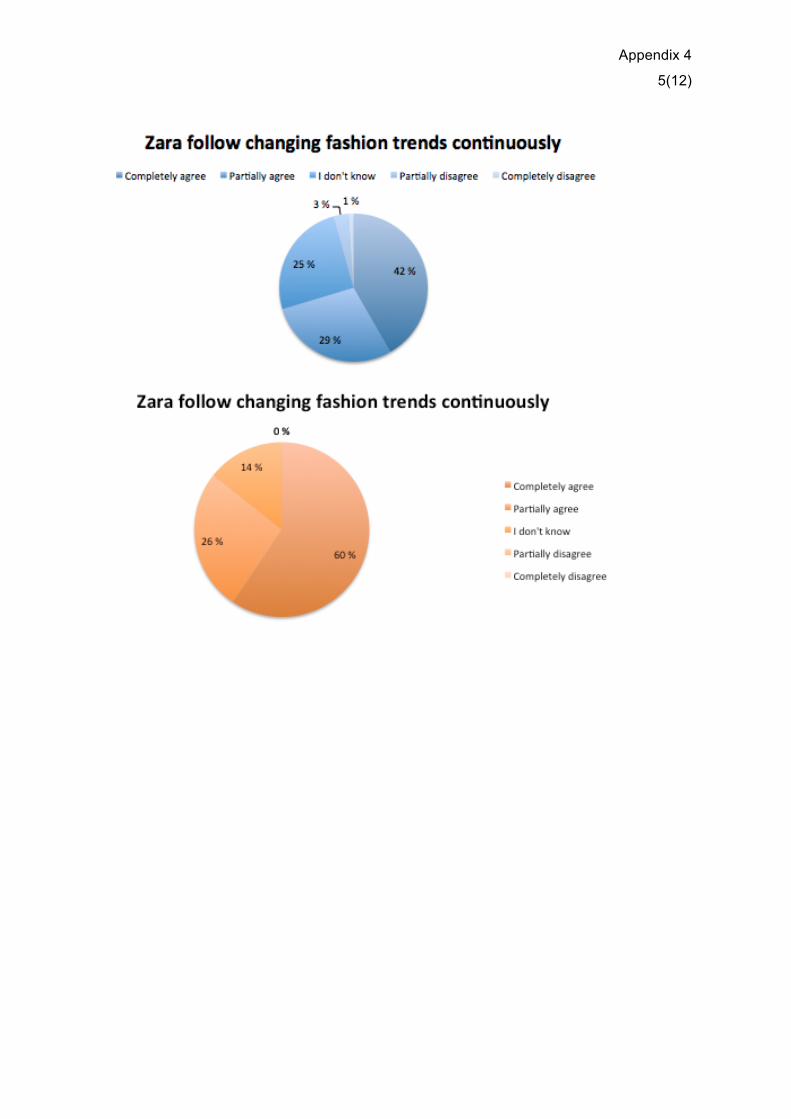
Appendix 4
5(12)
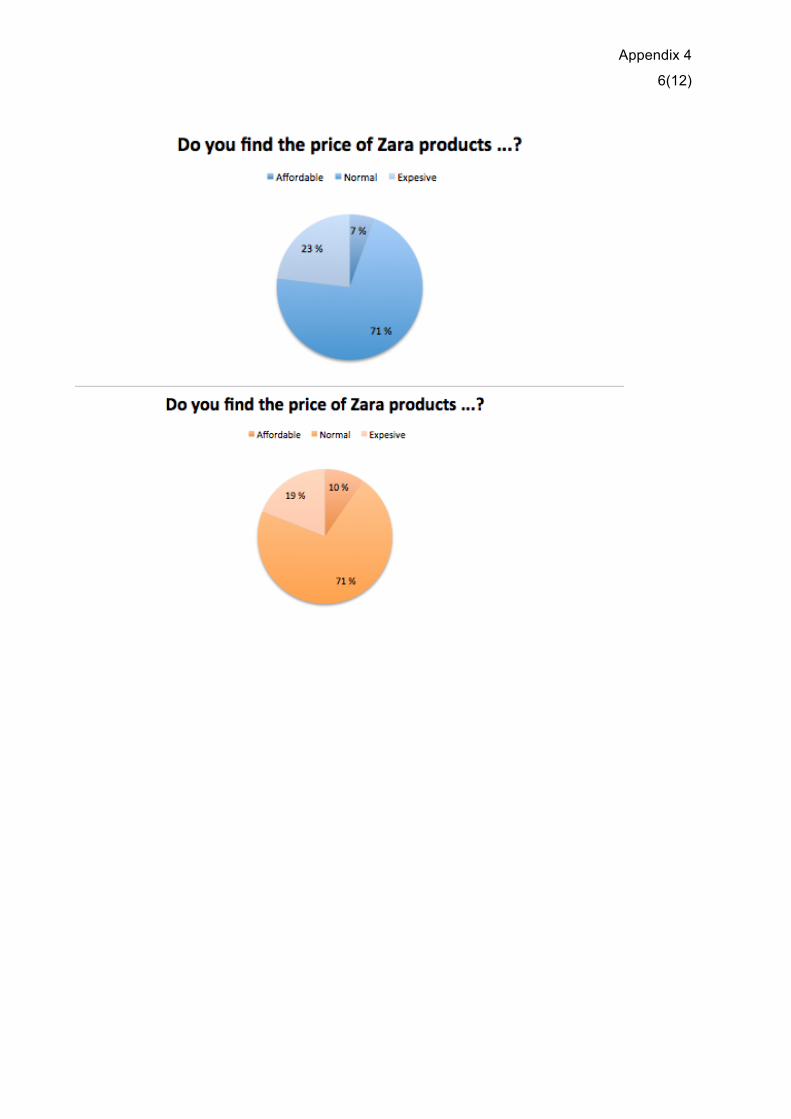
Appendix 4
6(12)
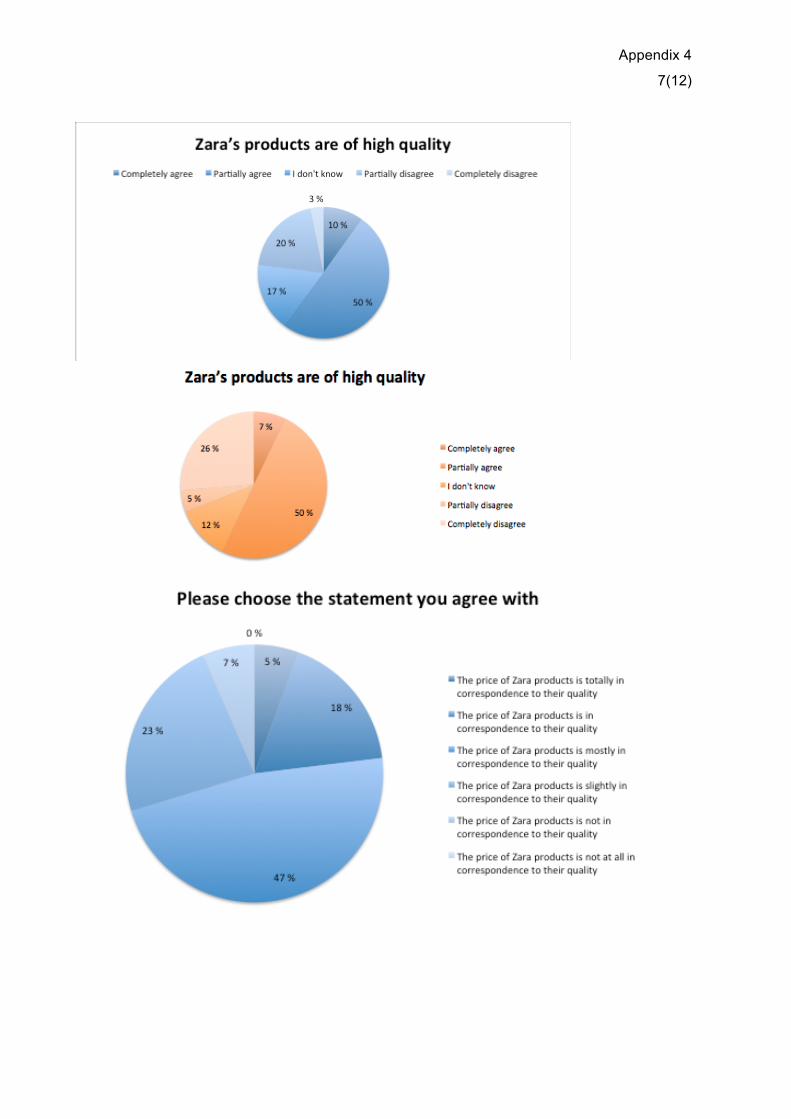
Appendix 4
7(12)
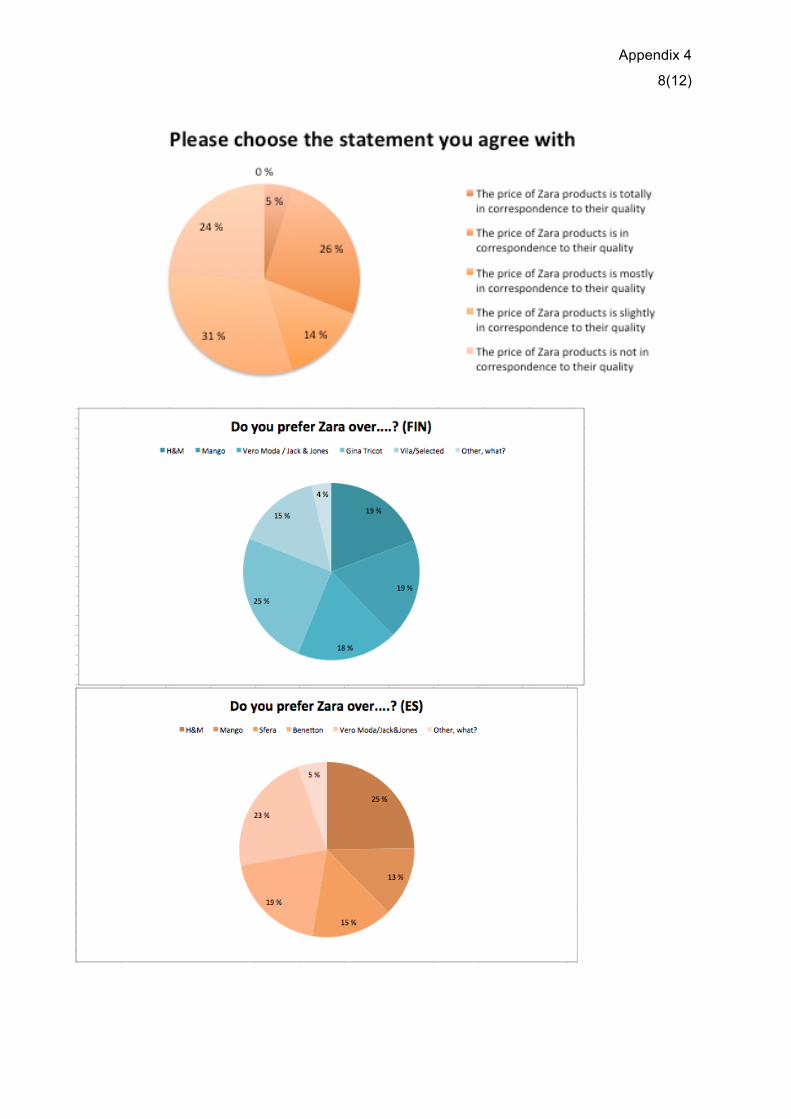
Appendix 4
8(12)
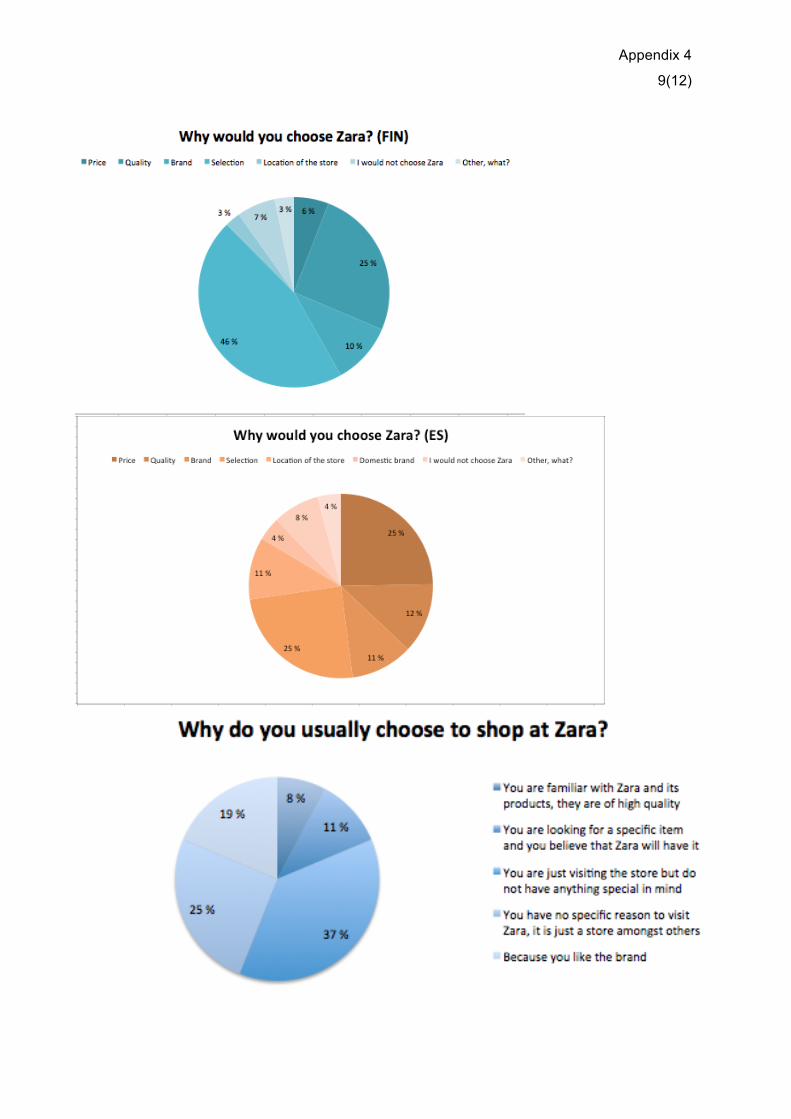
Appendix 4
9(12)
!
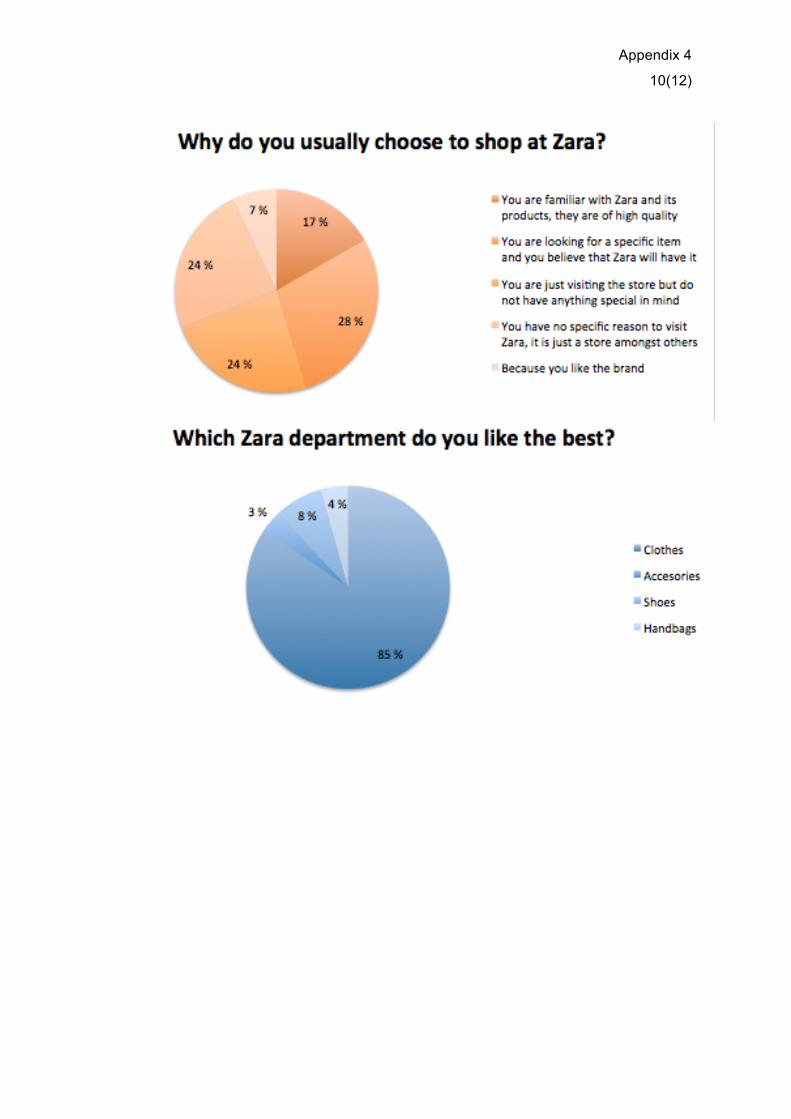
Appendix 4
10(12)
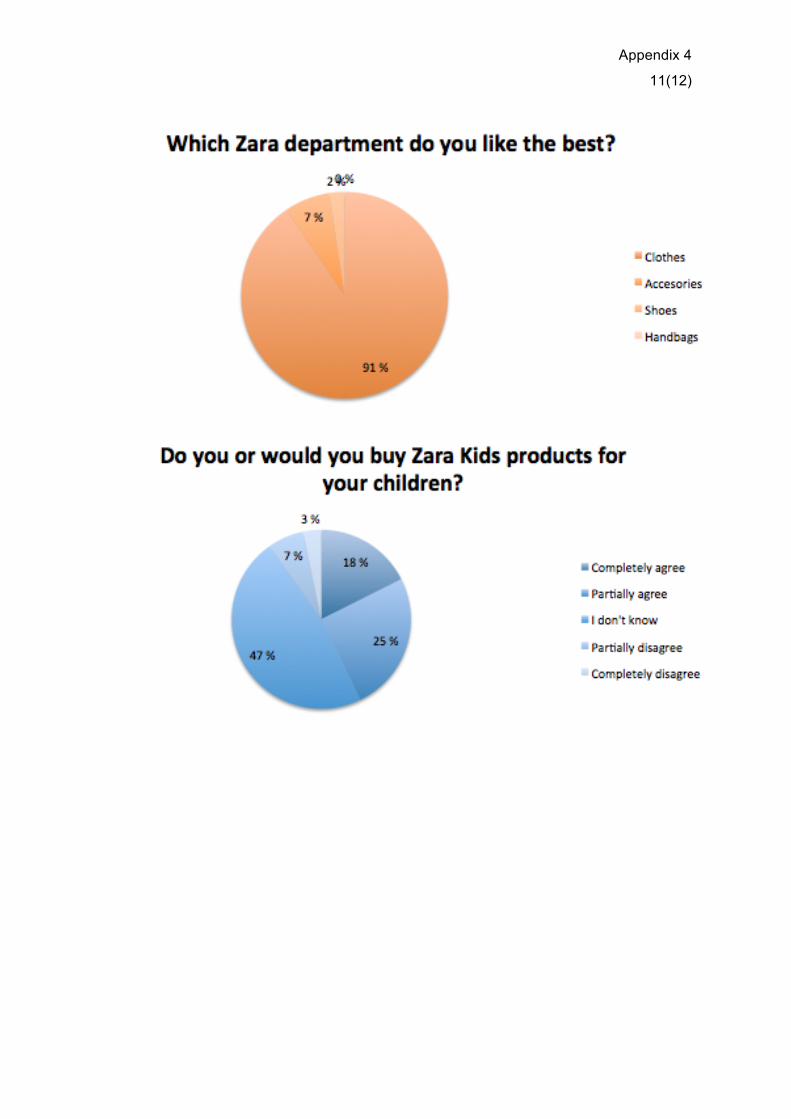
Appendix 4
11(12)
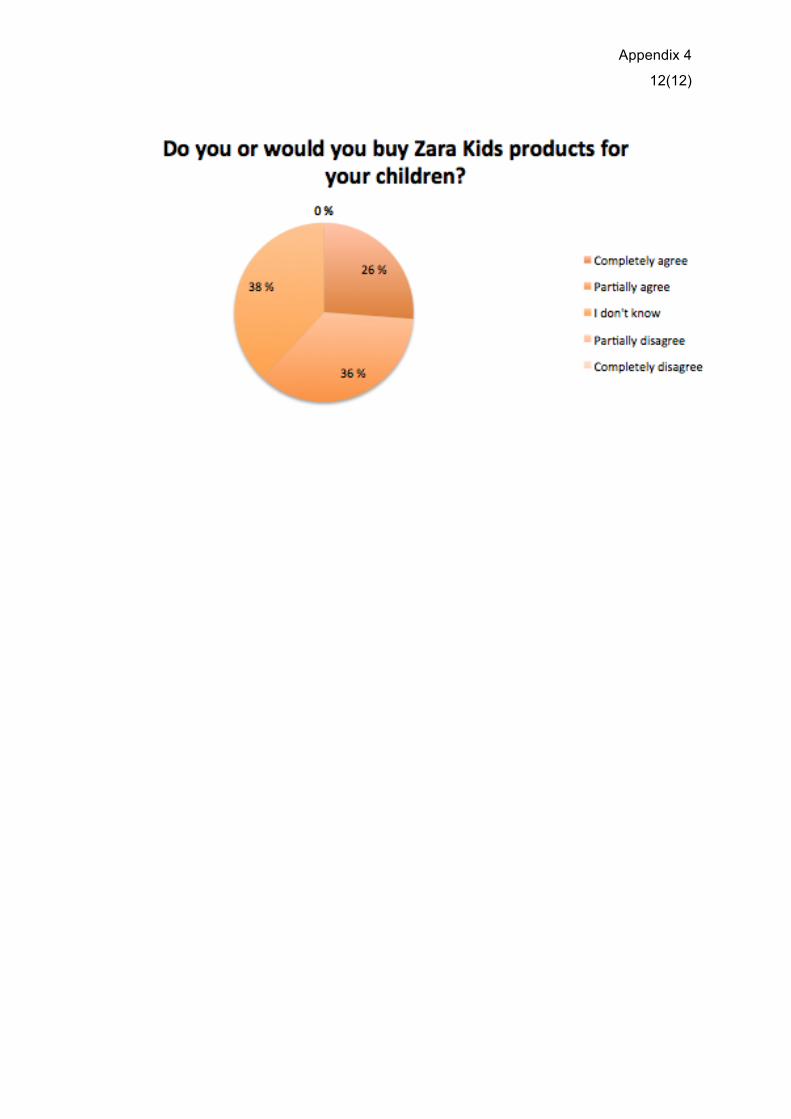
Appendix 4
12(12)