Embed Size (px)
Citation preview
7/29/2019 Divisions En
http://slidepdf.com/reader/full/divisions-en 1/14
86
business lines and markets
With our multi-brand strategy, we addresshighly diverse customer groups
Financial Services Division
Volkswagenbrand group
VW Passenger
Cars
S ˇ koda
Bentley
Bugatti
Audibrand group
Audi
SEAT
Lamborghini
CommercialVehicles
Remainingcompanies
Financing
Services
FinancialServices
Dealer and
customer
financing
Leasing
Insurance
Fleet business
Europcar
Rental business
Business Line
Product Line/Business Field
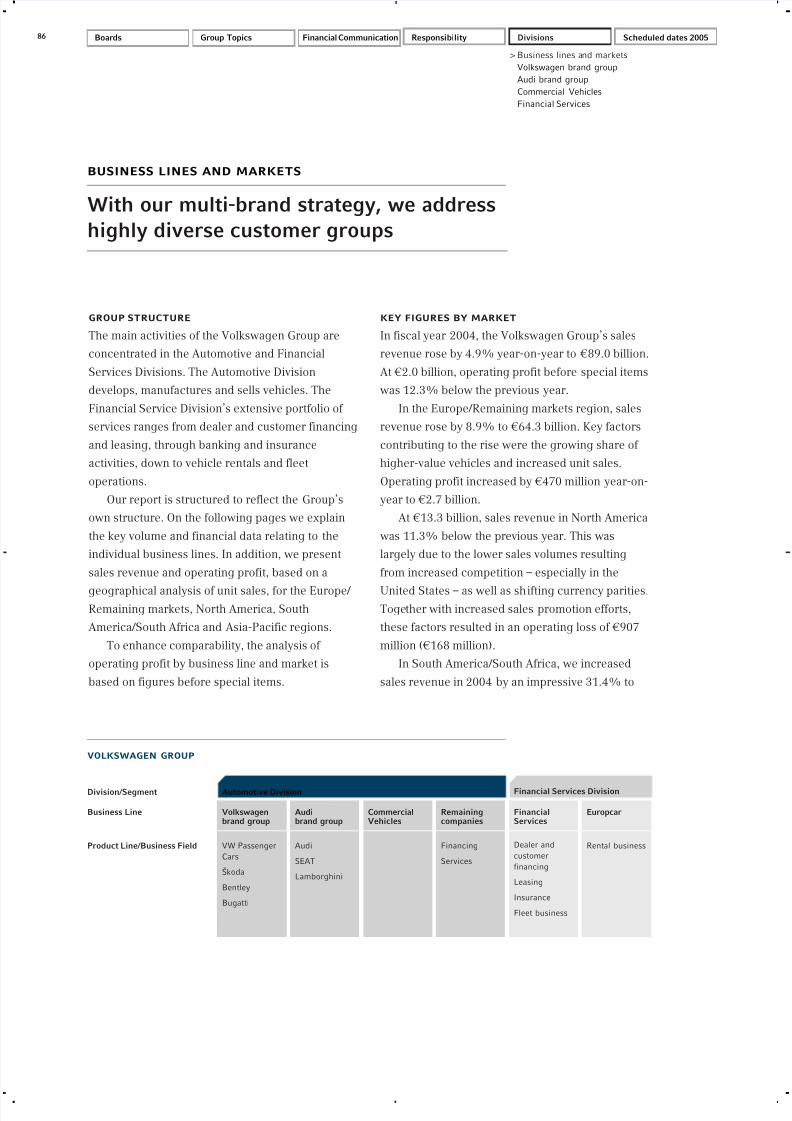
volkswagen group
Automotive DivisionDivision/Segment
group structure
The main activities of the Volkswagen Group are
concentrated in the Automotive and Financial
Services Divisions. The Automotive Division
develops, manufactures and sells vehicles. TheFinancial Service Division’s extensive portfolio of
services ranges from dealer and customer financing
and leasing, through banking and insurance
activities, down to vehicle rentals and fleet
operations.
Our report is structured to reflect the Group’s
own structure. On the following pages we explain
the key volume and financial data relating to the
individual business lines. In addition, we present
sales revenue and operating profit, based on a
geographical analysis of unit sales, for the Europe/ Remaining markets, North America, South
America/South Africa and Asia-Pacific regions.
To enhance comparability, the analysis of
operating profit by business line and market is
based on figures before special items.
key figures by market
In fiscal year 2004, the Volkswagen Group’s sales
revenue rose by 4.9% year-on-year to €89.0 billion.
At €2.0 billion, operating profit before special items
was 12.3% below the previous year.In the Europe/Remaining markets region, sales
revenue rose by 8.9% to €64.3 billion. Key factors
contributing to the rise were the growing share of
higher-value vehicles and increased unit sales.
Operating profit increased by €470 million year-on-
year to €2.7 billion.
At €13.3 billion, sales revenue in North America
was 11.3% below the previous year. This was
largely due to the lower sales volumes resulting
from increased competition – especially in the
United States – as well as shifting currency parities.Together with increased sales promotion efforts,
these factors resulted in an operating loss of €907
million (€168 million).
In South America/South Africa, we increased
sales revenue in 2004 by an impressive 31.4% to
> Business lines and markets
Volkswagen brand group
Audi brand group
Commercial Vehicles
Financial Services
Financial CommunicationGroup TopicsBoards Responsibility Divisions Scheduled dates 2005
7/29/2019 Divisions En
http://slidepdf.com/reader/full/divisions-en 2/14
87BUSINESS LINES AND MARKETS
€5.5 billion. The increase resulted mainly from
significantly higher unit sales on the back of the
success of the new Fox in the South American
market, among other factors. Operating profit rose
by €287 million to €24 million. This reflected in
particular the successful implementation of our
restructuring measures in Brazil.
Sales revenue in the Asia-Pacific region fell by
10.8% year-on-year to €5.9 billion. The decrease
can be primarily attributed to the increasingly
competitive environment in China and the resulting
lower unit sales. Operating profit amounted to €208
million, down approximately €300 million compared
with the previous year. The primary negative
influences were lower deliveries to our Chinese joint
venture companies and the continued unfavorable
exchange rates.
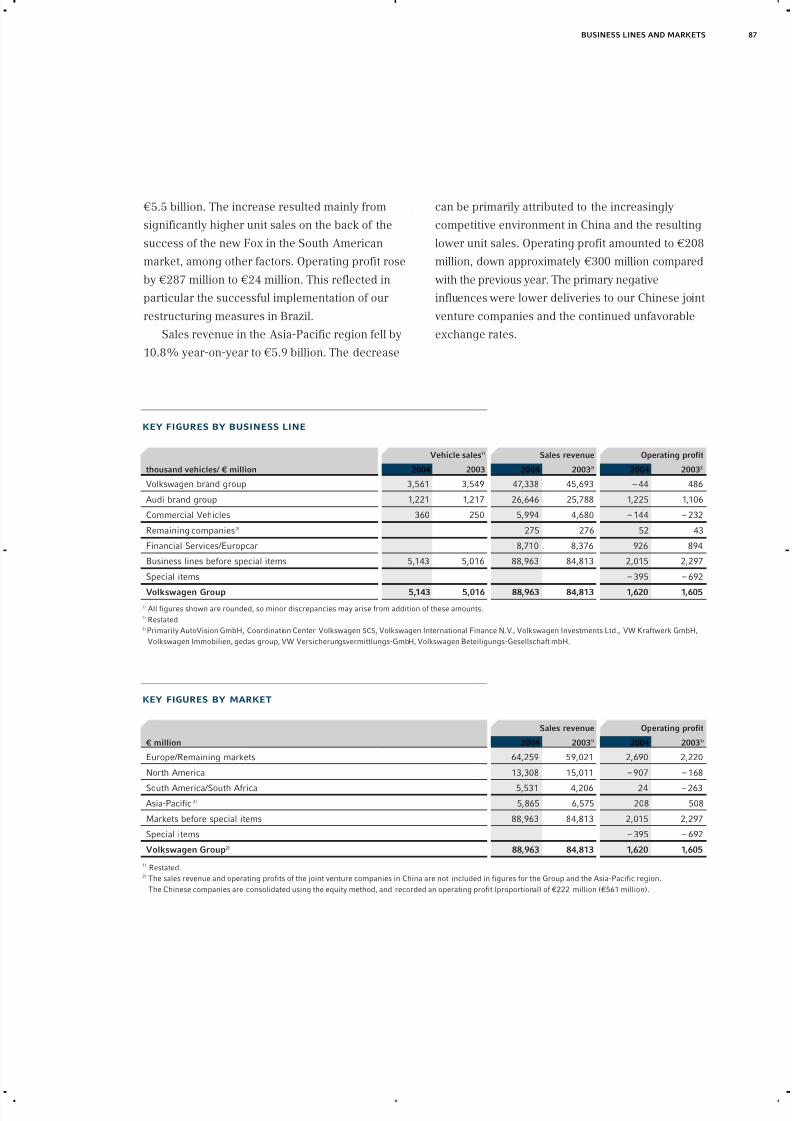
key figures by business line
key figures by market
Sales revenue Operating profit
€ million 2004 20031) 2004 20031)
Europe/Remaining markets 64,259 59,021 2,690 2,220
North America 13,308 15,011 – 907 – 168
South America/South Africa 5,531 4,206 24 – 263
Asia-Pacific2) 5,865 6,575 208 508
Markets before special items 88,963 84,813 2,015 2,297
Special items – 395 – 692
Volkswagen Group2) 88,963 84,813 1,620 1,605
1) Restated.2) The sales revenue and operating profits of the joint venture companies in China are not included in figures for the Group and the Asia-Pacific region.
The Chinese companies are consolidated using the equity method, and recorded an operating profit (proportional) of €222 million (€561 million).
Vehicle sales1) Sales revenue Operating profit
thousand vehicles/ € million 2004 2003 2004 20032) 2004 20032)
Volkswagen brand group 3,561 3,549 47,338 45,693 – 44 486
Audi brand group 1,221 1,217 26,646 25,788 1,225 1,106
Commercial Vehicles 360 250 5,994 4,680 – 144 – 232
Remaining companies3) 275 276 52 43
Financial Services/Europcar 8,710 8,376 926 894
Business lines before special items 5,143 5,016 88,963 84,813 2,015 2,297
Special items – 395 – 692
Volkswagen Group 5,143 5,016 88,963 84,813 1,620 1,605
1) All figures shown are rounded, so minor discrepancies may arise from addition of these amounts.2) Restated.3) Primarily AutoVision GmbH, Coordination Center Volkswagen SCS, Volkswagen International Finance N.V., Volkswagen Investments Ltd., VW Kraftwerk GmbH,
Volkswagen Immobilien, gedas group, VW Versicherungsvermittlungs-GmbH, Volkswagen Beteiligungs-Gesellschaft mbH.
7/29/2019 Divisions En
http://slidepdf.com/reader/full/divisions-en 3/14
88
volkswagen brand group
New Volkswagen brand group modelswell established in the market
The Golf and Touran are leading models in their class.
The trend towards high-value vehicles remained strong, with
the Bentley Continental GT recording a significant increase
in unit sales.
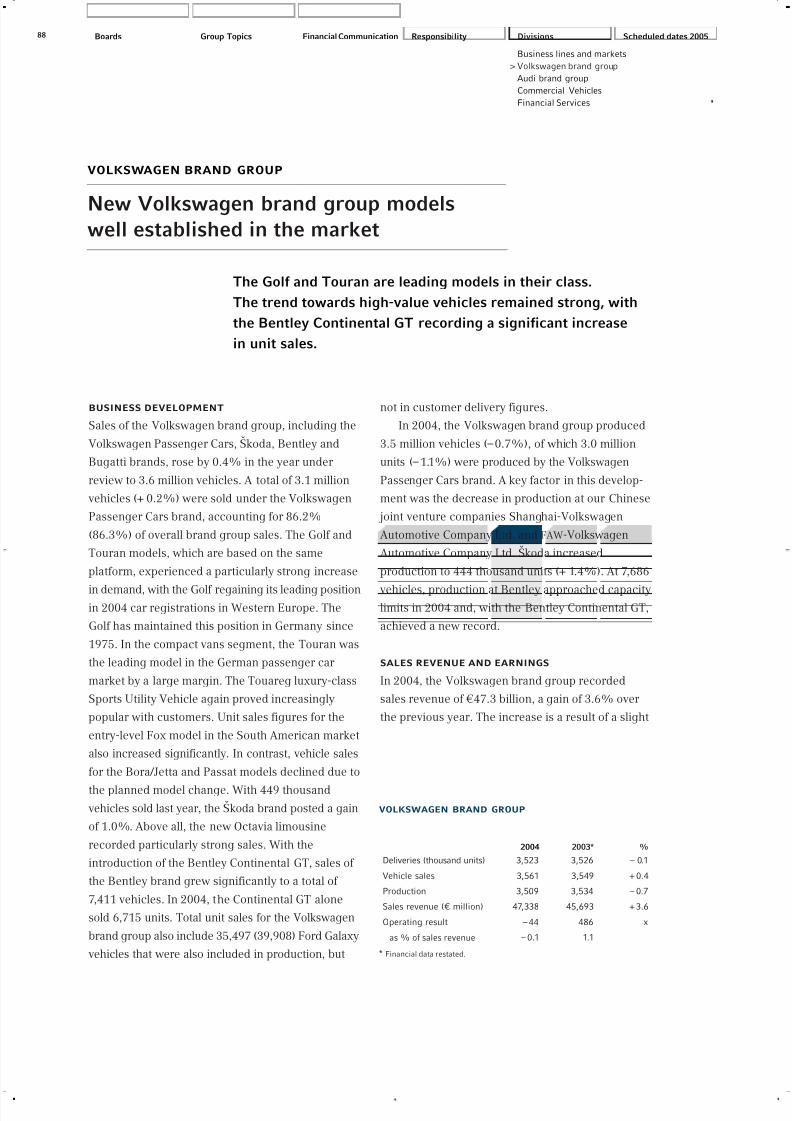
2004 2003* %
Deliveries (thousand units) 3,523 3,526 – 0.1
Vehicle sales 3,561 3,549 + 0.4
Production 3,509 3,534 – 0.7
Sales revenue (€ million) 47,338 45,693 + 3.6
Operating result – 44 486 x
as % of sales revenue – 0.1 1.1
* Financial data restated.
volkswagen brand group
business development
Sales of the Volkswagen brand group, including the
Volkswagen Passenger Cars, S ˇ koda, Bentley and
Bugatti brands, rose by 0.4% in the year under
review to 3.6 million vehicles. A total of 3.1 million
vehicles (+ 0.2%) were sold under the Volkswagen
Passenger Cars brand, accounting for 86.2%
(86.3%) of overall brand group sales. The Golf and
Touran models, which are based on the same
platform, experienced a particularly strong increase
in demand, with the Golf regaining its leading positionin 2004 car registrations in Western Europe. The
Golf has maintained this position in Germany since
1975. In the compact vans segment, the Touran was
the leading model in the German passenger car
market by a large margin. The Touareg luxury-class
Sports Utility Vehicle again proved increasingly
popular with customers. Unit sales figures for the
entry-level Fox model in the South American market
also increased significantly. In contrast, vehicle sales
for the Bora/Jetta and Passat models declined due to
the planned model change. With 449 thousand
vehicles sold last year, the S ˇ koda brand posted a gain
of 1.0%. Above all, the new Octavia limousine
recorded particularly strong sales. With the
introduction of the Bentley Continental GT, sales of
the Bentley brand grew significantly to a total of
7,411 vehicles. In 2004, the Continental GT alone
sold 6,715 units. Total unit sales for the Volkswagen
brand group also include 35,497 (39,908) Ford Galaxy
vehicles that were also included in production, but
not in customer delivery figures.
In 2004, the Volkswagen brand group produced
3.5 million vehicles (–0.7%), of which 3.0 million
units (– 1.1%) were produced by the Volkswagen
Passenger Cars brand. A key factor in this develop-
ment was the decrease in production at our Chinese
joint venture companies Shanghai-Volkswagen
Automotive Company Ltd. and FAW -Volkswagen
Automotive Company Ltd. S ˇ koda increased
production to 444 thousand units (+ 1.4%). At 7,686
vehicles, production at Bentley approached capacitylimits in 2004 and, with the Bentley Continental GT,
achieved a new record.
sales revenue and earnings
In 2004, the Volkswagen brand group recorded
sales revenue of €47.3 billion, a gain of 3.6% over
the previous year. The increase is a result of a slight
Financial CommunicationGroup TopicsBoards Responsibility Divisions
Business lines and markets
> Volkswagen brand group
Audi brand group
Commercial Vehicles
Financial Services
Scheduled dates 2005
7/29/2019 Divisions En
http://slidepdf.com/reader/full/divisions-en 4/14
89
production
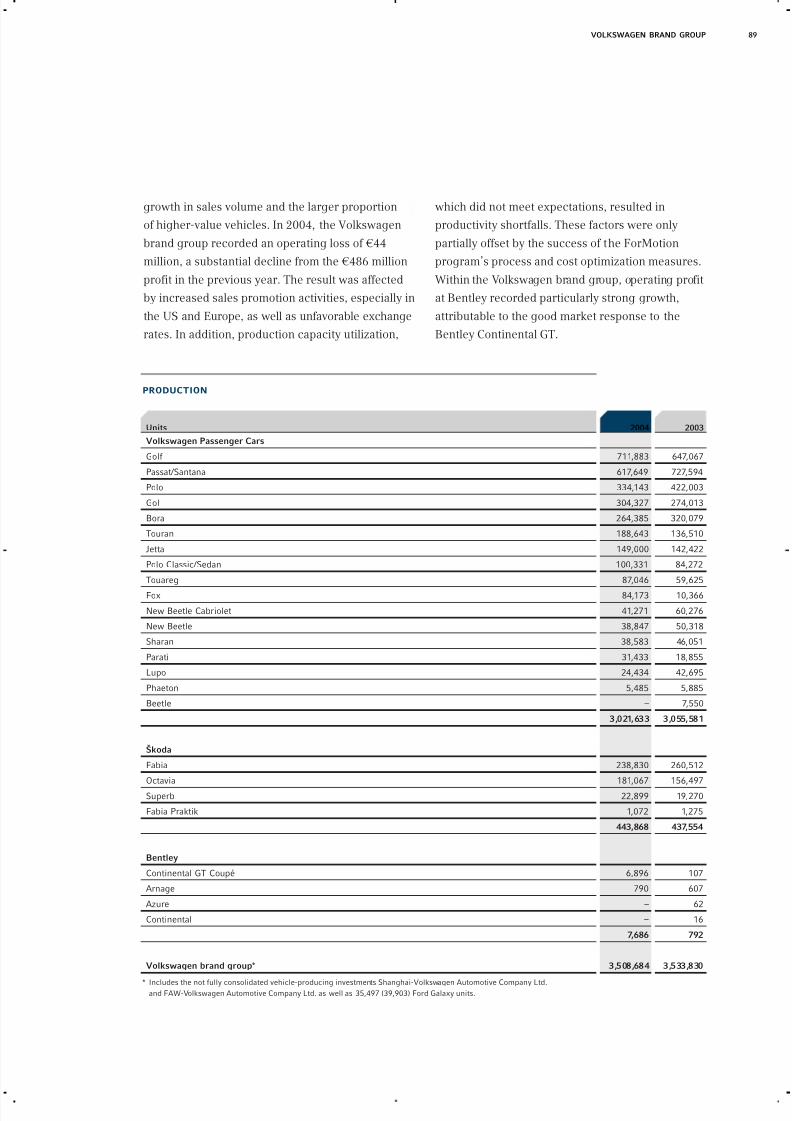
VOLKSWAGEN BRAND GROUP
Units 2004 2003
Volkswagen Passenger Cars
Golf 711,883 647,067
Passat/Santana 617,649 727,594
Polo 334,143 422,003
Gol 304,327 274,013
Bora 264,385 320,079
Touran 188,643 136,510
Jetta 149,000 142,422
Polo Classic/Sedan 100,331 84,272
Touareg 87,046 59,625
Fox 84,173 10,366
New Beetle Cabriolet 41,271 60,276
New Beetle 38,847 50,318
Sharan 38,583 46,051
Parati 31,433 18,855
Lupo 24,434 42,695
Phaeton 5,485 5,885
Beetle – 7,550
3,021,633 3,055,581
S ˇ koda
Fabia 238,830 260,512
Octavia 181,067 156,497
Superb 22,899 19,270
Fabia Praktik 1,072 1,275
443,868 437,554
Bentley
Continental GT Coupé 6,896 107
Arnage 790 607
Azure – 62
Continental – 16
7,686 792
Volkswagen brand group* 3,508,684 3,533,830
* Includes the not fully consolidated vehicle-producing investments Shanghai-Volkswagen Automotive Company Ltd.and FAW-Volkswagen Automotive Company Ltd. as well as 35,497 (39,903) Ford Galaxy units.
growth in sales volume and the larger proportion
of higher-value vehicles. In 2004, the Volkswagen
brand group recorded an operating loss of €44
million, a substantial decline from the €486 million
profit in the previous year. The result was affected
by increased sales promotion activities, especially in
the US and Europe, as well as unfavorable exchange
rates. In addition, production capacity utilization,
which did not meet expectations, resulted in
productivity shortfalls. These factors were only
partially offset by the success of the ForMotion
program’s process and cost optimization measures.
Within the Volkswagen brand group, operating profit
at Bentley recorded particularly strong growth,
attributable to the good market response to the
Bentley Continental GT.
7/29/2019 Divisions En
http://slidepdf.com/reader/full/divisions-en 5/14
90
audi brand group
Increased unit sales and a higher-valuemodel mix lead to success
Audi increased its vehicle sales with the roll out of new
models. SEAT makes headway with the Altea. The
Lamborghini Gallardo experienced increased demand
in the second year after its market launch.
business development
The Audi brand group increased unit sales of its
Audi, SEAT and Lamborghini brands by 0.4% to 1.2
million vehicles. Audi accounted for 775 thousand
of total brand group sales, exceeding last year’s unit
sales by 1.0%. In addition to the high-volume Audi
A3 and Audi A4 models, the new Audi A3 Sportback
and the new generation of Audi A6 vehicles
experienced particularly strong demand. In the
luxury class, the Audi A8 also gained ground. At445 thousand units (–0.9%), sales of SEAT models
were slightly below those of the previous year. One
particularly positive development was the market
launch of the SEAT Altea, which sold 52,645 units
after its launch in the spring of 2004. Demand for
the Gallardo also remained strong in the second
year after its own market launch. Lamborghini thus
increased its sales in 2004 by an impressive 29.0%
to 1,614 vehicles.
The Audi brand group’s production increased by
1.9% year-on-year to 1.2 million vehicles. The Audi
brand produced a total of 788 thousand units
(+3.2%) and, at 63.1% (62.3%), accounted for the
largest share of the brand group’s overall production.
In 2004, SEAT manufactured a total of 458 thousand
vehicles – almost as much as in the previous year
(– 0.3%). Lamborghini increased its production by
23.7% to 1,678 units.
sales revenue and earnings
The Audi brand group increased sales revenue in
the year under review by 3.3% to €26.6 billion.
This was driven by an increase in unit sales,
especially higher-value models. The Audi brand
group was able to increase operating profit in 2004
by a substantial 10.7% to €1.2 billion, despite difficult
market conditions in some areas. In particular, the
brand group was able to more than offset the
impact of exchange rates on sales revenue by ahigher-value model and accessories mix, as well
as by targeted cost savings programs.
Business lines and markets
Volkswagen brand group
> Audi brand group
Commercial Vehicles
Financial Services
Financial CommunicationGroup TopicsBoards Responsibility Divisions
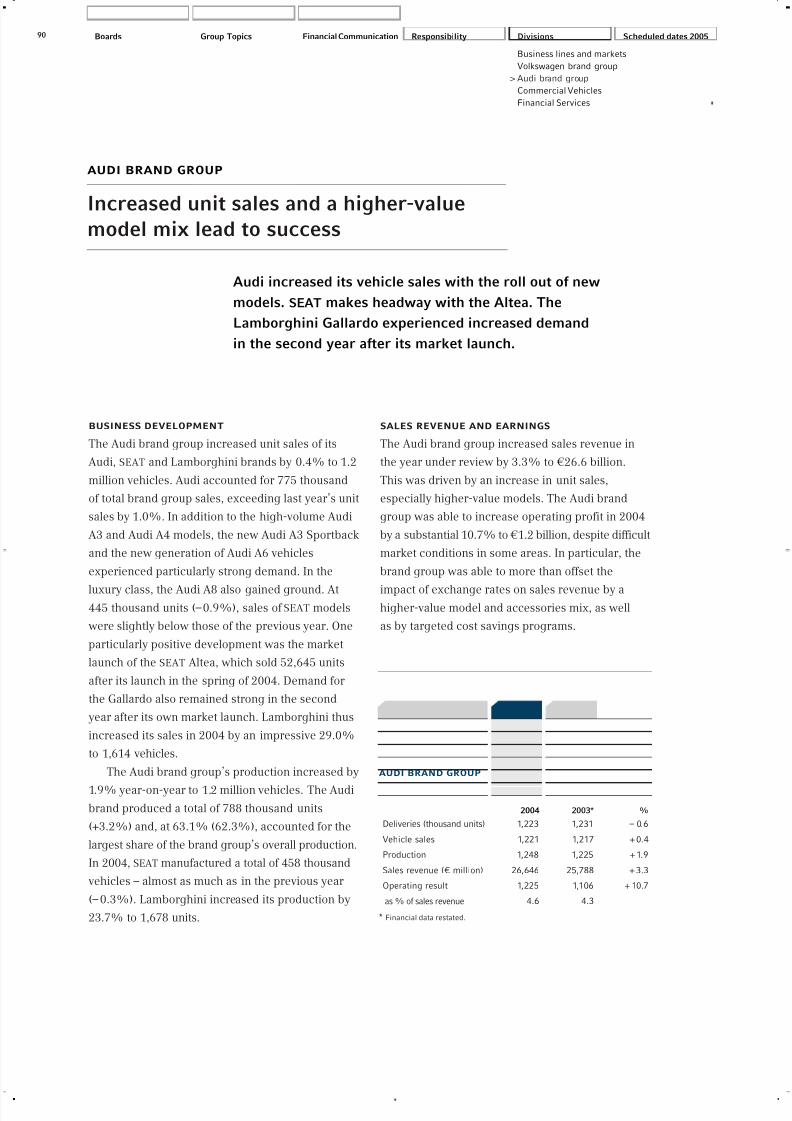
2004 2003* %
Deliveries (thousand units) 1,223 1,231 – 0.6
Vehicle sales 1,221 1,217 + 0.4
Production 1,248 1,225 + 1.9
Sales revenue (€ million) 26,646 25,788 + 3.3
Operating result 1,225 1,106 + 10.7
as % of sales revenue 4.6 4.3
* Financial data restated.
audi brand group
Scheduled dates 2005
7/29/2019 Divisions En
http://slidepdf.com/reader/full/divisions-en 6/14
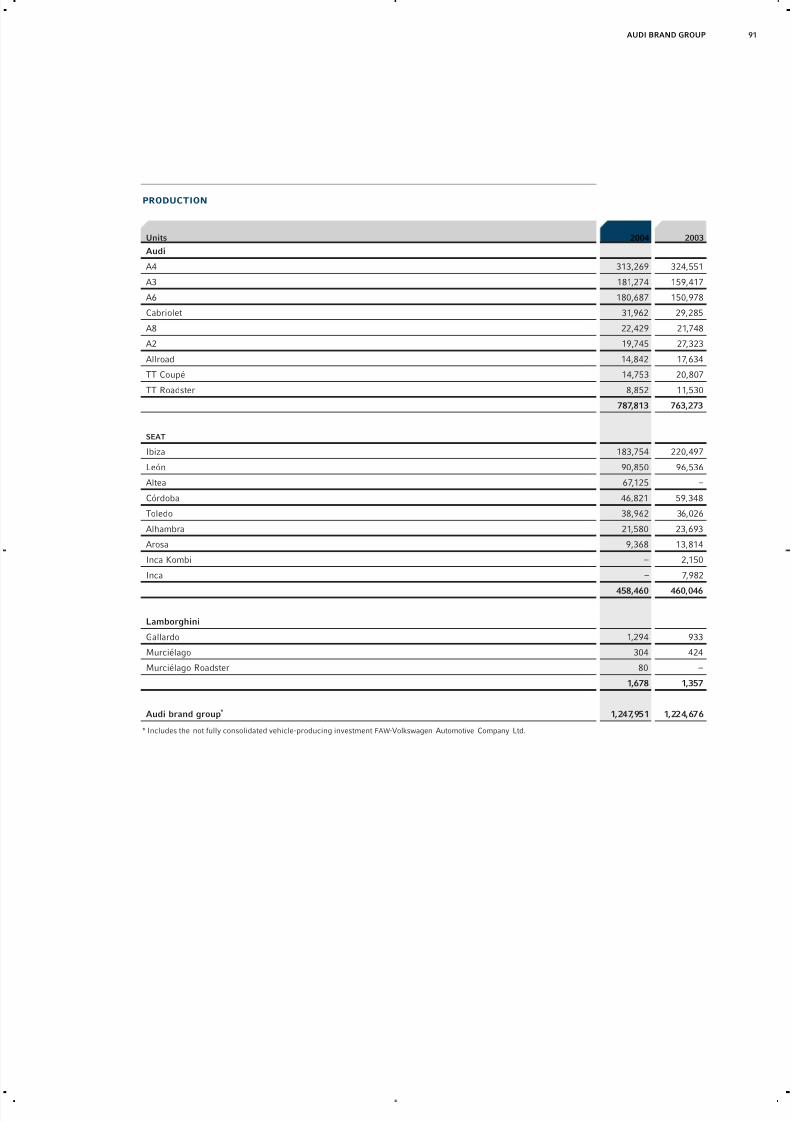
91AUDI BRAND GROUP
Units 2004 2003
Audi
A4 313,269 324,551
A3 181,274 159,417
A6 180,687 150,978
Cabriolet 31,962 29,285
A8 22,429 21,748
A2 19,745 27,323
Allroad 14,842 17,634
TT Coupé 14,753 20,807
TT Roadster 8,852 11,530787,813 763,273
SEAT
Ibiza 183,754 220,497
León 90,850 96,536
Altea 67,125 –
Córdoba 46,821 59,348
Toledo 38,962 36,026
Alhambra 21,580 23,693
Arosa 9,368 13,814
Inca Kombi – 2,150
Inca – 7,982
458,460 460,046
Lamborghini
Gallardo 1,294 933
Murciélago 304 424
Murciélago Roadster 80 –
1,678 1,357
Audi brand group* 1,247,951 1,224,676
* Includes the not fully consolidated vehicle-producing investment FAW-Volkswagen Automotive Company Ltd.
production
7/29/2019 Divisions En
http://slidepdf.com/reader/full/divisions-en 7/14
92
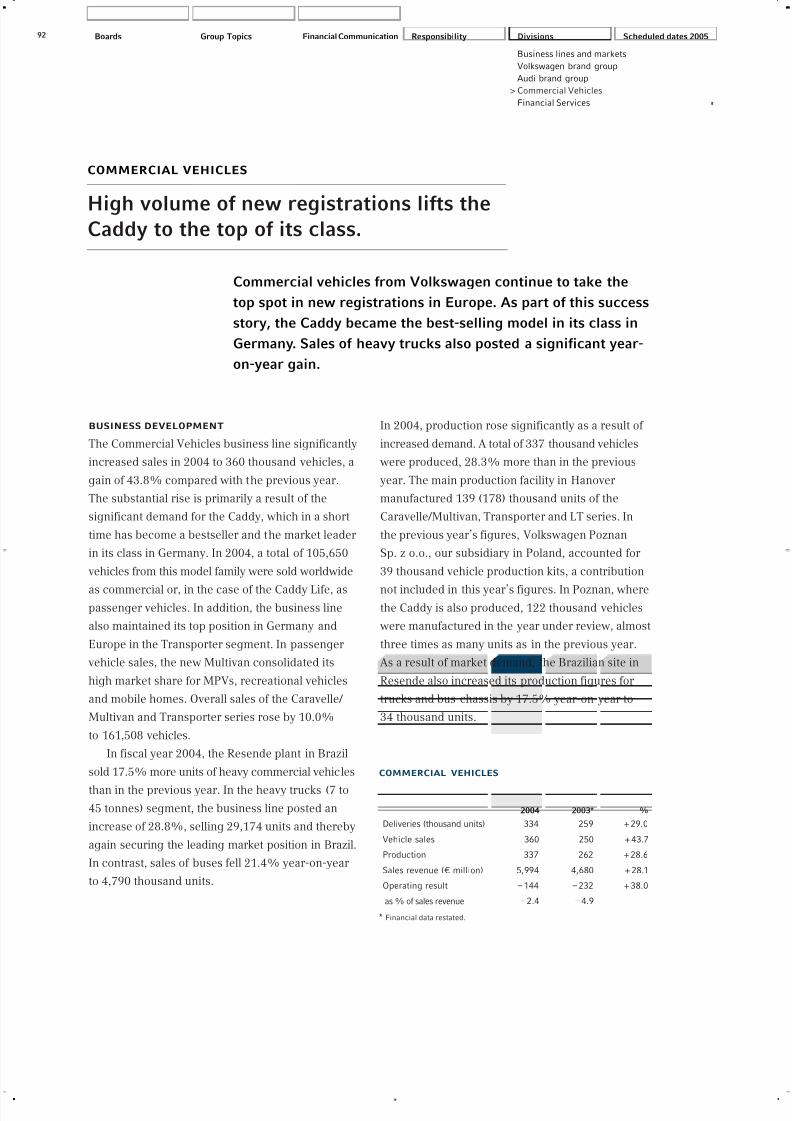
commercial vehicles
High volume of new registrations lifts theCaddy to the top of its class.
Commercial vehicles from Volkswagen continue to take the
top spot in new registrations in Europe. As part of this success
story, the Caddy became the best-selling model in its class in
Germany. Sales of heavy trucks also posted a significant year-
on-year gain.
business development
The Commercial Vehicles business line significantly
increased sales in 2004 to 360 thousand vehicles, a
gain of 43.8% compared with the previous year.
The substantial rise is primarily a result of the
significant demand for the Caddy, which in a short
time has become a bestseller and the market leader
in its class in Germany. In 2004, a total of 105,650
vehicles from this model family were sold worldwide
as commercial or, in the case of the Caddy Life, aspassenger vehicles. In addition, the business line
also maintained its top position in Germany and
Europe in the Transporter segment. In passenger
vehicle sales, the new Multivan consolidated its
high market share for MPVs, recreational vehicles
and mobile homes. Overall sales of the Caravelle/
Multivan and Transporter series rose by 10.0%
to 161,508 vehicles.
In fiscal year 2004, the Resende plant in Brazil
sold 17.5% more units of heavy commercial vehicles
than in the previous year. In the heavy trucks (7 to
45 tonnes) segment, the business line posted an
increase of 28.8%, selling 29,174 units and thereby
again securing the leading market position in Brazil.
In contrast, sales of buses fell 21.4% year-on-year
to 4,790 thousand units.
In 2004, production rose significantly as a result of
increased demand. A total of 337 thousand vehicles
were produced, 28.3% more than in the previous
year. The main production facility in Hanover
manufactured 139 (178) thousand units of the
Caravelle/Multivan, Transporter and LT series. In
the previous year’s figures, Volkswagen Poznan
Sp. z o.o., our subsidiary in Poland, accounted for
39 thousand vehicle production kits, a contribution
not included in this year’s figures. In Poznan, wherethe Caddy is also produced, 122 thousand vehicles
were manufactured in the year under review, almost
three times as many units as in the previous year.
As a result of market demand, the Brazilian site in
Resende also increased its production figures for
trucks and bus chassis by 17.5% year-on-year to
34 thousand units.
Business lines and markets
Volkswagen brand group
Audi brand group
> Commercial Vehicles
Financial Services
Financial CommunicationGroup TopicsBoards Responsibility Divisions
2004 2003* %
Deliveries (thousand units) 334 259 + 29.0
Vehicle sales 360 250 + 43.7
Production 337 262 + 28.6
Sales revenue (€ million) 5,994 4,680 + 28.1
Operating result – 144 – 232 + 38.0
as % of sales revenue – 2.4 – 4.9
* Financial data restated.
commercial vehicles
Scheduled dates 2005
7/29/2019 Divisions En
http://slidepdf.com/reader/full/divisions-en 8/14
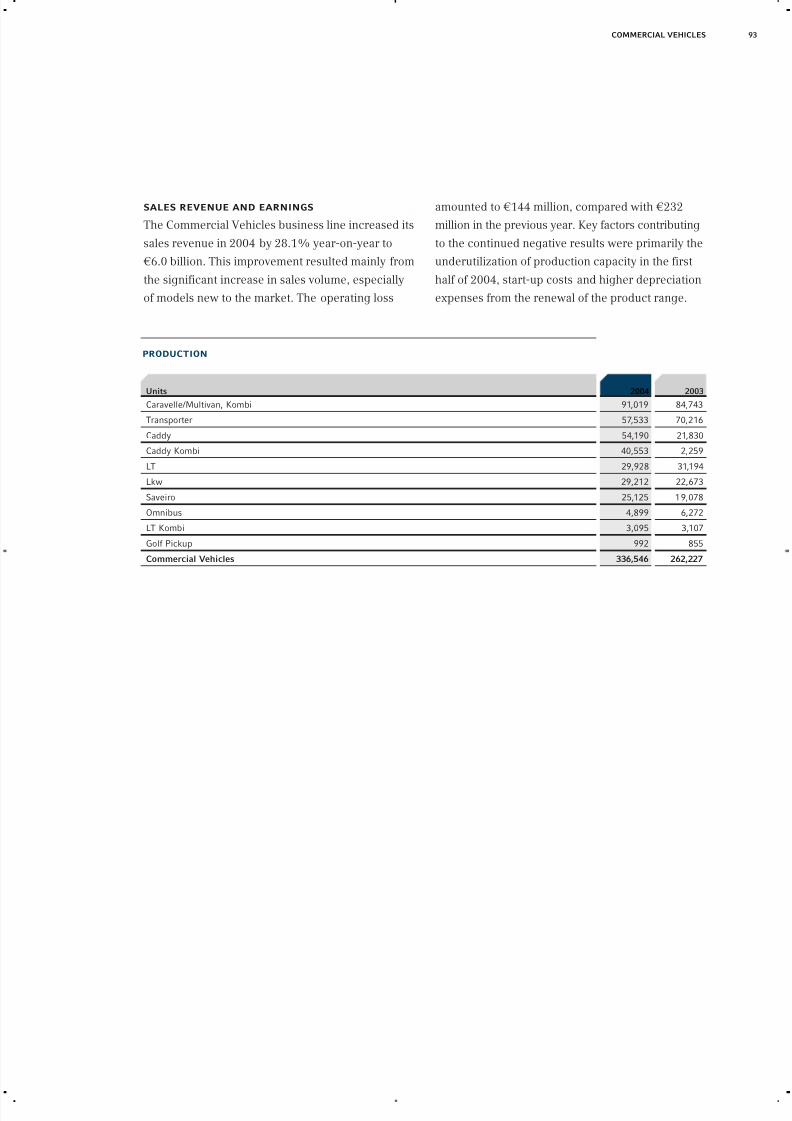
93COMMERCIAL VEHICLES
Units 2004 2003Caravelle/Multivan, Kombi 91,019 84,743
Transporter 57,533 70,216
Caddy 54,190 21,830
Caddy Kombi 40,553 2,259
LT 29,928 31,194
Lkw 29,212 22,673
Saveiro 25,125 19,078
Omnibus 4,899 6,272
LT Kombi 3,095 3,107
Golf Pickup 992 855
Commercial Vehicles 336,546 262,227
production
sales revenue and earnings
The Commercial Vehicles business line increased its
sales revenue in 2004 by 28.1% year-on-year to
€6.0 billion. This improvement resulted mainly from
the significant increase in sales volume, especially
of models new to the market. The operating loss
amounted to €144 million, compared with €232
million in the previous year. Key factors contributing
to the continued negative results were primarily the
underutilization of production capacity in the first
half of 2004, start-up costs and higher depreciation
expenses from the renewal of the product range.
7/29/2019 Divisions En
http://slidepdf.com/reader/full/divisions-en 9/14
94
financial services
Underscoring our ability to innovate
With the acquisition of a stake in LeasePlan, the Financial
Services Division has significantly expanded its activities in
the fleet business. Vehicle financing is now also being offered
in China.
business development
The Division consists of the Financial Services and
Europcar business lines.
Financial Services
Financial Services continued its dynamic business
development in 2004. A key event was the acquisition
of a stake in the Dutch LeasePlan Corporation N.V.
In addition, Volkswagen Finance (China) Co., Ltd., a
wholly owned subsidiary of Volkswagen FinancialServices AG, received its definitive operating license
and began sales of vehicle financing packages for
private customers in Beijing. Financial Services
expanded its business operations in Europe as well.
Using the European “single passport” for financial
services, Volkswagen Bank GmbH opened additional
offices in Greece, France and the United Kingdom.
In North America, the Financial Services Division
also posted significant gains in customer financing
in the US, Canadian and Mexican markets. In South
America, the number of financing contracts for
passenger cars and trucks almost reached last year’s
levels.
In the financing, leasing and insurance
businesses, the number of new contracts rose 3.0%
year-on-year to 2.1 million. At December 31, 2004,
the number of contracts worldwide had thus risen
3.8% to 5.9 million, including increases in the
Customer Financing/Leasing (+2.5%) and
Service/Insurance (+7.4%) areas. The share of new
vehicles leased or financed as a proportion of total
deliveries with unchanged credit eligibility criteria
was 31.3% (35.6%) below that of the previous year.
Receivables relating to dealer financing rose by
29.2% year-on-year. The fleet business also provedsuccessful in 2004: activities in both the Group
(+ 23.1%) and non-Group (+21.2%) vehicle
segments increased significantly. This saw the
number of fleet vehicles managed rise by 22.2% to
228 thousand automobiles at December 31, 2004.
The direct banking business at Volkswagen
Bank direct also developed positively in 2004. Call
money and savings accounts proved tremendously
popular with our customers. At the end of the year,
the number of accounts had risen to 765 thousand,
an increase of 13.0% compared with the previous
year. Deposits also increased to €8.0 billion
(+ 18.9%) at December 31, 2004, including €638
million in corporate customer accounts.
Business lines and markets
Volkswagen brand group
Audi brand group
Commercial Vehicles
> Financial Services
Financial CommunicationGroup TopicsBoards Responsibility Divisions Scheduled dates 2005
7/29/2019 Divisions En
http://slidepdf.com/reader/full/divisions-en 10/14
95
Europcar
In 2004, Europcar was able to extend its market
lead among European vehicle rental companies
despite the difficult business environment. The
Europcar group increased rentals by 9.7% year-on-
year to 32.5 million rental days.
These positive sales figures result mainly from
the continued expansion of tourism and business
customer activities, the strategic targeting of
customer needs and the quality strategy adopted by
Europcar. The Europcar group is using a franchisemodel to expand its worldwide business operations.
This planned extension of its network now allows it
to offer services in 132 countries around the globe.
In 2004, one third of the Europcar fleet
consisted of Group vehicles, allowing the effective
use of synergies within the Group. Europcar helped
make new Group models a success through special
offers to accompany market launches.
sales revenue and earnings
In fiscal year 2004, the Financial Services Division
generated sales revenue of €8.7 billion, 4.0% more
than in the previous year. The increase was mainly
attributable to the expanded business activities in
customer financing and in the leasing business.
Profit before tax improved by €16 million to €927
million. The Financial Services Division thus made a
significant contribution to the Volkswagen Group’s
overall results. The return on equity based on profit
before taxes declined to 19.9% (23.8%) as a resultof the intra-Group capital increases implemented in
the fourth quarter of 2004.
Total assets increased by 17.9% year-on-year to
€61.4 billion. The debt/equity ratio was 9:1. On
December 31, 2004, the Financial Services Division
accounted for approximately 48% of total Group
assets.
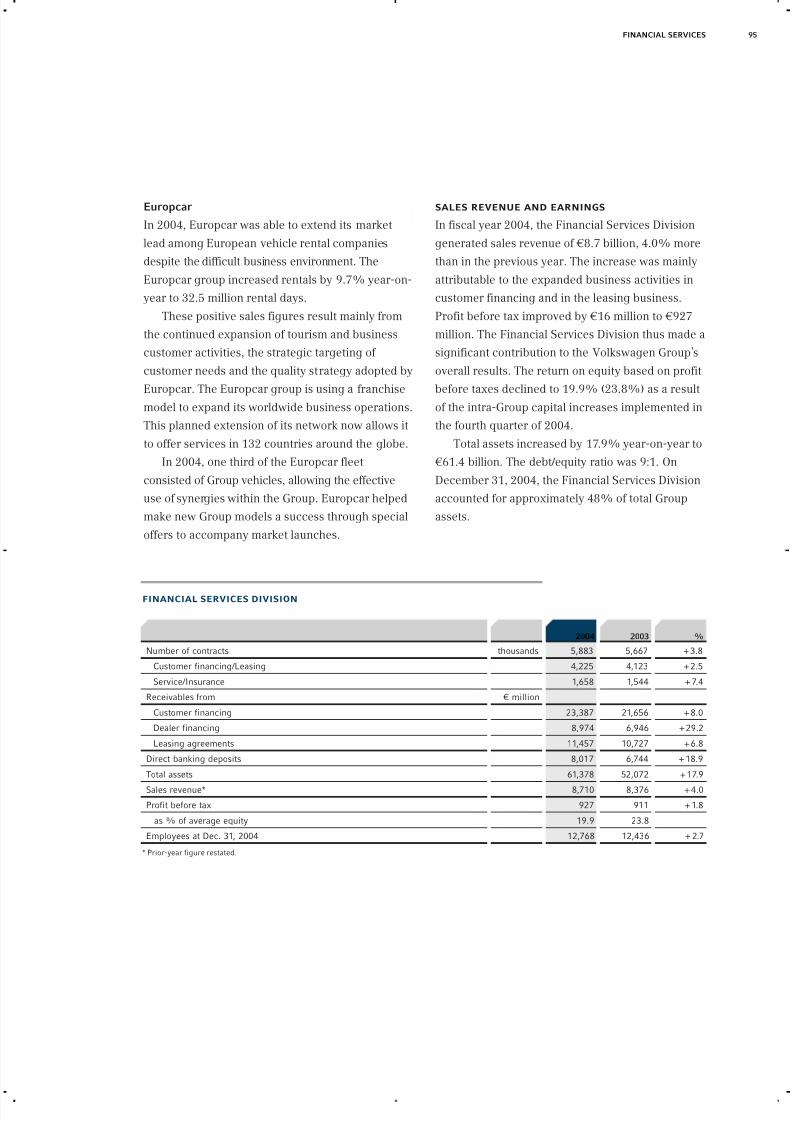
FINANCIAL SERVICES
2004 2003 %
Number of contracts thousands 5,883 5,667 + 3.8
Customer financing/Leasing 4,225 4,123 + 2.5
Service/Insurance 1,658 1,544 + 7.4
Receivables from € million
Customer financing 23,387 21,656 + 8.0
Dealer financing 8,974 6,946 + 29.2
Leasing agreements 11,457 10,727 + 6.8
Direct banking deposits 8,017 6,744 + 18.9
Total assets 61,378 52,072 + 17.9
Sales revenue* 8,710 8,376 + 4.0
Profit before tax 927 911 + 1.8
as % of average equity 19.9 23.8
Employees at Dec. 31, 2004 12,768 12,436 + 2.7
* Prior-year figure restated.
financial services division
7/29/2019 Divisions En
http://slidepdf.com/reader/full/divisions-en 11/14
96
the mobility experience
The Autostadt – experiencing brandvalues up close
>> Over two million visitors flock to the Volkswagen Autostadt
every year
>> Visitors evolve into customers: Trust in the brands
and empathy for the company lead to sales
communications platform for
the volkswagen group
As the communications platform of the Volkswagen
Group and its brands, the main aim of the Autostadt
is to fuel a lively exchange process between the
Company and society. Accordingly, the issues and
values relating to the Group can be experienced
first-hand at the Volkswagen AG headquarters in
Wolfsburg. The Autostadt showcases developments
from technology and design, allowing visitors toshare in the visions of a multinational company and
its brands. As a Center of Excellence, it establishes
both a new service quality and a new service
awareness. Its goal is to establish sustainable
relationships between the manufacturer and the
relevant target groups. As well as increasing the
popularity of the Volkswagen Group in the eyes of
the public, the Autostadt incorporates far-reaching
approaches that interpret marketing and
communication as a means of inspiration and
encounter.
In addition to this, as the largest vehicle delivery
center in the world, collecting a new Volkswagen
here is an experience in itself, with a whole host of
mobility attractions for the enjoyment of the buyers
and their families. In 2004, the Volkswagen Group
handed over some 160,000 vehicles to their new
owners in the Autostadt. At the beginning of 2005,
the Autostadt welcomed its ten millionth visitor,
thus firmly establishing itself as a highly successful
communication platform with over two million
visitors every year. It has easily surpassed our own
expectations, attracting more than twice as many
visitors as originally forecast. Furthermore, its
importance within Germany has increased steadily –
while the proportion of visitors living more than
100 km away was originally in the region of 30%,
this figure has now risen to over 70%.
modern customer relations instrument
Driven by the innovative notion of bringing
customers face-to-face with the manufacturer, the
Autostadt supplements and complements the
traditional communication and marketing
instruments. Market research findings give clear
indications of the positive effects of this direct
interaction on final purchase intentions thanks to
the unique presentation and focused service-
orientation. A continuous purchase simulation with
buyers of new vehicles shows that consumers have
a significantly more positive image of the Group
brands – and in particular the Volkswagen brand –
after visiting the Autostadt. Of the 5,700 or so daily
visitors who spend an average of four hours in the
Autostadt, approximately 1,600 are buyers and their
families who have come to collect a new vehicle.
Some 1,500 of these guests do not drive any of the
Volkswagen Group brands – yet.
7/29/2019 Divisions En
http://slidepdf.com/reader/full/divisions-en 12/14
97
learning culture in its purest form
Above all, the success of the Autostadt is due to the
fact that it enables access to the topic of mobility for
people of all ages and backgrounds.
A prime example of the innovative way in which
target groups are addressed is the educational
program that supplements institutionalized
education offerings. As an officially recognized non-
school education center, the Autostadt contributes
to the overall learning culture by offering hands-on,
first-hand learning for people of all ages, from small
children to adults. Visitors can design and oversee
their own individual learning processes in learning
zones such as the WerkStadt and the FamilienWelt,
or alternatively in organized information areas.
This educational work has its roots in a
cooperation agreement signed at the end of 2002 by
the Lower Saxony Ministry of Education and
Cultural Affairs (Kultusministerium) and the
Autostadt. The aim of this cooperation is to examine
the area of mobility in greater depth on the basis of
the Lower Saxony curriculum, eventually replacing
the conventional road safety education program.
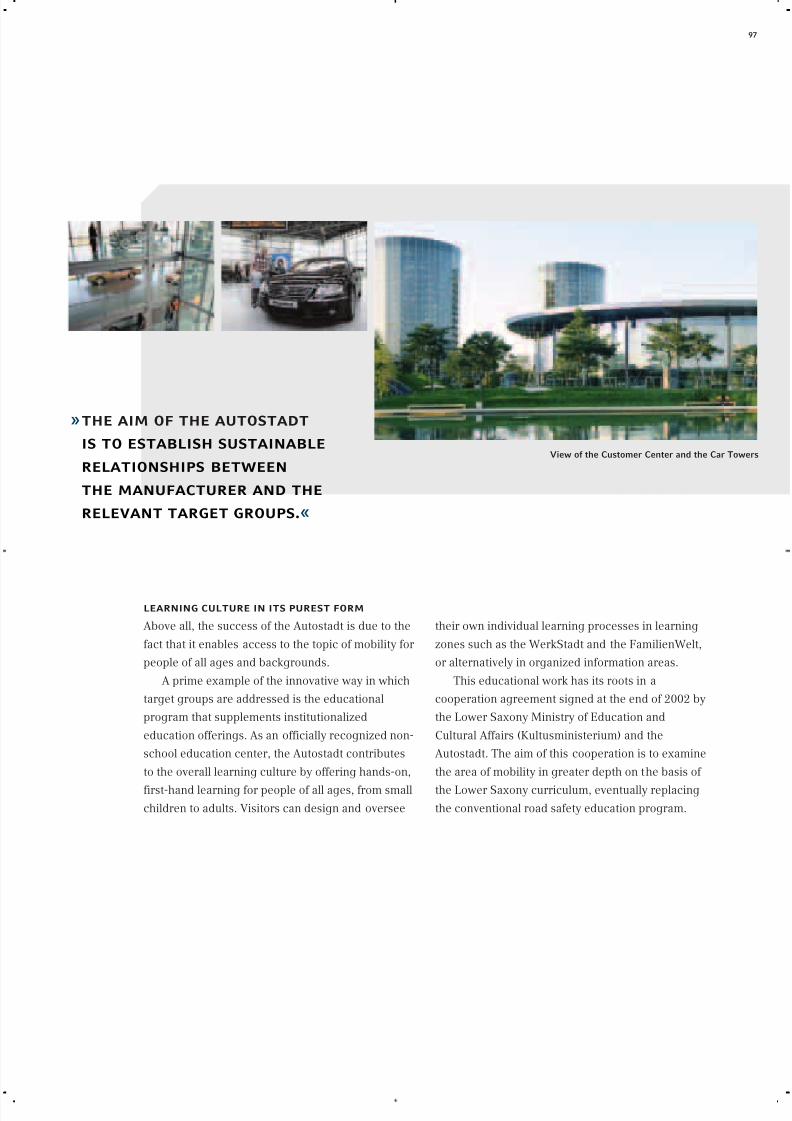
View of the Customer Center and the Car Towers
»the aim of the autostadt
is to establish sustainable
relationships between
the manufacturer and the
relevant target groups.«
7/29/2019 Divisions En
http://slidepdf.com/reader/full/divisions-en 13/14
7/29/2019 Divisions En
http://slidepdf.com/reader/full/divisions-en 14/14
99SCHEDULED DATES 2005
August 5 – 14, 2005▼
motor showchangchun,changchun
August 26 –September 4, 2005▼
internationalcaravan salon,düsseldorf
September 15 – 25, 2005▼
iaa international
motor show,frankfurt
November 25 –
December 4, 2005▼
essen motor show,essen
December 3 – 11, 2005▼
bologna motor show,bologna
October 13 – 23, 2005▼
australian inter-national motorshow, sydney
October 22 –
November 6, 2005▼
tokyo motor show,tokyo
july august september october november december
>> march 8, 2005
Annual Press Conference/
Publication of the 2004 Annual Report
>> march 9, 2005
International Investor Conference
>> april 21, 2005
Annual General Meeting
(Congress Centrum Hamburg)
>> april 29, 2005
Interim Report January to March
>> july 29, 2005
Interim Report January to June
>> november 3, 2005
Interim Report January to September
Financial Calendar 2005