Embed Size (px)
Citation preview
Do Loyalty Programs Enhance Behavioral Loyalty?
A Market-Wide Analysis Accounting for Endogeneity
Jorna Leenheer, Tammo H.A. Bijmolt, Harald J. van Heerde, Ale Smidts
November 05, 2003
Jorna Leenheer is Doctoral Candidate at the Department of Marketing, Tilburg University, P.O. Box 90153, 5000 LE Tilburg, the Netherlands. Tel: +31-13-4668088. Fax: +31-13-4668354. E-mail: [email protected]. Tammo H.A. Bijmolt and Harald J. van Heerde are respectively Professor of Marketing Research and Associate Professor, Tilburg University, the Netherlands. Ale Smidts is Professor of Marketing Research, Erasmus University, Rotterdam, the Netherlands. The authors thank GfK Panel Services for providing the data. They thank Els Gijsbrechts, Marnik Dekimpe, and Richard Paap for useful comments on a previous version.

2
Do Loyalty Programs Enhance Behavioral Loyalty?
A Market-Wide Analysis Accounting for Endogeneity
ABSTRACT
This paper studies the effects of loyalty programs on behavioral loyalty using market-wide
panel data on supermarket purchases. We present a conceptual framework relating loyalty
program membership to share-of-wallet. To account for the two-sided causality between these
variables, we specify a model for the loyalty program decision and use instrumental variables
such as privacy concerns and loyalty program enjoyment. In general, loyalty programs are
shown to influence share-of-wallet positively; ignoring endogeneity leads to substantially
overestimate of effects. Not all loyalty programs are effective, however; four out of seven
loyalty programs under study give greater value away to their members than they earn back in
terms of additional customer revenues. The effectiveness of loyalty programs increases with
value given through saving features. In contrast, the effectiveness of a program diminishes
with higher price discounts to program members.

3
INTRODUCTION
In recent years many retail companies have introduced loyalty programs with the goal of
enhancing customer revenues. Loyalty programs are currently available in many industries --
such as supermarkets, gasoline stations, and clothing stores -- and have become almost
common property in some of them (Lewis 1997). Loyalty programs provide members with
benefits such as promotions and saving features, which make these programs popular among
consumers (Liebermann 1999). In the United States, almost 80% of all households have at
least one supermarket loyalty card, and in Canada this is even 90% (ACNielsen, Consumer
Insight 2002). In addition, many households are members of multiple loyalty programs
simultaneously (ACNielsen, Consumer Insight 2002). Although loyalty programs have
attained a prominent position in the marketing-mix of retailers, and loyalty cards have
infiltrated customers’ wallets, it is still not evident whether loyalty program memberships
actually affect purchasing behavior (Dowling and Uncles 1997). Extant empirical research
provides mixed evidence of their effectiveness. Some previous studies found positive effects
of retail loyalty programs on customer purchasing (Bell and Lal 2003; Mägi 2003), whereas
others report the absence of any effects (DeWulf, Odekerken-Schröder, and Iacobucci 2001;
Sharp and Sharp 1997). This ambiguity relates, at least partly, to the fact that data and
methodology limitations hinder proper assessment of the effects of loyalty programs.
An important methodological issue arises, because a positive relationship between
loyalty program membership and customer purchasing does not prove the loyalty program’s
effectiveness, as the direction of the causality is unclear. Loyalty programs aim to enhance
customer purchasing, but it is particularly the company’s best customers that are most likely
to subscribe as members. It is thus unclear to what extent differences between members and
non-members are driven by the effects of the loyalty program itself or by the selection of most
loyal customers into the loyalty program. Existing research has ignored this causality, or

4
endogeneity problem, as argued by Bolton, Lemon, and Verhoef (2002). They argue that a
thorough solution for the endogeneity problem is needed before any conclusion can be made
on loyalty program effectiveness. Our study provides such a solution.
Concerning data requirements, a proper assessment of loyalty program effectiveness
requires competitive information, both on customer purchases at the competitors and the
marketing-mix usage of competitors. In retailing, most consumers buy frequently from
different stores (Drèze and Hoch 1998) and make transactions varying in size (Kahn and
Schmittlein 1992). As proposed by several authors (Ailawadi, Lehmann, and Neslin 2001;
Berger et al. 2002; Verhoef 2003), the share-of-wallet that a customer gives to a company
under such circumstances is the appropriate indicator of behavioral loyalty, reflecting the
divided loyalty and fuzzy choices of most consumers (Rust, Zeithaml, and Lemon 2000). To
model share-of-wallet appropriately, researchers need market-wide marketing instruments to
explain the relative attraction of the several retail companies. One important marketing-mix
instrument to account for is competitive loyalty programs, because multiple loyalty program
memberships are widespread nowadays (Mägi 2003; Passingham 1998). Existing studies
make at best limited use of competitive information on purchasing, loyalty program
memberships and other marketing mix elements (Mägi 2003; Verhoef 2003). Our study is the
first to use complete market-wide data.
Experimental research indicates that the effectiveness of loyalty programs depends on
the program’s design (Kivetz and Simonson 2002a; Roehm, Bolman Pullins, and Roehm
2002; Van Osselaer, Alba, and Manchanda 2003). Specifically, considerable attention has
been given to the trade-off between immediate rewards (through promotion features) and
delayed rewards (through saving features) (Roehm, Bolman Pullins, and Roehm 2002; Yi and
Jeon 2003; Zhang, Krishna, and Dhar 2000). Differences in program effectiveness as found in
existing empirical field studies may be driven by differences in design components. A call has

5
been recently made for further research on the effectiveness of various loyalty program
designs (Jain and Singh 2002). Though experimental research exists on this issue, no evidence
from field data is available. Such a comparison of the effectiveness of loyalty program
designs would require data on more than one loyalty program simultaneously.
This paper assess the effects of loyalty programs.. To summarize, we contribute to the
existing literature in the following ways:
1. The paper provides an estimate of loyalty program effects that accounts for causality
problems between loyalty program membership and purchasing behavior. We do so by
using instrumental variables such as loyalty program enjoyment and privacy concerns
to explain the loyalty program membership decision.
2. The study uses market-wide data on competitive purchasing and marketing-mix
instruments such as competitive loyalty programs. Competitive purchasing
information enables us to use share-of-wallet as the dependent variable of key interest.
3. The paper uses loyalty program design characteristics to explain differences in loyalty
program effectiveness.
Our study uses household panel data from the Dutch supermarket industry. Seven of
the twenty largest Dutch supermarket chains use loyalty programs. For 1926 households,
information is available on purchasing behavior and loyalty program memberships in all
twenty supermarket chains during a two-and-a-half-year period. Substantial overlap of loyalty
program memberships exists, and about 50% of the households have multiple memberships.
To assess the effects of loyalty programs on purchasing behavior we use a Tobit-II model
with instrumental variables (IV) (Woolbridge 2002, p.567-571). The Tobit-II model includes
a selection equation for supermarket choice, and an attraction specification for share-of-
wallet. We account for endogeneity by first estimating a model for loyalty program
membership using instrumental variables, and then imputing predicted rather than observed

6
loyalty program memberships in the Tobit-II model. Finally, we control for relevant
marketing-mix factors of supermarket chains, and socio-demographic characteristics of panel
households. We find that loyalty programs increase share-of-wallet by 8.3% (1.8 percent
points) on average.
The remainder of the paper is structured as follows. Section 2 develops a conceptual
framework on the relation between loyalty programs and purchasing behavior, and formulates
hypotheses. Section 3 discusses the data of our empirical study, and Section 4 describes the
Tobit-II model with instrumental variables. A presentation of the results follows, and we
conclude with a discussion.
CONCEPTUAL FRAMEWORK
This section presents a framework that makes it possible to study empirically the
effectiveness of loyalty programs in a retail market. In line with previous research (e.g. Sharp
and Sharp 1997; Yi and Jeon 2003), we define a loyalty program as an integrated system of
marketing actions that aims to make member customers more loyal. To take advantage of the
loyalty program, a customer must become a member and must identify himself as such at
every purchase occasion. In retailing, most loyalty programs use loyalty cards for
identification and registration.
Effectiveness measurement: the causality puzzle
A unique trait of a loyalty program is that customers decide explicitly whether or not to
participate in the program. Retailer companies can assess program effectiveness by evaluating
behavioral differences between member and non-member customers. However, a simple
comparison of the differences in purchasing behavior between these groups may lead to an
overestimation of the loyalty program effect, because customers do not become loyalty

7
program members randomly. Rather, a customer becomes a member of the loyalty program if
the expected benefits are higher than the expected costs, a choice that is partly driven by the
attraction of the chain itself to a customer (Mauri 2003). For example, customers who live
close to a given supermarket and already frequent the chain may derive relatively high
benefits from the loyalty program without even changing their behavior. Thus, because loyal
customers derive the highest benefits from a loyalty program, those customers who are
already loyal are most likely to participate (Bolton, Lemon, and Verhoef 2002).
From an econometric perspective, this comes down to a causality or endogeneity
problem. The relevant issue is that in a model with customer purchases as the dependent
variable, and loyalty program membership as an independent variable, the loyalty program
membership variable and the error term of the model are positively correlated. The violation
of the model assumption of independence between the independent variables and the error
term leads to biased parameter estimates (Greene 2000, p.370). Specifically, in case of a
positive correlation between loyalty program membership and the error term, the influence of
loyalty program membership is overestimated (Verbeek 2000, p.121). Including additional
explanatory variables that drive customer purchasing (such as location or price) may mitigate
the problem, but the problem itself will not disappear until all variables playing a role in the
purchasing decision are available. Because this is practically impossible, alternative solutions
should be found to estimate the loyalty program effect unbiasedly.
A first option is to analyze changes in purchasing behavior after a customer has
entered the loyalty program. However, this does not solve the causality problem for two
reasons. First, changes in loyalty program memberships can be endogenous as well. The
drivers of the decision to become a loyalty program member could be factors that stimulate
share-of-wallet as well, such as a residential move, the opening of a chain outlet nearby, a
change in income, etc. Second, households that become loyalty program members long after

8
the launch of the program are atypical. Allaway, Berkowitz, and D’Souza (2003) show that
late adopters of a loyalty program live further away from the chain outlet, are less convinced
of the program’s benefits, and perceive a program membership as riskier. So because of
potential endogeneity problems and non-representativeness of late adopters, we do not
consider the analysis of loyalty program membership changes to be an appropriate reflection
of program effectiveness.
A second option is to analyze store-level sales patterns as done by Sharp and Sharp
(1997), and to compare these to norms, such as those provided by Dirichlet models. A caveat
of this approach is that one cannot distinguish between the effects of the loyalty program and
those of other marketing-mix elements. In the absence of household-level information, one
cannot distinguish between households that are loyalty program members (and thus exposed
to the program incentives) and others households (Bell and Lal 2003; Drèze and Hoch 1998;
Sharp and Sharp 1997). In other words, household-level data are important for ascribing
customer-purchasing patterns to loyalty programs.
The most general applicable solution is to use instrumental variables, as we do in this
study. One or more variables (instruments) must be found that influence the loyalty program
membership decision of a household, but that are also unrelated to the household’s purchasing
decision. In marketing, instrumental variables have recently been introduced in the area of
price promotions to model the endogeneity of a manager’s price promotion decision
(Chintagunta 2001; Villas-Boas and Winer 1999). However, the methodology could also be
applied to household-level decisions. First, a model of loyalty program membership must be
estimated, with the instruments and other available variables as explanatory variables. The
predicted values from this model should then be imputed in the main model for customer
purchasing as an independent variable (instead of the observed loyalty program
memberships). The procedure will be discussed in further detail later in this paper.

9
Figure 1 presents our conceptual framework, the components of which are discussed
in the remainder of this section. We start by explaining our key dependent variable, and then
discuss the loyalty program membership decision and loyalty program effects, followed by a
presentation of other store and household characteristics in the framework.
[Figure 1 about here]
Customer Loyalty
Loyalty programs aim primarily to stimulate customer purchasing at the retail company in a
structural way, which comes down to improving behavioral loyalty. The marketing literature
provides a wide range of loyalty measures (Odin, Odin, and Valette-Florence 2001), the
usefulness of which depends on the specific market and study objective. In grocery retailing,
purchasing behavior is characterized by high buying frequency and variation in basket sizes
(Kahn and Schmittlein 1992). Further, consumers are often regular buyers at different
companies (Kahn and McAlister 1997), a phenomenon referred to as polygamous loyalty
(Dowling and Uncles 1997). Given these characteristics, share-of-wallet is the most suitable
measure for behavioral loyalty (Berger et al. 2002; Mägi 2003). Share-of-wallet measures the
share of category expenditures spent on purchases at a certain company, which integrates
choice behavior and transaction sizes during a certain time period into one single measure.
Equivalently, in brand management the share-of-category requirements is often used,
calculated as the average proportion of the brand’s customers’ category purchases over all
customers, as a measure of brand loyalty or even brand health (Ailawadi, Lehmann, and
Neslin 2001; Bhattacharya et al. 1996).
The share-of-wallet a household gives to a store chain depends on its attraction to the
household compared to the attraction of the competitors. In order to analyze the effects of
loyalty programs on share-of-wallet, we need to understand 1) what drives customers to
10
become loyalty program members, and 2) how loyalty program membership affects share-of-
wallet.
Loyalty Program Membership
When deciding whether to participate in a company’s loyalty program, a customer compares
the expected benefits and costs. The economic benefits of a loyalty program increase with a
customer’s share-of-wallet with the company. The share-of-wallet a customer had with the
company in the past is an indicator of the expected benefits s/he will derive from the loyalty
program. The initial share-of-wallet is thus expected to be positively related to a customer’s
loyalty program membership decision. Further, existing research has found that some
consumers intrinsically enjoy participating in marketing actions, such as coupons (Mittal
1994), price promotions (Chandon, Wansink, and Laurent 2000), or shopping in general
(Reynolds and Beatty 1999). The same intrinsic enjoyment could exist for participation in
loyalty programs. So, customers may derive non-economic benefits from a loyalty program
membership, when they intrinsically enjoy loyalty program participation.
Most retail loyalty programs do not require membership fees, so that customers do not
face economic costs concerning a loyalty program membership. However, customers entering
a loyalty program usually have to complete a subscription form in which s/he must provide
personal data, such as address information and household composition. A company can use
this information in combination with purchase data as registered through the loyalty cards to
target households for direct mailings or to apply micro marketing. Some customers may not
be very willing to provide personal information, especially if this concerns personal
identifiers such as address information (Phelps, Nowak, and Ferrell 2000). This reluctance is
caused by consumer’s need for control and a negative attitude towards direct marketing
(Phelps, D'Souza, and Nowak 2001). Some customers thus perceive giving away privacy as a

11
non-economic cost, and will allow this cost to negatively influence loyalty program
participation. In sum, we advance the following hypotheses:
H1a: Initial share-of-wallet has a positive influence on the likelihood of a customer becoming a loyalty program member.
H1b: Loyalty program enjoyment has a positive influence on the likelihood of a customer becoming a loyalty program member.
H1c: Privacy concerns have a negative influence on the likelihood of a customer becoming a loyalty program member.
For methodological reasons (Woolbridge 2002, p.567-571), we also include in the model the
available store- and household characteristics for loyalty program membership (see Figure 1).
Loyalty Program Effects
In essence, loyalty programs enhance customer loyalty because they increase the utility of the
company’s offering. Loyalty programs could enhance customer loyalty through several
economic, psychological and sociological drivers. Two economic drivers particularly enhance
the effectiveness of loyalty programs. First, a loyalty program provides member customers
with economic value in the form of rewards. In general, the magnitude of the rewards relates
positively to the share-of-wallet to the company, thus providing incentives for customer
loyalty. Second, loyalty programs create switching costs, because loyalty program members
lose value if they stop purchasing from the company. The value lost could consist of saving
point credits or a good purchasing track record that ensures privileges. Especially economic-
oriented research has used this argument as a rationale for the existence of loyalty programs
(Kim, Shi, and Srinavasan 2001; Klemperer 1987; Kopalle and Neslin 2003). Because of the
rewarding and especially switching costs, a loyalty program can create a certain degree of
calculative commitment or stickiness in customers’ relation with the company (Johnson et al.
2001). Calculative commitment can be defined as the extent to which consumers perceive the

12
need to maintain a relationship, given the significant termination or switching costs associated
with leaving (Geyskens et al. 1996).
Further, several psychological drivers can enhance customers’ calculative
commitment, and make loyalty program effects stronger than could be expected from a purely
economic point of view. First of all, consumers appreciate rewards -- not only absolutely, but
also relatively to other consumers (Feinberg, Krishna, and Zhang 2002). Knowing that you
are provided with better value than others excites feelings of being a preferred or special
customer -- even if the group of others is relatively small. Given that loyal customers receive
the most rewards, this will enhance feelings of fairness and customer loyalty as a result.
Second, loyalty program incentives can induce smart shopper feelings (Kivetz and Simonson
2002b), and pride about being economical (Chandon, Wansink, and Laurent 2000; Schindler
1998). Consumers may derive a special sense of satisfaction at having achieved or won
something without having to pay the normal price or currency. For some of them, the effort of
obtaining the reward may even justify luxury consumption (Kivetz and Simonson 2002a).
Third, existing research shows that customers overvalue the rewards to be obtained, as they
tend to maximize the value offered by the medium (the loyalty program), rather than the final
outcome (Hsee et al. 2003; Van Osselaer, Alba, and Manchanda 2003). This implies that
customers aim to maximize promotions and saving points, where it would be rational to
assess the utility of the final product minus the disutility of its costs.
Loyalty programs can also have sociological effects. They create affective
commitment, a generalized sense of positive regard for, and attachment to, the organization
(Geyskens et al. 1996). In this way, loyalty programs not only buy, but also earn, customer
loyalty (Edvardsson et al. 2000). DeWulf, Odekerken-Schröder, and Iacobucci (2001) show
for relational investments in consumer-firm relationships the existence of a reciprocity norm:
customers evoke obligation towards those who treat them well or provide value. In addition,

13
customers that become members of the loyalty program are likely to identify more strongly
with the company, because the membership relates them to a group of privileged customers
(Bhattacharya, Rao, and Glynn 1995; Oliver 1999). The need to belong to groups is a
fundamental human motivation (Baumeister and Leary 1995), and identification with
commercial organizations is intensifying due to the growing centrality of consumption and
materialistic desires in society (Fournier 1998; Muniz and O’Guinn 2001). Most loyalty
programs use loyalty cards, and this explicit token of membership strengthens a customer’s
sense of belonging to the company, or makes their attitude towards the company more
accessible (Dick and Basu 1994). Bhattacharya and Sen (2003) propose that strategies to
develop customer identification are especially beneficial in industries where consumers
purchase frequently, and differentiation between suppliers is low.
Overall, a large number of drivers exist that can make a loyalty program effective.
This research does not aim to assess the relative importance of each driver, but rather to give a
rationale for loyalty program effectiveness, and to provide a proper empirical assessment of
this. The importance of the drivers might also depend on loyalty program type (Bolton,
Kannan, and Bramlett 2000). The focus of our research is on loyalty programs that provide
predominantly economic (tangible) rewards, but enrich them with social (intangible) rewards.
Because the drivers discussed all point in the same direction, we hypothesize:
H2: A loyalty program membership enhances the share-of-wallet of a household with the company.
Loyalty program design
The effectiveness of a loyalty program is likely to depend on its design (Dowling and Uncles
1997; Jain and Singh 2002). An important element is how much rewarding value the loyalty
program gives to its members, and in which form. Key design elements of the loyalty
program are the promotion and saving features (Yi and Jeon 2003).

14
A promotion feature gives price discounts on certain items of the assortment
exclusively for loyalty program members. In this way, a promotion feature supplies member
customers with immediate rewards for their purchases (Yi and Jeon 2003), and provides them
with privileges over non-members. The promotion feature stimulates customers to purchase
the items on promotion, to buy categories they usually buy in other stores (Drèze and Hoch
1998) or to show stockpiling behavior (Chandon, Wansink, and Laurent 2000).
A saving feature gives loyalty program members saving points, dependent on the
monetary amount spent at the company. A program member can redeem these points for a
reward, such as a free product, after s/he has reached the minimal redeeming threshold. This
threshold is typically such that the customer must spend a considerable total monetary
amount. The saving feature stimulates customers to show loyal purchasing behavior in order
to reach certain levels of saving points. Further, a saving feature can create switching costs.
When a consumer stops buying he loses the saving points enclosed in his saving balances.
The question whether either a saving feature or a promotion feature is more effective
is theoretically undefined. A saving feature stimulates purchases of the entire assortment and
not only of specific items (as the promotion feature does). Very importantly, a saving feature
creates switching costs (Zhang, Krishna, and Dhar 2000). Obtaining saving rewards requires
considerable consumer effort, so that we expect stronger feelings of uniqueness and pride
(psychological drivers). A price promotion has, in contrast with saving points, a direct
negative effect on share-of-wallet. On the other hand, the perceived value of the promotion
feature is found to be higher than an equivalent saving feature among consumers, since
customers prefer to obtain a reward immediately over getting it sometime in the future. (Yi
and Jeon 2003). Further, the promotional feature directly supports the supermarket chain’s
value proposition (Dowling and Uncles 1997). In sum, both saving and promotion features

15
contain attractive aspects to consumers, so that no ex-ante expectation exists in favor of either
the saving or the promotion feature. We hypothesize:
H3a: Promotion rewards enhance the effect of loyalty programs on share-of-wallet. H3b: Saving rewards enhance the effect of loyalty programs on share-of-wallet. H3c: Promotion rewards and saving rewards are equally effective in enhancing share-of-
wallet.
Store variables
A store chain’s attractiveness depends on the benefits of the attributes offered by the store.
Two important store attributes are location and price level (Kahn and McAlister 1997).
Existing research has found that households with different socio-demographic characteristics
derive different benefits from the same store attributes, e.g. because of variation in
opportunity costs (Bell and Lattin 1998). We expect therefore that the relationship between a
store variable and share-of-wallet is moderated by socio-demographic characteristics1.
Location relates to the transaction costs of shopping, because households incur travel
costs to visit a store. A high density of outlets of a chain enhances its attraction, because the
expected travel costs are lower. However, a high outlet density is less important if the
potential benefits of visiting a store far away are higher. These expected benefits are higher
for large basket sizes, which are associated with large households (Bell and Lattin 1998). For
high-income households, different effects might counterbalance each other: these households
have high marginal costs of time, but the possession of cars and storage space diminish travel
costs and increase basket sizes (Mittal 1994). In sum, we expect a positive effect of outlet
density on share-of-wallet that is moderated negatively by household size and undeterminably
by household income.
We expect a negative relation between a chain’s price level and share-of-wallet,
because high prices relate to higher shopping costs. Low-income households are especially
1 The nature of the model (attraction model) prevents us from including the main effects of socio-demographic variables, because they drop out of the model (see also model section).

16
price sensitive because of their limited budgets. Further, high prices might also correlate with
better quality and luxury assortment, which is especially appreciated by high-income
households (Mulhern 1997). Regarding household size, large households can benefit more
from low prices because of larger basket sizes (Bell and Lattin 1998). In sum, we expect a
negative effect of price on share-of-wallet that is positively moderated by household income
and negatively moderated by household size.
Several other store variables and household characteristics drive the attraction of a
company. To account for the remaining heterogeneity in households and store chains, we
include the share-of-wallet in the initialization period previous to the modeling period as an
explanatory variable (Bucklin, Gupta, and Siddarth 1998; Guadagni and Little 1983).
DATA DESCRIPTION
To test the hypotheses, we conduct an empirical study on the Dutch supermarket industry.
Consumers make transactions in supermarkets frequently, and face only low switching costs,
which make supermarkets an appropriate market for our study of loyalty programs. We have
panel data on purchasing behavior of 1926 Dutch households in supermarkets during a period
of 2.5 years. The panel members provide purchasing information by scanning all their
supermarket receipts with a home scanner. The data cover the period January 1998 until July
2000, and were provided by GfK PanelServices Benelux. The first six months are used as an
initialization period. For each of the remaining two years, we know for each household the
total yearly expenditures in each supermarket chain. We use data on expenditures in the
largest twenty supermarket chains; these comprise 92.8% of the entire market sales.
Seven of the twenty supermarket chains have loyalty programs, all of which use
loyalty cards for identification and registration. Typically, a loyalty program provides saving
rewards through a saving points feature and price discounts through a promotion feature. The

17
saving feature provides saving points linearly dependent on the amount spent. Members must
spend a considerable amount to reach the minimal redemption threshold and to exchange
points for gifts or free products. The promotion feature gives price discounts on a varying set
of items of the assortment, only announced within the store. On their receipts, customers find
the number of points saved and the total discount earned with the loyalty card. In addition, the
specific loyalty programs give also other rewards such as lotteries, direct mailings or member
web pages. Both large and small supermarket chains have introduced loyalty programs, and
some of the largest chains in the Netherlands do not have a loyalty program.
Table 1 shows the loyalty programs with their designs, the market shares of the
supermarket chains, and some customer base characteristics. The customer base of a
supermarket chain is defined as those households that visited the chain at least once during a
certain year. Consumers visit on average 4.2 different supermarket chains per year (median =
4). We limit the discussion of the loyalty program design to the promotion and saving
features, because no systematic variation of interest exists for the other design elements.
[Insert Table 1 about here]
Panel households complete a yearly questionnaire in which they report on their loyalty
program memberships at supermarkets. On average, 67% of the customer base are loyalty
program members, but this number varies between supermarket chains from 52% (Konmar)
to 83% (Albert Heijn). Most panel households do not change their loyalty program
memberships during the observation period, but some households enter or quit a loyalty
program. About 88% of the panel households are members of at least one supermarket loyalty
program. The duplication rate of loyalty program memberships is substantial: 33% of the
panel households have two loyalty programs, 16% have three, and 4% have four or more
loyalty programs. On average, a household holds 1.68 loyalty program memberships. The
questionnaires were administered in January 1999 and 2000, and the information from each

18
questionnaire is applied to a yearly interval, starting six months before until six months after
measurement. To operationalize all variables, an extensive additional data collection took
place, which we discuss below (Appendix A provides an overview of data sources).
Dependent variable
We measure purchasing behavior as the share-of-wallet in a supermarket chain in a specific
year:
SOWist = Share-of-wallet of household i in store s during year t,
i = 1, …, I; I = 1926 (households),
s = 1,…, S; S = 20 (supermarket chains),
t = 1,…, T; T = 2 (years).
Independent variables: Loyalty program memberships
We have information on loyalty program memberships of households in each of the seven
loyalty programs. As discussed, we need instrumental variables that can explain loyalty
program membership. We use information from a survey held in November 2000 among the
households in the panel to obtain the variables loyalty program enjoyment and privacy
concerns. Loyalty program enjoyment is measured by three items )79.alpha s(Cronbach’ = ,
and privacy concerns by a single item (see Appendix B). In sum, the following loyalty
program variables are introduced:
LPist = 1, if supermarket chain s has a loyalty program and household i is member
during year t; 0 otherwise;
ENJOYi = Enjoyment of loyalty program membership by household i;
PRIVi = Privacy concerns of loyalty programs by household i;

19
Independent variables: Store characteristics
We include the store characteristics location and price level as independent variables in our
model. We obtained the number of outlets of a supermarket chain in each of the twelve
provinces of the Netherlands in 2000 from Elsevier Business Information. Some supermarket
chains are exclusively located in a limited number of provinces, while others are available
nationwide. For each province, the distribution density is measured as the number of outlets
of a supermarket chain divided by the sum of outlets over all chains. This measure is applied
to an individual household, based on its province of residence.
We use Dutch Consumer Reports to determine the price level of the supermarket
chains. The Dutch Consumer Association regularly compares the price of a fixed basket
across all large supermarket chains, with a sample of five outlets per chain. We construct a
categorical price variable with three levels (low, medium, high), in which all levels include
approximately the same number of chains (8, 7, 8). In sum, we introduce the following set of
store characteristics:
DENSist = Number of outlets of supermarket chain s as a fraction of the total number of
supermarket outlets, in the province of residence of household i in year t;
PHst = 1 if supermarket chain s is high-priced during year t; 0 otherwise;
PLst = 1 if supermarket chain s is low-priced during year t; 0 otherwise.
Independent variables: Household heterogeneity
Our model accounts for both observed and unobserved household heterogeneity. Socio-
demographic information is available on household size and net household income of panel

20
members2. The socio-demographic variables are included in the model as moderators of the
store variables. The variables household income and household size are measured as
deviations from the sample average. By operationalizing the variables in this way, the main
effect of a store characteristic measures the effects for an average household. To account for
unobserved heterogeneity, we include share-of-wallet during the initialization period as an
additional explanatory variable. No random effects are used in our model, due to the limited
number of observations per household (two). We therefore introduce:
HHSIZEit = Number of persons in household i in year t minus average number of persons
in a household;
HHINCit = Monthly net income in 1,000 Euros of household i in year t, minus average
monthly household income;
SOWIis = Share-of-wallet of household i in store s during the initialization period.
MODEL
A model on the effects of loyalty programs on share-of-wallet yields specific challenges. To
be logically consistent, the model must produce estimates between 0 and 1 (range constraint),
and the sum of estimates over all stores must equal 1 (sum constraint) (Hanssens, Parsons,
and Schultz 2001, p.121). Because a linear regression model does not meet these constraints,
an attraction model is used instead. Attraction models have been widely used for modeling
market shares (Leeflang et al. 2000, p.171), but they can also be applied to household-level
share-of-wallets. The basic idea is that the share-of-wallet of a store depends on its relative
attraction to a consumer:
2 We tried to include additional household characteristics in the model, such as the presence of young children in the household and the educational attainment of the housewife. Because none of the characteristics showed significant effects and theoretical arguments for them were not very strong, we dropped them from the final model.
21
(1)
∑=
=S
sist
istist
A
ASOW
1
.
The attraction of a store (Aist) is a function of loyalty program membership and store
characteristics3. We specify the attraction function as a Multi Nominal Logit Model, so that it
becomes:
(2) )exp( 654321 istisstitstitistitistsist SOWIPLPHDENSLPA νββββββ ++++++= ,
with
(3) 5,4,3,321 =++= mHHINCHHSIZE itmitmmmit γγγβ .
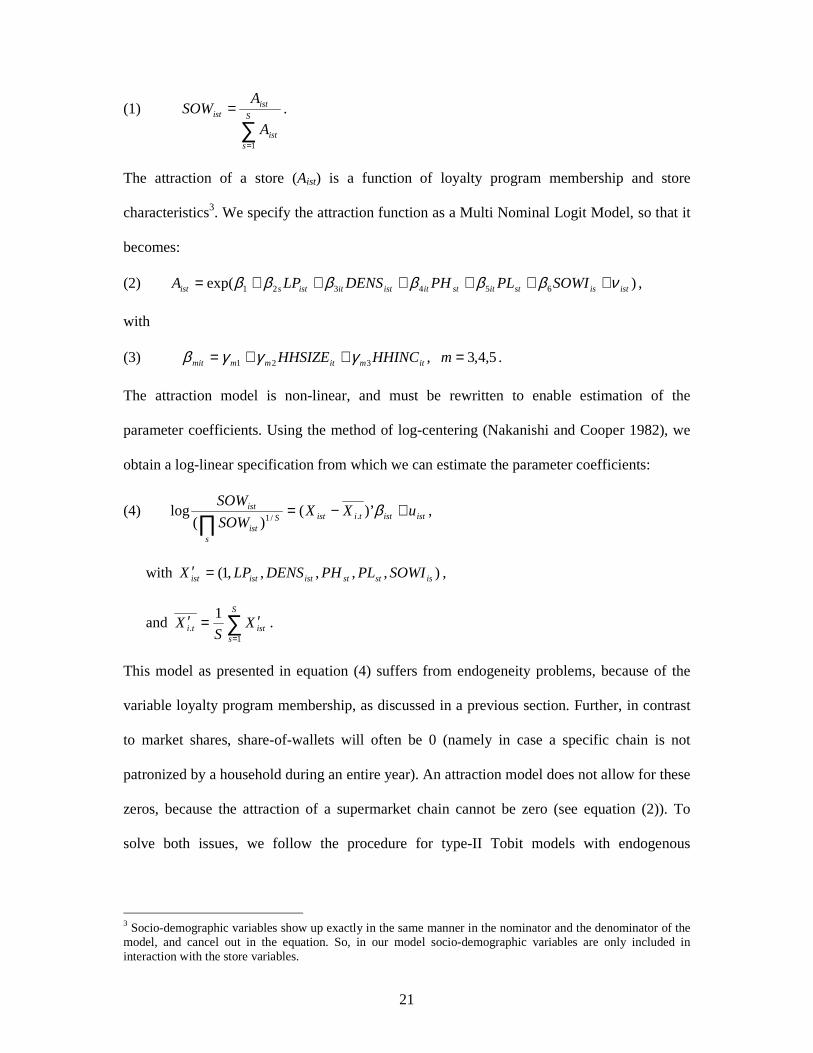
The attraction model is non-linear, and must be rewritten to enable estimation of the
parameter coefficients. Using the method of log-centering (Nakanishi and Cooper 1982), we
obtain a log-linear specification from which we can estimate the parameter coefficients:
(4) ististtiistS
sist
ist uXXSOW
SOW+−=
∏β)’(
)(log ./1
,
with ),,,,,1( isststististist SOWIPLPHDENSLPX =′ ,
and ∑=
′=′S
sistti X
SX
1.
1.
This model as presented in equation (4) suffers from endogeneity problems, because of the
variable loyalty program membership, as discussed in a previous section. Further, in contrast
to market shares, share-of-wallets will often be 0 (namely in case a specific chain is not
patronized by a household during an entire year). An attraction model does not allow for these
zeros, because the attraction of a supermarket chain cannot be zero (see equation (2)). To
solve both issues, we follow the procedure for type-II Tobit models with endogenous
3 Socio-demographic variables show up exactly in the same manner in the nominator and the denominator of the model, and cancel out in the equation. So, in our model socio-demographic variables are only included in interaction with the store variables.

22
variables as recently proposed by Woolbridge (2002, p.567-571).
The first step consists of predicting loyalty program memberships from instrumental
variables, as discussed in the conceptual section of the paper. The explanatory variables in the
model for share-of-wallet are included as well. The equation becomes:
(5) iststitstit
istitiiisist
uPLPH
DENSPRIVENJOYSOWILP
++++++++=
76
54321
ααααααα
;
(6) 7 ,6 ,5,321 =++= mHHINCHHSIZE itmitmmmit ϕϕϕα .
Although loyalty program membership is a dichotomous variable, we should use
linear regression analysis here (Woolbridge 2002, p.569). The model provides a linear
projection for loyalty program membership from its instruments, which will be imputed in the
main model that explains SOWist. In other words, we replace LPist in equation (2) with the
predictions from the regression model in equation (5) ( istPL̂ ).
Another issue is that the dependent variable share-of-wallet is zero in a large number
of cases, because a household patronizes only a limited number of supermarket chains.
Analyzing only those observations with a positive share-of-wallet is not a good solution. That
is, share-of-wallet is positive conditional on the store being chosen, and we expect that the
factors that influence a household’s store choice influence the share-of-wallet of chosen stores
as well. Therefore, the error terms of both models are most likely correlated, and if we do not
account for this dependency, the parameter estimates of a model for share-of-wallet are likely
to be biased (Greene 2000; Thomas 2001). A model must therefore combine both share-of-
wallet and store choice.
A selection variable CHOICEist is thus introduced, which indicates whether store s is
in the choice set of household i during quarter t. We assume that a consumer chooses to visit a
supermarket chain (CHOICEist=1) if the underlying utility *istCHOICE is positive. We let

23
*istCHOICE be linearly dependent on the same store characteristics and household
characteristics as used in the attraction function (see equations (2)-(4)), but replace share-of-
wallet in the initialization period with a similar choice variable (CHOICEIis). Further, the
instrumental variable procedure of Woolbridge (2002) requires that we also include the two
instruments (PRIVi and ENJOYi) as explanatory variables. We combine store choice and
attraction in a Tobit-II model (Verbeek 2000, p.209), which consists of a selection equation
(store choice model) and a quantity equation (attraction model) (see Appendix C).
The Tobit-II model is estimated with maximum likelihood (the likelihood function is
presented in Appendix C). The model corrects for the interrelation between store choice and
share-of-wallet, because both decisions are integrated into one model. The model accounts for
the fact that households differ in the number of stores they visit, because the share-of-wallet
of a household is modeled as the attraction of the specific store divided by the sum of the
attractions of the stores chosen by this particular household. In this way we also account for
competitive loyalty programs, because these enhance the attraction of the competition. The
model also corrects for endogeneity in the relation between loyalty program membership and
share-of-wallet by including the predictions from instrumental variables as an explanatory
variable, rather than loyalty program membership itself.
RESULTS
As a first step we estimate a model of the loyalty program membership decision, with the
instrumental variables as the independent variables. The results are presented in Table 2. The
model is overall significant )001. ,29.168)13,16205(( <= pF , with a model fit of R2 = .20.
Share-of-wallet in the initialization period has a significant positive influence on loyalty
program membership )001. ,483.ˆ( 2 <= pα , which confirms Hypothesis 1a. Loyalty program
enjoyment positively affects loyalty program membership )001. ,097.ˆ( 3 <= pα , meaning that

24
enjoyment of participation in loyalty programs is a consumer trait that enhances participation
in such programs (Hypothesis 1b confirmed). Privacy concerns influence loyalty program
membership negatively )012. ,024.ˆ( 4 =−= pα , implying that privacy concerns indeed
withhold customers from participation in loyalty programs (Hypothesis 1c confirmed).
Because both loyalty program enjoyment and privacy concerns are significant in the model,
we may conclude that they are appropriate instruments to tackle the endogeneity problem.
[Insert Table 2 about here]
In the second step we include the predictions from the regression model in the Tobit-II
model. The Tobit-II model is overall highly significant ( 001.,4.168912 <= pχ ). The
likelihood ratio test of independent equations is rejected ( 001.,2.11212 <= pχ ), implying
that independent estimation of the selection and quantity equations would have led to
significant biases. The pseudo R2 of the model is .89, calculated in the manner proposed by
Laitila (1993). The parameter estimates of the model are reported in Table 3. In the store
choice equation, outlet density has a positive influence and price has a negative effect. Store
choice is also strongly positively related to choice in the initialization period. Since the store
choice equation is merely included to obtain unbiased effect estimates for the share-of-wallet
equation, discussion of the latter will be our focus.
[Insert Table 3 about here]
We find that loyalty program membership influences store attraction positively for all
seven loyalty programs, but that the effect is significant for only four loyalty programs (left-
hand side of Table 3). The loyalty program coefficient is significant at the 5% level for two
loyalty programs (LP3 and LP4), and even at the 1% level for two other loyalty programs
(LP2 and LP7). This means that Hypothesis 2 is confirmed for four out of seven loyalty
programs. As a benchmark, a model was also estimated with one pooled loyalty program
membership variable. In this model, loyalty program membership has a significant positive

25
effect )001. , 82.4 ,180.ˆ( 2 <== ptβ , which also supports Hypothesis 2. However, a
likelihood ratio test between this model and the model with store-specific loyalty program
effects shows that loyalty program effects differ significantly between store chains
)001. ,3.111( <= pLR . This justifies the inclusion of store-specific effects. All store
characteristics and their socio-demographic moderators have the expected signs, but only
price level and share-of-wallet in the initialization period have a significant effect on store
attraction.
Effect size and profitability
The magnitude of the effects are not directly apparent from the parameter estimates, due to
the non-linear nature of the model. Further, the coefficients represent the effects of variables
on attraction and not on share-of-wallet, which complicates interpretations. To gain better
insight into loyalty program effects, we perform what-if simulations for the households in the
database. We compare the model predictions of the entire customer base of supermarket chain
s for the present situation (the supermarket chain has a loyalty program) with the hypothetical
situation in which the chain does not have a loyalty program. The hypothetical situation is
simulated by removing the loyalty program from the chain under consideration, and keeping
all other loyalty programs and explanatory variables unchanged. The model predictions thus
represent the situation of a comparable chain in terms of the marketing mix, customer base,
and competitive environment, but without a loyalty program. We calculate the average share-
of-wallet, or the share-of-category requirements, for both situations. Subsequently, this is
done for all supermarket chains with a loyalty program, and the effect size is calculated as the
difference between the predicted share-of-category requirements in the present situation and
the fictive situation without loyalty program (Table 4).
[Insert Table 4 about there]
26
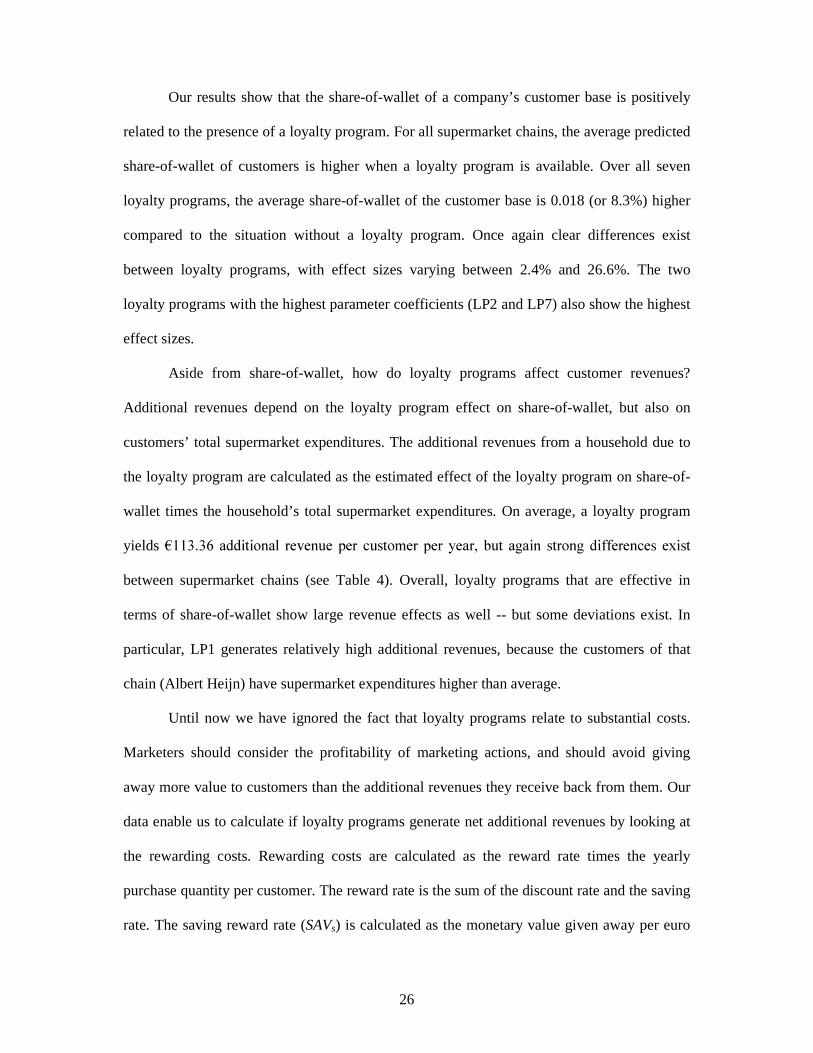
Our results show that the share-of-wallet of a company’s customer base is positively
related to the presence of a loyalty program. For all supermarket chains, the average predicted
share-of-wallet of customers is higher when a loyalty program is available. Over all seven
loyalty programs, the average share-of-wallet of the customer base is 0.018 (or 8.3%) higher
compared to the situation without a loyalty program. Once again clear differences exist
between loyalty programs, with effect sizes varying between 2.4% and 26.6%. The two
loyalty programs with the highest parameter coefficients (LP2 and LP7) also show the highest
effect sizes.
Aside from share-of-wallet, how do loyalty programs affect customer revenues?
Additional revenues depend on the loyalty program effect on share-of-wallet, but also on
customers’ total supermarket expenditures. The additional revenues from a household due to
the loyalty program are calculated as the estimated effect of the loyalty program on share-of-
wallet times the household’s total supermarket expenditures. On average, a loyalty program
yields ¼������� DGGLWLRQDO� UHYHQXH� SHU� FXVWRPHU�SHU� \HDU�� EXW� DJDLQ� VWURQJ� GLIIHUHQFHV�H[LVW�
between supermarket chains (see Table 4). Overall, loyalty programs that are effective in
terms of share-of-wallet show large revenue effects as well -- but some deviations exist. In
particular, LP1 generates relatively high additional revenues, because the customers of that
chain (Albert Heijn) have supermarket expenditures higher than average.
Until now we have ignored the fact that loyalty programs relate to substantial costs.
Marketers should consider the profitability of marketing actions, and should avoid giving
away more value to customers than the additional revenues they receive back from them. Our
data enable us to calculate if loyalty programs generate net additional revenues by looking at
the rewarding costs. Rewarding costs are calculated as the reward rate times the yearly
purchase quantity per customer. The reward rate is the sum of the discount rate and the saving
rate. The saving reward rate (SAVs) is calculated as the monetary value given away per euro

27
spent through the saving feature (Liston-Heyes 2002). Although the saving rewards consist of
presents or free products, it was possible to determine their monetary value. We used web
sites and contacted managers to obtain this information. Dutch Consumer Reports (2000)
measured the discount rate (DISCs) of the loyalty programs by taking a sample of loyalty
program members’ receipts and calculating the average discount percentage obtained per
loyalty program. Table 4 provides the average yearly rewarding costs of the customers per
supermarket chain. The net revenues, calculated as the difference between the average
additional revenues minus the rewarding costs, show a mixed picture (far right-hand column
of Table 4). On average, a loyalty program enhances the net yearly revenues of a customer
with ¼��������+RZHYHU�� WKH� OR\DOW\�SURJUDPV�RI�IRXU�RXW�RI� VHYHQ�FKDLQV� OHDG� WR� ORZHU�QHW�
customer revenues. One loyalty program with a significant positive effect on share-of-wallet
appears not to realize positive net revenues (LP3).
Loyalty Program Design
Our analyses show a wide variation in loyalty program effectiveness between the different
programs. This could very well be caused by differences in program design. To investigate
this, we estimate a regression model with program effectiveness of the seven loyalty programs
as the dependent variable, and discount rate and saving reward rate as explanatory variables.
We use generalized least squares to account for differences in variances between loyalty
program effectiveness coefficients and covariances between them (Verbeek 2000).
The model is significant )039. ;627.6)3,7(( == pF , and the fit is high (R2 = .73). We
obtained the following estimated equation (t-values between brackets):
(7) )90.1()00.4()67.3(
*133.*100.376.ˆ̂
−++−= ssss SAVDISC ωβ .

28
The analysis shows that a higher saving rate enhances loyalty program effectiveness
)028. 133;.ˆ( 1 == pθ , so that we can confirm hypothesis 3b. On the other hand, the discount
rate has a significant negative influence on loyalty program effectiveness
)001. ,106.ˆ( 2 <−= pθ , and we cannot confirm hypothesis 3a. We also find that the saving
reward rate influences loyalty program effectiveness significantly better than the discount rate
)004. ,71.2(21
ˆˆ ==−
pt θθ , which implies that we also have to reject the neutrally formulated
hypothesis 3c. Companies seeking to realize maximal effectiveness of their loyalty programs
should thus put more value into saving rewards than into promotion rewards4. Loyalty
programs that give too much value through the promotion feature may become ineffective and
may even generate negative net revenues. Apparently, the price reductions from the program
lead to a decrease in share-of-wallet that is not compensated by an increase due to loyalty
enhanced.
[Insert Table 5 here]
Benchmark model
We argue that accounting for endogeneity problems is important in order to obtain an
unbiased assessment of loyalty program effectiveness. To explore to what extent ignoring
endogeneity leads to substantial biases, we compare our model with a benchmark model that
does not account for endogeneity. This model uses the observed loyalty program membership
observations instead of the predictions from the loyalty program membership model. In the
benchmark model all seven loyalty programs have a significant positive influence on share-
of-wallet )001.( <p . In our original model this was the case for only four out of seven
4 We also estimated a model in which we added an interaction term between the saving and discount rates. The interaction term turned out to be insignificant, while the conclusions concerning the main effects remained the same.

29
programs. Thus three chains would have incorrectly judged their loyalty programs as effective
if endogeneity had been ignored.
[Insert Figure 2 about here]
The estimates of the benchmark model were also used to simulate the effect on the
average share-of-wallet (see graphical presentation in Figure 2). The benchmark model
overestimates the loyalty program effect considerably for all seven programs. The effect size
is between 1.4 and 7.9 times as high as the effect measured according to the original model.
Thus, a model that does not account for endogeneity overestimates the loyalty program effect
structurally. No systematic pattern is apparent, however, in the differences in the magnitude
of the biases between the loyalty programs.
DISCUSSION
We studied the effects of seven loyalty programs on share-of-wallet using market-wide panel
data on supermarket purchases. Our study is the first to account for the two-sided causality
between loyalty program membership and share-of-wallet by specifying a model for the
loyalty program decision and using instrumental variables such as privacy concerns and
loyalty program enjoyment. Loyalty programs are generally found to influence share-of-
wallet positively. Moreover, we find that ignoring endogeneity leads to a substantial
overestimation of the effects. Our model revealed that three out of seven loyalty programs in
the study are not effective. Giving rewarding value through direct discounts to program
members seems to harm loyalty program effectiveness. In terms of profitability, we find that
four programs give more rewards away to their members than they earn back through
additional customer revenues.

30
Managerial implications
The results of this study could help managers to improve their decisions concerning loyalty
programs. A company (re)considering the use of such a program should realize that loyalty
programs are generally effective in enhancing share-of-wallet, but not for each store chain. A
company that runs a loyalty program should therefore closely monitor its effectiveness. Our
results show that this is not trivial. Loyalty programs aim to enhance customer purchasing, but
the company’s best customers are the most likely to subscribe as member. This leads to
causality problems, which invalidate a simple comparison of purchasing behavior of loyalty
program members versus non-members. Valid assessments can be obtained only through
studies using market-wide data and extensive customer background information. Because
individual companies possess mainly company-specific data, cooperation with market
research companies that hold consumer panels is an option.
Further, a company should pay careful attention to loyalty program design, as this is
proven to influence effectiveness. When focusing on the trade-off between direct and delayed
rewards, managers are advised to invest rewarding money predominantly in delayed rewards,
such as a saving feature. The loyalty program designs studied here are fairly basic and similar,
and companies could gain through differentiation of their design. A more unique loyalty
program could cause customers to specifically favor a particular loyalty program, to the extent
of keeping them from competitive memberships as well. One direction worthy of further
investigation is refinement of loyalty incentives by progressive saving point schedules or
customer tiers (silver, gold and diamond members), as often seen in frequent flyer programs.
Managers could use field experiments in test markets to measure customer reactions to such
refinements.
Managers should also incorporate the costs involved in the loyalty program into their
decision process. Our data reveal that four out of seven loyalty programs in the study are not

31
profitable. Managers should avoid giving away more rewarding value than they earn through
additional revenues that are generated. Where possible, companies should also aim to control
the costs involved, e.g. by cooperating with other parties (Cigliano et al. 2000) .
Finally, our analyses show that privacy fears still prevent some customers from loyalty
program participation. This implies that part of the customer base is not exposed to loyalty
programs that could enhance customer loyalty. Current privacy legislation protects customer
privacy to a great extent, and some of their fears might be irrational. In order to reduce
customers’ privacy fears, a retail company should invest in proper communication to
customers about privacy protection guarantees and the constraints on data usage (Phelps,
Nowak, and Ferrell 2000).
Limitations and further research
We undertook a market-wide study of all loyalty programs in the Dutch supermarket industry
and found overall positive effects of programs on share-of-wallet. Given that the relationship
proneness and product category involvement of consumers is low in this industry, we could
expect these effects to be even larger in other industries, such as clothing retailing (De Wulf,
Odekerken-Schröder, and Iaccobucci 2001). Further, the loyalty programs are fairly basic and
could be even more effective if the loyalty incentives are further refined (with progressive
saving point schedules or customer tiers, for example). More research is required as well on
the effects of social benefits (e.g. special shopping nights or newsletters for members) on
affective commitment and customer loyalty.
We focus on share-of-wallet as our dependent variable, but loyalty programs might
also affect total category expenditures. In fact, Kopalle and Neslin (2003) find that the
elasticity of category demand can be one of the drivers of loyalty program success. This topic
is definitely worth further empirical study. We believe that the issue of category elasticity is

32
especially relevant for shopping goods (such as apparel), and less relevant for the grocery
product that are the topic of this study.
Further, share-of-wallet is a behavioral loyalty measure, and the development of
attitudinal loyalty is also relevant (Yi and Jeon 2003). Behavioral loyalty not supported by
attitudinal loyalty is spurious (Dick and Basu 1994), in the sense that it can easily be attacked
by competitors. More research is needed into the extent to which attitudinal versus behavioral
loyalty is enhanced by loyalty programs. Also of interest is the question to what extent the
various drivers (economic, psychological, and social) play a mediating role in forming
behavioral loyalty. In particular, it would be interesting to study the proposed development of
belonging, identification or reciprocity. A fruitful extension to current research on these issues
would be an examination of how customers deal with multiple memberships. How do positive
attitudes towards a company develop if several companies provide loyalty benefits at the
same time?
Another limitation of our study is that we were not able to incorporate all costs related
to the loyalty program. We studied the profitability of loyalty programs by measuring the
effects on purchasing behavior versus the rewarding costs. However, a loyalty program also
incorporates maintenance costs, such as operation of data warehouses, administration of
rewards, logistics of availability of the rewards in the stores, etc. We had no access to
estimates of such costs, which might diminish the profitability of the loyalty programs even
further. On the other hand, we assumed that all saving points were redeemed, which is usually
not the case (Drèze and Hoch 1998). However, our current benefit-cost comparison may
reveal to what extent additional revenues compensate the additional rewards given to the
customer.
Some additional benefits may be derived from the loyalty program as well. Our study
focused on loyalty programs as a means of improving loyal behavior, but did not consider that

33
a company might be motivated to introduce a loyalty program in order to obtain purchase data
(Day 2000; Mauri 2003). A loyalty program provides the company with full information of
customers’ purchasing behavior, and could be enriched with socio-demographics and causal
information such as price promotions. Rossi, McCulloch, and Allenby (1996) show the value
of using this information for target marketing to certain customer groups. Such a strategy of
direct marketing fulfills customer needs more specifically, so that marketing budgets are spent
more efficiently.
Overall, our research shows that loyalty programs are effective, especially when they
provide value through saving features. The effects are easily overestimated, however, when
bilateral causality is ignored. Taking into account costs is essential to evaluate not only the
effectiveness but also the profitability of loyalty programs.

34
FIGURE 1
Conceptual Framework
Loyalty Program Membership
Store Characteristics: - Distribution Density - Price Level
Share-of-
Wallet
Household Characteristics: - Household Size - Household Income
Instrumental variables: - Loyalty Program Enjoyment - Privacy Concerns
Attraction Competitive Store Chains
Share-of-Wallet initial

35
FIGURE 2
Changes in Share-of-Wallet of the Customer Base
Due to Loyalty Program
* p<.05 ** p<.10 ns. Not significant
0
0.01
0.02
0.03
0.04
0.05
0.06
0.07
0.08
0.09
LP1 LP2 LP3 LP4 LP5 LP6 LP7
Ave
rag
e C
han
ge
in S
OW
Accounting for two-sided causality
Not accounting for two-sided causality
ns
**
**
**
*
**
*
**
ns
**
ns
**
**
**

36
TABLE 1 Information on Supermarket Chains with a Loyalty program
Loyalty Program Market Share (in 2000)
Customer Base Characteristics (Based on Panel Households)
Supermarket Chain
Loyalty
Program
Saving
Rate
Discount
Rate
Market
Share
%
Market
Share
Rank
# Stores
visited
% Loyalty
Program
Members
# Competitive
Cards held by Loyalty
Program Members
Albert Heijn
Super de Boer
Edah
Integro
Konmar
Jan Linders
COOP
LP1
LP2
LP3
LP4
LP5
LP6
LP7
1.0%
.5%
2.0%
.6%
.8%
.5%
4.0%
4%
0%
5%
2%
5%
9%
3%
24%
9%
8%
7%
3%
1%
1%
1
3
4
6
9
17
18
4.56
5.04
5.07
5.18
5.53
4.95
5.08
83%
60%
76%
52%
52%
74%
68%
1.02
1.38
1.48
1.54
1.89
1.67
1.61

37
TABLE 2
Explaining Loyalty Program Membership by Instrumental Variables
Explanatory variable Parameter Estimate t-Value Constant
SOWI
ENJOY
PRIV
Distribution Density (DENS)
Price High (PH)
Price Low (PL)
DENS*HHSIZE
DENS*HHINC
PH* HHSIZE
PH*HHINC
PL*HHSIZE
PL*HHINC
1
2
3
4
51
61
71
52
53
62
63
72
73
–.208
.483
.097
–.021
.776
.018
–.082
.018
.069
.043
–.015
.021
–.018
9.36***
33.70***
8.88***
–2.45**
10.90***
1.41
–3.08***
.36
1.38
4.37***
–1.55
2.41**
–.95
R2 .20 *** p<.01 ** p<.05 * p<.10 (one-sided tests)

38
TABLE 3
Results of the Tobit-II model
ATTRACTION (Share-of-wallet) CHOICE
Explanatory Variable: Parameter
Estimate
t-Value Parameter
Estimate
t-Value
Constant
LP1
LP2
LP3
LP4
LP5
LP6
LP7
β1
21
22
23
24
25
26
27
.271
.064
.511
.099
.153
.096
.114
.944
22.21***
1.15
8.03***
1.74**
2.00**
.87
.61
5.80***
–1.946
–61.68**
Distribution Density (DENS)
Price High (PH)
Price Low (PL)
DENS*HHSIZE
DENS*HHINC
PH* HHSIZE
PH*HHINC
PL*HHSIZE
PL*HHINC
SOWI
CHOICEI
ENJOY
PRIV
31
41
51
32
33
42
43
52
53
6
.312
–.083
.172
.114
.097
–.014
.015
.047
–.014
4.615
1.56*
–2.44***
5.72***
.87
.73
–.62
.75
1.79**
–.86
126.40***
7.378
–.1511
.124
.130
.274
–.010
.002
.018
–.012
2.446
.032
–.018
54.38***
–7.74***
7.72***
1.39*
2.79***
–.72
.14
1.73**
–1.14
139.25***
1.94**
–1.40*
σ12
σ1
���
1.191
*** p<.01 ** p<.05 * p<.10 (one-sided tests).

39
TABLE 4
Changes in Share-of-Wallet and (Net) Revenues of the Customer Base
Due to Loyalty Program
∆ SOW*
Change in
Share-of-Wallet
% Change in
Share-of-Wallet
∆ Revenues**
∆ Costs**
∆ Net
Revenues**
LP1
LP2
LP3
LP4
LP5
LP6
LP7
Average
.009
.032
.006
.008
.006
.005
.060
.018
3.0%
16.5%
2.6%
3.3%
3.6%
2.4%
26.6%
8.3%
¼
¼
¼
¼
¼
¼
¼
¼
55.05
188.24
37.21
51.41
35.72
34.77
391.09
113.36
¼
¼
¼
¼
¼
¼
¼
¼
93.99
5.81
93.06
36.72
65.38
101.86
178.40
82.17
¼
¼
¼
¼
¼
¼
¼
¼
–38.94
182.43
–55.85
14.69
–29.66
–67.09
212.69
31.18 * Average predicted change for a customer of the supermarket chain in Euros ** Average predicted change for a customer of the supermarket chain in Euros per year

40
APPENDIX A
DATA SOURCES Source Obtained data
GfK Panel Services 1998-2000
Dutch Consumer Reports 2000
Dutch Consumer Reports 1998-2000
Elsevier Business Information 2000
ACNielsen Consumer Insight 2002
Purchasing behavior of Dutch households in
supermarkets, loyalty program memberships,
privacy concerns, loyalty program enjoyment,
and socio-demographics of the households
Discount Rate of Dutch Supermarket Loyalty
Programs
Price Level Dutch Supermarket Chains
Outlet Locations of Dutch Supermarket
Chains
Loyalty Program Membership rate of
American and Canadian households in
supermarkets.

41
APPENDIX B
INSTRUMENTAL VARIABLES MEASUREMENT
Enjoyment of program membership
Measured by the following items on five-point Likert scale
(1 = strongly disagree; 5 = strongly agree):
• I enjoy participating in loyalty or saving programs.
• Loyalty and saving programs offer attractive benefits.
• I appreciate being selected for loyalty programs and special offers.
Cronbach’s alpha = 0.79
Average value = 3.14, standard deviation = .82
Privacy concerns of registration
Measured by the following item, on five-point Likert scale
(1 = strongly disagree; 5 = strongly agree):
• The registration systems of loyalty programs infringe on my privacy.
Average value = 2.90, standard deviation = .96

42
APPENDIX C
MODEL SPECIFICATION
(C1) 0 if )()(
log *.11/1
>+′−=∏ istististtiistS
sist
ist CHOICEuXXSOW
SOW β ,
with ),,,,ˆ,1(1 isststististist SOWIPLPHDENSPLX =′
(C2) 0 if 0 * ≤= istist CHOICESOW ,
(C3) istististist XCHOICE εγ +′= 2* ,
with ),,,,,,1(2 isststistiiist CHOICEIPLPHDENSENJOYPRIVX =′
(C4)
=
1 ,
,,
0
0
12
1221
σσσε
NIDuist
ist .
We set the constraint σ2 =1 to avoid identification problems (Verbeek 2000, p.208).
The likelihood of the model is (Verbeek 2000, p.211):
(C5) )|0()()0(
)0()0|()0(
*
0 1
*
**
0 1
*
istististist
istististist
SOWCHOICEPSOWfCHOICEp
CHOICEPCHOICESOWfCHOICEpL
>≤=
>>≤=
∏ ∏∏ ∏
.
Equations C6-C8 show the expressions for the components of the likelihood function.
(C6) )(1)0( 2*
ististist XCHOICEp γ′Φ−=≤ ,
(C7)
′−−
−=
∏21
2
11/121
/)()log(
log
2
1exp
2
1)( σβ
πσististist
s
Sist
istist XX
SOW
SOWSOWf ,
(C8)
−
′−−−+′
Φ
=>
∏2
112
.11/12
1122
*
/1
)))())log()(log/(
)|0(
σσ
βσσγ isttiistS
sistististist
istist
XXSOWSOWX
SOWCHOICEP
.

43
REFERENCES
Ailawadi, Kusum L., Donald R. Lehmann, and Scott A. Neslin (2001), "Market Response to a Major Policy Change in Marketing Mix: Learning from Procter & Gamble’s Value Pricing Strategy," Journal of Marketing, 65 (January), 44-61. Allaway, Arthur W., David Berkowitz, and Giles D’Souza (2003), "Spatial Diffusion of a New Loyalty Program through a Retail Market," Journal of Retailing, 79 (3), 137-51. Baumeister, Roy F. and Mark R. Leary (1995), "The Need to Belong: Desire for Interpersonal Attachments as a Fundamental Human Motivation," Psychological Bulletin, 117 (3), 497-529. Bell, David R. and Rajiv Lal (2003), "The Impact of Frequent Shopper Programs in Grocery Retailing," Quantitative Marketing and Economics, 1 (2), 179-202. Bell, David R. and James M. Lattin (1998), "Shopping Behavior and Consumer Preference for Store Price Format: Why "Large Basket" Shoppers Prefer Edlp," Marketing Science, 17 (1), 66-88. Berger, Paul D., Ruth N. Bolton, Douglas Bowmann, Elten Briggs, V. Kumar, A. Parasuraman, and Creed Terry (2002), "Marketing Actions and the Value of Customer Assets: A Framework for Customer Asset Management," Journal of Service Research, 5 (1), 39-54. Bhattacharya, C.B., Peter S. Fader, Leonard M. Lodish, and Wayne S. DeSarbo (1996), "The Relationship between the Marketing Mix and Share of Category Requirements," Marketing Letters, 7 (1), 5-18. Bhattacharya, C.B., Hayagreeva Rao, and Mary Ann Glynn (1995), "Understanding the Bond of Identification: An Investigation of Its Correlates among Art Museum Members," Journal of Marketing, 59 (October), 46-57. Bhattacharya, C.B. and Sankar Sen (2003), "Consumer-Company Identification: A Framework for Understanding Consumers’ Relationships with Companies," Journal of Marketing, 67 (April), 76-88. Bolton, Ruth N., P.K. Kannan, and Matthew D. Bramlett (2000), "Implications of Loyalty Program Membership and Service Experiences for Customer Retention and Value," Journal of the Academy of Marketing Science, 28 (1), 95-108. Bolton, Ruth N., Katherine N. Lemon, and Peter C. Verhoef (2002), "The Theoretical Underpinnings of Customer Asset Management: A Framework and Propositions for Future Research," Nashville: Marketing Science Institute. Bucklin, Randolph E., Sunil Gupta, and S. Siddarth (1998), "Determining Segmentation in Sales Response across Consumer Purchase Behaviors," Journal of Marketing Research, 35 (May), 189-97. Chandon, Pierre, Brian Wansink, and Gilles Laurent (2000), "A Benefit Congruency Framework of Sales Promotion Effectiveness," Journal of Marketing, 64 (October), 65-81.
44
Chintagunta, Pradeep (2001), "Endogeneity and Heterogeneity in a Probit Demand Model: Estimation Using Aggregate Data," Marketing Science, 20 (4), 442-56. Cigliano, James, Margaret Georgiadis, Darren Pleasance, and Susan Whalley (2000), "The Price of Loyalty," The McKinsey Quarterly (4), 68-77. Day, George S. (2000), "Managing Marketing Relationships," Journal of the Academy of Marketing Science, 28 (1), 24-30. DeWulf, Kristof, Gaby Odekerken-Schröder, and Dawn Iacobucci (2001), "Investments in Consumer Relationships: A Cross-Country and Cross-Industry Exploration," Journal of Marketing, 65 (October), 33-50. Dick, Alan S. and Kunal Basu (1994), "Customer Loyalty: Toward an Integrated Conceptual Framework," Journal of the Academy of Marketing Science, 22 (2), 99-113. Dowling, Grahame R. and Mark Uncles (1997), "Do Customer Loyalty Programs Really Work?," Sloan Management Review, 38 (Summer), 71-82. Drèze, Xavier and Stephen J. Hoch (1998), "Exploiting the Installed Base Using Cross-Merchandising and Category Destination Programs," International Journal of Research in Marketing, 15 (5), 459-71. Edvardsson, Bo, Michael D. Johnson, Anders Gustafsson, and Tore Strandvik (2000), "The Effects of Satisfaction and Loyalty on Profits and Growth: Products Versus Services," Total Quality Management, 11 (7), 917-27. Feinberg, Fred M., Aradhna Krishna, and Z. John Zhang (2002), "Do We Care What Others Get? A Behaviorist Approach to Targeted Promotions," Journal of Marketing Research, 39 (August), 277-91. Fournier, Susan (1998), "Consumers and Their Brands: Developing Relationship Theory in Consumer Research," Journal of Consumer Research, 24 (March), 343-73. Geyskens, Inge, Jan-Benedict E.M. Steenkamp, Lisa K. Scheer, and Nirmalya Kumar (1996), "The Effects of Trust and Interdependence on Relationship Commitment: A Trans-Atlantic Study," International Journal of Research in Marketing, 13 (4), 303-17. Greene, William H. (2000), Econometric Analysis. London: Prentice Hall International. Guadagni, Peter M. and John D. Little (1983), "A Logit Model of Brand Choice Calibrated Scanner Data," Marketing Science, 2 (3), 203-38. Hanssens, Dominique M., Leonard J. Parsons, and Randall L. Schultz (2001), Market Response Models: Econometric and Time Series Analysis. Boston: Kluwer Academic Publishers. Hsee, Christopher K., Fang Yu, Jiao Zhang, and Yan Zhang (2003), "Medium Maximization," Journal of Consumer Research, 30 (June), 1-14.

45
Jain, Dipak C. and Siddhartha S. Singh (2002), "Customer Lifetime Value Research in Marketing: A Review and Future Directions," Journal of Interactive Marketing, 16 (2), 34-46. Johnson, Michael D., Anders Gustafsson, Tor Wallin Andreassen, Line Lervik, and Jaesung Cha (2001), "The Evolution and Future of National Customer Satisfaction Index Models," Journal of Economic Psychology, 22 (2), 217-45. Kahn, Barbara E. and Leigh McAlister (1997), How Do Customers Decide Where to Purchase Groceries? Reading, Massachusetts: Addison, Wesley. Kahn, Barbara E. and David C. Schmittlein (1992), "The Relationship between Purchases Made on Promotion and Shopping Trip Behavior," Journal of Retailing, 3 (Fall), 294-315. Kim, Byung-Do, Mengze Shi, and Kannan Srinavasan (2001), "Reward Programs and Tacit Collusion," Marketing Science, 20 (2), 99-120. Kivetz, Ran and Itamar Simonson (2002a), "Earning the Right to Indulge: Effort as a Determinant of Customer Preferences Towards Frequency Program Rewards," Journal of Marketing Research, 39 (May), 155-70. ---- (2002b), "The Role of Effort Advantage in Consumer Response to Loyalty Programs: The Idiosyncratic Fit Heuristic," Journal of Marketing Research, 40 (November). Klemperer, Paul (1987), "The Competitiveness of Markets with Switching Costs," Rand Journal of Economics, 18 (1), 138-50. Kopalle, Praveen K. and Scott A. Neslin (2003), "The Economic Viability of Frequency Reward Programs in a Strategic Competitive Environment," Review of Marketing Science, 1 (1), 1-39. Laitila, Thomas (1993), "A Pseudo-R^2 Measure for Limited and Qualitative Dependent Variable Models," Journal of Econometrics, 56 (3), 341-56. Leeflang, Peter S.H., Dick R. Wittink, Michel Wedel, and Philippe A. Naert (2000), Building Models for Marketing Decisions: Kluwer Academic Publishers. Lewis, Herschell Gordon (1997), "Does Your "Loyalty" Program Inspire Any Loyalty?," Direct Marketing (June), 46-48. Liebermann, Yehoshua (1999), "Membership Clubs as a Tool for Enhancing Buyers’ Patronage," Journal of Business Research, 45 (3), 291-97. Liston-Heyes, Catherine (2002), "Pie in the Sky? Real Versus Perceived Values of Air Miles," Journal of Consumer Policy, 25 (1), 1-27. Mägi, Anne W. (2003), "Share of Wallet in Retailing: The Effects of Customer Satisfaction, Loyalty Cards and Shopper Characteristics," Journal of Retailing, 109 (2), 1-11. Mauri, Chiara (2003), "Card Loyalty. A New Emerging Issue in Grocery Retailing," Journal of Retailing and Consumer Services, 10 (1), 13-25.

46
Mittal, Banwari (1994), "An Integrated Framework for Relating Diverse Consumer Characteristics to Supermarket Coupon Redemption," Journal of Marketing Research, 31 (November), 533-44. Mulhern, Francis J. (1997), "Retail Marketing: From Distribution to Integration," International Journal of Research in Marketing, 14 (2), 103-24. Muniz, Albert M. and Thomas C. O’Guinn (2001), "Brand Community," Journal of Consumer Research, 27 (March), 412-32. Nakanishi, Masao and Lee C. Cooper (1982), "Simplified Estimation Procedures for MCI Models," Marketing Science, 1 (3), 314-20. Odin, Yorick, Nathalie Odin, and Pierre Valette-Florence (2001), "Conceptual and Operational Aspects of Brand Loyalty: An Empirical Investigation," Journal of Business Research, 53, 75-84. Oliver, Richard L. (1999), "Whence Consumer Loyalty?," Journal of Marketing, 63 (Special Issue), 33-44. Passingham, Judith (1998), "Grocery Retailing and the Loyalty Card," Journal of Market Research Society, 40 (January), 55-63. Phelps, Joseph, Giles D’Souza, and Glen Nowak (2001), "Antecedents and Consequences of Consumer Privacy Concerns: An Empirical Investigation," Journal of Interactive Marketing, 15 (4), 2-17. Phelps, Joseph, Glen Nowak, and Elizabeth Ferrell (2000), "Privacy Concerns and Consumer Willingness to Provide Personal Information," Journal of Public Policy & Marketing, 19 (1), 27-41. Reynolds, Kristy E. and Sharon E. Beatty (1999), "A Relationship Customer Typology," Journal of Retailing, 75 (4), 509-23. Roehm, Michelle L., Ellen Bolman Pullins, and Harper A.JR. Roehm (2002), "Designing Loyalty-Building Programs for Packaged Goods Brands," Journal of Marketing Research, 39 (May), 202-13. Rossi, Peter E., Robert E. McCulloch, and Greg M. Allenby (1996), "The Value of Purchase History Data in Target Marketing," Marketing Science, 15 (4), 321-40. Rust, Roland T., Valarie A. Zeithaml, and Katherine N. Lemon (2000), Driving Customer Equity: How Customer Lifetime Is Reshaping Corporate Strategy. New York: The Free Press. Schindler, Robert M. (1998), "Consequences of Perceiving Oneself as Responsible for Obtaining a Discount: Evidence for Smart-Shopper Feelings," Journal of Consumer Psychology, 7 (4), 371-92.

47
Sharp, Byron and Anne Sharp (1997), "Loyalty Programs and Their Impact on Repeat-Purchase Loyalty Patterns," International Journal of Research in Marketing, 14 (5), 473-86. Thomas, Jacquelyn S. (2001), "A Methodology for Linking Customer Acquisition to Customer Retention," Journal of Marketing Research, 38 (May), 262-68. Van Osselaer, Stijn M.J., Joseph W. Alba, and Puneet Manchanda (2003), "Irrelevant Information and Mediated Intertemporal Choice," Journal of Consumer Psychology, 14 (2). Verbeek, Marno (2000), A Guide to Modern Econometrics. Chichester: John Wiley & Sons, LTD. Verhoef, Peter C. (2003), "Understanding the Effect of Customer Relationship Management Efforts on Customer Retention and Customer Share Development," Journal of Marketing, 67 (4), 30-45. Villas-Boas, J.Miquel and Russell S. Winer (1999), "Endogeneity in Brand Choice Models," Management Science, 45 (10), 1324-38. Woolbridge, Jeffrey M. (2002), Econometric Analysis of Cross Section and Panel Data. Cambridge, Massachusetts: The MIT Press. Yi, Youjae and Hoseong Jeon (2003), "Effects of Loyalty Programs on Value Perception, Program Loyalty, and Brand Loyalty," Journal of the Academy of Marketing Science, 31 (3), 229-40. Zhang, Z. John, Aradhna Krishna, and Sanjay K. Dhar (2000), "The Optimal Choice of Promotional Vehicles: Front-Loaded or Rear-Loaded Incentives," Management Science, 46 (3), 348-62.