Embed Size (px)
Citation preview
'oup
Journal of Contemporary Asia H RoutledgeVol. 38. No. 4. November 2008. pp. 560-590 ^
Do Manufacturing Firms in ChinaInnovate?
LUDOVICO ALCORTA*, BRANKA UREM** andAN TONGLIANG^*CENTRUM Católica. Pontificia Universidad Católica del Peru. Lima. Peru. **VNU-MERIT.Maastricht. The Netherlands. ^Department of Economics, Nanjing University. Jiangsu. China
ABSTRACT 77II.Î article provides empirical light on the debate concerning whether manufactur-ing firms in China are becoming major innovators. Based on an innovation survey carried out inJiangst4 Province, the article finds that most firms engage in innovative activities hut the.se aremainly of an incremental nature. Radical innovation, as a proportion of sales, is relatively lowif compared internationally. Innovation in China is mainly to catch-up and is novel relative tothe firm and the domestic market. A small proportion of innovation is new to the world. Intensityami productivity indicators suggest that small, foreign and textile firms are leading innovative ef-forts. Firms innovate to improve their general competitiveness, including improving product qual-ity and extending market .share, obtain income from technology and defend themselves fromresearch and development expenditure by competitors. Innovators value significantly more thannon-innovators the range of innovative objectives they seek to achieve. The main obstacles to in-novation ari.se from technical and marketing weaknesses; the perception ofthe.se obstacles varieswidely between radical innovators and non-innovators. The article concltides that while innovativeactivities are emerging it will still take some time for China to have a major role in the interna-tional division of innovative labour.
KEY WORDS; Innovation, innovation indicators, innovation objectives, innovation obstacles,manufacturing industry, China
China's economic achievements since launching its market-orientated economicreforms in the late 1970s have been impressive. Not that rapid growth and acutestructural change was unheard of in the country, but the pace at which economictransformations have been taking place for the last 20 years or so is staggering.Between 1990 and 2002 China's per capita growth doubled that of other "highperforming" Asian economies, such as Singapore, South Korea and Hong Kong andthere was a 10% hike in the share of manufacturing industry to 51.7% of GDP,making China one of the major sources of industrial goods in the world (seeSchaaper, 2004). According to the Organisation for Economic Co-operation andDevelopment (OECD) definitions, China's high-tech industry is as large as theEuropean Union's and, taking into consideration its medium-tech industry as well, it
Correspondence Address: Ludovico Alcorta. CENTRUM Católica, Pontificia Universidad Católica delPeru, Calle 9 s/n. Urb. Los Alamos de Monterrico - Surco, Lima, Peru. Email: aalcortac«!pucp.edu.pe
ISSN 0047-2336 Print/1752-7554 Online/D8/040560-31 © 2008 Journal of Contemporary AsiaDOI: 10.1080/00472330802309781
Do Manufacturing Firms in China Innovate? 561
is larger than the USA's, Japan's or Korea's. High-tech manufacturing exports(mainly consumer electronics and computer equipment) now account for the largestshare of Chinese and 5% of world exports, increased seven-fold between 1992 and2001 to $US67 billion and are more than half of the equivalent Japanese figure andmore than a quarter of the USA's high tech exports (Schaaper, 2004).
While it is difficult to play down the importance of these achievements in terms oftheir impact on local development, some argue that China's high-tech exports aredominated by commodity or mature types of information technology products andtherefore compete internationally on the basis of low wages, deteriorating marginsand the importation of higher value-added components, which has also resulted in adeteriorating trade balance in high-tech products (Schaaper, 2004; Steinfeld, 2004).Rosen (2003) also pointed out that the Chinese are a long way from leapfroggingWestern competitors in technology and innovation. China has yet to exhaust itslabour endowment potential before moving to higher knowledge- and capital-intensive products, patents per capita still remain small, there are few financialoptions for innovative private firms and local firms have not been able to buildreliable brand-name businesses. Further, what little innovation emerges takes placeamong foreign investors, who are the only ones with the required technical andmanagerial capabilities (Rosen, 2003).
Contrasting with this rather pessimistic view, there are some authors arguing thatChinese industry may be on the verge of a major technological transformation.Fischer and von Zedtwitz (2004), summarising these views, pointed out that the sizeof China's market, the large pool of foreign-trained and attractively priced scientistsand engineers and growing local investment in research and development (R&D)will if it hasn't already attract not only foreign investors but also local firms intothe creation of advanced technologies and innovation. Hu and Jefferson (2004)argued that provided China maintains its current growth rate and continues itsinternational involvement, it should be able to continue its technologicaldevelopment. Sigurdson (2004) suggested that China may become, in the not toodistant future, a "technological superpower."
The purpose of this article is to throw some empirical light on to this emergingdebate. While much is beginning to be known at the macro-level, there is littleunderstanding of the efforts by firms in China to develop advanced technologies andto innovate at the micro-level. On the basis of a local survey of firms, we will attemptto adress the questions: to what extent is innovation taking place?; what is innovatedand by whom, both in technical terms and degree of novelty terms?; and why dofirms innovate and what problems do they face in innovating? Given the size of theChinese economy the study was concentrated on Jiangsu Province.
Jiangsu Province is an important location of manufacturing activity and a largerecipient of investment in science and technology in China. It is located in theYangtze River Delta, one of the three major concentrations of economic activity inChina, and borders with Shanghai. It has a territory of 102,600 km" and 74.1 millionpeople. Industry sales amounted to Yuan 1,353.2 billion ($US163.2 billion) in 2002and there were 21,476 registered industrial enterprises (Jiangsu Statistical Bureau[JSB], 2003). Jiangsu accounted for 12.5% of total Chinese industrial output in2002, a more than twenty-fold increase in real terms since the end of 1977, and wasthe second largest industrial producer nationally after Guandong Province
562 L. Alcorta et al.
(National Bureau of Statistics of China [NBS]. 2003). The main activities are textilesand garments, chemicals, electrical and electronics products and equipment andmachinery. In 2002. current and capital expenditure on science and technologyamounted to Yuan 29.6 billion, while R&D expenditure accounted for 1.8% of theprovince's GDP, 40% higher than the national average (JSB. 2003). The regionboasts 295,200 individuals involved in scientific and technological tasks (JSB. 2003).
In the second section of the article the sources, definitions and characteristics ofthe survey undertaken in Jiangsu Province are presented. Section 3 will discuss theextent and pattern of manufacturing firm innovation in terms of the technical andextent of novelty dimensions of innovation as well as the objectives and obstaclesunderlying such innovations. To enable a better appraisal, the section will examinethe behaviour of firms in terms of size, ownership and industry. The article will endwith some conclusions on whether firms in China are, or will be, an innovationpowerhouse.
The Jiangsu Province Innovation Survey (JPIS)
Definitions and Design
The questionnaire was designed following OECD and European Commission (EC)guidelines for innovation surveys, commonly known as the Oslo Manual (OECD/EC, 1997). Taking the cue from these guidelines, innovation was defined as thecommercial introduction of new products and processes and the focus was the firmrather than the innovations themeselves.
However, certain modifications were introduced in the questionnaire design. Thefirst change referred to the coverage of non-innovators and innovation types, as theJPIS questionnaire includes non-innovators and technological innovations andmakes a distinction between product and processs innovations. The secondmodification related to broadening the technical definition of innovation to includeboth radical and incremental innovation. Significant or radical product innovationinvolves a transformed design, profound changes in the technical characteristics andfeatures, alternative inputs or components and/or creating different uses orapplications for a good. Significant or radical process innovation involvesmodifications in the layout of production or a completely new production line; theuse of different facilities, equipment and/or machinery; and, changes in the wayinputs and resources are used and deployed. Incremental product innovationinvolves adaptation, enhancement or upgrading in design, technical characteristics,use of inputs and components and applications of the good. Incremental processinnovation requires adaptation, enhancement or upgrading in the layout, methods,resources and use of inputs of production. From a technical perspective incrementalinnovation is far less sophisticated than radical innovation and hence requires lessadvanced scientific and technological knowledge. The third major modificationaimed at getting an even better sense of the degree of novelty. The Oslo Manualdistinguishes between two extremes, innovation new to the world, as the highestdegree of novelty, and innovation new to the firm, as the lowest degree (OECD/EC,1997). When a product or process is new to the world it can unquestionably beconsidered as innovation and its degree of novelty is the highest achievable as no
Do Manufacturing Firms in China innovate? 563
individual, firm or market has ever been exposed to it. Given the large size of China'seconomy and of its individual provinces, innovation novelty was defined in terms ofintermediate degrees, as new to the country and new to the province: China andJiangsu. Jiangsu Province innovations refer to the introduction of products andprocesses already available elsewhere in China. Often they involve imitation butrequire an additional local marketing effort at providing some product information,as a limited amount is already available, and at identifying distribution channels.There may be some adaptations to local tastes that need to be communicated topotential customers. Provincial markets in China are large, idiosyncratic and, untilnot too long ago, self-reliant, so it makes analytical and commercial sense to dealwith them separately. Innovations for the Chinese market include both imitationsfrom abroad not seen locally before, and totally new products and processesdeveloped exclusively for the national market. They require significant marketingefforts in providing information and opening the necessary marketing channels giventhe size and growing complexity of the Chinese economy. The fourth modificationinvolved limiting the reference period to one year (2002), unlike the three-year periodused in some surveys.
Application
The survey covered manufacturing firms only. The statistical units were firms of tenor more employees. The original version of the questionnaire was in English, thentranslated into Chinese, and finally checked against the original English version toensure fidelity. Chief Executive Officers (CEOs), R&D managers and/or seniorcorporate managers filled in the questionnaires.
Jiangsu Province had 18,309 industrial firms in 2000, the year on which the initialestimates were based (JSB, 2001). After excluding non-manufacturing and ruralfirms it was estimated that in the capitals of the province's 13 municipal countiesthere would be around 12,000 manufacturing firms. An initial selection was made byusing every fifth firm from the county capital's telephone directory as there was noofficial registry of firms available.
After pilot testing the questionnaire with Jiangsu Province Statistics Departmentofficials and a few managers, questionnaires were distributed to around 2500manufacturing firms, between May and October 2003. yielding 360 returns. A 3%sample of the enterprises population was believed would provide a reasonabledescription of the province's urban manufacturing effort. After eliminating dupli-cations and non-manufacturing firms, there were 354 potentially usable question-naires, accounting for around 9% of total manufacturing sales in the province.
Manufacturing Innovation in Jiangsu Province
The Extent of Innovation
The JPIS showed that 91.3% of surveyed firms answering the question of whetherthey had introduced innovation indicated they had done so, of which 80.3% claimedthey had introduced product and process innovations, 12.9% product innovationonly and 6.B% process innovation only. Firms that claimed they had introduced
564 L. Alcorta et al.
product innovation amounted to 85.5%. while firms claiming introducing processinnovation amounted to 79.9%.
At first sight these results seem exceedingly high. Although there had beenconsiderable dynamism and competition for some time among Jiangsu firms, whichshould translate into companies continuously trying to modify and improve theirproducts and manufacturing processes to cater for increasing domestic and foreigndemand., the sheer share of innovative firms in total firms was, none the less, startling.In Canada's 1997-99 innovation survey, which shows the highest-ever recordedinnovation figures for all developed countries, 80.2% of manufacturing firms wereinnovators (66.7% product and process. 18% product only and 15.3% process only),while 68% introduced product innovations and 65.8% introduced process innova-tions (Statistics Canada, 2002). The EU's Community Innovation Survey (CIS3) for1998-2000 showed 44% of manufacturing firms engaged in some innovative activity(59.1% product and process. 22.7% product only and 18.2% process only) whilebetween 2001 and 2003 in other developed countries, such as Australia, 39.5% ofmanufacturing firms innovated, while 21. Wo introduced product innovation and29.7% introduced process innovation (Australian Bureau of Statistics [ABS], 2006;EC, 2004). Within individual countries, the share of innovative firms in total firmswas 60% in Germany, 59% in Belgium, 51% in the Netherlands, 49% in Ireland,44% in Finland, 41% in France, 38% in Italy, 37% in Spain and 32% in the UK,
Innovation surveys carried out in developing countries also show much lowerfigures. Argentina's 1998-2001 survey found that 56% of manufacturing firmsinnovated, while 46% of firms innovated in products and 47% in processes (INDFC,2003). South Africa's 1998-2000 innovation survey revealed 49.9% of manufacturingfirms engaging in innovation while, between 2000 and 2001, 35% of Malaysianmanufacturing firms declared themselves as innovators (MASTIC, 2003; Oerlemanset ai., 2003). In 2001-03, 33.3% of Brazilian manufacturing firms had someinnovative activity, while 20.3% introduced product innovations and 26.9%introduced process innovations (IBGE, 2005). In Mexico, in 1999-2000, 28% ofmanufacturing firms were developing at least one innovative project, of which 44%were both product and process projects, 34% were product innovation projects onlyand 22% were process innovation projects only (CONACYT-INEGÍ. 2003).
When comparing international data one key factor to keep in mind is the volun-tary or mandatory nature of the survey. In their comparison between the Canadianand European surveys. Therrien and Mohnen (2003: 362) argued that the legal statusof the survey may introduce a selection bias into the results. In countries where thesurvey is voluntary, the proportion of innovative firms represented should be higher,as non-innovative firms will feel that the questions raised are not relevant for themand hence tend not to respond. In countries where the survey is obligatory both typesof firms would be represented equally. Within European countries, the surveys inIreland and Germany were voluntary while in France it was mandatory. Theresponse was obligatory in the Brazilian case and was voluntary in the JPIS, theAustralian and South African surveys.
A second factor to remember when comparing internationally has to do withdifferences in definition and coverage. In terms of definition, the AustralianInnovation Survey, for instance, defines innovation including changes in organisa-tional and managerial processes, while the Argentinean and South African surveys
Do Manufacturing Firms in China Innovate? 565
consider, in addition, changes in commerciaHsation practices. In terms of coverage,the Canadian Innovation Survey collects data from ñrms with revenues overSC250,000 and 20 or more employees, the Australian survey includes firms withmore than five employees, the Mexican survey includes firms with 50 or moreworkers, and the JPIS, C1S3 and other surveys include firms with ten or moreemployees.
A third factor to consider in international comparisons relates to the level ofsophistication of specific products. The same product manufactured in differentcountries or locations may involve different degrees of complexity in design,engineering, manufacturing process and use of raw materials and labour. Thisimplies significantly different stages in the evolution of uderlying technology. Thesame product can be "state of the art" or incipient and, hence, at different momentsof the S-diffusion curve, yet comparisons do not take this into account.'
In order to be able to assess the extent of innovation in China fully, it is alsonecessary to delve into the distinction radical/incremental, as the JPIS providesmeans of exploring this difference. Taking into account that "significant" in the OsloManual is equivalent to the JPIS concept of "radical," comparable Chinese figureswith other country surveys showed 65.9% of manufacturing firms engaging ininnovative activity (16.1% product only, 8.9% process only and 75% product andprocess), 58.5% of manufacturing firms engaging in product innovation and SA.lVaengaging in process innovation. These figures still remain relatively high ininternational terms.
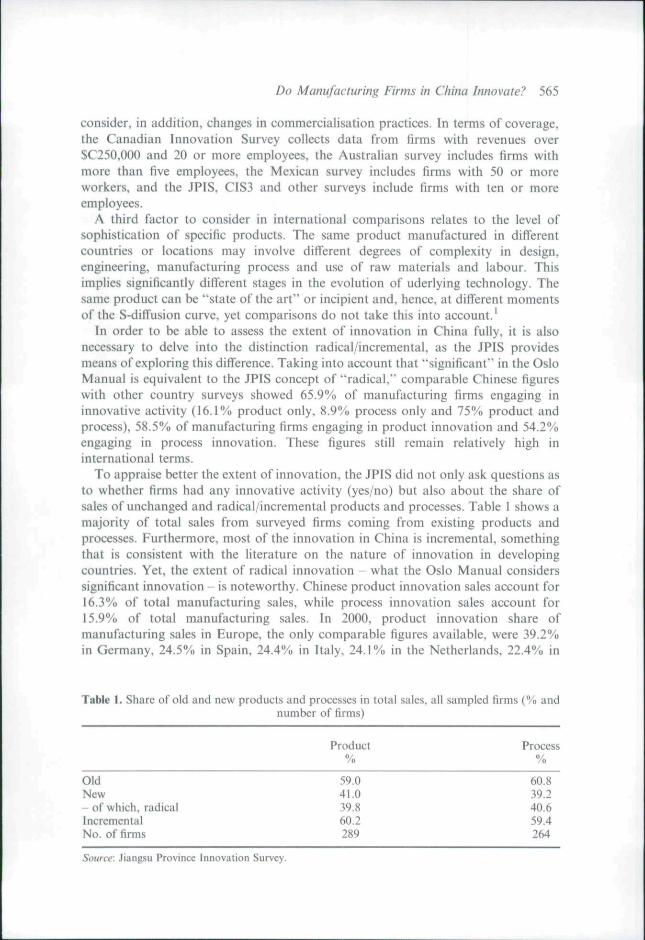
To appraise better the extent of innovation, the JPIS did not only ask questions asto whether firms had any innovative activity (yes/no) but also about the share ofsales of unchanged and radical/incremental products and processes. Table ! shows amajority of total sales from surveyed firms coming from existing products andprocesses. Furthermore, most of the innovation in China is incremental, somethingthat is consistent with the literature on the nature of innovation in developingcountries. Yet, the extent of radical innovation - what the Oslo Manual considerssignificant innovation - is noteworthy. Chinese product innovation sales account for!6.3% of total manufacturing sales, while process innovation sales account for15.9% of total manufacturing sales. In 2000, product innovation share ofmanufacturing sales in Europe, the only comparable figures available, were 39.2%in Germany, 24.5% in Spain, 24.4% in Italy, 24.1% in the Netherlands, 22.4% in
Table 1. Share of old and new products and processes in total sales, all sampled firms (% andnumber of firms)
Product Process% %
Old 59.0 60.8New 41.0 39.2- of which, radical 39.8 40.6Incremental 60.2 59.4No. of firms 289 264
Source: Jiangsu Province Innovation Survey.
566 L. Alcorta et al.
Finland, 17.6% in the UK, 15.7% in Belgium and 14.8% in France (EC, 2004). Salesarising from product innovation by Mexican firms also in 2000, amounted to 37% oftotal manufacturing sales (CONACYT-INEGI, 2003).
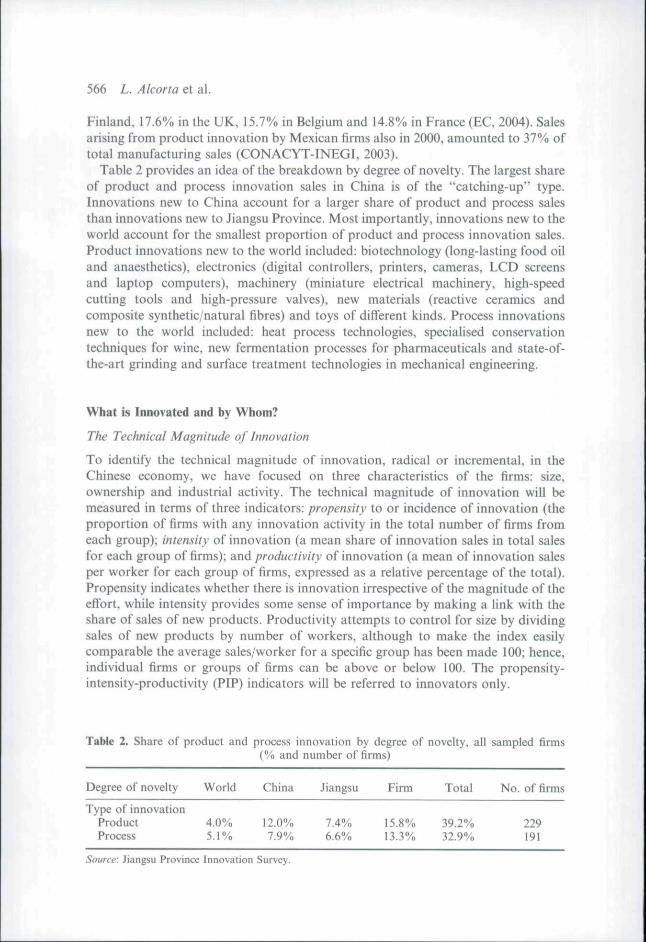
Table 2 provides an idea of the breakdown by degree of novelty. The largest shareof product and process innovation sales in China is of the "catching-up" type.Innovations new to China account for a larger share of product and process salesthan innovations new to Jiangsu Province. Most importantly, innovations new to theworld account for the smallest proportion of product and process innovation sales.Product innovations new to the world included; biotechnology (long-lasting food oiland anaesthetics), electronics (digital controllers, printers, cameras, LCD screensand laptop computers), machinery (miniature electrical machinery, high-speedcutting tools and high-pressure valves), new materials (reactive ceramics andcomposite synthetic/natural fibres) and toys of different kinds. Process innovationsnew to the world included: heat process technologies, specialised conservationtechniques for wine, new fermentation processes for Pharmaceuticals and state-of-the-art grinding and surface treatment technologies in mechanical engineering.
What is Innovated and by Whom?
The Technical Magnitude of Innovation
To identify the technical magnitude of innovation, radical or incremental, in theChinese economy, we have focused on three characteristics of the firms: size,ownership and industrial activity. The technical magnitude of innovation will bemeasured in terms of three indicators: propensity to or incidence of innovation (theproportion of firms with any innovation activity in the total number of firms fromeach group); intensity of innovation (a mean share of innovation sales in total salesfor each group of firms); and productivity of innovation (a mean of innovation salesper worker for each group of firms, expressed as a relative percentage of the total).Propensity indicates whether there is innovation irrespective of the magnitude of theeffort, while intensity provides some sense of importance by making a link with theshare of sales of new products. Productivity attempts to control for size by dividingsales of new products by number of workers, although to make the index easilycomparable the average sales/worker for a specific group has been made 100; hence,individual firms or groups of firms can be above or below 100. The propensity-intensity-productivity (PIP) indicators will be referred to innovators only.
Table 2. Share of product and
Degree of novelty
Type of innovationProductProcess
World
4.0%5.1%
process innovation by degree of(% and nutnber of firms)
China
12.0%7.9%
Jiangsu
7.4%6.6%
Firm
15.8%13.3%
novelty, all
Total
39.2%32.9%
sampled firms
No. of firms
229191
Source: Jiangsu Province Innovation Survey.
Do Manufacturing Firms in China Innovate? 567
Size. China has no consistent definition of firm size. Liang (2003) and Jeffersonet al. (2003) have pointed out that China uses a number of different size definitionswhich have changed several times and, since 1998, are industry specific and include acombination of fixed assets and production capacity, Liang (2003: 1) added that theChinese government would also seem to use a cut-off figure of 500 employees todifferentiate small and medium enterprises from larger ones. Given that the JPIS hadinformation on employment and that most firm size classifications around the worldstill emphasise this dimension, it was decided to adopt an employment-baseddefinition. To make the data comparable, a classification was introduced, whichincludes seven groupings commonly used in other countries.
The innovation literature is divided about the relationship between firm size andinnovation (Stock et al., 2002). Some argue that because small firms are greater risktakers, flexible, communicative, focused and motivated, they can innovate far morethan large firms (Acs and Audretsch, 1990). Others argue that, due to their largerresources and better access to finance, R&D scale economies, market power,developed marketing channels and internal capacity to diversify risk, large firms aregenerally more innovative than small firms (Cohen and Klepper; 1996; Schumpeter,1942). Yet, some other authors contend that small firms focus on productinnovation, while large firms focus on process innovation due to product life-cycleconsiderations (Abernathy and Utterback, 1978).
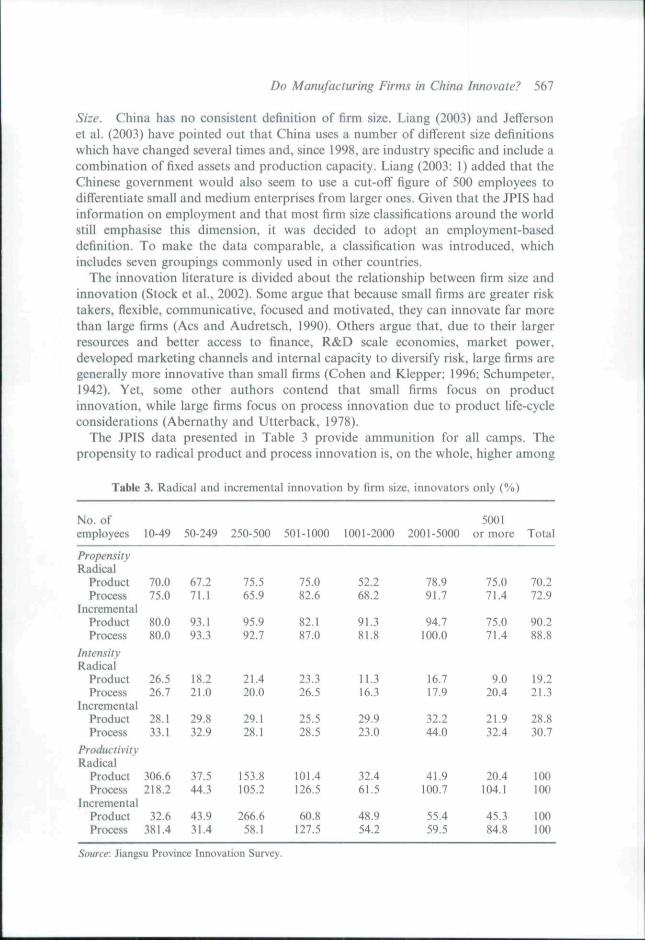
The JPIS data presented in Table 3 provide ammunition for all camps. Thepropensity to radical product and process innovation is. on the whole, higher among
Table 3. Radical and incremental Innovation by firm size, innovators only (%)
No. ofemployees
PropensityRadical
ProductProcess
Incrementa!ProductProcess
IntensityRadical
ProductProcess
1 ncrementalProductProcess
ProduclivityRadical
ProductProcess
IncrementalProductProcess
10-49
70.075.0
80.080.0
26.526.7
28.133.1
306.6218.2
32.6381.4
50-249
67.271.1
93.193.3
18.221.0
29.832.9
37.544.3
43.931.4
250-500
75.565.9
95.992.7
21.420.0
29.128.1
153.8105.2
266.658.1
501-1000
75.082.6
82.187.0
23.326.5
25.528.5
101.4126.5
60.8127.5
1001-2000
52.268.2
91.381.8
11.316.3
29.923.0
32.461.5
48.954.2
2001-5000
78.991.7
94.7100.0
16.717.9
32.244.0
41.9100.7
55.459.5
5001or more
75.071.4
75.071.4
9.020.4
21.932.4
20.4104.1
45.384.8
Total
70.272.9
90.288.8
19.221.3
28.830.7
100100
100100
Source: Jiangsu Province Innovation Survey.
568 L. Aicorta et al.
large firms, particularly among those employing 2001 -5000 employees. Thepropensity to incremental innovation is distributed more evenly across size, withfirms in the 250-500 employees group accounting for the highest product propensityand firms in the 2001-5000 employees class accounting for the highest processpropensity. In terms of intensity the evidence is also mixed. Radical product andprocess innovation is more intense among small and medium firms, but incrementalproduct and process innovation is marginally more intense among large firms.Productivity indicators are, however, slightly more clear cut. Small and mediumfirms' workers are more productive in all types of innovation, except for incrementalproduct innovation, where firms in the 250-500 employees segment exhibit higherproductivity levels. Altogether, the data also provide some support to product life-cycle views as small and medium firms are relatively stronger at product innovation,while large firms tend to emphasise more process innovation.
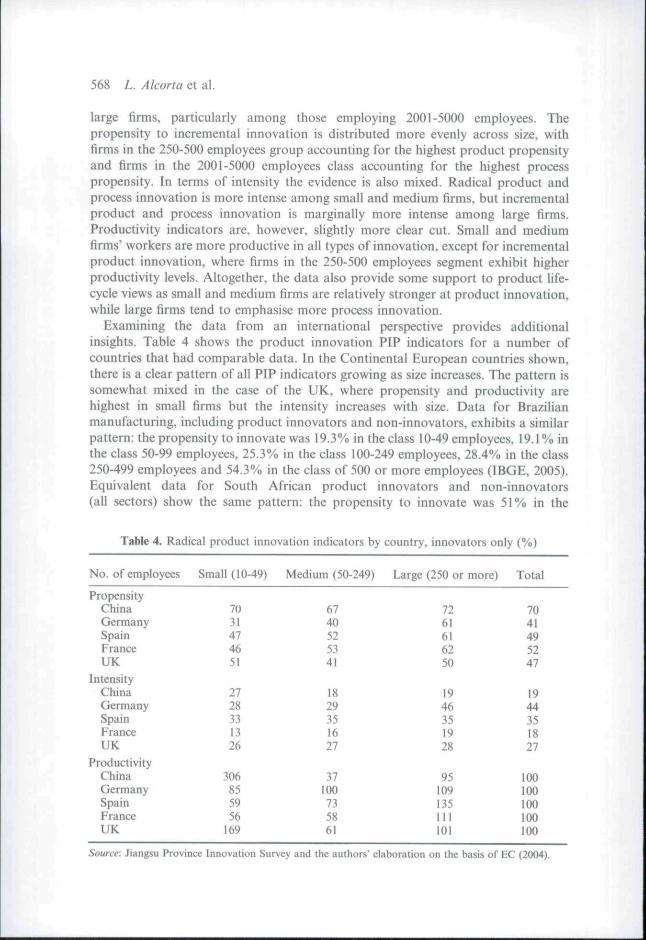
Examining the data from an international perspective provides additionalinsights. Table 4 shows the product innovation PIP indicators for a number ofcountries that had comparable data. In the Continental European countries shown,there is a clear pattern of all PIP indicators growing as size increases. The pattern issomewhat mixed in the case of the UK, where propensity and productivity arehighest in small firms but the intensity increases with size. Data for Brazilianmanufacturing, including product innovators and non-innovators, exhibits a similarpattern: the propensity to innovate was 19.3% in the class 10-49 employees, 19.1% inthe class 50-99 employees, 25.3% in the class 100-249 employees. 28.4% in the class250-499 employees and 54.3% in the class of 500 or more employees (IBGE, 2005).Equivalent data for South African product innovators and non-innovators{all sectors) show the same pattern: the propensity to innovate was 51% in the
Table 4. Radical product innovation indicators by country, innovators only (%)
No. of employees
PropensityChitiaGermanySpainFranceUK
IntensityChinaGermanySpainFranceUK
ProductivityChinaGermanySpainFranceUK
Small (10-49)
7031474651
2728331326
3068S5956
169
Medium (50-249)
6740525341
1829351627
37100735861
Large (250 or more)
7261616250
1946351928
95109135in101
Total
7041495247
1944351827
100100100100100
Source: Jiangsu Province Innovation Survey and the authors' elaboration on the basis of EC (2004).
Do Manufacturing Firms in China Innovate? 569
class 10-49 employees, 72% in the classes 200-249 and 250-499 employees and 75%in the class of 500 and more employees (Oerlemans et al., 2003). Chinese PIPindicators distribution by size is, however, U-shaped and, while propensity is onlymarginally higher among larger firms, intensity and productivity are far largeramong smaller firms.
To sum up, the PIP indicators on size exhibit slightly different trends and furthertests may be required, hence extreme caution is necessary in interpreting them. Yet,three factors suggest the possibility of an emerging new feature in corporateinnovative behaviour in China: smaller firms account for the highest proportion ofinnovative sales and workers in smaller firms have a significantly higher innovativeperformance than in larger firms; this seems to be contrary to international patterns;and smaller firms are particularly strong at product innovation.
Ownership. Turning to ownership, it is worth noting that in Chinese officialstatistics ownership refers essentially to the type of registration undertaken by acompany. This involves both proper control as well as legal and financingclassifications. As in the case of size, definitions have changed repeatedly over theyears (Jefferson et al., 2003; Wen et al., 2002). China's and Jiangsu Province 2003statistical yearbooks (JSB, 2003; NBS, 2003) provide a nine major entry classificationof ownership. For the purposes of this research, the Chinese classification was usedas a starting point and converted into a four-way categorisation.
• State-owned, including state-owned, collective-owned, shareholding co-operatives and joint-operated (state and/or collective) firms from the Chineseofficial classification.
• Limited liability - companies with fewer than 49 investors, with each investorliable in proportion to their investments and the company liable to a maximum ofits total assets. This includes limited responsibility companies as well as someprivate and minority-owned foreign companies from the Chinese officialclassification.
• Shareholding - no limit in the number of investors and shares are emitted inproportion to the investment. Liability is restricted to stockholding. Share-holding - same investors rights as limited liability but stocks are issued and thereis no cap on the number of shareholders. This includes shareholding firms as wellas some private and minority-owned foreign companies from the Chinese officialclassification.
• Foreign and non-mainland Chinese - companies in which Hong Kong, Macao,Taiwan and foreign nationals account for at least 50% of the total capital. Thisownership category also includes Hong Kong, Macao, Taiwan and foreign-funded enterprises from the Chinese classification.^
Looking into corporate behaviour by ownership type, the privatisation literaturegenerally claims that state-owned firms are bureaucratic, conservative in theirattitude towards risk, inefficient, face soft-budget constraints and are sometimescorrupt - all of which, by implication, is not conducive to innovation (Kikeri andNellis. 2004; Megginson and Netter, 2001). By contrast, private firms are deemed tobe competitive, dynamic, risk-takers, face hard-budget constraints and are generally

570 L. Alcorta et al.
more effective and efficient and, as a resuit, more profitable and innovative.Multinational corporations and foreign investors, because of their unique intangibleassets, are expected to be extremely innovative in their home countries, although theextent to which they innovate in host countries is subject to greater controversy(Caves, 1996; Dunning, 2001; Kozul-Wright and Rowthorn, 1998; Rasiah, 2007).
The JPIS would seem to confirm some of the expectations in the literature (Table 5).The propensity to innovate radically and incrementally is highest among shareholdingfirms, although state-owned enterprises (SOEs) also have innovative activities,particularly in terms of incremental innovation. In terms of intensity, however, SOEsare far behind other types of firms, although in process and incremental innovation thegap is narrower - something that seems to be related to the prevalence of oldoutmoded technology that requires significant production line/process modificationand updating. Indeed, Sun (2003: 138) pointed out that many SOEs restructured theirproductive processes in order to become more competitive, responding to pressuresfrom their sector ministries. At the other end of the innovation intensity spectrum areshareholding and foreign firms. Shareholding firms, particularly in product innova-tion, seem to be more innovative than limited responsibility companies, suggesting thatthe need to diversify their product portfolio is linked to financial discipline attached tothis type of ownership. In terms of productivity, foreign enterprises are far ahead ofother types of ownership, nearly ten times higher in some cases, with workers beingmost productive at product innovation. Foreign firms tend to be staffed moreefficiently and, hence, the large disparities in terms of sales per worker.
Table 5. Radical and incremental innovation by ownership, innovators only (%)
Ownershiptype
PropensityRadical
ProductProcess
IncrementalProductProcess
IntensityRadical
ProductProcess
IncrementalProductProcess
ProductivityRadicalProductProcess
IncrementalProductProcess
State
68.468.1
94.791.5
12.116.3
22.727.1
52.450.3
49.467.7
Limitedliability
69.571.2
87.887.9
19.621.1
28.931.9
39.256.2
29.257.1
Shareholding
73.780.4
96.597.8
22.821.7
32.632.1
82.286.1
67.4111.5
Foreign andnon-mainland Chinese
68.367.6
90.283.8
24.026.3
37.933.!
351.3291,0
423.3245.7
Total
70.071.9
92.090.3
19.321.1
29.931.0
100100
100100
Source: Jiangsu Province Innovation Survey.
Do Manufacturing Firms in China Innovate? 571
Given the controversy surrounding the role of foreign firms in innovation in hostcountries, we examined other surveys with comparable data. The Argentineansurvey, focusing on innovators only, found that the product and process innovationpropensity among firms with foreign ownership was 59% and 66%. while theequivalent figures for firms without foreign capital was 42% and 41% (INDEC,2003). The Australian survey, showing data for innovators and non-innovators in allindustries, found a propensity to innovate of 33.7% among purely Australian and of59.2% for companies with more than 50%) foreign ownership (ABS, 2006). Twopoints should be considered with regard to this. First, limited as this evidence is, itdoes lend some further credibility to the Chinese findings. Secondly, the possibility offoreign firms being a significant direct contributor to local innovative capacities inhost countries, is one not very much considered in the literature and certainly worthexploring.
Industry. Industries generally refer to aggregations of units of production sellingsimilar goods. They differ in a number of characteristics - concentration levels,extent of barriers to entry., degree of product differentiation and advertising, levels ofinvestment in machinery and equipment and R&D, nature of the productionprocess, relationship between inputs and output and the amount of knowledgerequirements -to mention just a few. This research used the Chinese and JiangsuProvince manufacturing industry statistics based on a 29 two-digit entry classifica-tion. To make the data tractable and internationally comparable, the studyaggregated the Chinese classification into 11 sectors equivalent to the EU'sclassification of economic activities.
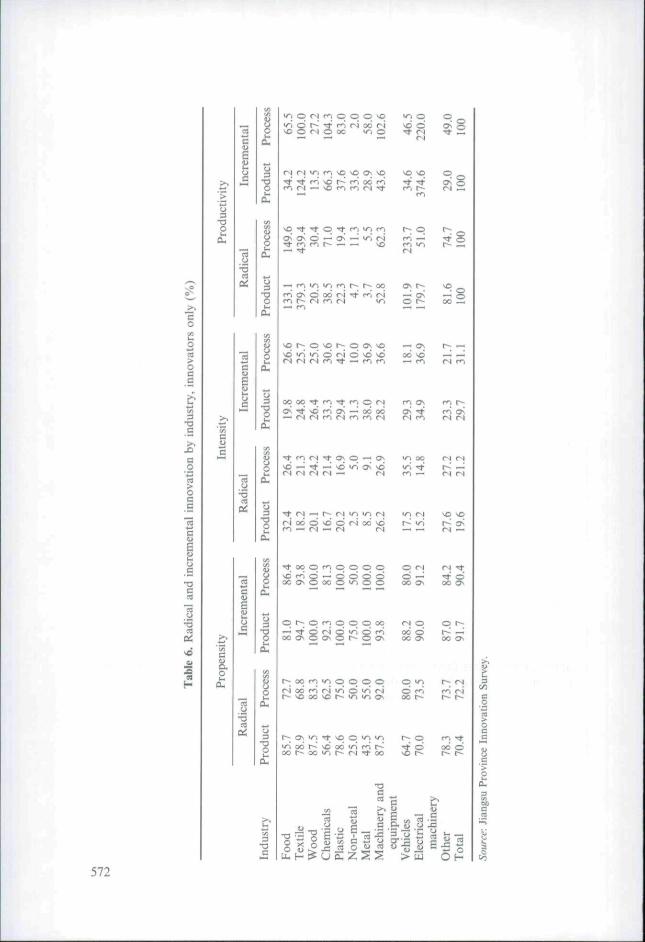
The propensity to innovate radically was higher among machinery and equipment,wood and food producers (Table 6). In terms of incremental innovation, the wood,plastic and metal industries had propensities suggesting all firms in these industrieshad some innovative activity, something that was also the case for incrementalprocess innovation in the machinery and equipment industry. Radical innovationintensity was higher in the food and machinery and equipment industries, althoughradical process innovation was highest in the vehicle industry. Incrementalinnovation intensity was higher in the chemicals, metal and electrical machinery,but incremental process innovation is also rather high in the plastics and machineryand equipment industries. Radical innovation productivity is by far the highest in thetextile industry, while incremental innovation productivity is highest in the electricalmachinery industry. Jiangsu Province's textile industry has witnessed over recentyears the entry of foreign modern capital-intensive fabric firms aimed both atexporting and catering for an increasingly diverse local market.
The growing domestic demand for new and more functional householdappliances, such as fridges and washing machines, partially explains the extent ofproduct radical and incremental innovation in the electrical and non-electricalmachinery and equipment industries. Jiangsu Province is also rapidly becoming aleading producer and exporter of computer-controlled machine tools and hand-heldpower tools (JSB. 2003; NBS, 2003). Innovation in the food industry seems related tothe growing mass production of traditional Chinese food products and the imitationand/or adaptation of foreign sweets, biscuits and related products. Process radicaland incremental innovation in the electrical equipment industry is related to
-o
•o
c
i3O
O
•o
Oí
•o
Oí
o
t-; p
(N
—' fi lo lO r^r<S oi O 00 fNm r (N f fN— r^
— fl — fN
p fn O O O pÖ — O Ö Ö Ö
oo Ö
^ <Nf^ fN
o
T 3 •-
O (D
572
Do Manufacturing Firms in China Innovate? 573
companies striving for higher efficiency due to competition from a growing number ofChinese and foreign household goods-producing companies. In the plastic industry,processes seem to be changing due to the need to achieve higher-scale economies inthe production of tyres and construction plastics (JSB. 2003; NBS, 2003).
In order to assess the relative importance of innovation in different industries itmust be stressed that Chinese industry's propensity to innovate seems to be similarlyranked to that in other countries. The propensity to innovate products in Canadianindustry was over 90% in all sub-sectors of the electrical machinery, chemical,plastics and machinery industries (Statistics Canada. 2002). Leading productinnovative industries in Brazil were textiles, chemicals, machinery and equipmentand electrical equipment while, in South Africa, electrical equipment and transportequipment seem to be the most innovative (IBGE, 2005; Oerlemans et al., 2003).Leading process innovative industries in Brazil were food, textiles, wood and vehicleswhile, in South Africa, electrical equipment and transport equipment also seem tohave the highest propensities (IBGE. 2005; Oerlemans et al,, 2003). These similaritiesin rankings suggest industry, rather than national factors alone, explain thepropensity to innovate.
The Market m— Magnitude of Innovation : Degree of Novelty
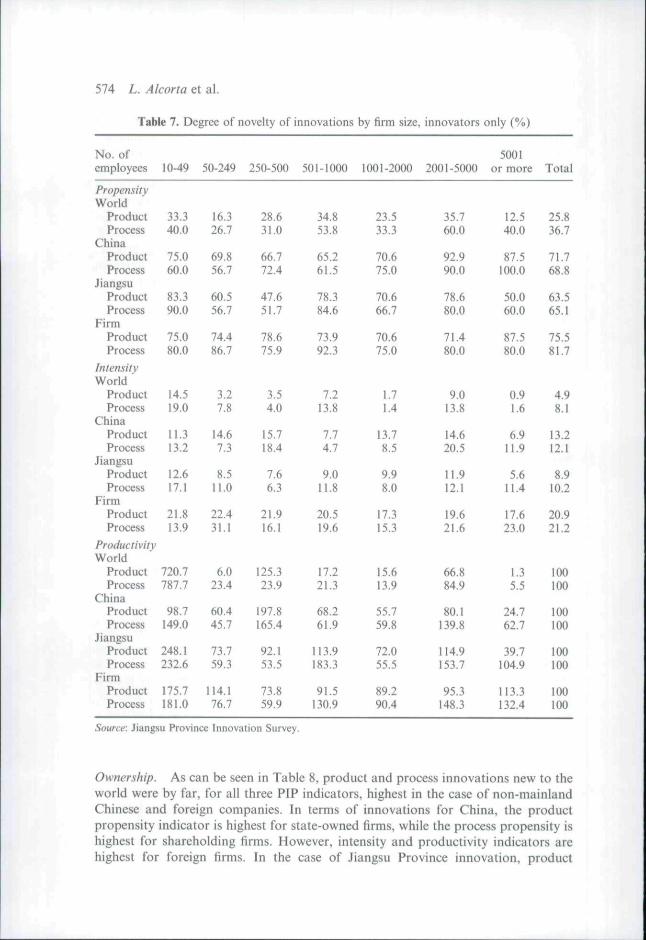
Thus far the focus has been the technical dimension of innovation. In this section wewill turn our attention to the degree of novelty of innovation. To examine whoinnovates what, the PIP indicators will be discussed in the context of our four firmcharacteristics; innovations new to the world, new to China, new to the JiangsuProvince market and new to the firm. As in the previous section, the focus will be oninnovators only.
Size. In terms of innovations new to the world, the product and process propensitywas highest among large firms in the 501-1000 and 2001-5000 employees bracketsbut, once intensity and productivity indicators are taken into account, it is smallerfirms, in the 10-49 workers group, that come out on top, both in new products andprocesses (Table 7). Indeed, workers in this size group produce at least seven timesmore innovation than the average for all size groups. Innovations new to Chinaexhibit a less clear-cut pattern. While the product and process propensity are highestamong larger firms (2001-5000 and 5000 or more workers), the product intensity ishighest among the 250-500 employees class and the process intensity is highestamong the 2001-5000 workers group. Product and process productivity is, however,highest among the 250-500 employees class. As far as innovations new to JiangsuProvince are concerned, all three product and process PIP indicators were highestamong small firms. In terms of "catching up" innovation, the product and processpropensity is higher among large firms (5001 or more and 501-1000 workers groups),the product and process intensity is higher among medium-sized firms (50-249employees) and the product and process productivity is highest among small firms.Altogether, it seems that smaller firms engage in much more novel product andprocess innovative activities and are very efficient at innovating, medium firmsengage in less novel activities, while large firms get involved in relatively more novelprocess activities - at least when compared with medium enterprises.
574 L. Alcorta et al.
Table 7. Degree of novelty of innovations by firm size, innovators only (%)
No. ofemployees
Propen.sityWorld
ProductProcess
ChinaProdtictProcess
JiangsuProductProcess
FirmProductProcess
IntensityWorld
ProductProcess
ChinaProductProcess
JiangsuProductProcess
FirmProductProcess
ProductivityWorld
ProductProcess
ChinaProductProcess
JiangsuProductProcess
FirmProductProcess
10-49
33.340.0
75.060.0
83.390.0
75.080.0
14.519.0
11.313.2
12.617.1
21.813.9
720.7787.7
98.7149.0
248.1232.6
175.7181.0
50-249
16.326.7
69.856,7
60.556.7
74.486.7
3.27.8
14.67.3
8.511.0
22.431.1
6.023.4
60.445.7
ll.l59.3
114.11(^.1
250-500
28.631.0
66.772.4
47.651.7
78.675.9
3.54.0
15.718.4
7.66.3
21.9!6.1
125.323.9
197.8165.4
92.153.5
73.859.9
501-1000
34.853.8
65.261.5
78.384.6
73.992.3
7.213.8
1.14.7
9.011.8
20.519.6
17.221.3
68.261.9
113.9183.3
91.5130.9
1001-2000
23.533.3
70.675.0
70.666.7
70.675.0
1.71.4
13.78.5
9.98.0
17.315.3
15.613.9
55.759.8
72.055,5
89.290.4
2001-5000
35.760.0
92.990.0
78.680.0
71.480.0
9.013.8
14.620.5
11.912.1
19.621.6
66.884.9
80.1139.8
114.9153.7
95.3148.3
5001or more
12.540.0
87.5100.0
50.060.0
87.580.0
0.91.6
6.911.9
5.611.4
17.623.0
1.35.5
24.762.7
39.7104.9
II 3.3132.4
Total
25.836.7
71.768.8
63.565.1
75.581.7
4.98.1
13.212.1
8.910.2
20.921.2
100100
!00100
100100
100100
Source: Jiangsu Province Innovation Survey.
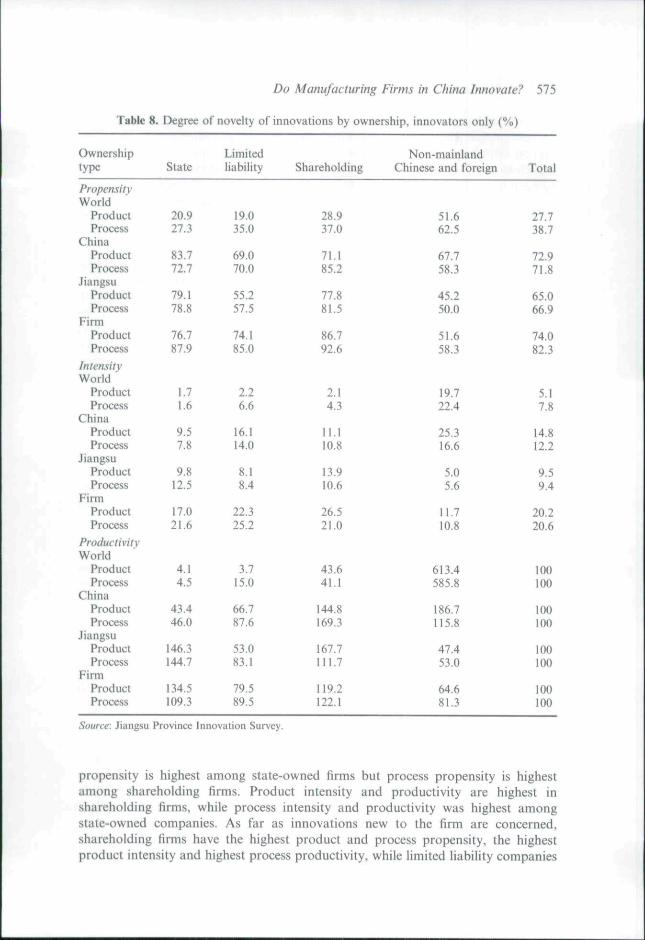
Ownership. As can be seen in Table 8, product and process innovations new to theworld were by far, for all three PIP indicators, highest in the case of non-mainlandChinese and foreign companies. In terms of innovations for China, the productpropensity indicator is highest for state-owned firms, while the process propensity ishighest for shareholding firms. However, intensity and productivity indicators arehighest for foreign firms. In the case of Jiangsu Province innovation, product
Do Matîufacturing Firms in China Innovate? 575
Table 8. Degree of novelty of innovations by ownership, innovators only (%)
Ownershiptype
PropensityWorld
ProductProcess
ChinaProductProcess
JiangsuProductProcess
FirmProductProcess
IntensityWorld
ProductProcess
ChinaProductProcess
JiangsuProductProcess
FirmProductProcess
ProductivityWorld
ProductProcess
ChinaProductProcess
JiangsuProductProcess
FirmProductProcess
State
20.927.3
83.772.7
79.178.8
76.787.9
1.71.6
9.57.8
9.812.5
17.021.6
4.14.5
43.446.0
146.3144.7
134.5109.3
Limitedliability
19.035.0
69.070.0
55.257.5
74.185.0
2.26.6
16.114.0
8.18.4
22.325.2
3.715.0
66.787.6
53.083.1
79.589.5
Shareholding
28.937.0
71.185.2
77.881.5
86.792.6
2.14.3
11.110.8
13.910.6
26.521.0
43.641.1
144.8169.3
167.7111.7
119.2122.1
Non-mainlandChinese and foreign
51.662.5
67.758.3
45.250.0
51.658.3
19.722.4
25.316.6
5.05.6
11.710.8
613.4585.8
186.7115.8
47.453.0
64.681.3
Total
27.738.7
72.971.8
65.066.9
74.082.3
5.17.8
14.812.2
9.59.4
20.220.6
100100
100100
100100
100100
Source: Jiangsu Province Innovation Survey.
propensity is highest among state-owned firms but process propensity is highestamong shareholding firms. Product intensity and productivity are highest inshareholding firms, while process intensity and productivity was highest amongstate-owned companies. As far as innovations new to the firm are concerned,shareholding firms have the highest product and process propensity, the highestproduct intensity and highest process productivity, while limited liability companies
576 L. Alcorta et al.
have the highest product innovation intensity and state-owned firms the highestprocess productivity. Clearly, non-mainland Chinese and foreign firms achieve thehighest degree of novelty and the data suggest that these firms use China as theirlaunching pad for some of their new products aimed at world markets. They are alsocompeting locally and internationally by improving process efficiency and reducingcosts, thus the high productivity indexes. The extent of novelty is somewhat in themiddle for shareholding firms and. surprisingly, for state-owned firms, which aredoing relatively well in process innovation.
Industry. The propensity to innovate products new to the world was higher in thetextile, wood and metal industries, while the propensity to innovate processes new tothe world is higher in the textile, wood, metal and machinery industries (Table 9).Intensity and productivity indicators are, nevertheless, by far the highest in thetextile industry. Turning to innovation new to China, the propensity to innovate washigher in the metal, machinery, electric machinery and vehicle industries, while theprocess propensity was higher in the plastic, metal, machinery and vehicle industries.The intensity was higher in the chemical, plastic, machinery and vehicle industries,but the productivity was highest in the textile and vehicle industries. In terms ofinnovations new to Jiangsu Province, the product and process propensity was higherin the food, textile (except process), chemical and machinery (except product)industries; the product and process intensity was higher in the food and chemicalindustries; and the productivity was higher in the food, textile and chemical indus-tries. As far as catching up innovations are concerned, product and processpropensity indicators are higher in the food, wood, plastic and electric machinery(except product) industries. Product intensity was higher in food, wood and plastics,while process intensity was higher in wood, plastics and electrical machinery.
Product productivity was higher in food textiles and chemicals, while processproductivity was higher in the food, non-electrical and electrical machineryindustries. Altogether, it is in textiles where the most novel products and processesseem to be emerging and, indeed, innovation in the textile industry seems to cutacross all degrees of novelty. Industries where the degree of novelty is somewhat inthe middle include the food, wood, chemicals and machinery industries.
Why Do Firms Innovate?
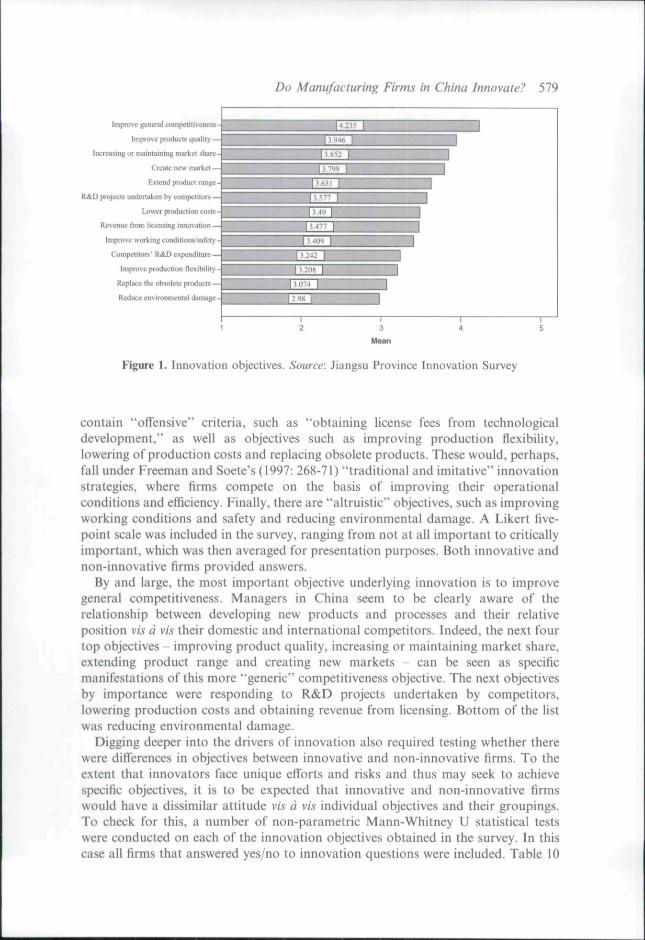
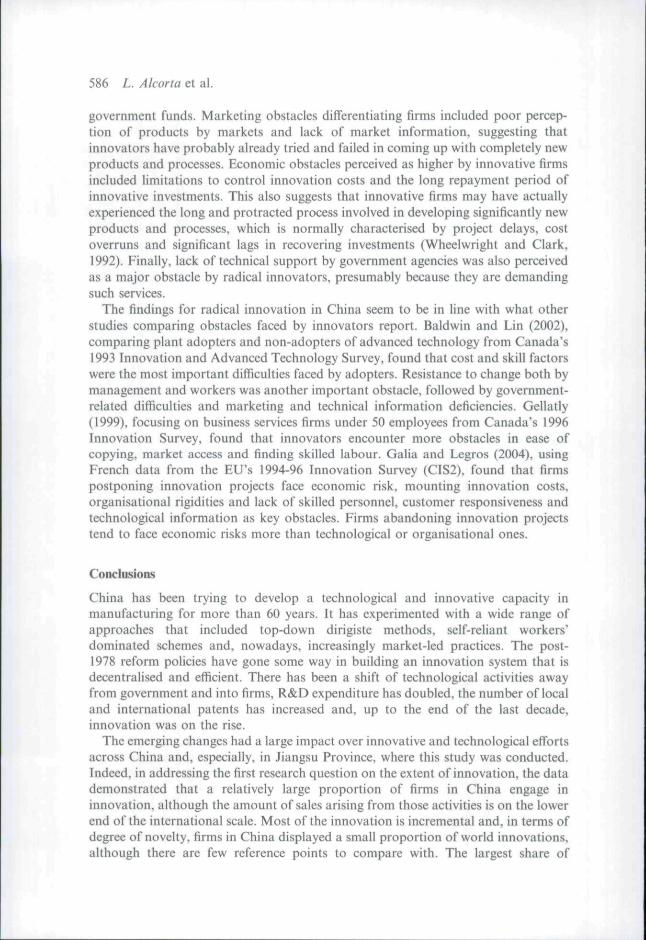
In order to probe into why firms innovate, the JPIS identified a number of possiblereasons for undertaking innovation, on the basis of reviewing some key empiricalcontributions in the innovation literature (Baldwin, 1996; Baldwin and Lin, 2002;Gellatly. 1999; Rosa, 2002). Thirteen key motives were identified, as shownon Figure 1. They include some "generic" marketing, technological and economicobjectives underlying innovation, such as improving general competitiveness andproduct quality, creating or expanding market share and extending product range.They comprise "R&D projects undertaken by competitors" and "competitors R&Dexpenditure," which are in line with what Freeman and Soete (1997: 272-3) dubbed"defensive" innovation strategies, where firms undertake R&D. However, unlike"offensive" counterparts, they do not seek to actively generate competitiveadvantages from technology but only protect themselves from competition. They

3-O
3•O
c
Ûoí
Cu,
r^<O ÍNOfJ (NOO l^r^, ' ^ ° ^ ^ P P * ^ ^ '^.ov-ij- —m r-r- fNOs osr~- — d •—-oo f^i/*iosoo or~- r^sc OOSD fN^ o- >DV~I ^O ——• — rs —
O 00
fN —
00 rnr^ soO fm so
r*-¡ 00
(N fN
— — 00
sq p00 d
00 —^ 00
P Pd d
p pO d
p oorr so
fN — —
oo od d P °°.
OS r n
a\ sof ^ CN
p pÖ d
fN r-;rN 00
p pd do o
p fNOs so
Tt 'S;(N —
p pd d
P Pd d
W^ OS
3 ñ
ill«O o_T3 u— o o ^ o ogcuo. oa.a.
o oau ¿Ü cuo-oO-a.
577

o o22
o
u
oo pd Ö
ouc
a.o
U
o
U
00 ^ i/^
00 »N
o
578
Do Manufacturing Firms in China Innovate? 579
[mprovc general competí livcocs s -
Improve pruducis t|Lialiiy —
Increasing or maintaining market share -
Create new niarkel —
Extend p
R&D projects underlaken by compctilors —
Lower productJiKi costs -
Revenue trom lieensing innovation —
Improve working conjitions/safety ~
Competitors' R&D expenditurt —
Improve produc-tion flesibilily -
Replace Ihe obsolete producís —
Reduce environm
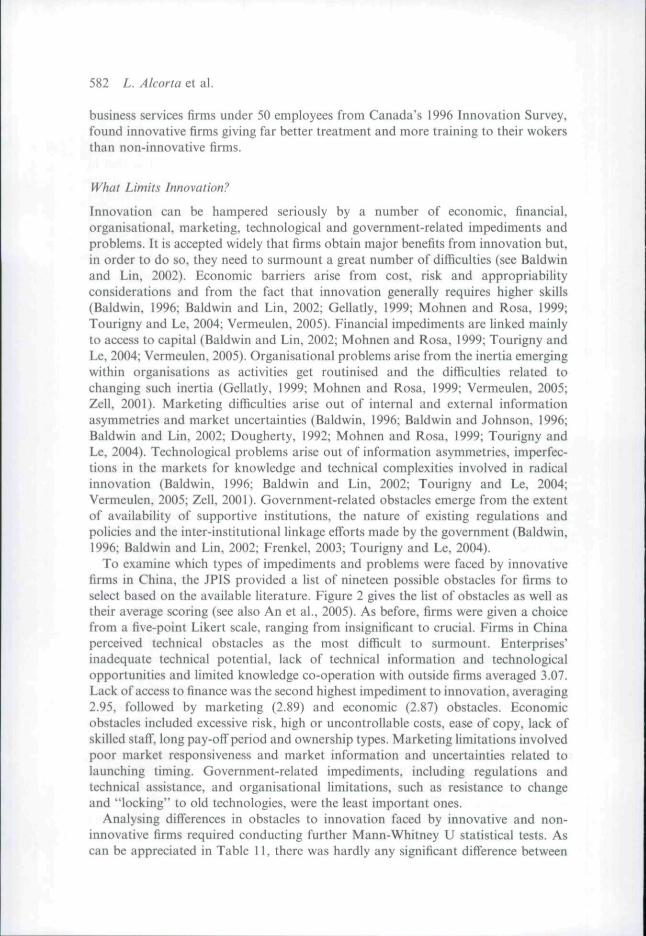
Figure I. Innovation objectives. Source: Jiangsu Province Innovation Survey
contain "offensive" criteria, such as "ohtaining hcense fees from technologicaldevelopment," as well as objectives such as improving production flexibility,lowering of production costs and replacing obsolete products. These would, perhaps,fall under Freeman and Soete's {1997: 268-71) "traditional and imitative" innovationstrategies, where firms compete on the basis of improving their operationalconditions and efficiency. Finally, there are "altruistic" objectives, such as improvingworking conditions and safety and reducing environmental damage. A Likert five-point scale was included in the survey, ranging from not at all important to criticallyimportant, which was then averaged for presentation purposes. Both innovative andnon-innovative firms provided answers.
By and large, the most important objective underlying innovation is to improvegeneral competitiveness. Managers in China seem to be clearly aware of therelationship between developing new products and processes and their relativeposition vis à vis their domestic and international competitors. Indeed, the next fourtop objectives - improving product quality, increasing or maintaining market share,extending product range and creating new markets - can be seen as specificmanifestations of this more "generic" competitiveness objective. The next objectivesby importance were responding to R&D projects undertaken by competitors,lowering production costs and obtaining revenue from licensing. Bottom of the listwas reducing environmental damage.
Digging deeper into the drivers of innovation also required testing whether therewere differences in objectives between innovative and non-innovative firms. To theextent that innovators face unique efforts and risks and thus may seek to achievespecific objectives, it is to be expected that innovative and non-innovative firmswould have a dissimilar attitude vis à vis individual objectives and their groupings.To check for this, a number of non-parametric Mann-Whitney U statistical testswere conducted on each of the innovation objectives obtained in the survey. In thiscase all firms that answered yes/no to innovation questions were included. Table 10
5 2
T3C
É- -"SC Dû r¡Z3
f i . <O
C M
O
C
o
.t: 13
o
ooo 8
o o — r-1 CO
3688
or\(7s
CO
O
5147
oo [^
Os
3842
<i
OsOO
rjO
2089
>oor-
'/nm00
4465
o(
•oOs
oo —
ON r— o ^ "O 3
S 5 PÖ
oQC^^i^»—I
Öo(N
p(N
• ^
O(NfN^\
Vl
oCN
OO
ON• — -
p
—•
oÖo(N
fNfN
(NfN
(N
(N 00 fN 00 Osc ro f* f^ (N
—' oo fN oo o r--fN oo fN 00 fN t ^
(N fN »N
o > o > o >es es esc n c cQ c nc o c o ¿ o0 5 0 = 0 5
z^z^z=
<^ f t"^ r ^ 00 s^ ^^ ^Qr - i t ^ — 1/1--IO — NO
(N rN (N (N
s s
o > oc rt c
o >c CO
c o c o c oo c o c o ^
o >c m
z = z £
o >c '3
o > o ;c -s a •:c ra c ;
y oj £ " 39- > us •?« c
I £ § g -3
o
"O Oí) C.5 E-
o -oH £
CL
C O C O C O C O E Oo c o C o C o i ^ o c :^ c ^ ^ Z ^ Z ' ^ Z ^
s ii c
u
5J .—
^\ O ^^ ^ L- r^ r^ ^ U rt
ûiS o
5 u ^ û i ES;
580
Do Manufacturing Firms in China Innovate? 581
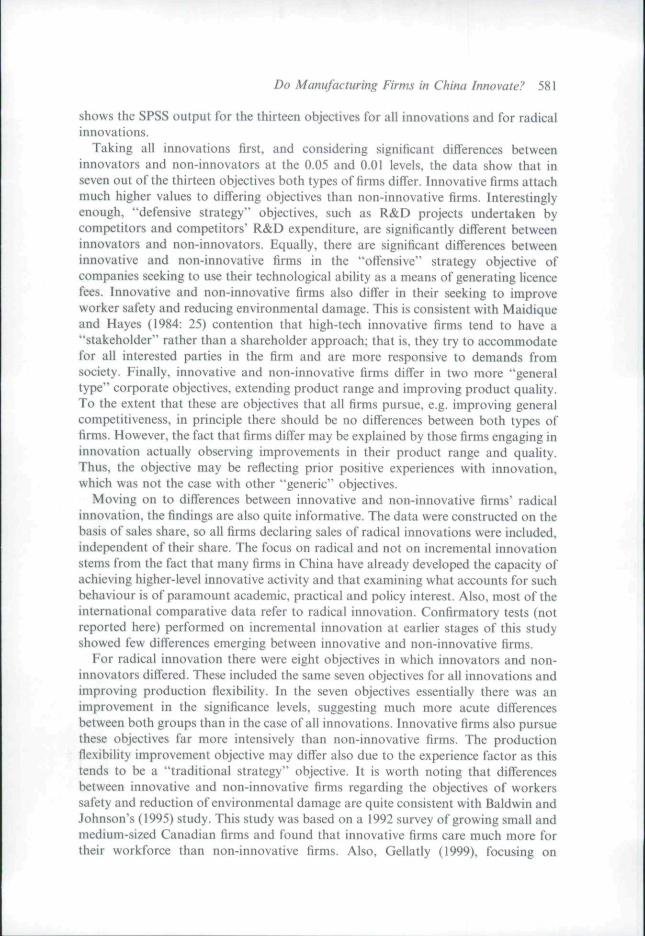
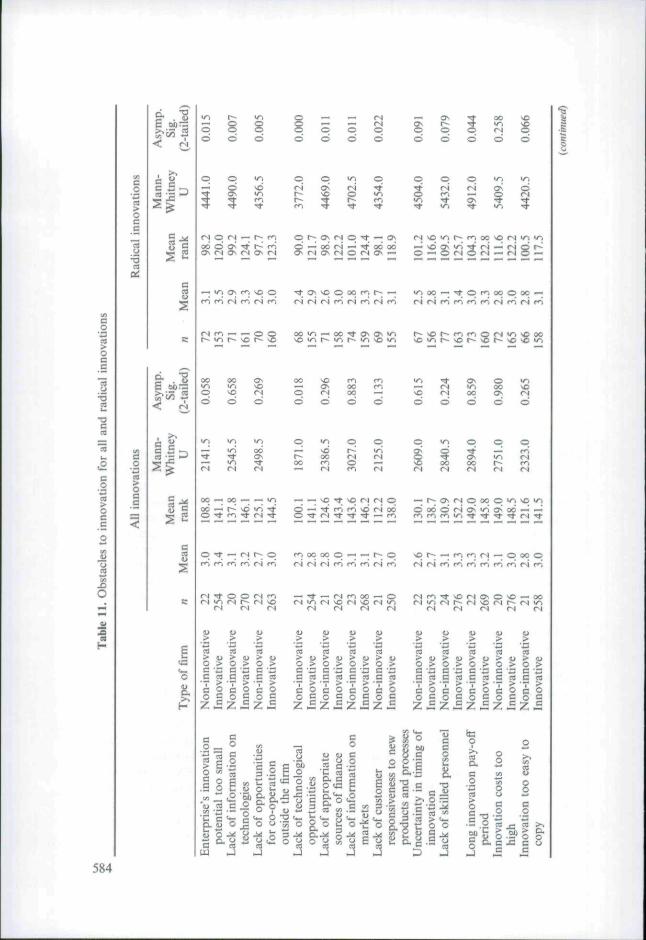
shows the SPSS output for the thirteen objectives for all innovations and for radicalinnovations.
Taking all innovations first, and considering significant differences betweeninnovators and non-innovators at the 0.05 and 0.01 levels, the data show that inseven out of the thirteen objectives both types of firms differ. Innovative firms attachmuch higher values to differing objectives than non-innovative firms. Interestinglyenough, "defensive strategy" objectives, such as R&D projects undertaken bycompetitors and competitors" R&D expenditure, are significantly different betweeninnovators and non-innovators. Equally, there are significant differences betweeninnovative and non-innovative firms in the "offensive" strategy objective ofcompanies seeking to use their technological ability as a means of generating licencefees. Innovative and non-innovative firms also differ in their seeking to improveworker safety and reducing environmental damage. This is consistent with Maidiqueand Hayes (1984: 25) contention that high-tech innovative firms tend to have a"stakeholder" rather than a shareholder approach; that is, they try to accommodatefor all interested parties in the firm and are more responsive to demands fromsociety. Finally, innovative and non-innovative firms differ in two more "generaltype" corporate objectives, extending product range and improving product quality.To the extent that these are objectives that all firms pursue, e.g. improving generalcompetitiveness, in principle there should be no differences between both types offirms. However, the fact that firms differ may be explained by those firms engaging ininnovation actually observing improvements in their product range and quality.Thus, the objective may be reflecting prior positive experiences with innovation,which was not the case with other "generic" objectives.
Moving on to differences between innovative and non-innovative firms' radicalinnovation, the findings are also quite informative. The data were constructed on thebasis of sales share, so all firms declaring sales of radical innovations were included,independent of their share. The focus on radical and not on incremental innovationstems from the fact that many firms in China have already developed the capacity ofachieving higher-level innovative activity and that examining what accounts for suchbehaviour is of paramount academic, practical and policy interest. Also, most of theinternational comparative data refer to radical innovation. Confirmatory tests (notreported here) performed on incremental innovation at earlier stages of this studyshowed few differences emerging between innovative and non-innovative firms.
For radical innovation there were eight objectives in which innovators and non-innovators differed. These included the same seven objectives for all innovations andimproving production flexibility. In the seven objectives essentially there was animprovement in the significance levels, suggesting much more acute differencesbetween both groups than in the case of all innovations. Innovative firms also pursuethese objectives far more intensively than non-innovative firms. The productionflexibility improvement objective may differ also due to the experience factor as thistends to be a "traditional strategy" objective. It is worth noting that differencesbetween innovative and non-innovative firms regarding the objectives of workerssafety and reduction of environmental damage are quite consistent with Baldwin andJohnson's (1995) study. This study was based on a 1992 survey of growing small andmedium-sized Canadian firms and found that innovative firms care much more fortheir workforce than non-innovative firms. Also, Gellatly (1999), focusing on
582 L. Alcorta et al.
business services firms under 50 employees from Canada's 1996 Innovation Survey,found innovative firms giving far better treatment and more training to their wokersthan non-innovative firms.
What Limits Innovation?
Innovation can be hampered seriously by a number of economic, financial,organisational, marketing, technological and government-related impediments andproblems. It is accepted widely that firms obtain major benefits from innovation but.in order to do so, they need to surmount a great number of difficulties (see Baldwinand Lin., 2002). Economic barriers arise from cost, risk and appropriabilityconsiderations and from the fact that innovation generally requires higher skills(Baldwin, 1996; Baldwin and Lin, 2002; Gellatly, 1999; Mohnen and Rosa, 1999;Tourigny and Le, 2004; Vermeulen, 2005). Financial impediments are linked mainlyto access to capital (Baldwin and Lin, 2002; Mohnen and Rosa, 1999; Tourigny andLe, 2004; Vermeulen, 2005). Organisational problems arise from the inertia emergingwithin organisations as activities get routinised and the difficulties related tochanging such inertia (Gellatly, 1999; Mohnen and Rosa, 1999; Vermeulen. 2005;Zeil, 2001). Marketing difficulties arise out of internal and external informationasymmetries and market uncertainties (Baldwin, 1996; Baldwin and Johnson, 1996;Baldwin and Lin, 2002; Dougherty, 1992; Mohnen and Rosa, 1999; Tourigny andLe, 2004). Technological problems arise out of information asymmetries, imperfec-tions in the markets for knowledge and technical complexities involved in radicalinnovation (Baldwin. 1996; Baldwin and Lin, 2002; Tourigny and Le, 2004;Vermeulen, 2005; Zeil, 2001). Government-related obstacles emerge from the extentof availability of supportive Institutions, the nature of existing regulations andpolicies and the inter-institutional linkage efforts made by the government (Baldwin,1996; Baldwin and Lin, 2002; Frenkel, 2003; Tourigny and Le, 2004).
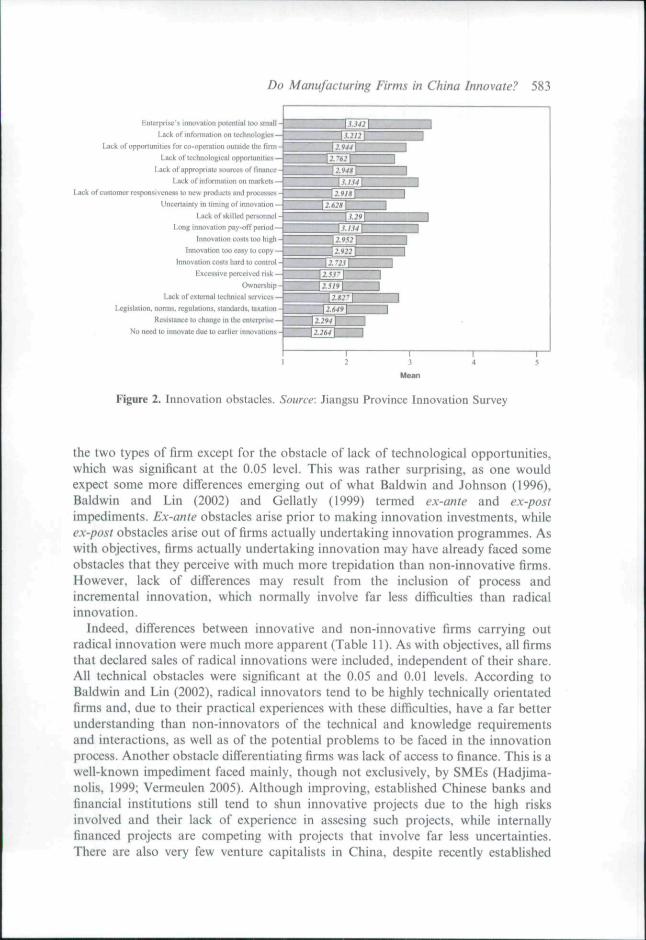
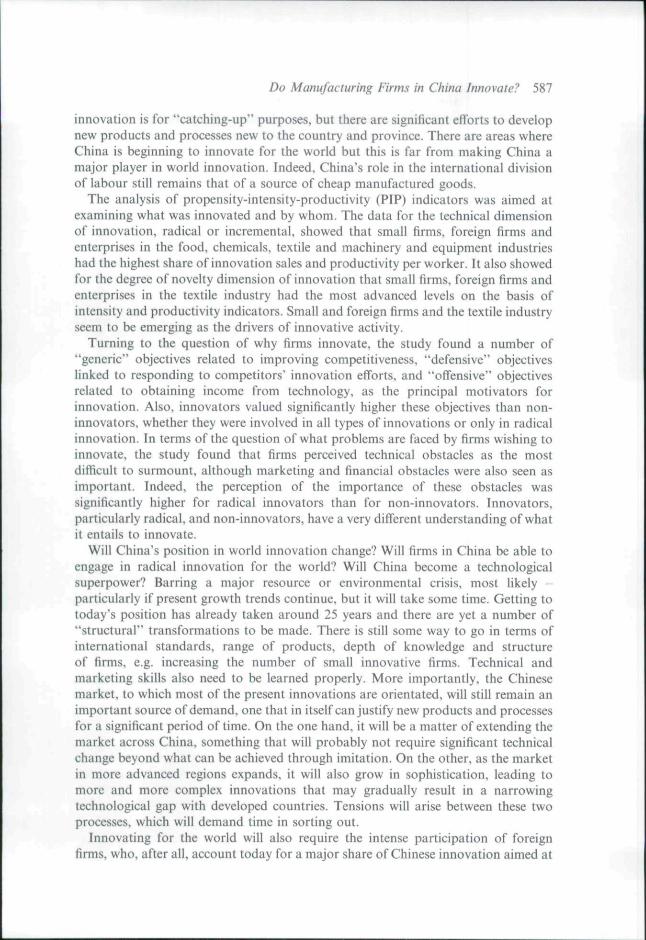
To examine which types of impediments and problems were faced by innovativefirms in China, the JPIS provided a list of nineteen possible obstacles for firms toselect based on the available literature. Figure 2 gives the list of obstacles as well astheir average scoring (see also An et al., 2005). As before, firms were given a choicefrom a five-point Likert scale, ranging from insignificant to crucial. Firms in Chinaperceived technical obstacles as the most difiiicuit to surmount. Enterprises'inadequate technical potential, lack of technical information and technologicalopportunities and limited knowledge co-operation with outside firms averaged 3.07.Lack of access to finance was the second highest impediment to innovation, averaging2.95, followed by marketing (2.89) and economic (2.87) obstacles. Economicobstacles included excessive risk, high or uncontrollable costs, ease of copy, lack ofskilled staff, long pay-off period and ownership types. Marketing limitations involvedpoor market responsiveness and market information and uncertainties related tolaunching timing. Government-related impediments, including regulations andtechnical assistance, and organisational limitations, such as resistance to changeand "locking" to old technologies, were the least important ones.
Analysing differences in obstacles to innovation faced by innovative and non-innovative firms required conducting further Mann-Whitney U statistical tests. Ascan be appreciated in Table 11, there was hardly any significant difference between
Do Manufacturing Firms in China Innovate? 583
EnterpriHe's innovation polcntinl loo small -
Lack of intoniialion on liohnotogies —
Lackofopponunitieïforco-operalionouisidc tlic
Lack oficchnological opponunan-s —
Lack ol'approfHislL- sources uf nn inuc -
Lack of tniormnlLon on markets —
Lack of customer responsu unoss lo ne« producid and processes -
Uncertainly in Liming of inncivalion —
Lack of skilled pcrsonni'l -
Long innovalion pay-off period —
Innovation costs too hif:h
InnovBlion loo easy to copy —
Innovationcostshardtocantriil -
Excessive perccivoil risk —
Owners h I |i -
Lack of oîitemal tcclinical services —
Legislation, norms, rcgulalions. standards, taxation -
Resistance to change in itie cntei
No need to innovate due in earlier innovaiioi» -
2
2--
Züt
in 11
.'.
2.f<4
2.214
2.1li4
.1.142
•/44
ft,'
94S
-1. I.U 1
im
K
'-*cL_..-. I.U 1
v(:V22
2.1
:'
VI
1
2
1
1
11
ZU1J
1ZI
1l
1
n
14
1
sMean
Figure 2. Innovation obstacles. Source: Jiangsu Province Innovation Survey
the two types of firm except for the obstacle of lack of technological opportunities,which was significant at the 0.05 level. This was rather surprising, as one wouldexpect some more differences emerging out of what Baldwin and Johnson (1996),Baldwin and Lin (2002) and Gellatly (1999) termed ex-ante and ex-postimpediments. Fx-ante obstacles arise prior to making innovation investments, whileex-post obstacles arise out of firms actually undertaking innovation programmes. Aswith objectives, firms actually undertaking innovation may have already faced someobstacles that they perceive with much more trepidation than non-innovative firms.However, lack of differences may result from the inclusion of process andincremental innovation, which normally involve far less difficulties than radicalinnovation.
Indeed, difi"erences between innovative and non-innovative firms carrying outradical innovation were much more apparent (Table 11). As with objectives, all firmsthat declared sales of radical innovations were included, independent of their share.Ail technical obstacles were significant at the 0.05 and 0.01 levels. According toBaldwin and Lin (2002), radical innovators tend to be highly technically orientatedfirms and, due to their practical experiences with these difiiculties. have a far betterunderstanding than non-innovators of the technical and knowledge requirementsand interactions, as well as of the potential problems to be faced in the innovationprocess. Another obstacle differentiating firms was lack of access to finance. This is awell-known impediment faced mainly, though not exclusively, by SMEs (Hadjima-nohs, 1999; Vermeulen 2005). Although improving, established Chinese banks andfinancial institutions still tend to shun innovative projects due to the high risksinvolved and their lack of experience in assesing such projects, while internallyfinanced projects are competing with projects that involve far less uncertainties.There are also very few venture capitalists in China, despite recently established
-o
•oc
<: (N
«3
O
584
p p po Ö d
oo d os "ij" r--ON (N &> fN Qs
pd
pfN
pd
S o oOÙ
fN
d
soSOO
d
pfN
pO\
Os fN pOO rN —
Os fS
^ O
»/ Osr'i fN
Os
fN
os
fN
.—«
oÖ
soOSfN
d
tt OsfN mfN 00
d d
oooOs
d(N
d
108
—1
141
137
146
—
125
144
—
100
—
141
124
143
143
146
112 o
138
— •
130
1 ^
138 os
130
(N
152 o
149
0 0
145 o
149
1-1
148 so
V I
141
^ O O »N (^V fS r - (N so(N (N fN
— 'S- — f N m o o — OfNuntNSOfN'OtNiO
fN (N iN fN
5J ?: * "> o >a a-acQ c ra> 7 >O c O
ç o ç
2 —5
c ifl ^u ,« o
O > O > O > O >C "z: C -^^ C -.S C '.SC c n c cn c n c
> "7 > -V
CO
o
c
c
>• ^
o
ac
• T "
B>O
OrB
' 7
>
;Ȇ
or^
• . - *
p
>
Ü
oBn
' V
>
>o
E VÖ c
i^ o T3._ Z.; n sn
•a
o i
o o£3 u
aco
o -SP
c • 3»
.fiCB
< : <N
S î
(d
p.
fN
Ö
in oON —;
oo
(^ ^ Ô fN —• ^ rn
^ O >« n «
U >> O
> T
<1> >> O
c< C
cost
coc5
Inno
v
'S1—>
con
• c
1
perc
ei
u
'î«
Exc
ès
&.
en• H
Ow
ne
lern
a
o
Lac
k
inUU
serv
oCu
ufPOcco
Leg
isI
nJT3P«
ns.
si
o
Quu.
— 0000 • ^o —
oOs
(N (N <N fN
O(N"!tCN— — O(N —fN r-1 <N ÍN (N
o > o >c "3 esc m Ç nc o c oo Ç o
3'O
U
C aei >
c c -ocU U U33
X « W
a:o
z585
586 L. Alcorta et al.
government funds. Marketing obstacles differentiating firms included poor percep-tion of products by markets and lack of market information, suggesting thatinnovators have probably already tried and failed in coming up with completely newproducts and processes. Economic obstacles perceived as higher by innovative firmsincluded limitations to control innovation costs and the long repayment period ofinnovative investments. This also suggests that innovative firms may have actuallyexperienced the long and protracted process involved in developing significantly newproducts and processes, which is normally characterised by project delays, costoverruns and significant lags in recovering investments (Wheelwright and Clark.1992). Finally, lack of technical support by government agencies was also perceivedas a major obstacle by radical innovators, presumably because they are demandingsuch services.
The findings for radical innovation in China seem to be in line with what otherstudies comparing obstacles faced by innovators report. Baldwin and Lin (2002),comparing plant adopters and non-adopters of advanced technology from Canada's1993 Innovation and Advanced Technology Survey, found that cost and skill factorswere the most important difficulties faced by adopters. Resistance to change both bymanagement and workers was another important obstacle, followed by government-related difficulties and marketing and technical information deficiencies. Gellatly(1999), focusing on business services firms under 50 employees from Canada's 1996Innovation Survey, found that innovators encounter more obstacles in ease ofcopying, market access and finding skilled labour. Galia and Legros (2004). usingFrench data from the EU's 1994-96 Innovation Survey (CIS2). found that firmspostponing innovation projects face economic risk, mounting innovation costs,organisational rigidities and lack of skilled personnel, customer responsiveness andtechnological information as key obstacles. Firms abandoning innovation projectstend to face economic risks more than technological or organisational ones.
Conclusions
China has been trying to develop a technological and innovative capacity inmanufacturing for more than 60 years. It has experimented with a wide range ofapproaches that included top-down dirigiste methods, self-reliant workers'dominated schemes and. nowadays, increasingly market-led practices. The post-Í978 reform policies have gone some way in building an innovation system that isdecentralised and efficient. There has been a shift of technological activities awayfrom government and into firms, R«feD expenditure has doubled, the number of localand international patents has increased and, up to the end of the last decade,innovation was on the rise.
The emerging changes had a large impact over innovative and technological effortsacross China and, especially, in Jiangsu Province, where this study was conducted.Indeed, in addressing the first research question on the extent of innovation, the datademonstrated that a relatively large proportion of firms in China engage ininnovation, although the amount of sales arising from those activities is on the lowerend of the international scale. Most of the innovation is incremental and, in terms ofdegree of novelty, firms in China displayed a small proportion of world innovations,although there are few reference points to compare with. The largest share of
Do Manufacturing Firms in China Innovate? 587
innovation is for ''calching-up" purposes, bul there are significant efforts to developnew products and processes new to the country and province. There are areas whereChina is beginning to innovate for the world but this is far from making China amajor player in world innovation. Indeed, China's role in the international divisionof labour still remains that of a source of cheap manufactured goods.
The analysis of propensity-intensity-productivity (PIP) indicators was aimed atexamining what was innovated and by whom. The data for the technical dimensionof innovation, radical or incremental, showed that small firms, foreign firms andenterprises in the food, chemicals, textile and machinery and equipment industrieshad the highest share of innovation sales and productivity per worker. It also showedfor the degree of novelty dimension of innovation that small firms, foreign firms andenterprises in the textile industry had the most advanced levels on the basis ofintensity and productivity indicators. Small and foreign firms and the textile industryseem to be emerging as the drivers of innovative activity.
Turning to the question of why firms innovate, the study found a number of"generic" objectives related to improving competitiveness, "defensive" objectiveslinked to responding to competitors" innovation efforts, and "offensive" objectivesrelated to obtaining income from technology, as the principal motivators forinnovation. Also, innovators valued significantly higher these objectives than non-innovators, whether they were involved in all types of innovations or only in radicalinnovation. In terms of the question of what problems are faced by firms wishing toinnovate, the study found that firms perceived technical obstacles as the mostdifficult to sunnount, although marketing and financial obstacles were also seen asimportant. Indeed, the perception of the importance of these obstacles wassignificantly higher for radical innovators than for non-innovators. Innovators,particularly radical, and non-innovators, have a very different understanding of whatit entails to innovate.
Will China's position in world innovation change? Will firms in China be able toengage in radical innovation for the world? Will China become a technologicalsuperpower? Barring a major resource or environmental crisis, most likely -particularly if present growth trends continue, but it will take some time. Getting totoday's position has already taken around 25 years and there are yet a number of"structural" transformations to be made. There is still some way to go in terms ofinternational standards, range of products, depth of knowledge and structureof firms, e.g. increasing the number of small innovative firms. Technical andmarketing skills also need to be learned properly. More importantly, the Chinesemarket, to which most of the present innovations are orientated, will still remain animportant source of demand, one that in itself can justify new products and processesfor a significant period of time. On the one hand, it will be a matter of extending themarket across China, something that will probably not require significant technicalchange beyond what can be achieved through imitation. On the other, as the marketin more advanced regions expands, it will also grow in sophistication, leading tomore and more complex innovations that may gradually result in a narrowingtechnological gap with developed countries. Tensions will arise between these twoprocesses, which will demand time in sorting out.
Innovating for the world will also require the intense participation of foreignfirms, who, after all, account today for a major share of Chinese innovation aimed at
588 L. Alcorta et al.
the world. It is difficult to see major multinationals easily giving up their mostadvanced technology and "crown jewel products'" for research and development inChina. Even if they did so, the transfer process will also take some time. In sum,while the international catching-up process could easily take several decades, theseeds for a sustained innovation process seem to be in place.
Ack no wledgement
The aulhors would like to thank the Maastricht School of Management's International ProjectsDepartment for making the field work for this study possible.
Notes
' We are grateful to an anonymous referee for pointing this out." In China, between 1998 and 2002, the proportion of state, collective and co-operative industrial firms fell
from around VÍVo to 43%; the proportion of non-mainland and foreign firms increased from 16% to19%; while the proportion of other forms of ownership increased from 9% to 39% {NBS, 2003).
References
Abemathy, W. and J. Utterback (1978) "Patterns of Industrial Innovation," Technology Review, 2, pp, 40-7.
Acs, Z. and D. Audretsch (1990) Innovalion ami Small Firm, Cambridge: MIT Press.An, T., Y. Fang and L. Alcorta (2005) "Obstacles to Technological Innovation by Chinese Manufacturing
Firms," Economic Theory and Business Management. 7. pp. 41-7 [in Chinese].Australian Bureau of Statistics [ABS] (2006) Innovation in Australian Busine.ss, 2005. Canberra: ABS.
8158.0. December. http:,//www.abs.gov.au/AUSSTATS/abs(S .nsf/DotailsPage/S158.02005?OpenDocument (downloaded 25 January 2008).
Baldwin, J. (1996) "The characteristics of innovation regimes by type of innovation," Paper presented atConference on Innovation Measurement and Policies organised by the Statistical Office of the EuropeanCommunities, Luxembourg. 20-1 May.
Baldwin. J. and J, Johnson. (1995) Business siralegies in innovative and non-innovative firms in Canada.Ottawa: Statistics Canada, Micro-Economic Studies and Analysis Division, Working Paper No.73,February.
Baldwin. J. and Z. Lin (2002) "Impediments to advanced technology adoption for Canadianmanufacturers," Research Policy. 31 ,1 . pp. 1-18.
Caves, R. (1996) Multinational Enterprise and Economic Analysis. Cambridge: Cambridge universityPress.
Cohen, W. and S. KItpper (1996) "Firm Size and the Nature of Innovation within Industries: The Case ofProcess and Product R&D," The Review of Economics and Statistics. 78, 2, pp, 232-43.
Consejo Nacional de Ciencia y Tecnología (CONACYT) and instituto Nacional de Estadística, Geografíac Informática (INFGI) (2003) Second National Manufacturing and Services Innovation Survey. MexicoD,F, [in Spanish],
Dougherty, D, (1992) "Interpretive Barriers to Successful Product Innovation in Large Firms,"Organization Science. 3, 2, pp. 179-202.
Dunning. J. (2001 ) "The Eclectic (OLI) Paradigm of International Production: Past. Present and Future,"International Journal of the Economics of Btisiness. 8. 2, pp. 173-90.
European Commission [EC] 2004, Innovation in Europe. Results for the EU. Iceland and Norway. Data¡998-2001. Luxembourg: Office for Official Publications of the European Communities-
Fischer, W. and M, von 2^dtwitz (2004) "Chinese R&D: Naissance, Renaissance, or Mirage?." RdDManagement, 34, 4, pp, 349-65.
Freeman, C. and L. Soete (1997) The Economics of Industrial Innovation, London: Pinter.Frenkel, A. (2003) "Barriers and Limitations in the Development of Industrial Innovation in the Region,"
European Plamiing Studies. 11. 2, pp. 115-37.
Do Manufacturing Firms in China Innovate? 589
Galia. F. and D. Legros (2004) "Complementarities between obstacles to innovation: evidence fromFrance," Research Policy, 33, 8, pp. 1185-99.
Gellatly. G. (1999) Differences in Innovator and Non-innovator Profiles: Small Establishments in Bu.%inessServices, Ottawa: Statistics Canada, Micro-Economics Analysis Division No. 143 (I IF00I9MPE).
Hadjimanolis, A. (1999) "Barriers to innovation for SMEs in a small less developed country (Cyprus),"Technovation, 19, pp. 561-70.
Hu. A. and G. Jefferson. (2004) "Science and Technology in China," Paper presented at Conference onChina's Economic Transition: Origins. Mechanisms and Consequences, Pittsburgh. 5-7 November.
Instituto Brasileiro de Geografía e Estali.stica [IBCiE] (2005) Technological Innovation Industrial Survey2003, Ministerio do Planejamento. Orçamento e Gestao. Rio de Janeiro [in Portuguese].
Instituto Nacional de Estadística y Censos [INDEC] (2003) Second Argentinean Firms Innovation andTechnological Behaviour Survey 1998-2001. Buenos Aires: INDEC. SECYT. CEPAL [in Spanish].
Jefferson. G.. A. Hu. X. Guan and X. Yu (2003) "Ownership, performance, and innovation In China'slarge- and medium-size industrial enterprise sector." China Economic Review. 14. pp. 89-113-
Jiangsu Statistical Bureau [JSB] (2003) Jiangsu Statistical Yearbook 2003. Beijing: China StatisticsPress.
Kikeri. S- and J. Nellis(2OO4) "An Assessment of Privatization." World Bank Research Okierver, 19. I. pp.87-118.
Kozul-Wright. R. and R. Rowthorn (1998) "Spoilt for Choice? Multinational Corporations and theGeography of International Production." Oxford Revie» of Economic Policy. 14. 2. pp. 74-92.
Liang. T. (2003) "APEC Profile of SMEs: What is an SME? SME Definitions and Statistical Issues."Journal of Enterprising C u l t u r e . I I , } . p p . 1 7 3 - 8 3 .
Maidique. M. and R. Hayes (1984) The Art of High-Technology Management." Sloan ManagementRfview, 25. 2. pp. 18-31.
Malaysian Science and Technology Information Centre [MASTIC] (2003) National Survey of Innovation2000-2001. Kuala Lumpur: Ministry of Science, Technology and the Environment.
Megginson. W. and J. Netter (2001) "From State to Market: A Survey of Empirical Studies onPrivatization." Journal of Economic Literature. 39. 2, pp. 321-89.
Mobnen, P. and J. Rosa. (1999) Barriers to innovation in services industries in Canada. Ottawa: StatisticsCanada. Sciences & Technologies Research Papwr No. 7,
National Bureau of Statistics of China [NBS] (2003) China Statistical Yearbook 2003. Beijing: ChinaStatistics Press.
Oerlenians. L., M. Pretorius. A. Buys and G. Rooks. (2003) Industrial Innovation in South Africa. I99S-2000. Repon on the South African Innovation Survey for the Period 1998-2000, Pretoria and Eindhoven:Institute for Technological Innovation, Department of Engineering and Technology Management.tJniversity of Pretoria. South Africa; and Eindhoven Centre for Innovation Studies, EindhovenUniversity of Technology. The Netherlands.
Organisation for Economic Co-operation and Development and Europwan Commission (OECD/EC)(1997) OSLO Manual, Paris: Organisation for Economic Co-operation and Development.
Rasiah. R. (2007) "Export Orientation and Technological Intensities in Auto Paris Firms in East andSoutheast Asia: Does Ownership Matter?," Asian Economic Papers. 6, 2, pp. 55-76.
Rosa. J. (2002) Determinants of Product and Process Innovation oin Canada s Dynamic Service Industrie.'!,Ottawa: Statistics Canada, Science, Innovation and Electronic Information Division, Working PaperNo. 17. December.
Rosen. D, (2003) "Low tech bed. high-tech dreams." China Economic Quarterly. Q4. pp. 19-44.Schaaper. M. (2004) An emerging knowledge-based economy in China? Indicators from OECD databases,
Paris: DSTI. OECD, STI Working Paper 2004/4, March.Schumpeter. J. (1942) Capitalism. Socialism and Democracy. New York: Harper.Sigurdson. J. (2004) China Becoming a Technological Superpower - A Narrow Window of Opportunity.
Singapore: East Asian Institute, National University of Singapore. Working Paper No. 194. June.Statistics Canada (2002) Survey of Innovation 1999. Statistical Tables Manufacturing Industries, Ottawa:
Statistics Canada Cat. No. 88F0006XIE. 1ft December.Steinfeld. E. (2004) "China's shallow integration: Networked production and ihe new challenges for late
industrialization," World Development. 32. II. pp. 1971-87.Stock. G.. N. Greis and W. Fischer (2002) "Firm size and dynamic technological innovation,"
Technovation, 22, pp. 537-49.

590 L. Alcorta et al.
Sun, L. (2003) "Ownership Reform in the Absence of Crisis: China's Township, Village and PrivateEnterprises," in R. Mclntyre and B. Dallago (eds), Small and Medium Enterprises in TransitionalEconomies. Houndmills: Palgrave-Macmillan. pp. 134-52.
Therrien. P. and P. Mohnen (2003) "How innovative are Canadian firms compared to some Europ)eanfirms? A comparative look at innovation surveys," Technovation, 23, 4, pp. 359-69.
Tourigny, D. and C. Le (2004) "Impediments to innovation faced by Canadian manufacturing firms,"Economics of Innovation and New Technology, 13. 3. pp. 217-50.
Vermeulen, P. (2005) "'Uncovering barriers to complex incremental product innovation in small andmedium-sized financial services firms," Journal of Small Business Management. 43, 4. pp. 432-52.
Wen, M., D. Li and P. Lloyd (2002) "Ownership and Technical Efficiency: A Cross-Section Study on theThird Industrial Census of China," Economic Development and Cultural Change, 50, 3, pp. 709-34.
Wheelwright, S. and K. Clark (1992) "Creating Project Plans to Focus Product Development," HarvardBusiness Review. 70, 2, pp. 70-82.
Zeil. D. (2001) "Overcoming Barriers to Work Innovation: Lessons from Hewlett-Packard," Organiza-tional Dynamics. 30, 1, pp. 77-86.