Embed Size (px)
Citation preview

DRAFT ENVIRONMENTAL
SCOPING REPORT FOR THE PROPOSED FULL-
SCALE COMPOSTING OF SLUDGE WASTE STREAMS,
SECUNDA, MPUMALANGAMay 2015
DEA REF: 12/9/11 L45317/6
MDARDLEA REF: 17/2/3 GS-277

Page | ii
Document Description
Client:
Sasol Chemical Industries (Pty) Ltd
Project Name:
Draft Environmental Scoping Report for the Proposed Full-Scale Composting of Sludge Waste Streams at Sasol Secunda, Mpumalanga
Royal HaskoningDHV Reference Number:
T01.PTA.000589
Compiled by:
Nicole Botham
Date:
April - May 2015
Location:
Pretoria
Review and approval:
Prashika Reddy
_____________________________ Signature
© Royal HaskoningDHV
All rights reserved.
No part of this publication may be reproduced or transmitted in any form or by any means, electronic or mechanical, without the written permission from Royal HaskoningDHV

Page | iii
Table of Contents
1 INTRODUCTION .......................................................................................................... 1
Project Background and Need ............................................................................................................ 1 1.1
Key Objectives of the Study ................................................................................................................ 3 1.2
Approach to the Environmental Scoping Study .................................................................................. 3 1.3
Details of the Environmental Assessment Practitioner ....................................................................... 4 1.4
Structure of the Report........................................................................................................................ 6 1.5
2 PROJECT DESCRIPTION ............................................................................................ 8
Project Location .................................................................................................................................. 8 2.1
Composting Process Description ........................................................................................................ 9 2.2
Construction of Composting Pad ...................................................................................................... 10 2.2.1
Windrow Construction ....................................................................................................................... 11 2.2.2
Collection of Sludge .......................................................................................................................... 12 2.2.3
Pumping of sludge ............................................................................................................................ 12 2.2.4
Microbial Population Amendment ..................................................................................................... 12 2.2.5
Temperature Monitoring and Aeration .............................................................................................. 13 2.2.6
Final Product Processing .................................................................................................................. 13 2.2.7
Proposed End-use of the Compost ................................................................................................... 14 2.3
3 PROJECT ALTERNATIVES ....................................................................................... 15
Do Nothing / No-Go Alternative ........................................................................................................ 15 3.1
Technology Alternatives.................................................................................................................... 15 3.2
Site Alternatives ................................................................................................................................ 16 3.3
Site Alternative 1 ............................................................................................................................... 16 3.3.1
Site Alternative 2 ............................................................................................................................... 16 3.3.2
4 LEGAL REQUIREMENTS .......................................................................................... 17
The Constitution of South Africa (No 108 of 1996) ........................................................................... 17 4.1
National Environmental Management Act (No 107 of 1998) ............................................................ 17 4.2
National Environmental Management: Waste Act (No 59 of 2008) .................................................. 18 4.3
National Environmental Management Act: Air Quality Act (No 39 of 2004) ..................................... 19 4.4
National Ambient Air Quality Standards (No 1210 of 2009) ............................................................. 19 4.4.1
Other Relevant Acts, Guidelines, Department Policies and Environmental Management 4.5Instruments ................................................................................................................................................... 20
5 PUBLIC PARTICIPATION .......................................................................................... 21
Page | iv
Identification of Interested and Affected Parties ............................................................................... 22 5.1
Briefing Paper ................................................................................................................................... 22 5.2
Issues Trail ........................................................................................................................................ 22 5.3
Consultation with Competent Authorities .......................................................................................... 23 5.4
Consultation with Other Relevant Stakeholders ............................................................................... 23 5.5
Advertising ........................................................................................................................................ 23 5.6
Public and Authority Review of the Draft Scoping Report ................................................................ 23 5.7
Final Environmental Scoping Report ................................................................................................ 24 5.8
6 DESCRIPTION OF STUDY AREA ............................................................................. 25
Geology and Topography ................................................................................................................. 25 6.1
Land Use ........................................................................................................................................... 25 6.2
Soils and Agricultural Potential ......................................................................................................... 25 6.3
Geohydrology (Groundwater) Baseline ............................................................................................ 26 6.4
Goedehoop site ................................................................................................................................. 26 6.4.1
Grootvlei Site .................................................................................................................................... 29 6.4.2
Hydrology .......................................................................................................................................... 32 6.5
Climate and Local Weather Conditions ............................................................................................ 34 6.6
Wind .................................................................................................................................................. 34 6.6.1
Atmospheric Stability ........................................................................................................................ 41 6.6.2
Temperature and Humidity ............................................................................................................... 42 6.6.3
Precipitation ...................................................................................................................................... 43 6.6.4
Ecology ............................................................................................................................................. 44 6.7
Vegetation – Goedehoop Site ........................................................................................................... 44 6.7.1
Vegetation – Grootvlei Site ............................................................................................................... 47 6.7.2
Protected Trees Species .................................................................................................................. 49 6.7.3
Red Data / Endemic Species ............................................................................................................ 49 6.7.4
Land Degradation ............................................................................................................................. 49 6.7.5
Fauna - Goedehoop Site .................................................................................................................. 50 6.7.6
Fauna – Grootvlei Site ...................................................................................................................... 53 6.7.7
Social ................................................................................................................................................ 54 6.8
Air Quality ......................................................................................................................................... 54 6.9
Sensitive Receptors .......................................................................................................................... 55 6.9.1
Existing Sources of Air Pollution ....................................................................................................... 56 6.9.2
Air Quality Situation in Study Area .................................................................................................... 58 6.9.3
Noise ................................................................................................................................................. 71 6.10

Page | v
Health and Safety ............................................................................................................................. 71 6.11
Heritage ............................................................................................................................................ 71 6.12
Regional Overview ....................................................................................................................... 71 6.12.1
Identified Historical Sites in Study Area ....................................................................................... 72 6.12.2
Road Network ................................................................................................................................... 72 6.13
7 POTENTIAL IMPACTS ASSOCIATED WITH THE PROJECT .................................. 74
Construction Phase ........................................................................................................................... 74 7.1
Operational Phase ............................................................................................................................ 75 7.2
Decommissioning Phase .................................................................................................................. 76 7.3
Cumulative Impacts .......................................................................................................................... 76 7.4
8 CONCLUSIONS AND RECOMMENDATIONS .......................................................... 77
9 PLAN OF STUDY FOR ENVIRONMENTAL IMPACT ASSESSMENT ...................... 78
Approach to Undertake the EIA Phase of the Project ...................................................................... 78 9.1
Authority Consultation ....................................................................................................................... 78 9.1.1
Aims of the Environmental Impact Assessment ............................................................................... 78 9.1.2
Detailed Studies to be undertaken in the EIA Phase – Specialist Studies ....................................... 78 9.1.3
Impact Assessment Methodology ..................................................................................................... 82 9.1.4
Environmental Impact Assessment Report....................................................................................... 85 9.1.5
Draft Environmental Management Programme ................................................................................ 85 9.1.6
Public Participation Process ............................................................................................................. 86 9.2
Advertising ........................................................................................................................................ 86 9.2.1
Identification of and Consultation with Key Stakeholders ................................................................. 86 9.2.2
I&AP Database ................................................................................................................................. 86 9.2.3
Consultation and Public Involvement ................................................................................................ 86 9.2.4
Issues Trail ........................................................................................................................................ 86 9.2.5
Public and Authority Review of the Draft Environmental Impact Assessment Report ..................... 86 9.2.6
Authority Review of the Environmental Impact Assessment Report ................................................ 87 9.2.7
Environmental Authorisation and Waste Management Licence ....................................................... 87 9.2.8
Page | vi
List of Figures
Figure 1: Waste hierarchy ..................................................................................................................................................... 1
Figure 2: Locality map ........................................................................................................................................................... 2
Figure 3: Environmental studies flowchart ........................................................................................................................... 4
Figure 4: Google Earth image of Site Alternative 1 and 2 ..................................................................................................... 8
Figure 5: Simplified flow diagram of composting process (Property of Sola Fidei Manufacturing) .................................... 10
Figure 6: Windrow bunker .................................................................................................................................................. 11
Figure 7: Pumping of sludge into windrow ......................................................................................................................... 12
Figure 8: Windrow turning in order to aerate the compost ................................................................................................ 13
Figure 9: Compost product .................................................................................................................................................. 14
Figure 10: Bulking material cultivation ............................................................................................................................... 14
Figure 11: Goedehoop hydrocensus map ............................................................................................................................ 27
Figure 12: Grootvlei hydrocensus map ............................................................................................................................... 29
Figure 13: Rainfall distribution ............................................................................................................................................ 32
Figure 14: Storm rainfall ..................................................................................................................................................... 33
Figure 15: Run-off distribution ............................................................................................................................................ 33
Figure 16: Study area run-off .............................................................................................................................................. 34
Figure 17: Period wind rose from the Secunda monitoring station for the Jan 2010 – Dec 2013 monitoring period ......... 35
Figure 18: Wind class frequency distribution for the Jan 2010 – Dec 2013 monitoring period .......................................... 36
Figure 19: Seasonal wind roses (summer and spring) for the Jan 2010 – Dec 2013 monitoring period ............................. 37
Figure 20: Seasonal wind roses (autumn and winter) for the Jan 2010 – Dec 2013 monitoring period ............................. 38
Figure 21: Diurnal wind roses (00:00-06:00 – 06:00-12:00) for the Jan 2010 – Dec 2013 monitoring period .................... 39
Figure 22: Diurnal wind roses (12:00-18:00 – 18:00-24:00) for the Jan 2010 – Dec 2013 monitoring period .................... 40
Figure 23: Stability class frequency distribution ................................................................................................................. 41
Figure 24: Average monthly temperature and relative humidity for the Jan 2010 – Dec 2013 monitoring period ............ 42
Figure 25: Average precipitation for the period under review from Jan 2010 – Dec 2013 ................................................. 43
Figure 26: Preliminary ecological sensitivity map for the Goedehoop site ......................................................................... 45
Figure 27: Moist Soweto Highveld grassland ...................................................................................................................... 46
Figure 28: Transformed grasslands ..................................................................................................................................... 46
Figure 29: Degraded Soweto Highveld grasslands .............................................................................................................. 47
Figure 30: Preliminary ecological sensitivity map for the Grootvlei site ............................................................................. 48
Figure 31: Transformed grasslands ..................................................................................................................................... 49
Figure 32: African Grass Owl (left) and Marsh Owl (right) ................................................................................................. 52
Figure 33: Highveld priority area ........................................................................................................................................ 55
Figure 34: Location of the DEA and Sasol monitoring stations ........................................................................................... 58
Figure 35: Daily average PM10 concentrations recorded at the Sasol Club and Langverwacht monitoring stations ........ 60
Figure 36: Daily average PM10 concentrations recorded at the DEA monitoring station ................................................... 60
Figure 37: Daily average SO2 concentrations recorded at the Sasol Club and Langverwacht monitoring stations ............ 61
Figure 38: Daily average SO2 concentrations recorded at the DEA monitoring station ...................................................... 62
Figure 39: Hourly average NO2 concentration recorded at the Sasol Club and Langverwacht monitoring stations .......... 63
Figure 40: Hourly average NO2 concentration recorded at the DEA monitoring station .................................................... 63
Figure 41: Odour impact assessment procedure stipulated by the NSW EPA for existing facilities .................................... 69
Figure 42: Road network around the Goedehoop and Grootvlei sites ................................................................................ 73
Page | vii
List of Tables
Table 1: Specialist studies ..................................................................................................................................................... 4
Table 2: Details of the EAP .................................................................................................................................................... 5
Table 3: ESR requirements according to section 28 of GN R. 543 ......................................................................................... 6
Table 4: Site Alternative 1 and 2 details ............................................................................................................................... 8
Table 5: Sludge streams produced at the Sasol Secunda Operations and current disposal methods ................................... 9
Table 6: Comparison of technology alternatives ................................................................................................................ 16
Table 7: Listed activities according to Listing Notice 1 and 2 of the EIA Regulations (2010) .............................................. 17
Table 8: Listed activities according to Category B of NEM:WA GN 921 .............................................................................. 18
Table 9: Competent authorities associated with the project .............................................................................................. 23
Table 10: Soil characteristics ............................................................................................................................................... 26
Table 11: Goedehoop hydrocensus borehole information .................................................................................................. 27
Table 12: Goedehoop hydrocensus borehole field results ................................................................................................... 28
Table 13: Grootvlei hydrocensus borehole information ...................................................................................................... 30
Table 14: Grootvlei hydrocensus borehole field parameters .............................................................................................. 31
Table 15: Atmospheric stability classes .............................................................................................................................. 41
Table 16: Red Data list of bird species on the Goedehoop site ........................................................................................... 50
Table 17: Identified sensitive receptors surrounding the study area .................................................................................. 55
Table 18: Annual average concentration of pollutants measured across the monitoring stations from 2010 -2013 ........ 59
Table 19: Ambient air quality guidelines applicable to the study ....................................................................................... 64
Table 20: Odour threshold values for odour compounds .................................................................................................... 65
Table 21: NSW EPA odour performance criteria defined based on population density ..................................................... 67
Table 22: Odour performance criteria used in various jurisdiction in the US and Australia .............................................. 67
Table 23: Project specific ambient air quality and odour standards and guidelines........................................................... 70
Table 24: Potential construction phase impacts ................................................................................................................. 74
Table 25: Potential operational phase impacts .................................................................................................................. 75
Table 26: Criteria to be used for the rating of impacts ....................................................................................................... 83
Table 27: Significance rating of classified impacts ............................................................................................................. 84
Page | viii
List of Appendices
APPENDIX A: LOCALITY MAP
APPENDIX B: PUBLIC PARTICIPATION DOCUMENTS
APPENDIX B1: I&AP DATABASE
APPENDIX B2: BRIEFING PAPER
APPENDIX B3: ADVERTS
APPENDIX B4: SITE NOTICES
APPENDIX C: AUTHORITY CONSULTATION

Page | ix
Glossary
Aliquot - A portion of a larger whole, especially a sample taken for chemical analysis or other treatment.
Alternatives - Different means of meeting the general purpose and requirements of the activity, which may include site or location alternatives; alternatives to the type of activity being undertaken; the design or layout of the activity; the technology to be used in the activity and the operational aspects of the activity.
Composting - A controlled biological process in which organic materials are broken down by micro-organisms.
Construction – The building, erection or establishment of a facility, structure or infrastructure that is necessary for the undertaking of a listed or specified activity but excludes any modification, alteration or expansion of such a facility, structure or infrastructure and excluding the reconstruction of the same facility in the same location, with the same capacity and footprint.
Cumulative impact - The impact of an activity that in itself may not be significant but may become significant when added to the existing and potential impacts eventuating from similar or diverse activities or undertakings in the area.
Do-nothing alternative - The ‘do-nothing’ or ‘No go’ alternative is the option of not undertaking the proposed activity, that is, the maintenance of the status quo.
Environmental Assessment Practitioner (EAP) - The individual responsible for planning, management and coordination of environmental impact assessments, strategic environmental assessments, environmental management programmes or any other appropriate environmental instrument introduced through the EIA Regulations.
Environmental Management Programme (EMPr) - A detailed plan of action prepared to ensure that recommendations for enhancing or ensuring positive impacts and limiting or preventing negative environmental impacts are implemented during the life cycle of a project. The EMPr focuses on the construction phase, operation (maintenance) phase and decommissioning phase of the proposed project.
Environmental Impact - A change to the environment, whether adverse or beneficial, wholly or partially, resulting from an organisation’s activities, products or services.
Fatal Flaw – Issue or conflict (real or perceived) that could result in a development being rejected or stopped. Such an issue or conflict would be considered to be a significant issue that mitigation could not address.
Integrated Environmental Management - A philosophy that prescribes a code of practice for ensuring that environmental considerations are fully integrated into all stages of the development and decision-making process. The IEM philosophy (and principles) is interpreted as applying to the planning, assessment, implementation and management of any proposal (project, plan, programme or policy) or activity - at local, national and international level - that has a potentially significant effect on the environment. Implementation of this philosophy relies on the selection and application of appropriate tools for a particular proposal or activity. These may include environmental assessment tools (such as strategic environmental assessment and risk assessment), environmental management tools (such as monitoring, auditing and reporting) and decision-making tools (such as multi-criteria decision support systems or advisory councils).
Interested and Affected Party - For the purposes of Chapter 5 of the NEMA and in relation to the assessment of the environmental impact of a listed activity or related activity, means an interested and affected party contemplated in Section 24(4)(a)(v), and which includes - (a) any person, group of persons or

Page | x
organisation interested in or affected by such operation or activity; and (b) any organ of state that may have jurisdiction over any aspect of the operation or activity.
Mitigate - The implementation of practical measures designed to avoid, reduce or remedy adverse impacts, or to enhance beneficial impacts of an action.
Watercourse – Means:
a) a river or spring; b) a natural channel or depression in which water flows regularly or intermittently; c) a wetland, lake or dam into which, or from which, water flows; and d) any collection of water which the Minister may, by notice in the Gazette, declare to be a watercourse
as defined in the National Water Act, 1998 (Act No. 36 of 1998) and a reference to a watercourse includes, where relevant, its bed and banks.
Wetland - Land which is transitional between terrestrial and aquatic systems where the water table is usually at or near the surface, or the land is periodically covered with shallow water, and which land in normal circumstances supports or would support vegetation typically adapted to life in saturated soil.
Page | xi
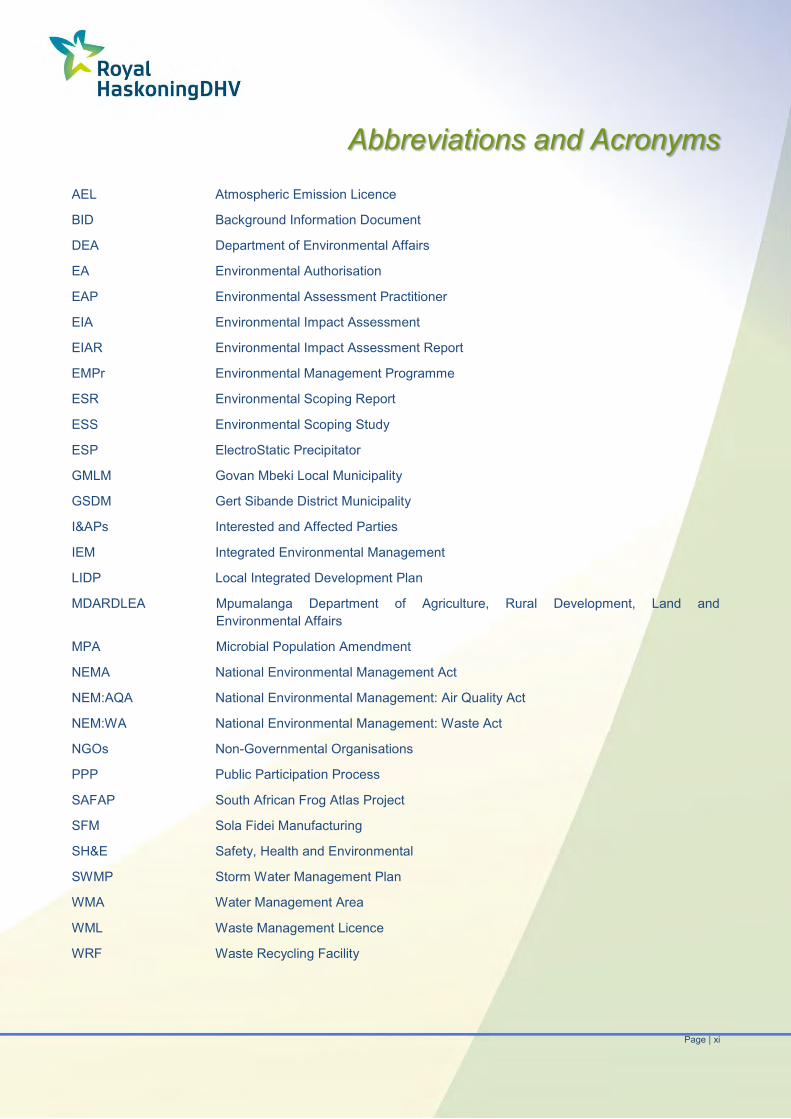
Abbreviations and Acronyms
AEL Atmospheric Emission Licence
BID Background Information Document
DEA Department of Environmental Affairs
EA Environmental Authorisation
EAP Environmental Assessment Practitioner
EIA Environmental Impact Assessment
EIAR Environmental Impact Assessment Report
EMPr Environmental Management Programme
ESR Environmental Scoping Report
ESS Environmental Scoping Study
ESP ElectroStatic Precipitator
GMLM Govan Mbeki Local Municipality
GSDM Gert Sibande District Municipality
I&APs Interested and Affected Parties
IEM Integrated Environmental Management
LIDP Local Integrated Development Plan
MDARDLEA Mpumalanga Department of Agriculture, Rural Development, Land and Environmental Affairs
MPA Microbial Population Amendment
NEMA National Environmental Management Act
NEM:AQA National Environmental Management: Air Quality Act
NEM:WA National Environmental Management: Waste Act
NGOs Non-Governmental Organisations
PPP Public Participation Process
SAFAP South African Frog Atlas Project
SFM Sola Fidei Manufacturing
SH&E Safety, Health and Environmental
SWMP Storm Water Management Plan
WMA Water Management Area
WML Waste Management Licence
WRF Waste Recycling Facility


Page | 1
1 INTRODUCTION
Project Background and Need 1.1The Sasol Secunda Operations generates various sludge streams through various processes taking place within the plant. Conventionally waste management for sludges in Sasol entails either in-process recovery, thermal destruction at the U52/252 incinerators, treatment and/or disposal at landfills.
With the promulgation of National Environmental Management: Air Quality Act (No 39 of 2004) – NEM:AQA Minimum Emission Standards in March 2010, new, stricter emissions limits were set to come into effect in 2015 that would result in a requirement for abatement of the emissions from the U52/252 incinerators, or alternative disposal of the sludge to a landfill.
Furthermore, with the promulgation of the National Environmental Management: Waste Act (No 59 of 2008) - NEM:WA Waste Classification and Management Regulations and Norms and Standards in August 2013, the intent is to drive waste management (in the case for this project, regarding industrial wastes) away from landfill disposal, up the waste hierarchy to more environmentally sustainable options, such as: waste avoidance (reduction at source), re-use, recycling, and energy recovery (refer to Figure 1).
It is therefore evident that there is a need for cost-effective and environmentally sustainable options for treatment/disposal of sludges from Sasol.
Figure 1: Waste hierarchy
Composting was identified as a possible alternative to landfill disposal and incineration. Composting is a controlled biological process in which organic materials are broken down by micro-organisms. Whilst the composting of domestic sludges is widely practiced world-wide, the methodology for the composting of industrial waste sludges had not yet been developed to adequately break down metals and other possible harmful components found in these industrial sludges.
In April 2012, Sasol Technology commenced with trials to determine the feasibility of composting of the industrial sludges and Sola Fidei Manufacturing (SFM) carried out the test work. SFM introduced a unique synergistic composting process whereby the waste sludge (a blend of industrial and domestic sludge) is

Page | 2
converted into compost, by absorption into the biomass, which grants the suitable environment needed for the bio-conversion (using micro-organisms) of the streams into a final product i.e. compost.
In April 2013, a composting pilot plant was established on the farm Goedehoop 290 IS for the initial testing of various sludge streams produced at the Sasol Secunda Operations. These streams included:
Biosludge; API sludge; Process cooling tower sludge; Waste Recycling Facility (WRF) sludge; and Process water dam sludge.
Due to the positive results and favourable business economics demonstrated from the pilot operations, that can handle a total of 150 t/month sludge, it is proposed to construct a full-scale facility that can handle up to 300 000 t/a of sludge, processing a combination of various streams (industrial sludge streams) emanating from the Sasol Secunda Operations.
The full-scale plant will be developed on either the farm Goedehoop 290 IS (Portions 6 and remainder) or Grootvlei 293 IS (Portions 13 and 29) that will cater for a composting area of up to 45 ha (Figure 2 and Appendix A).
Figure 2: Locality map

Page | 3
Key Objectives of the Study 1.2The key objectives of the project are therefore to:
To develop a process that consistently converts hazardous industrial sludges into value-adding compost that complies with all relevant regulations.
To add value to the community through job creation. To develop an additional alternative to the current waste management approaches. To develop a low biodiversity impact application for Sasol properties, currently used for pesticide intensive
farming.
Approach to the Environmental Scoping Study 1.3The environmental impacts associated with the proposed project require investigation in compliance with Government Notice No. 921 of the NEM:WA (Act No 59 of 2008) and the EIA Regulations (2010) published in Government Notice No. R. 543 to No. R. 545 and read with Section 24 (5) of the National Environmental Management Act - NEMA (Act No 107 of 1998) as amended.
A two-pronged licencing process for the proposed project will be followed, namely:
(a) The Department of Environmental Affairs (DEA) is the competent authority for the waste management licence (WML) in terms of NEM:WA.
(b) The Mpumalanga Department of Agriculture, Rural Development, Land, and Environmental Affairs (MDARDLEA) is the competent authority for the issuing of an environmental authorisation applied for in terms of the EIA Regulations, 2010 promulgated under NEMA.
The rationale behind this two-pronged licencing process is that, the Minister of Environmental Affairs is the licencing authority in respect of all activities listed in terms of Section 19 of NEM:WA pertaining to hazardous waste. MDARDLEA is the competent authority in respect of the GN R.545 listed activities as it is the environmental authority in the province in which the activity is to be undertaken.
The required environmental studies include the undertaking of an Environmental Impact Assessment (EIA) process. This process is being undertaken in two phases (see Figure 3) that will ultimately allow the competent authorities (DEA and MDARDLEA) to make an informed decision:
Phase 1 - Environmental Scoping Study (ESS) including Plan of Study for EIA; and Phase 2 - EIA and Environmental Management Programme (EMPr).
Page | 4
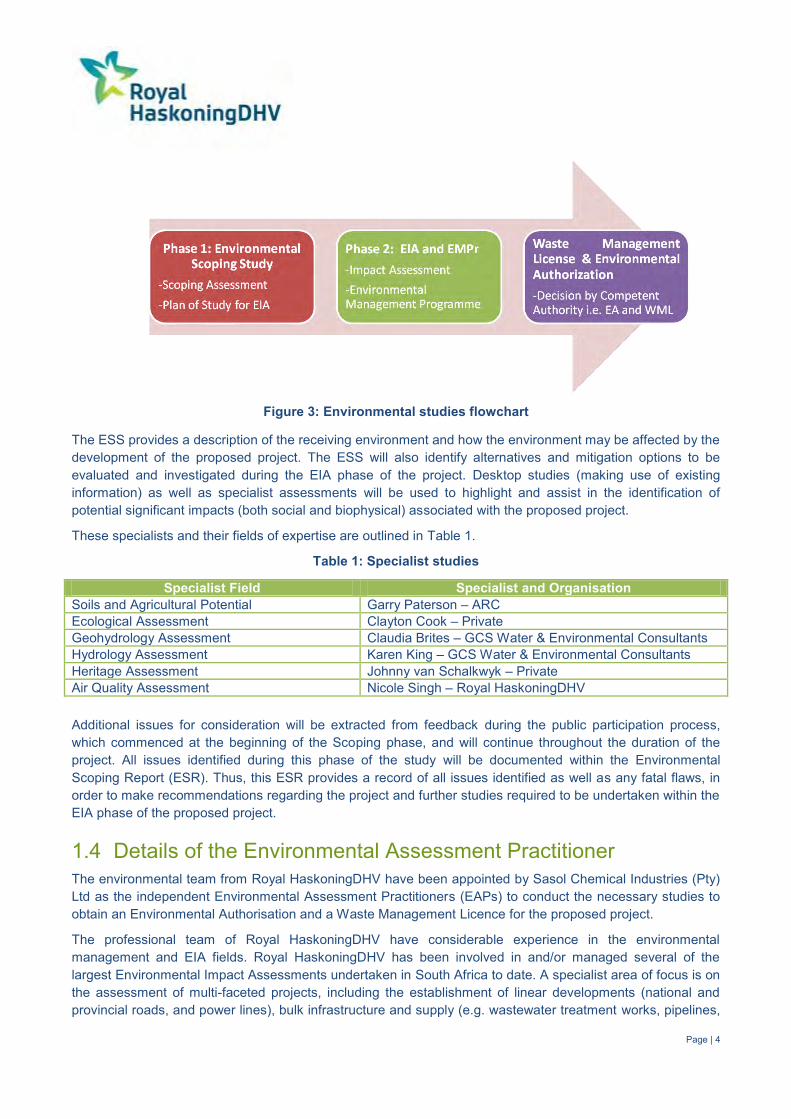
Figure 3: Environmental studies flowchart
The ESS provides a description of the receiving environment and how the environment may be affected by the development of the proposed project. The ESS will also identify alternatives and mitigation options to be evaluated and investigated during the EIA phase of the project. Desktop studies (making use of existing information) as well as specialist assessments will be used to highlight and assist in the identification of potential significant impacts (both social and biophysical) associated with the proposed project.
These specialists and their fields of expertise are outlined in Table 1.
Table 1: Specialist studies
Specialist Field Specialist and Organisation Soils and Agricultural Potential Garry Paterson – ARC Ecological Assessment Clayton Cook – Private Geohydrology Assessment Claudia Brites – GCS Water & Environmental Consultants Hydrology Assessment Karen King – GCS Water & Environmental Consultants Heritage Assessment Johnny van Schalkwyk – Private Air Quality Assessment Nicole Singh – Royal HaskoningDHV
Additional issues for consideration will be extracted from feedback during the public participation process, which commenced at the beginning of the Scoping phase, and will continue throughout the duration of the project. All issues identified during this phase of the study will be documented within the Environmental Scoping Report (ESR). Thus, this ESR provides a record of all issues identified as well as any fatal flaws, in order to make recommendations regarding the project and further studies required to be undertaken within the EIA phase of the proposed project.
Details of the Environmental Assessment Practitioner 1.4The environmental team from Royal HaskoningDHV have been appointed by Sasol Chemical Industries (Pty) Ltd as the independent Environmental Assessment Practitioners (EAPs) to conduct the necessary studies to obtain an Environmental Authorisation and a Waste Management Licence for the proposed project.
The professional team of Royal HaskoningDHV have considerable experience in the environmental management and EIA fields. Royal HaskoningDHV has been involved in and/or managed several of the largest Environmental Impact Assessments undertaken in South Africa to date. A specialist area of focus is on the assessment of multi-faceted projects, including the establishment of linear developments (national and provincial roads, and power lines), bulk infrastructure and supply (e.g. wastewater treatment works, pipelines,

Page | 5
landfills), electricity generation and transmission, the mining industry, urban, rural and township developments, environmental aspects of Local Integrated Development Plans (LIDPs), as well as general environmental planning, development and management.
The particulars of the EAP are presented in Table 2 below.
Table 2: Details of the EAP
Details Consultant: Royal HaskoningDHV Contact Persons: Nicole Botham and Prashika Reddy Postal Address PO Box 25302, Monument Park, 0105 Telephone: 012 367 5800 Facsimile: 012 367 5878 E-mail: [email protected] / [email protected] Expertise: Ms Botham is an Environmental Consultant with seven years experience in
the mining sector, having undertaken work in Africa, Europe, Middle East, USA and Fiji. She has focussed on management plan preparation, mine decommissioning (closure) and audits of mine investments. Areas of expertise include: Scoping Reports, Environmental Impact Assessment (EIA), Environmental Management Reports, Environmental Audits, and Baseline Studies. Key project experience includes: Sol Plaatje Municipality, Trekkopje Mine, Tshipi è ntle Mine, Bon Accord Mine, Wonderfontein Mine, Manganese mine in Burkina Faso, Vatukoula Gold Mine, Northland Mine, Antimony Process Plant in Oman, and a Biofuels project in Mozambique. Ms Reddy is a Principal Associate / Senior Environmental Scientist (Pr Sci Nat 400133/10) with a BSc Honours in Geography and Botany. Ms Reddy has the necessary experience in various environmental fields including: environmental impact assessments, environmental management plans/programmes, public participation and environmental monitoring and auditing. Ms Reddy has extensive experience in compiling environmental reports (Screening, Scoping, EIA and Status Quo Reports). Ms Reddy is/has been part of numerous multi-faceted large–scale projects, including the establishment of linear developments (roads, and power lines); industrial plants; electricity generation plants and mining-related projects.
Page | 6
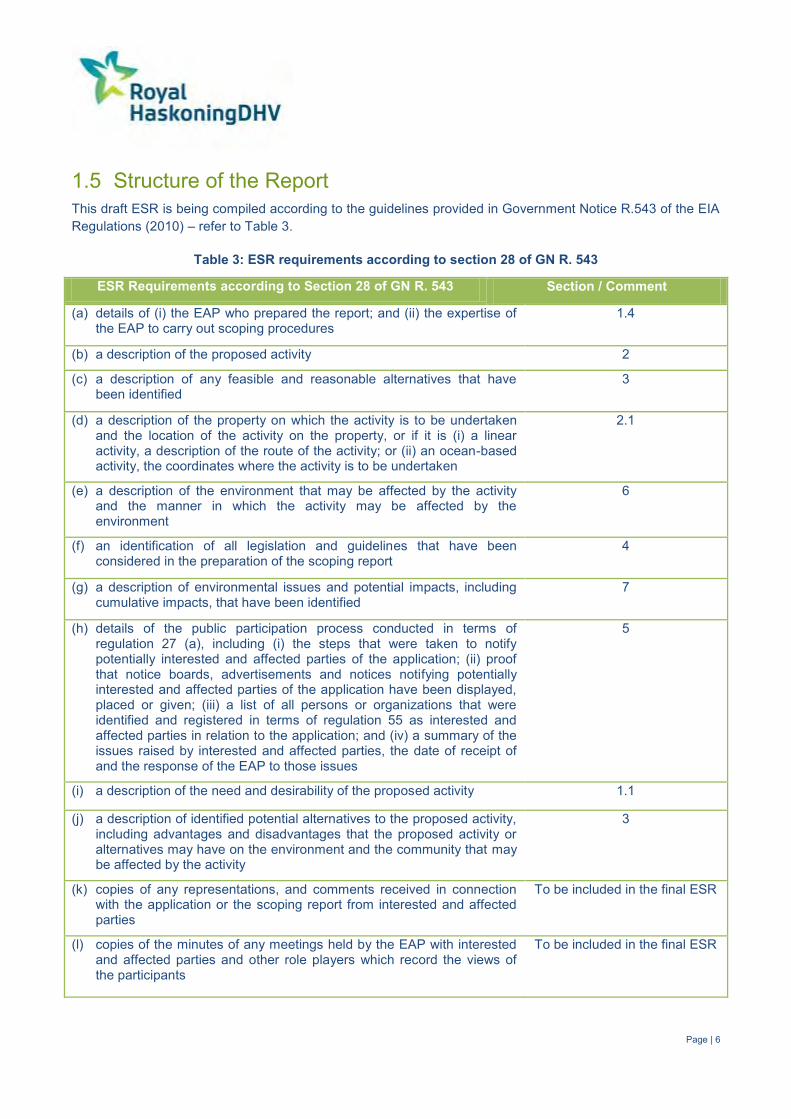
Structure of the Report 1.5This draft ESR is being compiled according to the guidelines provided in Government Notice R.543 of the EIA Regulations (2010) – refer to Table 3.
Table 3: ESR requirements according to section 28 of GN R. 543
ESR Requirements according to Section 28 of GN R. 543 Section / Comment
(a) details of (i) the EAP who prepared the report; and (ii) the expertise of the EAP to carry out scoping procedures
1.4
(b) a description of the proposed activity 2
(c) a description of any feasible and reasonable alternatives that have been identified
3
(d) a description of the property on which the activity is to be undertaken and the location of the activity on the property, or if it is (i) a linear activity, a description of the route of the activity; or (ii) an ocean-based activity, the coordinates where the activity is to be undertaken
2.1
(e) a description of the environment that may be affected by the activity and the manner in which the activity may be affected by the environment
6
(f) an identification of all legislation and guidelines that have been considered in the preparation of the scoping report
4
(g) a description of environmental issues and potential impacts, including cumulative impacts, that have been identified
7
(h) details of the public participation process conducted in terms of regulation 27 (a), including (i) the steps that were taken to notify potentially interested and affected parties of the application; (ii) proof that notice boards, advertisements and notices notifying potentially interested and affected parties of the application have been displayed, placed or given; (iii) a list of all persons or organizations that were identified and registered in terms of regulation 55 as interested and affected parties in relation to the application; and (iv) a summary of the issues raised by interested and affected parties, the date of receipt of and the response of the EAP to those issues
5
(i) a description of the need and desirability of the proposed activity 1.1
(j) a description of identified potential alternatives to the proposed activity, including advantages and disadvantages that the proposed activity or alternatives may have on the environment and the community that may be affected by the activity
3
(k) copies of any representations, and comments received in connection with the application or the scoping report from interested and affected parties
To be included in the final ESR
(l) copies of the minutes of any meetings held by the EAP with interested and affected parties and other role players which record the views of the participants
To be included in the final ESR

Page | 7
ESR Requirements according to Section 28 of GN R. 543 Section / Comment
(m) any responses by the EAP to those representations and comments and views
To be included in the final ESR
(n) a plan of study for environmental impact assessment which sets out the proposed approach to the environmental impact assessment of the application, which must include (i) a description of the tasks that will be undertaken as part of the environmental impact assessment process, including any specialist reports or specialised processes, and the manner in which such tasks will be undertaken (ii) an indication of the stages at which the competent authority will be consulted (iii) a description of the proposed method of assessing the environmental issues and alternatives, including the option of not proceeding with the activity; and (iv) particulars of the public participation process that will be conducted during the environmental impact assessment process
9
(o) any specific information required by the competent authority; and NA
(p) any other matters required in terms of sections 24(4)(a) and (b) of the Act
NA
Page | 8
2 PROJECT DESCRIPTION Project Location 2.1
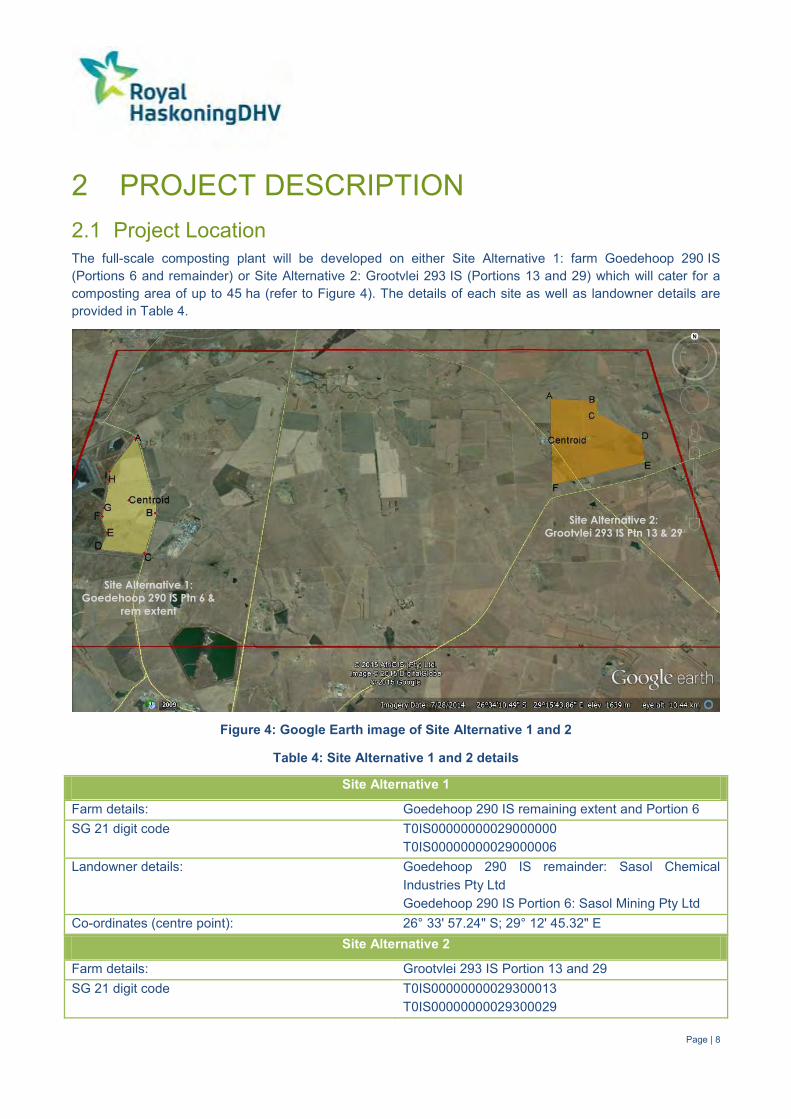
The full-scale composting plant will be developed on either Site Alternative 1: farm Goedehoop 290 IS (Portions 6 and remainder) or Site Alternative 2: Grootvlei 293 IS (Portions 13 and 29) which will cater for a composting area of up to 45 ha (refer to Figure 4). The details of each site as well as landowner details are provided in Table 4.
Figure 4: Google Earth image of Site Alternative 1 and 2
Table 4: Site Alternative 1 and 2 details
Site Alternative 1
Farm details: Goedehoop 290 IS remaining extent and Portion 6 SG 21 digit code T0IS00000000029000000
T0IS00000000029000006 Landowner details: Goedehoop 290 IS remainder: Sasol Chemical
Industries Pty Ltd Goedehoop 290 IS Portion 6: Sasol Mining Pty Ltd
Co-ordinates (centre point): 26° 33' 57.24" S; 29° 12' 45.32" E Site Alternative 2
Farm details: Grootvlei 293 IS Portion 13 and 29 SG 21 digit code T0IS00000000029300013
T0IS00000000029300029
Site Alternative 1:
Goedehoop 290 IS Ptn 6 &
rem extent
Site Alternative 2:
Grootvlei 293 IS Ptn 13 & 29

Page | 9
Site Alternative 2
Landowner details Sasol Mining Pty Ltd for both portions Co-ordinates (centre point) 26° 33' 11.25" S; 29° 18' 1.21" E
Composting Process Description 2.2The Sasol Secunda Operations generates various sludge streams including Biosludge, API sludge, Process cooling tower sludge, WRF sludge and Process water dam sludge that range from Type 0 – 4 (classification according to GN R.635: National Norms and Standards for the Assessment of Waste for Landfill design and GN R.636: National Norms and Standards for Disposal of Waste to Landfill). The origin and current disposal methods of these streams are presented in Table 5.
It is proposed that these streams as well as future streams that will be similar in profile to the current waste streams (ranging from Type 0 – 4) generated at the Sasol Secunda Operations will be treated at the full-scale composting plant.
Table 5: Sludge streams produced at the Sasol Secunda Operations and current disposal methods
Waste Sludge Streams Origin Current disposal methods
Biosludge Sludge from the Water Recovery basins
The Waste Recycling Facility (WRF) treats the wastewater from the factory
Incinerated on-site
Process water dam sludge Sludge from the process water dams Not yet disposed of
API dam sludge The oily water sewer system for the factory feeds to the API system
After oil/water separation, the water goes to the API dams
Ash blended and disposed of on coarse ash heaps on-site
Process Cooling Tower sludge
Sludge from the cooling towers Third party disposal (landfill)
WRF biosludge The WRF (Waste Recycling Facility) treats streams from various sources in the factory. This process produces a sludge that needs to be disposed of
Third party disposal (landfill)
Page | 10
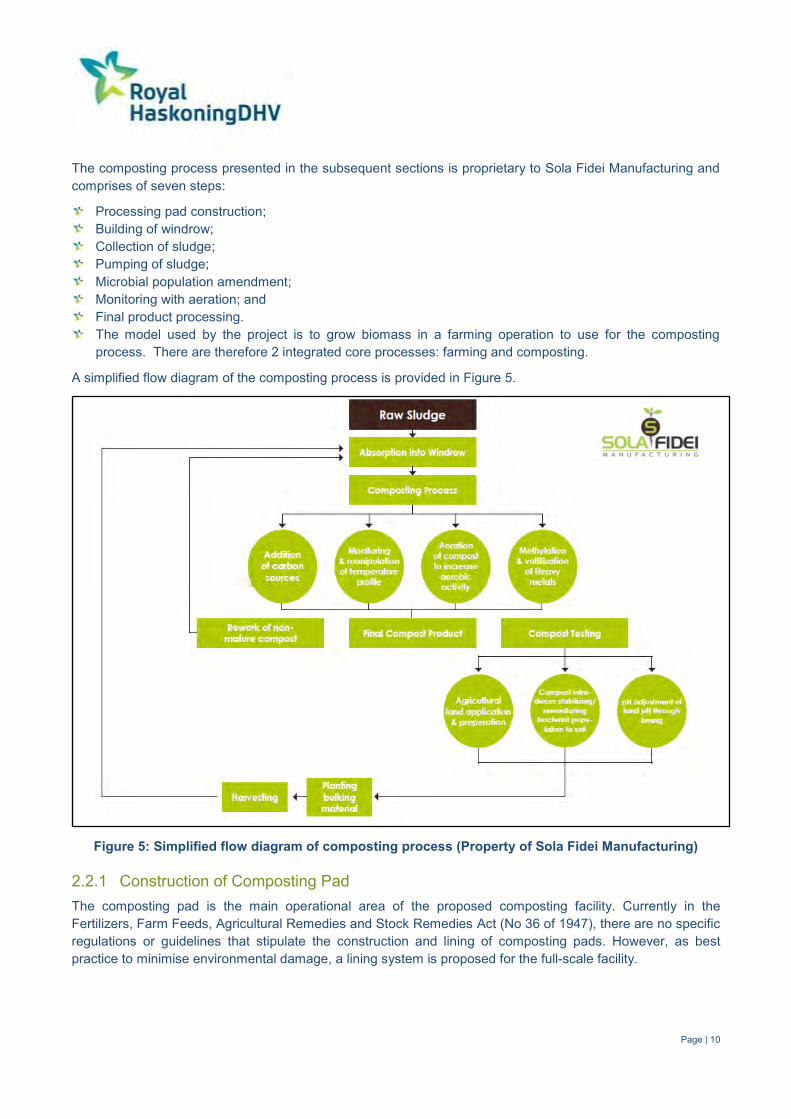
The composting process presented in the subsequent sections is proprietary to Sola Fidei Manufacturing and comprises of seven steps:
Processing pad construction; Building of windrow; Collection of sludge; Pumping of sludge; Microbial population amendment; Monitoring with aeration; and Final product processing. The model used by the project is to grow biomass in a farming operation to use for the composting
process. There are therefore 2 integrated core processes: farming and composting.
A simplified flow diagram of the composting process is provided in Figure 5.
Figure 5: Simplified flow diagram of composting process (Property of Sola Fidei Manufacturing)
Construction of Composting Pad 2.2.1The composting pad is the main operational area of the proposed composting facility. Currently in the Fertilizers, Farm Feeds, Agricultural Remedies and Stock Remedies Act (No 36 of 1947), there are no specific regulations or guidelines that stipulate the construction and lining of composting pads. However, as best practice to minimise environmental damage, a lining system is proposed for the full-scale facility.

Page | 11
The following layers are proposed for the lining system:
1. Windrow layer (250 mm minimum) – The windrow layer is the initial barrier to prevent sludge seepage.
2. The absorption/aeration layer (400 mm) – This layer is situated directly below the windrow layer. An absorption/aeration material is used as a barrier to ensure that any sludge spills or leaching are captured.
3. Soil layer (100 mm minimum) – The soil layer (usually river sand) is situated on top of the plastic layer in order to protect the layer against forces exerted from above.
4. Plastic layer (500 – 2500 micron) – The plastic layer channels any leachate or infiltrated surface water that reaches this layer down slope in to a drainage system which transports the water in to a collection dam.
5. Clay layer (200 mm minimum) – The clay layer is the last barrier which captures and channels any leachate that may penetrate the plastic layer.
The pads are designed and constructed on a slope in order to facilitate the gravitation of run-off water to central channels which will ultimately feed in to a central collection sump system. A closed loop system is used where the water in the dam system is reused as process water during composting.
Windrow Construction 2.2.2The windrows are constructed using cultivated biomass. Traditionally a windrow is a long row of biodegradable material which has a height of 1.5 m and a width of 3 m. For this project, the windrow design has been optimised by hollowing out the centre of the windrow which has a floor depth of 25 cm. This optimisation has allowed for the accommodation of greater volumes of industrial waste sludge per windrow which in turn increases effectiveness of the composting process by reducing the amount of bulking agent required for each volume of sludge processed. Each window bunker (refer to Figure 6) is designed to contain approximately 15 tons of sludge.
Figure 6: Windrow bunker
The windrows are also segmented with perpendicular strengthening walls that provide the windrow with superior strength and maintain the integrity of the windrow without affecting the volume of the sludge that can be processed.

Page | 12
Collection of Sludge 2.2.3A truck and tanker system is used for collection of the different sludge waste streams from the Secunda plant. The tanker contains 2500 ℓ of microbial population amendment, specific for the sludge being collected. The presence of the population amendment within the tanker prior to sludge collection ensures that the composting process commences as soon as the sludge is pumped into the tanker. The solids content of the sludge should be greater than 10% in order to ensure effective processing.
After collection the sludge is transported to the composting plant where it is then pumped into the windrow.
Pumping of sludge 2.2.4Upon arrival at the composting plant, the sludge in the tanker is pumped carefully into the windrow bunker (Figure 7) ensuring that the integrity of the windrow is maintained. During pumping, an aliquot of the sludge is extracted to use as a population conditioning agent for the microbial population amendment for the next windrow.
Figure 7: Pumping of sludge into windrow
Microbial Population Amendment 2.2.5The microbial population amendment (MPA) is a culture of bacteria and fungi that are able to bio-process a large number of contaminants found in the various sludge streams. The MPAs are uniquely created for each sludge type in order to target the specific problem elements present in the different sludges.
The MPAs are grown in a carbon-rich environment to which an aliquot of sludge has been added. This is done in order to condition the sludge and the sludge constituents during the growth of MPA as well as reduce the lag phase of decomposition and bio-transformation when the MPA is added to the sludge.
A total of 2.5 tons MPA is added to each batch of sludge (30 tons).

Page | 13
Temperature Monitoring and Aeration 2.2.6The windrow temperature is monitored daily (after the initial turning of the windrow) until completion of the process which takes between 12 – 20 weeks. Monitoring is essential to the process as the microbial population is temperature sensitive. This is one of the key differences from conventional composting process techniques where the temperature is held as high as possible for as long as possible.
An aerobic method of composting is employed which is a labour intensive and adds air to the windrow increasing microbial activity. Air is added through a process of windrow turning, which is done with a windrow turner (Figure 8). It is important that the windrow is turned often to ensure microbial activity remains high. By using an aerobic approach, no methane will be produced.
Figure 8: Windrow turning in order to aerate the compost
Final Product Processing 2.2.7After 12 to 20 weeks the compost reaches maturity. The maturity of the compost is determined using visual and olfactory senses as well as the temperature monitoring reports. The mature compost is degraded with limited organic material visible, and has a consistency of humus.
Page | 14
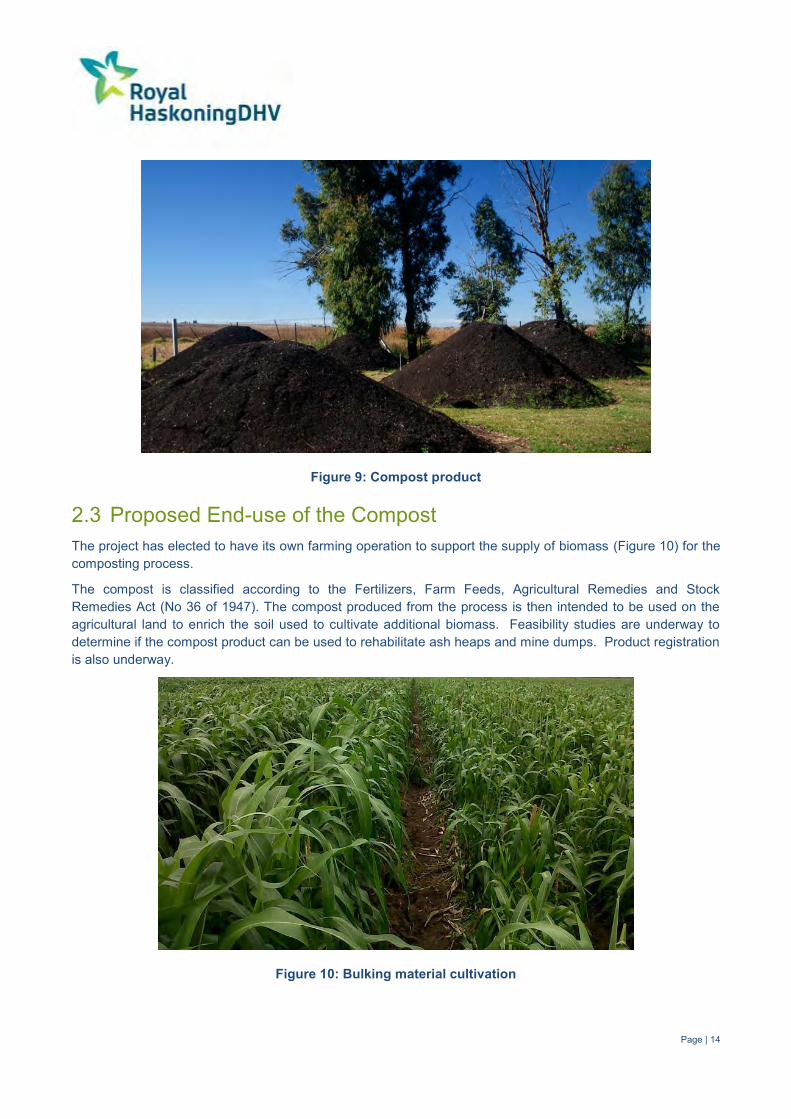
Figure 9: Compost product
Proposed End-use of the Compost 2.3The project has elected to have its own farming operation to support the supply of biomass (Figure 10) for the composting process.
The compost is classified according to the Fertilizers, Farm Feeds, Agricultural Remedies and Stock Remedies Act (No 36 of 1947). The compost produced from the process is then intended to be used on the agricultural land to enrich the soil used to cultivate additional biomass. Feasibility studies are underway to determine if the compost product can be used to rehabilitate ash heaps and mine dumps. Product registration is also underway.
Figure 10: Bulking material cultivation

Page | 15
3 PROJECT ALTERNATIVES In terms of the EIA Regulations, Section.28 (1) (c) feasible alternatives are required to be considered as part of the environmental investigations. In addition, the obligation that alternatives are investigated is also a requirement of Section 24(4) of the National Environmental Management Act (Act 107 of 1998) (as amended). An alternative in relation to a proposed activity refers to the different means of meeting the general purpose and requirements of the activity (as defined in Government Notice R.543 of the EIA Regulations, 2010), which may include alternatives to:
a) The property on which or location where it is proposed to undertake the activity;
b) The type of activity to be undertaken;
c) The design or layout of the activity;
d) The technology to be used in the activity;
e) The operational aspects of the activity; and
f) The option of not implementing the activity.
Do Nothing / No-Go Alternative 3.1Currently, the sludge streams produced at the Sasol Secunda Operations either undergo in-process recovery, thermal destruction at the U52/252 incinerators, treatment and/or disposal at landfills. With the stringent NEM: AQA Minimum Emissions Standards that have come in to effect in 2015, Sasol Chemical Industries (Pty) Ltd, would have to consider abatement technologies for existing incinerators (retrofitting) or install new incinerators, in order to reduce the current emissions.
Furthermore, with the promulgation of the NEM:WA Waste Classification and Management Regulations and Norms and Standards in 2013, very high risk waste types (i.e. Type 0) disposal at landfill in the untreated state is not allowed. The waste will need to be treated first and then re-tested to determine the risk profile for disposal. Furthermore landfilling has high costs associated with the disposal.
The Pilot project to date has also employed 25 people from the surrounding community, who have been trained in the composting process as well as farming activities.
Should the Status Quo remain, Sasol Chemical Industries (Pty) Ltd will have to consider the costs of retrofitting existing incinerators versus the installation of new incinerators as well the costs associated with landfilling. Furthermore, the job opportunities associated with the full-scale project (i.e. employment of a minimum of 150 people from the surrounding community) will not be realized.
Technology Alternatives 3.2Composting was identified as the main technology alternative to landfill disposal and incineration. The high-level comparison between composting, incineration and landfill disposal is presented in Table 6. Composting is the most environmentally sustainable and cost effective option compared to incineration or landfill disposal for the affected streams.

Page | 16
Table 6: Comparison of technology alternatives
Composting Incineration (no energy recovery)
Landfill
Overall cost (NPV) ++ +++ +++ Job creation +++ + +
Plot space requirements ++ + +++ Usable product
generated +++ - -
Overall Environmental sustainability
+++ - -
Energy consumption + ++ + Hazardous waste
Transport over long distances
+ - +++
Greenhouse Gas abatement
+ - -
Site Alternatives 3.3Currently, two site alternatives (refer to Figure 2) are under consideration for the full-scale composting plant:
Site Alternative 1 3.3.1
This site is located on the farm Goedehoop 290 IS (Portions 6 and remainder) and has an extent of approximately 173 ha. Site Alternative 1 is located on the western side of the road opposite the Pilot plant site.
Site Alternative 2 3.3.2
This site is located on the farm Grootvlei 293 IS (Portions 13 and 29) and has an extent of approximately 276 ha. Site Alternative 2 is approximately 9 km east of the Pilot plant site. Both site alternatives will be assessed during this Scoping Study, however only one site will be proposed for detailed assessment in the EIA Study. The positioning of the composting pad (approximately 45 ha) within the preferred site will also be further investigated in the EIA Study.

Page | 17
4 LEGAL REQUIREMENTS In order to protect the environment and ensure that this development is undertaken in an environmentally responsible manner, there are a number of significant pieces of environmental legislation that will need to be complied with. They include the following:
The Constitution of South Africa (No 108 of 1996) 4.1The Bill of Rights, in the Constitution of South Africa (No 108 of 1996), states that everyone has a right to a non-threatening environment and requires that reasonable measures be applied to protect the environment. This protection encompasses preventing pollution and promoting conservation and environmentally sustainable development. These principles are embraced in NEMA and given further expression.
National Environmental Management Act (No 107 of 1998) 4.2The National Environmental Management Act (No 107 of 1998) [NEMA] provides the overarching legislative framework for environmental governance in South Africa. Several Specific National Environmental Management Acts (SEMAs) have now been promulgated, all of which fall under the overarching NEMA (discussed below). The point of departure of NEMA is a set of National Environmental Management Principles that inform any subsequent environmental legislation, implementation of that legislation and formulation and implementation of environmental management plans at all levels of government.
NEMA gives expression to the Bill of Rights, within the Constitution of South Africa (No 108 of 1996), which states that everyone has a right to a non-threatening (safe and healthy) environment and requires that reasonable measures are applied to protect the environment. This protection encompasses preventing pollution and promoting conservation and environmentally sustainable development. These principles are embraced in NEMA and given further expression.
In June 2010, the EIA Regulations were promulgated in order to revise the procedure and criteria relating to environmental authorisations for the commencement of activities in order to avoid detrimental impacts on the environment or, where it cannot be avoided, to mitigate and effectively manage these impacts and optimise positive environmental impacts. These Regulations and a revised set of Listed Activities (Listing Notices 1, 2 and 3) came into force on 02 August 2010.
The new EIA Regulations were promulgated in December 2014, however, the application for a Waste Management Licence (WML) and Environmental Authorisation preceded these new Regulations, hence this study is being executed under the 2010 EIA Regulations.
The listed activities applicable to the project are listed in Table 7 below.
Table 7: Listed activities according to Listing Notice 1 and 2 of the EIA Regulations (2010)
Listing Notice Description Applicability
Listing Notice 1 (GN R.544) Activity 37
The expansion of facilities or infrastructure for the bulk transportation of water, sewage or storm water where:
(a) the facility or infrastructure is expanded by more than 1,000 m in length; or
(b) where the throughput capacity of the facility or infrastructure will be increased by 10% or more – excluding where such expansion: (i) relates to transportation of water, sewage
There may be a potential for the expansion of domestic water pipelines to supply water to the full-scale plant.
Page | 18
Listing Notice Description Applicability
or stormwater within a road reserve; or (ii) where such expansion will occur within
urban areas but further than 32 m from a watercourse, measured from the edge of the watercourse.
Listing Notice 1 (GN R.544) Activity 56
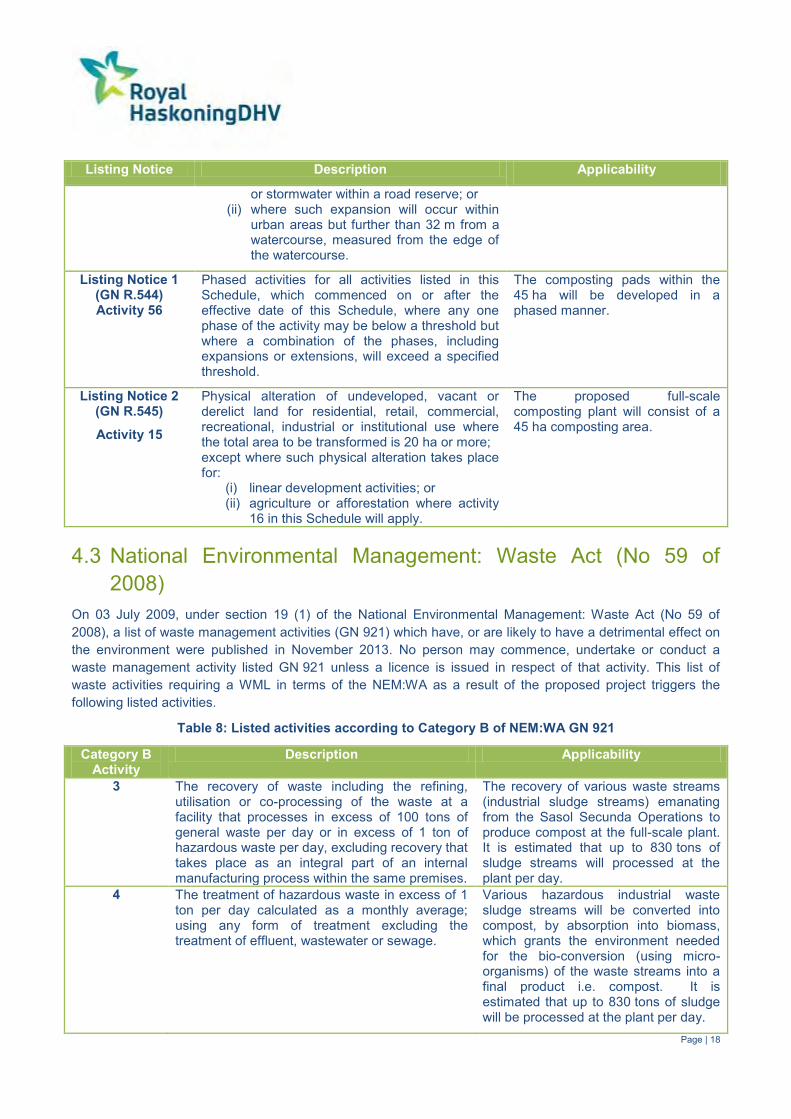
Phased activities for all activities listed in this Schedule, which commenced on or after the effective date of this Schedule, where any one phase of the activity may be below a threshold but where a combination of the phases, including expansions or extensions, will exceed a specified threshold.
The composting pads within the 45 ha will be developed in a phased manner.
Listing Notice 2 (GN R.545)
Activity 15
Physical alteration of undeveloped, vacant or derelict land for residential, retail, commercial, recreational, industrial or institutional use where the total area to be transformed is 20 ha or more; except where such physical alteration takes place for:
(i) linear development activities; or (ii) agriculture or afforestation where activity
16 in this Schedule will apply.
The proposed full-scale composting plant will consist of a 45 ha composting area.
National Environmental Management: Waste Act (No 59 of 4.32008)
On 03 July 2009, under section 19 (1) of the National Environmental Management: Waste Act (No 59 of 2008), a list of waste management activities (GN 921) which have, or are likely to have a detrimental effect on the environment were published in November 2013. No person may commence, undertake or conduct a waste management activity listed GN 921 unless a licence is issued in respect of that activity. This list of waste activities requiring a WML in terms of the NEM:WA as a result of the proposed project triggers the following listed activities.
Table 8: Listed activities according to Category B of NEM:WA GN 921
Category B Activity
Description Applicability
3 The recovery of waste including the refining, utilisation or co-processing of the waste at a facility that processes in excess of 100 tons of general waste per day or in excess of 1 ton of hazardous waste per day, excluding recovery that takes place as an integral part of an internal manufacturing process within the same premises.
The recovery of various waste streams (industrial sludge streams) emanating from the Sasol Secunda Operations to produce compost at the full-scale plant. It is estimated that up to 830 tons of sludge streams will processed at the plant per day.
4 The treatment of hazardous waste in excess of 1 ton per day calculated as a monthly average; using any form of treatment excluding the treatment of effluent, wastewater or sewage.
Various hazardous industrial waste sludge streams will be converted into compost, by absorption into biomass, which grants the environment needed for the bio-conversion (using micro-organisms) of the waste streams into a final product i.e. compost. It is estimated that up to 830 tons of sludge will be processed at the plant per day.

Page | 19
Category B Activity
Description Applicability
10 The construction of a facility for a waste management activity listed in Category B of this schedule (not in isolation as associated waste management activity).
The construction of the composting facility up to approximately 45 ha in size that consists of lined composting pads as well as the associated stormwater control measures.
National Environmental Management Act: Air Quality Act (No 39 4.4of 2004)
The National Environmental Management (NEM): Air Quality Act (No 39 of 2004) has shifted the approach of air quality management from source-based control to receptor-based control. The main objectives of the Act are to:
Give effect to everyone’s right ‘to an environment that is not harmful to their health and well-being’. Protect the environment by providing reasonable legislative and other measures that (i) prevent pollution
and ecological degradation, (ii) promote conservation and (iii) secure ecologically sustainable development and use of natural resources while promoting justifiable economic and social development.
The NEM:AQA makes provision for the setting and formulation of national ambient air quality standards for ‘substances or mixtures of substances which present a threat to health, well-being or the environment’. More stringent standards can be established at the provincial and local levels.
The control and management of emissions in the NEM:AQA relates to the listing of activities that are sources of emission and the issuing of emission licences. Listed activities are defined as activities which ‘result in atmospheric emissions and are regarded as having a significant detrimental effect on the environment, including human health’. Listed activities have been identified by the Minister of the Department of Environmental Affairs and atmospheric emission standards have been established for each of these activities. These listed activities now require an Atmospheric Emission Licence (AEL) to operate. The issuing of emission licences for Listed Activities is the responsibility of the Metropolitan and District Municipalities.
In addition, the Minister may declare any substance contributing to air pollution as a priority pollutant. Any industries or industrial sectors that emit these priority pollutants will be required to implement a Pollution Prevention Plan. Municipalities are required to ‘designate an air quality officer to be responsible for co-ordinating matters pertaining to air quality management in the Municipality’. The appointed Air Quality Officer is responsible for the issuing of atmospheric emission licences.
National Ambient Air Quality Standards (No 1210 of 2009) 4.4.1Air quality guidelines and standards are fundamental to effective air quality management, providing the link between the source of atmospheric emissions and the user of that air at the downstream receptor site. The ambient air quality guideline values indicate safe daily exposure levels for the majority of the population, including the very young and the elderly, throughout an individual’s lifetime. Air quality guidelines and standards are normally given for specific averaging periods. These averaging periods refer to the time-span over which the air concentration of the pollutant was monitored at a location. Generally, five averaging periods are applicable, namely an instantaneous peak, 1-hour average, 24-hour average, 1-month average, and annual average.
The Department of Environmental Affairs in 2009 issued the National Ambient Air Quality Standards for criteria pollutants which are commonly emitted, i.e. SO2, NO2, Pb, PM10, Benzene and CO.
Page | 20
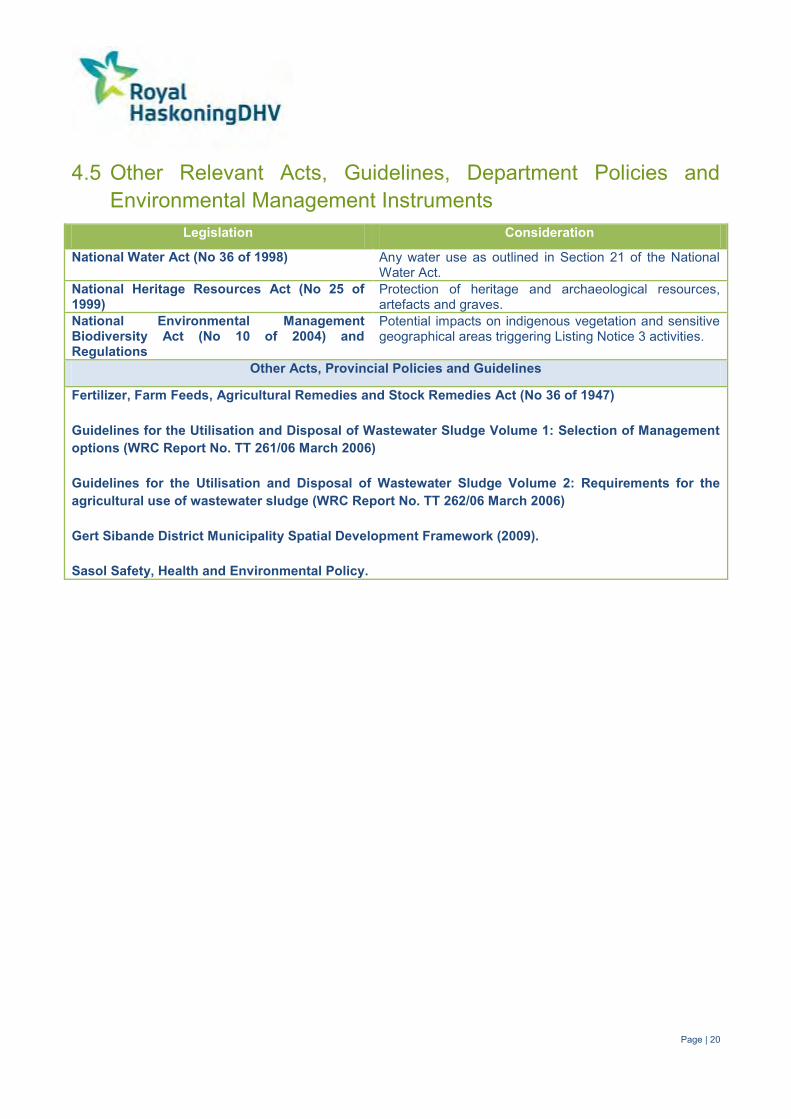
Other Relevant Acts, Guidelines, Department Policies and 4.5Environmental Management Instruments
Legislation Consideration
National Water Act (No 36 of 1998) Any water use as outlined in Section 21 of the National Water Act.
National Heritage Resources Act (No 25 of 1999)
Protection of heritage and archaeological resources, artefacts and graves.
National Environmental Management Biodiversity Act (No 10 of 2004) and Regulations
Potential impacts on indigenous vegetation and sensitive geographical areas triggering Listing Notice 3 activities.
Other Acts, Provincial Policies and Guidelines
Fertilizer, Farm Feeds, Agricultural Remedies and Stock Remedies Act (No 36 of 1947) Guidelines for the Utilisation and Disposal of Wastewater Sludge Volume 1: Selection of Management options (WRC Report No. TT 261/06 March 2006) Guidelines for the Utilisation and Disposal of Wastewater Sludge Volume 2: Requirements for the agricultural use of wastewater sludge (WRC Report No. TT 262/06 March 2006) Gert Sibande District Municipality Spatial Development Framework (2009). Sasol Safety, Health and Environmental Policy.

Page | 21
5 PUBLIC PARTICIPATION One of the general objectives of integrated environmental management laid down in Section 23(2)(d) of NEMA is to “ensure adequate and appropriate opportunity for public participation in decisions that may affect the environment”. An inadequate and non-transparent Public Participation Process (PPP) has the potential to provide a negative decision and perception regarding the proposed project.
The EIA Regulations (2010) places a lot of emphasis on the public participation process and have been revised to contain comprehensive guidelines to involve the public in the EIA study.
The primary aims of the public participation process include:
Meaningful and timeous participation of Interested and Affected Parties (I&APs); Identification of issues and concerns of key stakeholders and I&APs with regards to the proposed
development, i.e. focus on important issues; Promotion of transparency and an understanding of the proposed project and its potential environmental
(social and biophysical) impacts; Accountability for information used for decision-making; Serving as a structure for liaison and communication with I&APs; Assisting in identifying potential environmental (social and biophysical) impacts associated with the
proposed development; and Inclusivity (the needs, interests and values of I&APs must be considered in the decision-making process).
The minimum requirements for public participation as contained in Chapter 6 of the EIA Regulations (2010) are contained hereunder and are discussed in detail in subsequent sections:
Public Participation Requirements according to Section 54 - 57 of GN R.543
Specific Actions to Ensure Compliance
Section 54 (2) (b) – The person conducting a public participation process must give written notice to the owner or person in control of that land if the owner is not the owner or person in control of the land; owners and occupiers of land adjacent to the site municipal councilor; municipality; organ of state having jurisdiction and any other party required by the competent authority
Compile introductory letters to owners, adjacent landowners, municipal councilor, municipality and organ of state
Section 54 (2) (a) – Fix a notice board at the site boundary or any alternative site applicable to the application
The notice board accordingly must – (a) give details of the application subject to public
participation (b) state –
i. that the application has been submitted to the CA ii. whether basic assessment or scoping procedures
are being applied for iii. the nature and location of the activity to which the
application relates iv. where further information on the application or
activity can be obtained v. the manner in which and the person to whom
representation in respect of the application may be made
The notice board must be – (a) Of a size of at least 60 cm by 42 cm (b) Display the required information in lettering and format
Section 54 (2) (c) & (d) – Place an advert in one local newspaper or official Gazette and or placing an advertisement in at least one provincial newspaper or national newspaper, if the activity has or may have an
An advert will be placed in the local newspaper/s and any other paper decided by the applicant to advertise the availability of the draft ESR and EIAR for review and public meetings as well advertising the environmental authorisation

Page | 22
Public Participation Requirements according to Section 54 - 57 of GN R.543
Specific Actions to Ensure Compliance
impact that extends beyond the boundaries of the metropolitan or local municipality Section 55 (1) – An EAP managing a application must open and maintain a register which contains the names, contact details and addresses of – (a) All persons who as a consequence of the PPP
have submitted written comments or attended meetings
(b) All persons after completion of the PPP have requested in writing their names to be placed on a register
(c) All organs of state which have jurisdiction in respect of the application
Comprehensive I&AP database/register will be opened and maintained
Section 56 (1) a registered interested and affected party (I&AP) is entitled to comment, in writing, on all written submissions; including draft reports made to the CA within the timeframes that have been set by the CA or any extension of a timeframe agreed to by the EAP or applicant
According to Section 56 (8) a timeframe of 40 days is provided to I&APs for comments on draft and final reports
Section 56 (5) Registered I&APs must submit comments on draft reports to the EAP
According to Section 56 (8) a timeframe of 40 days is provided to I&APs for comments on draft reports. All issues will be recorded in a Comments and Response Report
Section 56 (6) Comments on final reports must be provided to the CA and a copy provided to the EAP
A timeframe of 21 days is provided for registered I&APs to comment on the final reports. All comments must be forwarded to the CA and a copy furnished to the EAP
Section 57 (1) The EAP must ensure that the comments of I&APs are recorded in reports and written comments including record of meetings are attached to the report submitted to the CA
Compilation of Issues Trail/Comments and Responses Report that will form part of final reports
Identification of Interested and Affected Parties 5.1I&APs were identified primarily through an existing database as well as from responses received from the site notices and adverts placed for the project. Letters were sent to key stakeholders and other I&APs on the existing database, informing them of the application process and indicating how they could become involved in the project. The contact details of all identified I&APs are updated on the project database, which is included in Appendix B1.
This database will be updated on an on-going basis throughout the EIA process.
Briefing Paper 5.2A briefing paper or Background Information Document (BID) for the project was compiled in English, Afrikaans and Zulu (refer to Appendix B2). The aim of this document is to provide a brief outline of the application and the nature of the development. It is also aimed at providing preliminary details regarding the EIA process, and explains how I&APs could become involved in the project. The briefing paper was distributed to all identified I&APs and stakeholders, together with a registration/comment sheet inviting I&APs to submit details of any issues, concerns or inputs they might have with regards to the project.
Issues Trail 5.3Issues and concerns raised in the public participation process during the EIA process will be compiled into an Issues Trail. The ESS-phase Issues Trail will be included into the final ESR, in which all comments and responses will be captured.

Page | 23
Consultation with Competent Authorities 5.4The competent authorities issuing decisions regarding the project as well as consultation to date are presented in Table 9 below.
Table 9: Competent authorities associated with the project
Authority Role Licence / Approval Consultation to date
Department of Environmental Affairs (DEA)
Competent Authority for waste licencing process
Waste Management Licence
Acceptance of waste licence application form received on 15 December 2014 (Appendix C)
Mpumalanga Department of Agriculture, Rural Development, Land and Environmental Affairs (MDARDLEA)
Competent Authority for Environmental Authorisation process
Environmental Authorisation
Acceptance of Environmental Authorisation application received on 24 November 2014 (Appendix C).
Consultation with Other Relevant Stakeholders 5.5Consultation with other relevant key stakeholders will be undertaken through telephone calls and written correspondence in order to actively engage these stakeholders from the outset and to provide background information about the project during the ESS. A list of these stakeholders is provided in Appendix B1.
Advertising 5.6In compliance with the EIA Regulations (2010), notification of the commencement of the EIA process for the project was advertised in English, Afrikaans and Zulu in the two local newspapers, namely the Ridge Times and Echo News on 13 March 2015 (Appendix B3). I&APs were requested to register their interest in the project and become involved in the EIA process. The primary aim of these advertisements was to ensure that the widest group of I&APs possible was informed and invited to provide input and questions and comments on the project.
In addition to advertisements, A2 size site notices in English, Afrikaans and Zulu were placed at the following public places advertising the EIA process for the project:
Charlie One - Main gate to Sasol Secunda Complex; Secunda Municipal Library; Site Alternative 1 - Goedehoop; and Site Alternative 2 - Grootvlei.
Photos of the site notices placed at the various places are included in Appendix B4.
Public and Authority Review of the Draft Scoping Report 5.7An advert will be placed in the Ridge Times and Echo News informing I&APs of the availability of the draft ESR and Plan of Study for EIA for review and comment as well as the details of the public meeting. The Echo News and Ridge Times are free weekly community newspapers. The advert will appear in both newspapers

Page | 24
between 30 April and 01 May 2015. Additionally, all registered I&APs will be notified of the availability of the report in writing.
The draft ESR, together with the Plan of Study for EIA will be made available for authority and public review for a total of 40 calendar days from 05 May 2015 to 15 June 2015 In addition, the report will also be made available at the following public locations (which are all readily accessible to I&APs) within the study area:
Secunda Municipal Library; Sasol Technology Library; Embalenhle Municipal Library; Offices of Royal HaskoningDHV (78 Kalkoen Street, Monument Park, Pretoria); and Royal HaskoningDHV website (http://www.rhdhv.co.za/pages/services/environmental/current-
projects.php).
The draft ESR will be submitted simultaneously to the DEA and MDARDLEA for comment.
Final Environmental Scoping Report 5.8The final stage in the ESS process will entail the capturing of responses and comments from I&APs on the draft ESR in order to refine the ESR, and ensure that all issues of significance are addressed. The final Environmental Scoping Report will be submitted to DEA and MDARDLEA for review and decision-making.
Page | 25
6 DESCRIPTION OF STUDY AREA Geology and Topography 6.1
The two site alternatives (Geodehoop and Grootvlei) are underlain by the Vryheid Formation of the Ecca Group forming part of the Karoo Supergroup. The Vryheid Formation consists of sandstone, shale and coal beds.
The Goedehoop and Grootvlei sites are located on the Highveld plateau, with generally undulating slopes of between 0 and 3%. For the Goedehoop site, altitude is between 1590 and 1630 m above sea level and no major rivers occur in the area, although small tributary streams occur, flowing northward towards the Klipspruit.
The Grootvlei site has steeper slopes, between 5 and 10% in the central portion with an altitude between 1550 and 1650 m above sea level. No major rivers occur in this area, although smaller tributary streams occur, flowing northward towards the Vlakspruit and Klipspruit.
Land Use 6.2Both sites are surrounded by a number of different land uses i.e. industrial, commercial and agricultural. Due to the highly industrialised nature of the area there is extensive infrastructural development including an extensive road network.
Goedehoop site
The Goedehoop site is located approximately 4.5 km south of Secunda and adjacent to the pilot plant. The site is mainly used for agricultural purposes where large areas of the vegetation on the site have been transformed during previous and current agricultural activities. The majority of the site has been annually ploughed and planted with various crops ranging from maize to soya beans (currently being cultivated). Extensive cattle grazing activities have taken place along the valley bottom wetland and moist grassland.
The area west of the site is utilised by Sasol Mining as part of their mining operations (mine and mine tailings dam facility).
Grootvlei site
The Grootvlei site is located approximately 11.5 km south-east of Secunda. Large areas of the vegetation on the site have been transformed during previous agricultural and mining activities. The clay soils are often not ploughed, and mostly utilised for grazing by cattle and sheep. The site is currently utilised for maize cultivation.
Old borrow pits occur on the site as well as road tracks and mine conveyor belt system.
Soils and Agricultural Potential 6.3Both the Goedehoop and Grootvlei sites fall within land type Ea17. The prevailing soils are dark clays, usually with shrink-swell properties, often with a grey clay subsoil, grading into underlying weathering rock. The characteristics of the most dominant soils of the specific land type Ea17 are given in Table 10.
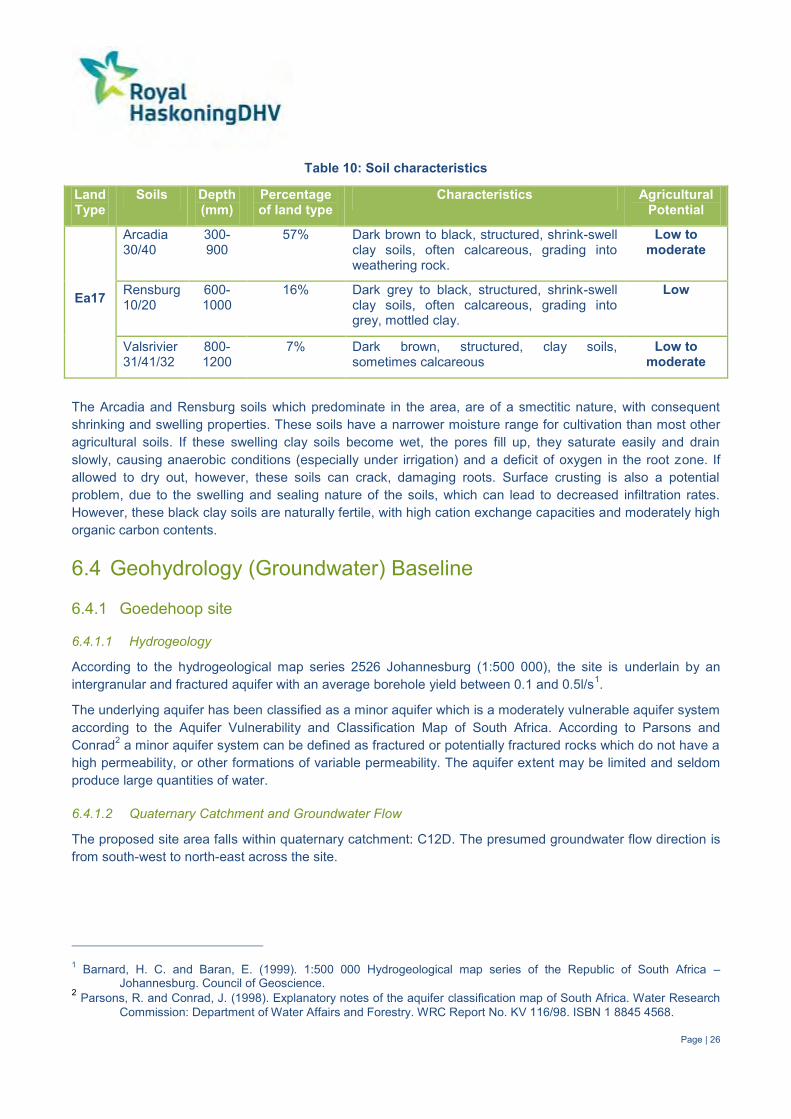
Page | 26
Table 10: Soil characteristics
Land Type
Soils Depth (mm)
Percentage of land type
Characteristics Agricultural Potential
Ea17
Arcadia 30/40
300-900
57% Dark brown to black, structured, shrink-swell clay soils, often calcareous, grading into weathering rock.
Low to moderate
Rensburg 10/20
600-1000
16% Dark grey to black, structured, shrink-swell clay soils, often calcareous, grading into grey, mottled clay.
Low
Valsrivier 31/41/32
800-1200
7% Dark brown, structured, clay soils, sometimes calcareous
Low to moderate
The Arcadia and Rensburg soils which predominate in the area, are of a smectitic nature, with consequent shrinking and swelling properties. These soils have a narrower moisture range for cultivation than most other agricultural soils. If these swelling clay soils become wet, the pores fill up, they saturate easily and drain slowly, causing anaerobic conditions (especially under irrigation) and a deficit of oxygen in the root zone. If allowed to dry out, however, these soils can crack, damaging roots. Surface crusting is also a potential problem, due to the swelling and sealing nature of the soils, which can lead to decreased infiltration rates. However, these black clay soils are naturally fertile, with high cation exchange capacities and moderately high organic carbon contents.
Geohydrology (Groundwater) Baseline 6.4
Goedehoop site 6.4.1
6.4.1.1 Hydrogeology
According to the hydrogeological map series 2526 Johannesburg (1:500 000), the site is underlain by an intergranular and fractured aquifer with an average borehole yield between 0.1 and 0.5l/s1.
The underlying aquifer has been classified as a minor aquifer which is a moderately vulnerable aquifer system according to the Aquifer Vulnerability and Classification Map of South Africa. According to Parsons and Conrad2 a minor aquifer system can be defined as fractured or potentially fractured rocks which do not have a high permeability, or other formations of variable permeability. The aquifer extent may be limited and seldom produce large quantities of water.
6.4.1.2 Quaternary Catchment and Groundwater Flow
The proposed site area falls within quaternary catchment: C12D. The presumed groundwater flow direction is from south-west to north-east across the site.
1 Barnard, H. C. and Baran, E. (1999). 1:500 000 Hydrogeological map series of the Republic of South Africa –
Johannesburg. Council of Geoscience. 2 Parsons, R. and Conrad, J. (1998). Explanatory notes of the aquifer classification map of South Africa. Water Research
Commission: Department of Water Affairs and Forestry. WRC Report No. KV 116/98. ISBN 1 8845 4568.

Page | 27
6.4.1.3 Hydrocensus
Three (3) boreholes (HBH1; 2 and 3) were identified on the site (Figure 9, Table 11). HBH1 is located up-gradient, 2.6 km south of the site and used to supply cattle with water. HBH2 is also located up-gradient of the site, 200 m south of the southern boundary of the site and is a Sasol monitoring well. A groundwater level of 7 mbgl was recorded in HBH2. HBH3 is not is use and located 2 km east, up-gradient of the site.
Figure 11: Goedehoop hydrocensus map
Table 11: Goedehoop hydrocensus borehole information
ID Co-ordinates, WGS 84
Geographic
S E
Depth (mbgl)
SWL (mbgl) Use Pump type Abstraction
(l/day) Comments
HBH1* 26.599964 29.216755 80 Not accessible
Used for cattle Submersible 10000 Clear water
HBH2* 26.576333 29.207939 Unknown 7 Monitoring
well None None Bad odour
HBH3 26.599964 29.216755 80 Not accessible
Used for cattle Submersible 10000 Clear water
*Water samples collected.

Page | 28
6.4.1.4 Groundwater Quality
During the hydrocensus, the pH, electrical conductivity (EC), Total Dissolved Solids (TDS), temperature, oxidation-reduction potential (ORP) and dissolved oxygen (DO) were measured. The pH, EC and TDS readings were all compliant with the SANS 241-1:2011 Drinking Water Standards. Positive DO and ORP values were obtained, that are indicative of an oxygen rich environment (Table 12). An elevated photoionisation detector (PID) reading of 371 ppm was detected in HBH2.
Table 12: Goedehoop hydrocensus borehole field results
Name pH EC (mS/m) TDS (mg/l) PID (ppm) ORP (mV) DO (mg/l)
HBH1 7.29 151.1 778 0 149 0.01
HBH2 7.1 94.1 665 371.1 96 0.07
6.4.1.5 Soil Analysis
Soil samples were collected from soil augers AH1, AH2 and AH3. The results obtained from the laboratory were compared against the soil screening values (SSV) as published in the National Norms and Standards for the Remediation of Contaminated Land and Soil Quality in the Republic of South Africa under section 7(2)(d) read with section 73(1)(a) of the National Environmental Management: Waste Act, 2008 (No 59 of 2008). No Total Petroleum Hydrocarbons, BTEXN, MTBE or TAME were detected in the soil samples.
According to the soil chemical results, the metal and anion concentrations were compliant in sample AH1. AH2 indicated manganese and vanadium which exceeded the SSV1 standard. AH3 indicated non-compliance for copper, manganese, nickel and lead.
6.4.1.6 Groundwater Analysis
No BTEXN, trimethylbenzene, MTBE or TAME were detected in the groundwater samples collected from AH3, HBH1 and HBH2. TPH (C10-C40) was detected in the water sample from auger hole AH3 and hydrocensus borehole HBH2.
South African standards are not available for the Total Petroleum Hydrocarbons (TPH) concentrations in water however the Dutch Target Values (DTV) and Dutch Intervention Values (DIV) were utilised. The DTV for Mineral Oil is 50 μg/l and the DIV is 600 μg/l. Therefore, the TPH (C10-C40) concentration of 330 μg/l in AH3 is non-compliant with the DTV, however it is compliant with the DIV. The TPH (C10-C40) concentration of 810 μg/l in HBH2 is non-compliant with the DTV as well as the DIV.
The chemical results for the groundwater samples collected from auger hole AH3, hydrocensus boreholes, HBH1 and HBH2 is summarised below.
AH3: TDS, EC, aluminium, iron, chloride and sodium were non-complaint with the SANS standard. Calcium and magnesium were non-compliant with the DWA limit.
HBH1: EC, arsenic, selenium was non-compliant with the SANS standard. TDS, Sulphate, calcium and sodium were non-compliant with the DWA limit.
HBH2: EC, selenium and iron were non-compliant with the SANS standard, whereas calcium was non-compliant with the DWA limit.

Page | 29
Grootvlei Site 6.4.2
6.4.2.1 Hydrogeology
According to the 1:500 000 hydrogeological map series Johannesburg (2526), the site is underlain by an intergranular and fractured aquifer (predominantly arenaceous rocks – sandstone) with a borehole yield between 0.1 and 0.5 l/s.
6.4.2.2 Quaternary Catchment and Groundwater Direction
The proposed site area fall within quaternary catchment: C12D. The presumed groundwater flow direction is from south-east to north-west across the site.
6.4.2.3 Hydrocensus
Eleven (11) boreholes were identified on the site as presented in Figure 12. The windmill at HBH2 is not in use while the owner of HBH3 was not available. One hydrocensus borehole, HBH5 was identified on Sasol’s property however this borehole was filled with rocks. HBH7 was not fitted with a pump and therefore deemed non-operational.
A groundwater level of 51 mbgl was recorded in HBH7. REGM167 is a monitoring well located north-west of a water treatment dam and could not be accessed due to the cap being damaged by fire. The water abstracted from the boreholes is used for domestic and livestock purposes.
Figure 12: Grootvlei hydrocensus map
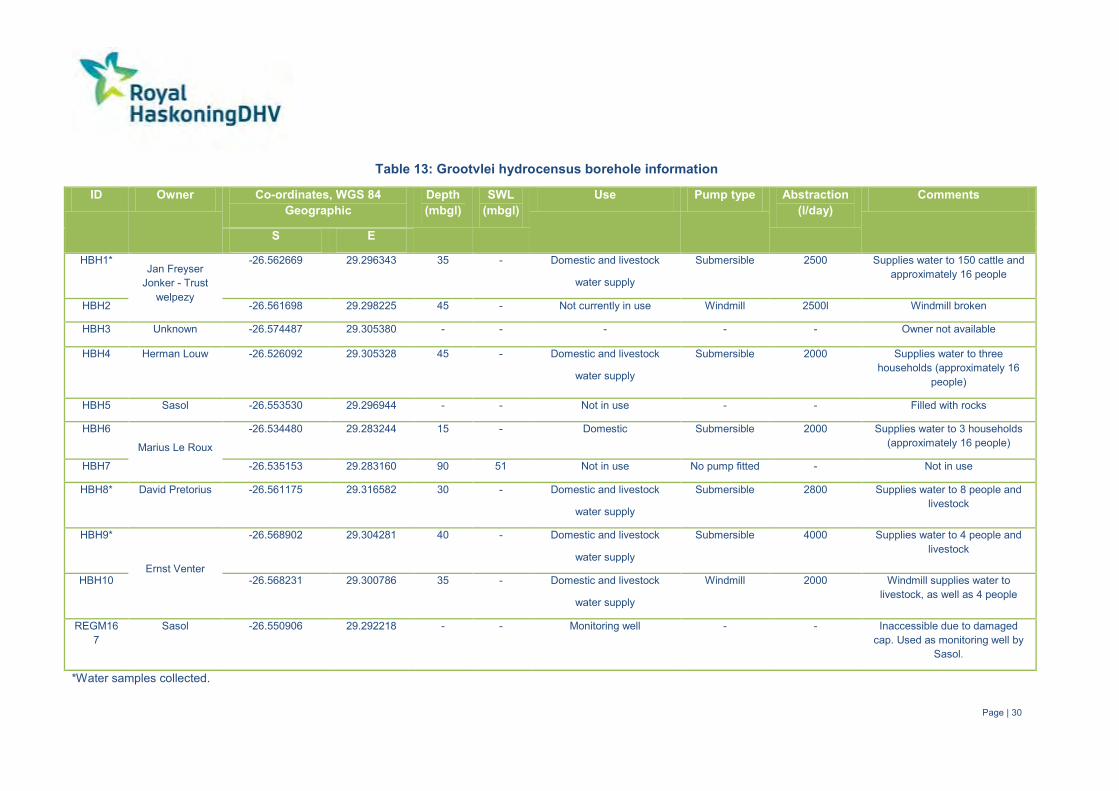
Page | 30
Table 13: Grootvlei hydrocensus borehole information
ID Owner Co-ordinates, WGS 84 Geographic
Depth (mbgl)
SWL (mbgl)
Use Pump type Abstraction (l/day)
Comments
S E
HBH1* Jan Freyser
Jonker - Trust welpezy
-26.562669 29.296343 35 - Domestic and livestock
water supply
Submersible 2500 Supplies water to 150 cattle and approximately 16 people
HBH2 -26.561698 29.298225 45 - Not currently in use Windmill 2500l Windmill broken
HBH3 Unknown -26.574487 29.305380 - - - - - Owner not available
HBH4 Herman Louw -26.526092 29.305328 45 - Domestic and livestock
water supply
Submersible 2000 Supplies water to three households (approximately 16
people)
HBH5 Sasol -26.553530 29.296944 - - Not in use - - Filled with rocks
HBH6
Marius Le Roux
-26.534480 29.283244 15 - Domestic Submersible 2000 Supplies water to 3 households (approximately 16 people)
HBH7 -26.535153 29.283160 90 51 Not in use No pump fitted - Not in use
HBH8* David Pretorius -26.561175 29.316582 30 - Domestic and livestock
water supply
Submersible 2800 Supplies water to 8 people and livestock
HBH9*
Ernst Venter
-26.568902 29.304281 40 - Domestic and livestock
water supply
Submersible 4000 Supplies water to 4 people and livestock
HBH10 -26.568231 29.300786 35 - Domestic and livestock
water supply
Windmill 2000 Windmill supplies water to livestock, as well as 4 people
REGM167
Sasol -26.550906 29.292218 - - Monitoring well - - Inaccessible due to damaged cap. Used as monitoring well by
Sasol.
*Water samples collected.

Page | 31
6.4.2.4 Groundwater Quality
During the hydrocensus, the pH, electrical conductivity (EC), Total Dissolved Solids (TDS), temperature, oxidation-reduction potential (ORP) and dissolved oxygen (DO) were measured. The pH readings comply with the SANS 241-1:2011 Drinking Water Standards. The EC and TDS readings in HBH4 and HBH7 exceeded the standards of 170 mS/m and 1200 mg/l respectively. No PID vapour readings were recorded in any of the boreholes. Positive DO and ORP values were obtained, that are indicative of an oxygen rich environment (Table 14).
Table 14: Grootvlei hydrocensus borehole field parameters
Name pH EC (mS/m) TDS (mg/l) Temp (°C) PID (ppm) ORP (mV) DO (mg/l)
HBH1 6.27 148.3 1012 17.8 0 172 4.9
HBH4 6.39 190.5 1303 18.4 0 168 5.5
HBH6 7.03 163.5 1012 19.2 0 144 6.2
HBH7 7.02 175.2 1228 20.2 0 153 5.5
HBH8 6.35 166 1136 19.2 0 175 5.9
HBH9 6.27 148.3 1012 17.8 0 178 4.9
6.4.2.5 Soil Analysis
Soil samples were collected from soil augers AH1, AH2, AH3 and AH4. The results obtained from the laboratory were compared against the soil screening values (SSV) as published in the National Norms and Standards for the Remediation of Contaminated Land and Soil Quality in the Republic of South Africa under section 7(2)(d) read with section 73(1)(a) of the National Environmental Management: Waste Act, 2008 (No 59 of 2008). No Total Petroleum Hydrocarbons, BTEXN, MTBE or TAME were detected in the soil samples.
Copper and manganese exceeded the SSV1 standards for all soil samples. The lead concentrations recorded in AH1 and AH4 were non-compliant with the standards.
6.4.2.6 Surface Water Analysis
A surface water sample was collected from the stream located north of the proposed site. No TPH, BTEXN, trimethylbenzene, MTBE or TAME were detected in the surface water sample collected from the stream. Calcium and magnesium exceeded the DWA Drinking Water Standards.
6.4.2.7 Groundwater Analysis
No BTEXN, trimethylbenzene, MTBE or TAME were detected in the groundwater samples collected from AH3, HBH1, HBH8 and HBH9.
Calcium and magnesium exceeded the standards for all groundwater samples collected. The elevated Calcium and magnesium is most likely attributed to the natural groundwater in the area.

Page | 32
Hydrology 6.5Both site alternatives are located in Water Management Area (WMA) 8, known as the Upper Vaal and fall within quaternary catchment C12D which drains west via the Klipspruit River. The Klipspruit parallel to the Goedehoop and Grootvlei sites.
6.5.1.1 Rainfall and Run-off
Annual rainfall in a 10 km radius of the Secunda town varies between 560 and 720 mm per annum. Rainfall is highly variable both temporally and spatially. It is estimated that rainfall at the proposed site will be in the order of 600 mm per annum. This rainfall is likely to be distributed as follows (Figure 13):
Figure 13: Rainfall distribution
Peak storm rainfall and intensity is provided in Figure 14:
Oct Nov Dec Jan Feb Mar Apr May Jun Jul Aug Sep
E10 110.5 141.5 142.0 152.2 161.7 102.7 68.1 38.0 15.9 18.8 17.9 47.6
E30 80.3 112.5 109.7 117.4 86.3 75.0 41.6 18.8 4.5 3.3 7.3 24.8
E50 57.1 86.4 86.1 93.2 67.7 60.1 30.5 7.5 1.1 0.3 2.3 16.1
E70 40.3 70.5 70.2 79.4 54.9 49.0 20.2 2.4 0.2 0.0 0.2 5.4
E90 30.0 45.4 49.6 62.2 39.0 29.1 8.8 0.1 0.0 0.0 0.0 1.1
0.0
20.0
40.0
60.0
80.0
100.0
120.0
140.0
160.0
180.0
Mo
nth
ly R
ain
fall
[mm
]
E70 represents a value that is likely to be exceeded in 70% of years, etc.
Rainfall Distribution Pattern

Page | 33
Figure 14: Storm rainfall
Run-off in local rivers and streams, although averaging 68.5 mm per annum, is only likely to be significant during wet periods, with high rainfall. Run-off will be distributed as indicated in Figure 15 below.
Figure 15: Run-off distribution
0
20
40
60
80
100
120
140
0 1 2 3 4 5 6 7 8 9 10 11 12
Rai
nfa
ll [m
m]
Storm Duration [hours]
Peak Storm Rainfall
1:100 year 1:50 year 1:20 year
Oct Nov Dec Jan Feb Mar Apr May Jun Jul Aug Sep
E10 19.5 32.1 26.2 35.9 60.4 13.5 2.7 1.3 1.0 1.1 0.8 0.9
E30 1.7 8.3 3.5 9.3 1.7 1.6 1.1 0.9 0.8 0.7 0.6 0.6
E50 0.8 1.4 1.1 1.3 1.1 1.2 0.9 0.7 0.6 0.6 0.6 0.5
E70 0.6 0.8 0.7 0.9 0.8 0.9 0.7 0.6 0.6 0.5 0.5 0.4
E90 0.4 0.5 0.4 0.6 0.6 0.6 0.6 0.5 0.5 0.4 0.4 0.4
0.0
10.0
20.0
30.0
40.0
50.0
60.0
70.0
Mo
nth
ly R
un
off
[m
m]
E70 represents a value that is likely to be exceeded 70% of the time, etc.
Runoff Distribution
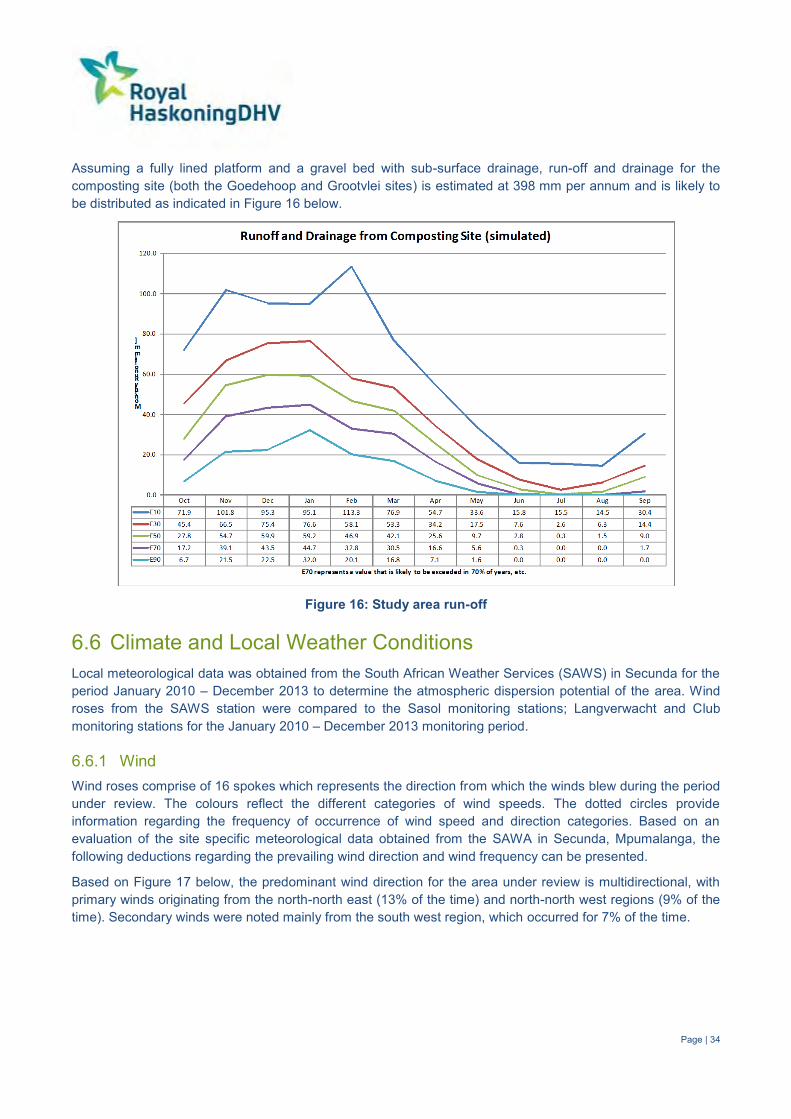
Page | 34
Assuming a fully lined platform and a gravel bed with sub-surface drainage, run-off and drainage for the composting site (both the Goedehoop and Grootvlei sites) is estimated at 398 mm per annum and is likely to be distributed as indicated in Figure 16 below.
Figure 16: Study area run-off
Climate and Local Weather Conditions 6.6Local meteorological data was obtained from the South African Weather Services (SAWS) in Secunda for the period January 2010 – December 2013 to determine the atmospheric dispersion potential of the area. Wind roses from the SAWS station were compared to the Sasol monitoring stations; Langverwacht and Club monitoring stations for the January 2010 – December 2013 monitoring period.
Wind 6.6.1Wind roses comprise of 16 spokes which represents the direction from which the winds blew during the period under review. The colours reflect the different categories of wind speeds. The dotted circles provide information regarding the frequency of occurrence of wind speed and direction categories. Based on an evaluation of the site specific meteorological data obtained from the SAWA in Secunda, Mpumalanga, the following deductions regarding the prevailing wind direction and wind frequency can be presented.
Based on Figure 17 below, the predominant wind direction for the area under review is multidirectional, with primary winds originating from the north-north east (13% of the time) and north-north west regions (9% of the time). Secondary winds were noted mainly from the south west region, which occurred for 7% of the time.

Page | 35
Figure 17: Period wind rose from the Secunda monitoring station for the Jan 2010 – Dec 2013 monitoring period
Figure 18 below illustrates the wind class frequency distribution for the period under review. 48.5% of the total wind speeds fell within the 0.5 – 2.1 m/s wind class, while 28.1% of the total winds experienced, fell within 2.1 – 3.6 m/s. The site is characteristic of moderate to low winds.

Page | 36
Figure 18: Wind class frequency distribution for the Jan 2010 – Dec 2013 monitoring period
Seasonal variability in the wind field at the Secunda monitoring station is shown in Figure 19 and Figure 20 below. The summer months (December, January and February) experienced a predominant wind direction from the north-eastern region (16% of the time), while secondary winds were noted from the north-western region (7% of the time). The summer months were characteristic of wind speeds between 0.5 -2.1 m/s which occurred 51.8% of the time.
The spring months (September, October and November) experienced a predominant wind direction from the north-north eastern and north-north western region. Secondary winds were seen from the south-western region. The spring months were characteristic of winds speeds between 3.6 – 5.7 m/s which occurred for 33.8% of the time and 0.5 – 2.1 m/s which occurred for 32.9% of the time.
The autumn (March, April and May) and winter (May, June and July) months experienced a similar wind profile with a predominant wind direction occurring from the north-eastern region with secondary winds from the north-western and south-western region.
The diurnal trends in the wind field for the proposed project in presented in Figure 21 and Figure 22 below. Between the morning hours of 00:00 -06:00, the winds originate predominantly from the north eastern region. A slight shift in the wind field occurs during midday between 06:00 – 12:00 with a predominant wind direction from the north-north west and north east region. Secondary winds were noted from the south west region. Midday diurnal wind profile is characteristic of low to moderate wind speeds. High wind speeds of 5.7 -6.8 m/s and 6.8 -11.1 m/s were experienced during the afternoon (12:00-18:00) period with a predominant wind direction from the south western region (15% of the time).
The night time conditions (18:00 -24:00) were characteristic of low and moderate wind speeds with a predominant wind direction from the north eastern region.
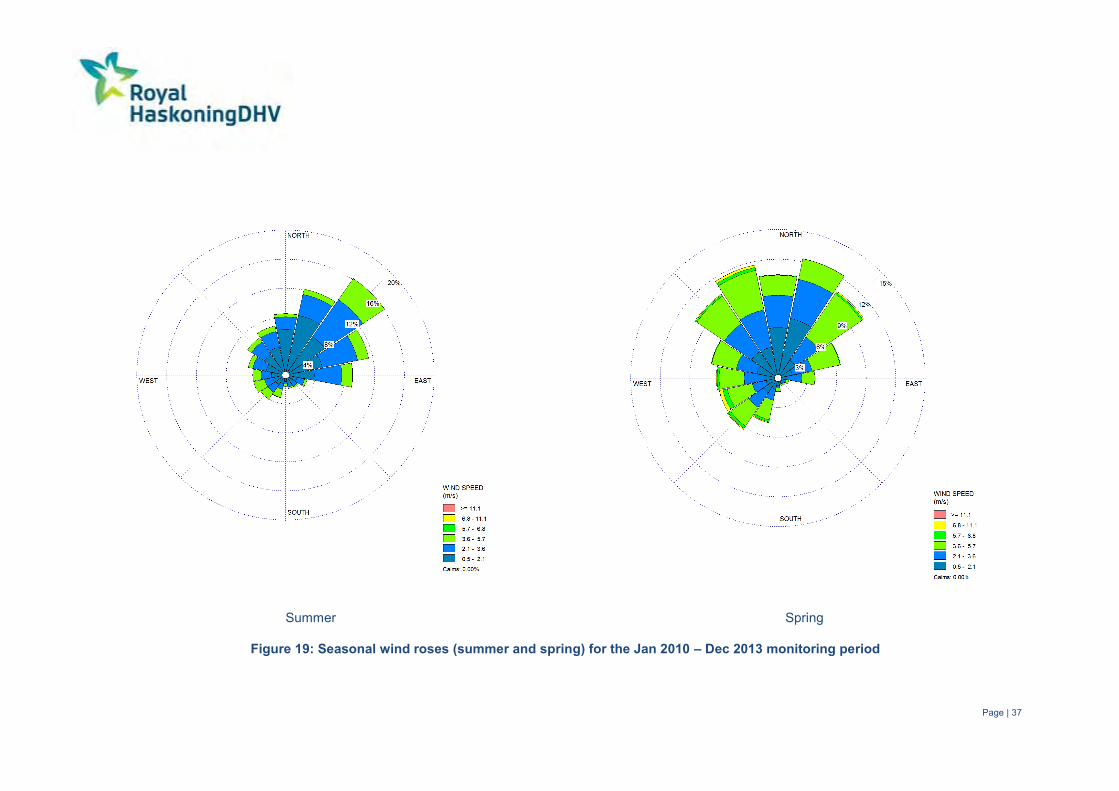
Page | 37
Summer Spring
Figure 19: Seasonal wind roses (summer and spring) for the Jan 2010 – Dec 2013 monitoring period

Page | 38
Autumn Winter
Figure 20: Seasonal wind roses (autumn and winter) for the Jan 2010 – Dec 2013 monitoring period
Page | 39
00:00 -06:00 06:00 – 12:00
Figure 21: Diurnal wind roses (00:00-06:00 – 06:00-12:00) for the Jan 2010 – Dec 2013 monitoring period
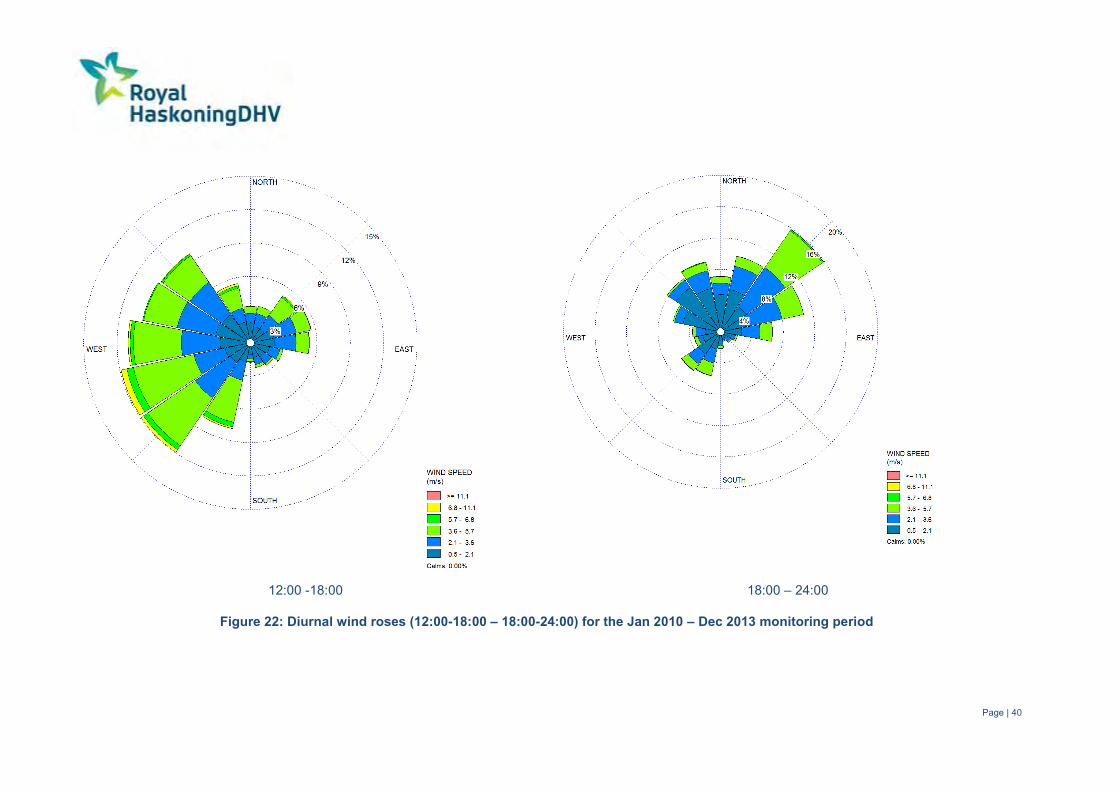
Page | 40
12:00 -18:00 18:00 – 24:00
Figure 22: Diurnal wind roses (12:00-18:00 – 18:00-24:00) for the Jan 2010 – Dec 2013 monitoring period

Page | 41
Atmospheric Stability 6.6.2Atmospheric stability is commonly categorised into one of seven stability classes. These are briefly described in Table 15 below. The atmospheric boundary layer is usually unstable during the day due to turbulence caused by the sun's heating effect on the earth's surface. The depth of this mixing layer depends mainly on the amount of solar radiation, increasing in size gradually from sunrise to reach a maximum at about 5-6 hours after sunrise. The degree of thermal turbulence is increased on clear warm days with light winds. During the night a stable layer, with limited vertical mixing, exists. During windy and/or cloudy conditions, the atmosphere is normally neutral. A neutral atmospheric potential neither enhances nor inhibits mechanical turbulences. An unstable atmospheric condition enhances turbulence, whereas a Stable atmospheric condition inhibits mechanical turbulence.
Table 15: Atmospheric stability classes
A Very unstable calm wind, clear skies, hot daytime conditions B Moderately unstable clear skies, daytime conditions C Unstable moderate wind, slightly overcast daytime conditions D Neutral high winds or cloudy days and nights E Stable moderate wind, slightly overcast night-time conditions F Very stable low winds, clear skies, cold night-time conditions G Most stable Associated with worst case dispersion conditions
Figure 23 below illustrates the stability class frequency distribution for the study area under review. The study area experienced mostly moderately stable wind conditions (23%) which are characteristic of low winds, clear skies and cold night time conditions. 17.6% of the time was attributed to moderately unstable wind conditions which are typical of clear skies and hot daytime conditions.
Figure 23: Stability class frequency distribution

Page | 42
Temperature and Humidity 6.6.3Temperature affects the formation, action, and interactions of pollutants in various ways3. Chemical reaction rates tend to increase with temperature and the warmer the air, the more water it can hold and hence the higher the humidity. Temperature also provides an indication of the rate of development and dissipation of the mixing layer as well as determining the effect of plume buoyancy; the larger the temperature difference between the plume and ambient air, the higher the plume is able to rise. Higher plume buoyancy will result in an increased lag time between the pollutant leaving the source, and reaching the ground. This additional time will allow for greater dilution and ultimately a decrease in the pollutant concentrations when reaching ground level.
Humidity is the mass of water vapour per unit volume of natural air. When temperatures are at their highest the humidity is also high, the moisture is trapped inside the droplets of the water vapour. This makes the moisture content of the air high. When relative humidity exceeds 70%, light scattering by suspended particles begins to increase, as a function of increased water uptake by the particles4. This results in decreased visibility due to the resultant haze. Many pollutants may also dissolve in water to form acids, as well as secondary pollutants within the atmosphere.
The average monthly temperature and relative humidity for the period Jan 2010 – Dec 2013 is presented in Figure 24 below with the average humidity indicated with the blue line. Daily average summer temperatures ranged between 19 - 21ºC while the average winter temperatures ranged between 9 - 12ºC. Relative humidity for the period Jan 2009 – Dec 2013 was highest during the summer months and lowest during the winter months.
Figure 24: Average monthly temperature and relative humidity for the Jan 2010 – Dec 2013 monitoring period
3 Kupchella, C.E. and Hyland, MC. (1993). Environmental Science: Living within the system of nature. 3rd edition. New
Jersey. Prentice-Hall. 4 CEPA/FPAC Working Group (1998). National Ambient Air Quality Objectives for Particulate Matter. Part 1. Science
Assessment Document, A Report by the Canadian Environmental Protection Agency (CEPA) Federal-Provincial Advisory Committee (FPAC) on Air Quality Objectives and Guidelines.

Page | 43
Precipitation 6.6.4Precipitation cleanses the air by washing out particles suspended in the atmosphere5. It is calculated that precipitation accounts for about 80-90% of the mass of particles removed from the atmosphere6.
Summary of the total rainfall profile for the January 2010 – December 2013 monitoring period is illustrated in Figure 25 below. The average mainly rainfall observed for the period under review was recorded at 27 mm. The highest rainfall was recorded during the summer months (December and January) with 99 mm and 54 mm respectively, while the lowest rainfall was recorded during the winter months (June, July and August) with 0.06 mm.
Figure 25: Average precipitation for the period under review from Jan 2010 – Dec 2013
5 Ibid Footnote 3. 6 Ibid Footnote 4.

Page | 44
Ecology 6.7
Vegetation – Goedehoop Site 6.7.1The vegetation on the Goedehoop site consists predominantly of Soweto Highveld Grassland (Gm8) in various stages of transformation and degradation as well as remnant patches of temporary and seasonally inundated grassland adjacent to a lower-lying valley bottom wetland consisting of Eastern Temperate Wetlands (AZf 3)7. Soweto Highveld Grasslands are considered to be Endangered. The conservation target is 24%.
The vegetation is dominated by grasses species reaching a height of ~1.0 m (Themeda triandra) while the herbaceous component (averages 0.9 m tall) comprises a cover of about 5%. Dominant species are Themeda triandra and Hyparrhenia hirta. In places not disturbed, only scattered small wetlands, narrow stream alluvia, pans and occasional ridges or rocky outcrops interrupt the continuous grassland cover. No patches of natural Themeda triandra grassland, ridges or large rocky outcrops were observed on the site or adjacent areas. No patches of natural Themeda triandra grassland, ridges or large rocky outcrops were observed on the site or adjacent areas.
Large areas of the vegetation on the Goedehoop site have been transformed during previous and current agricultural activities. The majority of the site has been annually ploughed and planted with various crops ranging from maize to the current soya beans. The existing farm roads and road reserves are dominated by hydrophilic weedy plant species such as Cyperus esculentus, Verbena bonariensis, Cirsium vulgare and weedy grasses such as Setaria verticiliata, Imperata cylindrical and Cynodon dactylon.
The site is divided into two sensitivity classes namely High sensitivity (Moist Soweto Highveld Grassland) and Low sensitivity (Transformed Grassland) - Figure 26.
7 Mucina, L and Rutherford, M.C. (eds) (2006). The Vegetation of South Africa, Lesotho and Swaziland. Strelitzia 19.
SANBI, Pretoria.
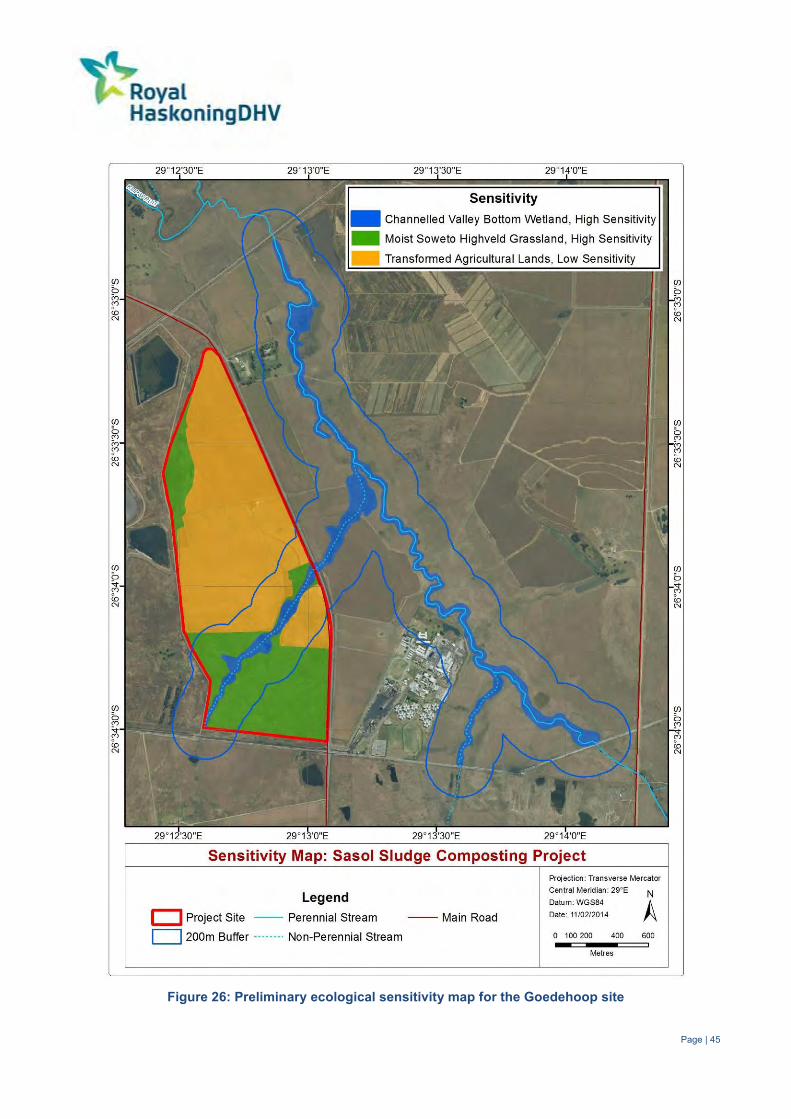
Page | 45
Figure 26: Preliminary ecological sensitivity map for the Goedehoop site
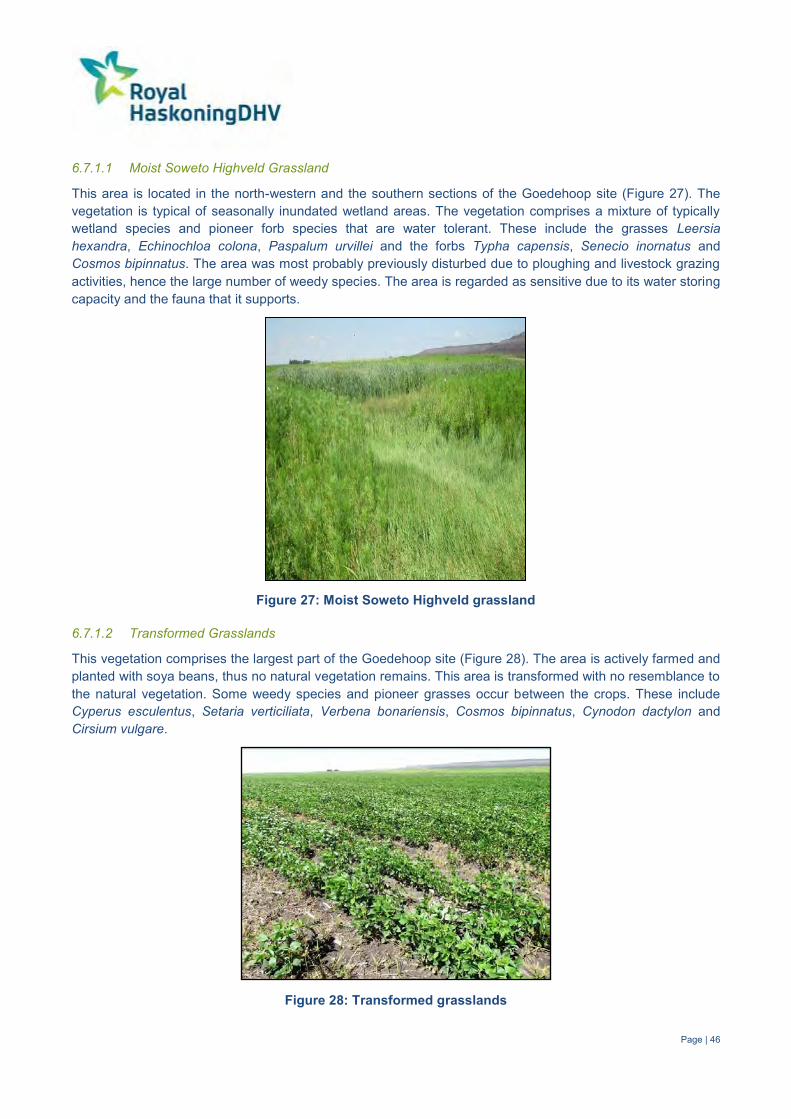
Page | 46
6.7.1.1 Moist Soweto Highveld Grassland
This area is located in the north-western and the southern sections of the Goedehoop site (Figure 27). The vegetation is typical of seasonally inundated wetland areas. The vegetation comprises a mixture of typically wetland species and pioneer forb species that are water tolerant. These include the grasses Leersia hexandra, Echinochloa colona, Paspalum urvillei and the forbs Typha capensis, Senecio inornatus and Cosmos bipinnatus. The area was most probably previously disturbed due to ploughing and livestock grazing activities, hence the large number of weedy species. The area is regarded as sensitive due to its water storing capacity and the fauna that it supports.
Figure 27: Moist Soweto Highveld grassland
6.7.1.2 Transformed Grasslands
This vegetation comprises the largest part of the Goedehoop site (Figure 28). The area is actively farmed and planted with soya beans, thus no natural vegetation remains. This area is transformed with no resemblance to the natural vegetation. Some weedy species and pioneer grasses occur between the crops. These include Cyperus esculentus, Setaria verticiliata, Verbena bonariensis, Cosmos bipinnatus, Cynodon dactylon and Cirsium vulgare.
Figure 28: Transformed grasslands
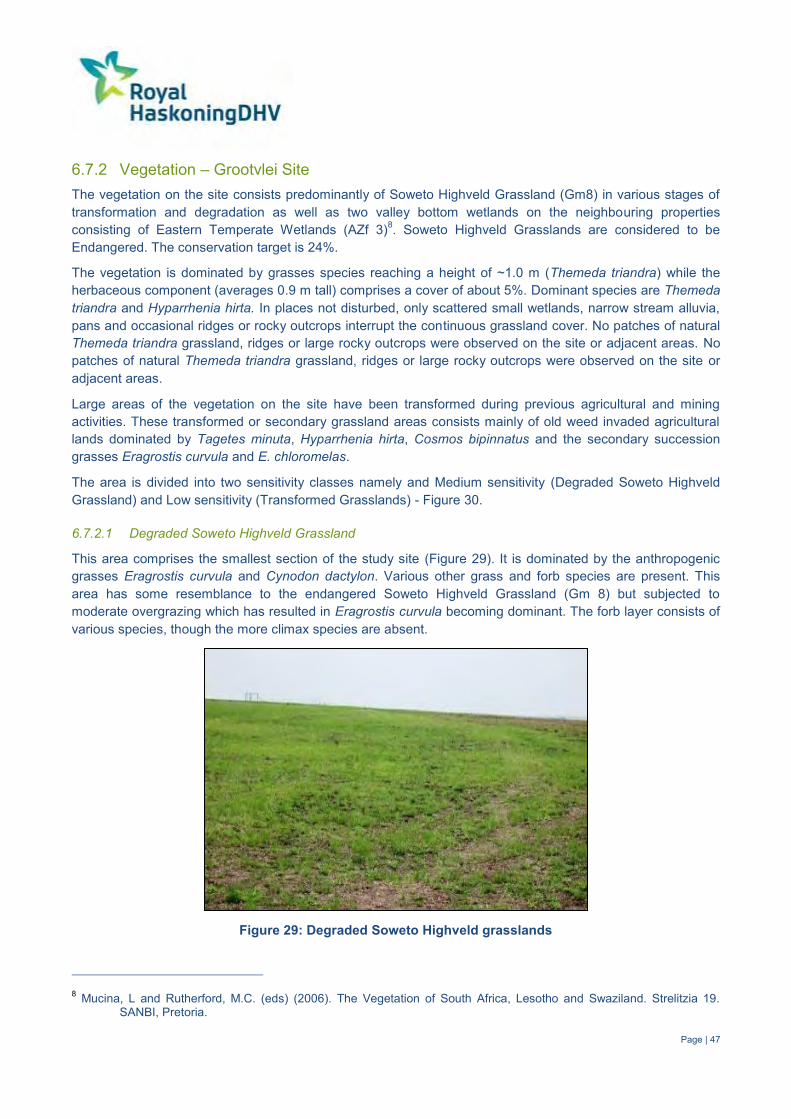
Page | 47
Vegetation – Grootvlei Site 6.7.2The vegetation on the site consists predominantly of Soweto Highveld Grassland (Gm8) in various stages of transformation and degradation as well as two valley bottom wetlands on the neighbouring properties consisting of Eastern Temperate Wetlands (AZf 3)8. Soweto Highveld Grasslands are considered to be Endangered. The conservation target is 24%.
The vegetation is dominated by grasses species reaching a height of ~1.0 m (Themeda triandra) while the herbaceous component (averages 0.9 m tall) comprises a cover of about 5%. Dominant species are Themeda triandra and Hyparrhenia hirta. In places not disturbed, only scattered small wetlands, narrow stream alluvia, pans and occasional ridges or rocky outcrops interrupt the continuous grassland cover. No patches of natural Themeda triandra grassland, ridges or large rocky outcrops were observed on the site or adjacent areas. No patches of natural Themeda triandra grassland, ridges or large rocky outcrops were observed on the site or adjacent areas.
Large areas of the vegetation on the site have been transformed during previous agricultural and mining activities. These transformed or secondary grassland areas consists mainly of old weed invaded agricultural lands dominated by Tagetes minuta, Hyparrhenia hirta, Cosmos bipinnatus and the secondary succession grasses Eragrostis curvula and E. chloromelas.
The area is divided into two sensitivity classes namely and Medium sensitivity (Degraded Soweto Highveld Grassland) and Low sensitivity (Transformed Grasslands) - Figure 30.
6.7.2.1 Degraded Soweto Highveld Grassland
This area comprises the smallest section of the study site (Figure 29). It is dominated by the anthropogenic grasses Eragrostis curvula and Cynodon dactylon. Various other grass and forb species are present. This area has some resemblance to the endangered Soweto Highveld Grassland (Gm 8) but subjected to moderate overgrazing which has resulted in Eragrostis curvula becoming dominant. The forb layer consists of various species, though the more climax species are absent.
Figure 29: Degraded Soweto Highveld grasslands
8 Mucina, L and Rutherford, M.C. (eds) (2006). The Vegetation of South Africa, Lesotho and Swaziland. Strelitzia 19.
SANBI, Pretoria.
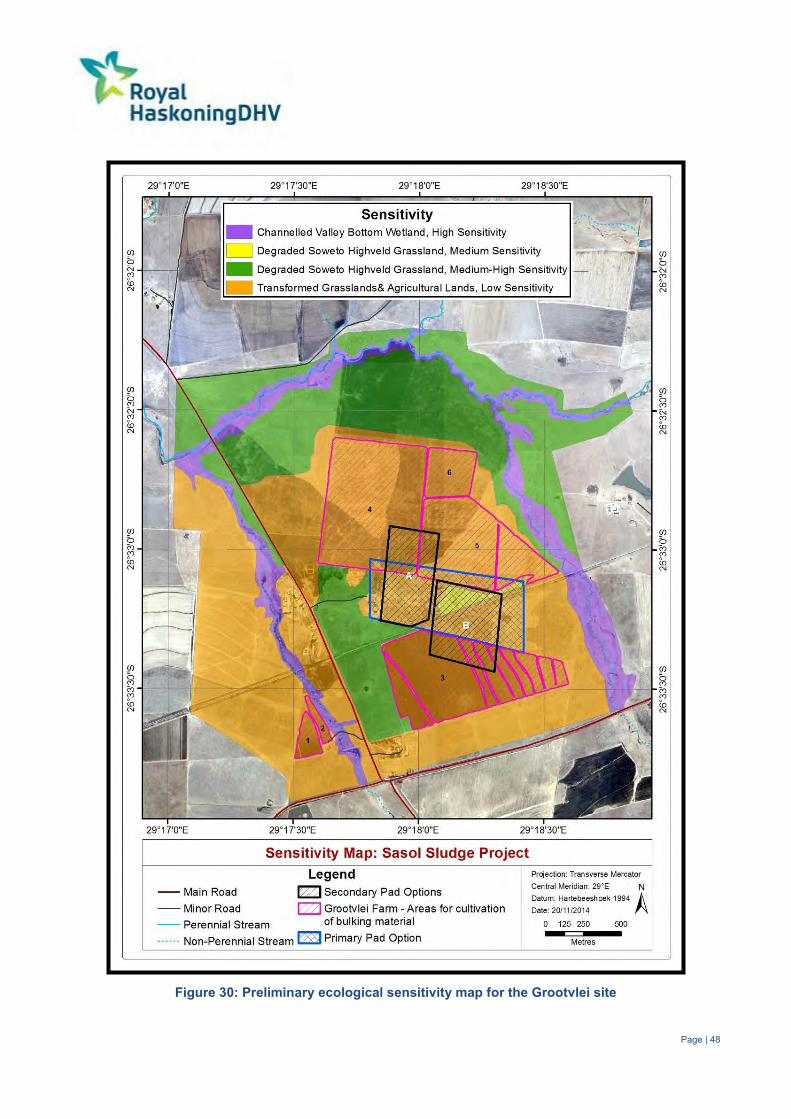
Page | 48
Figure 30: Preliminary ecological sensitivity map for the Grootvlei site

Page | 49
6.7.2.2 Transformed Grasslands
These areas comprise the largest part of the site and comprise agricultural land that is ploughed for maize cultivation. The vegetation of these areas are heavily degraded and transformed (Figure 31). It is not representative of any natural system with mainly pioneer weedy and secondary successional species present. The degraded grassland area that also forms part of this area, has been heavily overgrazed in the past which has resulted in the anthropogenic grass Hyparrhenia hirta becoming dominant. The transformed area contains remnants of an old homestead where all the buildings were recently demolished with all the rubble and other litter still present. The degraded natural grassland area within this unit seems to have been excavated in the past with the topsoil layer replaced afterwards. This has resulted in open patches of soil with pioneer grass species present.
Figure 31: Transformed grasslands
Protected Trees Species 6.7.3In terms of the National Forests Act 1998 (No 84 of 1998) certain tree species have been identified and declared as protected. Trees are protected for a variety of reasons, and some species require strict protection while others require control over harvesting and utilization. No protected tree species or indigenous tree species were observed or are likely to occur on either the Goedehoop or Grootvlei sites.
Red Data / Endemic Species 6.7.4No red listed or endemic plant species have been listed for the 2629 CB Quarter Degree area in which both Goedehoop and Grootvlei sites are situated. Three red listed Declining’ plant species have been observed within the adjacent Secunda-Evander areas during previous surveys. These include the Cape Poison Bulb (Boophane disticha), African Potato (Hypoxis hemerocallidea) and River Lily (Crinum macowanii). A taxon is ‘Declining’ when it does not meet any of the five IUCN criteria and does not qualify for the categories Critically Endangered, Endangered, Vulnerable or Near Threatened, but there are threatening processes causing a continuing decline in the population.
Land Degradation 6.7.5Both sites are located within an area where soil erosion is regarded as insignificant with large areas being mined and others ploughed for crop production. Grazing by cattle has also had a significant effect on large areas with heavy and mild overgrazing leading to degradation of the natural land. Various wetland and seep areas occur within the region however, some areas have been negatively affected by adjacent coal mining activities as well as uncontrolled livestock grazing and trampling along the valley bottom wetlands.
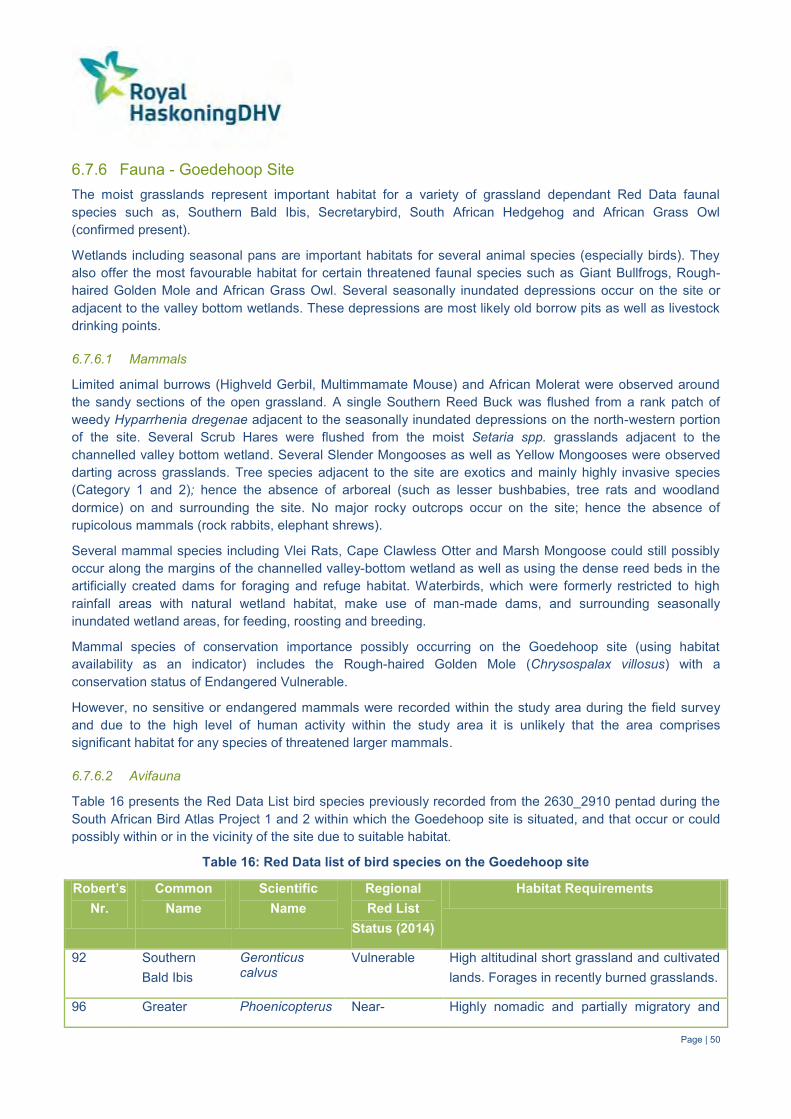
Page | 50
Fauna - Goedehoop Site 6.7.6The moist grasslands represent important habitat for a variety of grassland dependant Red Data faunal species such as, Southern Bald Ibis, Secretarybird, South African Hedgehog and African Grass Owl (confirmed present).
Wetlands including seasonal pans are important habitats for several animal species (especially birds). They also offer the most favourable habitat for certain threatened faunal species such as Giant Bullfrogs, Rough-haired Golden Mole and African Grass Owl. Several seasonally inundated depressions occur on the site or adjacent to the valley bottom wetlands. These depressions are most likely old borrow pits as well as livestock drinking points.
6.7.6.1 Mammals
Limited animal burrows (Highveld Gerbil, Multimmamate Mouse) and African Molerat were observed around the sandy sections of the open grassland. A single Southern Reed Buck was flushed from a rank patch of weedy Hyparrhenia dregenae adjacent to the seasonally inundated depressions on the north-western portion of the site. Several Scrub Hares were flushed from the moist Setaria spp. grasslands adjacent to the channelled valley bottom wetland. Several Slender Mongooses as well as Yellow Mongooses were observed darting across grasslands. Tree species adjacent to the site are exotics and mainly highly invasive species (Category 1 and 2); hence the absence of arboreal (such as lesser bushbabies, tree rats and woodland dormice) on and surrounding the site. No major rocky outcrops occur on the site; hence the absence of rupicolous mammals (rock rabbits, elephant shrews).
Several mammal species including Vlei Rats, Cape Clawless Otter and Marsh Mongoose could still possibly occur along the margins of the channelled valley-bottom wetland as well as using the dense reed beds in the artificially created dams for foraging and refuge habitat. Waterbirds, which were formerly restricted to high rainfall areas with natural wetland habitat, make use of man-made dams, and surrounding seasonally inundated wetland areas, for feeding, roosting and breeding.
Mammal species of conservation importance possibly occurring on the Goedehoop site (using habitat availability as an indicator) includes the Rough-haired Golden Mole (Chrysospalax villosus) with a conservation status of Endangered Vulnerable.
However, no sensitive or endangered mammals were recorded within the study area during the field survey and due to the high level of human activity within the study area it is unlikely that the area comprises significant habitat for any species of threatened larger mammals.
6.7.6.2 Avifauna
Table 16 presents the Red Data List bird species previously recorded from the 2630_2910 pentad during the South African Bird Atlas Project 1 and 2 within which the Goedehoop site is situated, and that occur or could possibly within or in the vicinity of the site due to suitable habitat.
Table 16: Red Data list of bird species on the Goedehoop site
Robert’s Nr.
Common Name
Scientific Name
Regional Red List
Status (2014)
Habitat Requirements
92 Southern Bald Ibis
Geronticus calvus
Vulnerable High altitudinal short grassland and cultivated lands. Forages in recently burned grasslands.
96 Greater Phoenicopterus Near- Highly nomadic and partially migratory and

Page | 51
Robert’s Nr.
Common Name
Scientific Name
Regional Red List
Status (2014)
Habitat Requirements
Flamingo ruber Threatened favours saline or brackish shallow waterbodies such as salt pans, large dams and coastal mudflats.
165 African Marsh Harrier
Circus ranivorus Endangered Inland and coastal freshwater wetlands and adjacent moist grassland. Require large (>100 ha) wetlands in which to breed.
208 Blue Crane Anthropoides paradiseus
Near-Threatened
Mostly found in natural grasslands but also in freshwater wetlands, cultivated pastures and croplands.
393 African Grass Owl
Tyto capensis Vulnerable
African Grass Owls are found exclusively in rank grass, typically, although not only, at fair altitudes. African Grass Owls are secretive and nomadic breeding in permanent and seasonal vleis, which it vacates while hunting or post-breeding, although it will breed in any area of long grass and it is not necessarily associated with wetlands.
118 Secretarybird Saggitarius serpentarius
Vulnerable Favours open grassland with scattered trees or shrubs. They are territorial with home ranges of 20-230 km2 around the nest, usually an area of between 50-60 km2
, is defended
against other Secretarybirds. Nests are usually placed on top of a thorny tree, frequently in Black Thorn Acacia melifera, Umbrella Thorn Acacia tortilis, Sweet Thorn Acacia karroo, Common Hook Thorn Acacia caffra. They may also nest in exotic species such as Black Wattle Acacia mearnsii or Pine (Pinus sp.).
Page | 52
The rank vegetation along certain sections of the valley bottom wetlands as well as dense sedge and grass vegetation around the seasonally inundated depressions offers favourable rooting and possible nesting habitat for African Grass Owls. A single African Grass Owl as well as a pair of Marsh Owls were flushed from the north-western wetland system (Figure 32).
Figure 32: African Grass Owl (left) and Marsh Owl (right)
6.7.6.3 Reptiles
Reptile species likely to occur on the site include Distant’s Ground Agama (Agama aculeata distanti); Variable Skink (Trachylepis varia); Cape Dwarf Gecko (Lygodactylus capensis) and Striped Skink (Trachylepis punctatissima).
No threatened reptile species have been recorded for the 2629 CB QDGC (SARCA 2014). The Striped Harlequin Snake (Homoroselaps dorsalis), which is categorised as Rare in the Red Data List9 has been recorded from adjacent grid squares to the south and the east (Broadley 1990). According to the habitat description (moribund/old termite mounds and scattered loose rock) provided for this species by Broadley10 and Branch11; no suitable habitat occurs on the site (moribund termite mounds) as well as loosely embedded rock material.
6.7.6.4 Amphibians
Three frog species were recorded during the field survey on and surrounding the site including Cape River Frog (Amietia (Afrana fuscigula), Guttural Toad (Amietophrynus (Bufo) gutturalis) and several calling Common Caco males (Cacosternum boettgeri).
The Giant Bullfrog is currently assigned as a near-threatened species (IUCN Red List category). Giant Bullfrogs have been recorded from the adjacent grid squares (Middleburg area) during previous surveys as well as during the South African Frog Atlas Project (SAFAP). However, no Giant Bullfrogs have been recorded from the Secunda-Evander area during the SAFAP and no large meta-populations are expected on the actual site or immediately surrounding areas due to extensive habitat transformation (mining, industrial and agricultural activities; major road networks bisecting foraging and breeding habitats) as well as degradation (massive deterioration in surface and groundwater quality). 9 Branch, W.R. (1988). Field Guide to the Snakes and other Reptiles of Southern Africa. Struik Publishers, Cape Town. 10 Broadley, D.G. (1990b): FitzSimons’ snakes of Southern Africa (revised edition). – Parklands (Jonathan Ball & Ad.
Donker), 387pp. 11 Branch, W.R. (1988). Field Guide to the Snakes and other Reptiles of Southern Africa. Struik Publishers, Cape Town.
Page | 53
Fauna – Grootvlei Site 6.7.7Remnant homogenous stands of Red Grass (Themeda triandra) occur on the black turfs to the north of the site. The moist grasslands surrounding the Grootvlei site represent important habitat for a variety of grassland dependant Red Data faunal species such as, Southern Bald Ibis, Secretarybird, South African Hedgehog and African Grass Owl.
Wetlands offer the most favourable habitat for certain threatened faunal species such as Giant Bullfrogs, Rough-haired Golden Mole and African Grass Owl. One clearly defined channelled valley-bottom wetland occurs outside the northern and eastern boundaries of the site, and an incised channelled valley bottom occurs adjacent to the proposed agricultural land on the western portion of the site. No natural seasonally inundated depressions occur on the site or adjacent to the valley bottom wetlands. Old borrow pits on the central portion of the site have contain surface water and limited hygrophilous vegetation. Several have been recently in-filled.
6.7.7.1 Mammals
Limited animal burrows (Highveld Gerbil, Multimmamate Mouse) and African Molerat were observed around the sandy sections of the old lands and open grassland. A single Southern Reed Buck was flushed from a rank patch of weedy Hyparrhenia dregenae adjacent to the mine conveyor-belt. Several Scrub Hares were flushed from the degraded Eragrostis curvula grasslands adjacent to the old borrow pits. Several Slender Mongooses as well as Yellow Mongooses were observed darting across the dirt roads. One indigenous tree species occur on the site namely a single Acacia karroo adjacent to the old homestead. Tree species adjacent to the site are exotics and mainly highly invasive species (Category 1 and 2); hence the absence of arboreal (such as lesser bushbabies, tree rats and woodland dormice) on the site. No major rocky outcrops occur on the site; hence the absence of rupiculous mammals (rock rabbits, elephant shrews).
Mammal species of conservation importance possibly occurring on the Goedehoop site (using habitat availability as an indicator) includes the Rough-haired Golden Mole (Chrysospalax villosus) with a conservation status of Endangered Vulnerable.
However, no sensitive or endangered mammals were recorded within the study area during the field survey and due to the high level of human activity within the study area it is unlikely that the area comprises significant habitat for any species of threatened larger mammals.
6.7.7.2 Avifauna
The Red Data List bird species previously recorded from the 2630_2910 pentad during the South African Bird Atlas Project 1 and 2 within which the Grootvlei site is situated, and that occur or could possibly within or in the vicinity of the site due to suitable habitat is presented in Table 16.
The African Grass Owl was recorded during a previous field survey along a channelled valley bottom approximately 4 km to the north of the site.
6.7.7.3 Reptiles
Reptile species likely to occur on the site include Distant’s Ground Agama (Agama aculeata distanti); Variable Skink (Trachylepis varia); Cape Dwarf Gecko (Lygodactylus capensis) and Striped Skink (Trachylepis punctatissima).

Page | 54
No threatened reptile species have been recorded for the 2629 CB QDGC (SARCA 2014). The Striped Harlequin Snake (Homoroselaps dorsalis), which is categorised as Rare in the Red Data List12 has been recorded from adjacent grid squares to the south and the east (Broadley 1990). According to the habitat description (moribund/old termite mounds and scattered loose rock) provided for this species by Broadley13 and Branch14; no suitable habitat occurs on the site (moribund termite mounds) as well as loosely embedded rock material.
6.7.7.4 Amphibians
Three frog species were recorded during the field survey on and surrounding the site including Cape River Frog (Amietia (Afrana fuscigula), Guttural Toad (Amietophrynus (Bufo) gutturalis) and several calling Common Caco males (Cacosternum boettgeri).
The Giant Bullfrog is currently assigned as a near-threatened species (IUCN Red List category). Giant Bullfrogs have been recorded from the adjacent grid squares (Middleburg area) during previous surveys as well as during the South African Frog Atlas Project (SAFAP). However, no Giant Bullfrogs have been recorded from the Secunda-Evander area during the SAFAP and no large meta-populations are expected on the actual site or immediately surrounding areas due to extensive habitat transformation (mining, industrial and agricultural activities; major road networks bisecting foraging and breeding habitats) as well as degradation (massive deterioration in surface and groundwater quality).
Social 6.8The study area falls within the Govan Mbeki Local Municipality (GMLM) which is located in the north-west of the Gert Sibande District Municipality (GSDM). The GMLM has the most diversified economy within the GSDM, dominated by the petrochemical industry (Sasol II and III complexes) and coal and gold mining. Secunda and Embalenhle are the closest town / communities to the study area.
From a social perspective, the study area extends potentially across much of the Govan Mbeki Municipality, which consists of Secunda, Embalenhle, Kinross, Evander, Trichardt, Charl Cilliers, Leslie / Leandra, Lebohang, Eendracht, Bethal and eMzinoni. The Govan Mbeki Local Municipality has the largest number of people (24.6% or 221 745)15 and highest level of employment within the District. This could be attributed to the fact that the GMLM is one of two local municipalities that hosts the majority of all the mining, manufacturing and agricultural activity taking place within the District.
Air Quality 6.9On 23 November 2007, the Highveld was declared a priority area, referred to as the Highveld Priority Area (HPA), in terms of section 18(1) of the National Environmental Management: Air Quality Act, 2004 (No 39 of 2004). The HPA is associated with poor air quality and elevated concentrations of criteria pollutants occur due to the concentration of industrial and non industrial sources. The HPA covers an area of 31,106 km2, including parts of Gauteng and Mpumalanga Provinces (Figure 33). It encompasses one metropolitan municipality, three district and nine local municipalities. The motivation behind establishing an air quality management plan
12 Branch, W.R. (1988). Field Guide to the Snakes and other Reptiles of Southern Africa. Struik Publishers, Cape Town. 13 Broadley, D.G. (1990b): FitzSimons’ snakes of Southern Africa (revised edition). – Parklands (Jonathan Ball & Ad.
Donker), 387pp. 14 Branch, W.R. (1988). Field Guide to the Snakes and other Reptiles of Southern Africa. Struik Publishers, Cape Town. 15 Gert Sibande District Municipality (2011). Spatial Development Framework.

Page | 55
for the priority area is to achieve and maintain compliance with the ambient air quality standards across the HPA, using the constitutional principle of realisation of air quality improvements.
Figure 33: Highveld priority area
Sensitive Receptors 6.9.1A sensitive receptor for the purpose of current investigation is defined as a place or activity which could involuntarily be exposed to air emissions generated from the proposed operations. Based on this definition the residential, educational and recreational land uses in the area are considered to be sensitive receptors.
The area surrounding the study area is boarded by neighbouring farms. Sensitive receptors identified are presented in Table 17 below. Other sensitive receptors within the area would be local fauna and flora.
Table 17: Identified sensitive receptors surrounding the study area
Sensitive Receptor Distance from Site Direction from Site Secunda ~9 km NW
Embalenhle ~20 km W
Winkelhaak mines ~14 km W
Evander ~20 km N
Trichardt ~10 km W
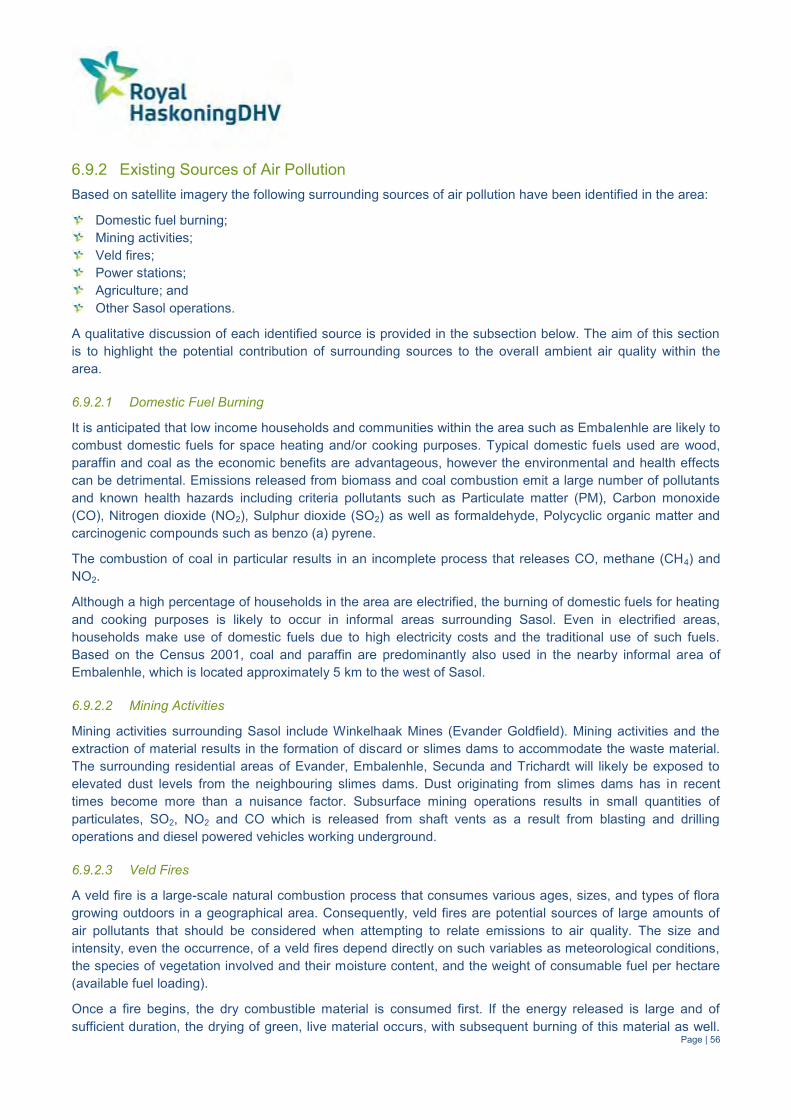
Page | 56
Existing Sources of Air Pollution 6.9.2Based on satellite imagery the following surrounding sources of air pollution have been identified in the area:
Domestic fuel burning; Mining activities; Veld fires; Power stations; Agriculture; and Other Sasol operations.
A qualitative discussion of each identified source is provided in the subsection below. The aim of this section is to highlight the potential contribution of surrounding sources to the overall ambient air quality within the area.
6.9.2.1 Domestic Fuel Burning
It is anticipated that low income households and communities within the area such as Embalenhle are likely to combust domestic fuels for space heating and/or cooking purposes. Typical domestic fuels used are wood, paraffin and coal as the economic benefits are advantageous, however the environmental and health effects can be detrimental. Emissions released from biomass and coal combustion emit a large number of pollutants and known health hazards including criteria pollutants such as Particulate matter (PM), Carbon monoxide (CO), Nitrogen dioxide (NO2), Sulphur dioxide (SO2) as well as formaldehyde, Polycyclic organic matter and carcinogenic compounds such as benzo (a) pyrene.
The combustion of coal in particular results in an incomplete process that releases CO, methane (CH4) and NO2.
Although a high percentage of households in the area are electrified, the burning of domestic fuels for heating and cooking purposes is likely to occur in informal areas surrounding Sasol. Even in electrified areas, households make use of domestic fuels due to high electricity costs and the traditional use of such fuels. Based on the Census 2001, coal and paraffin are predominantly also used in the nearby informal area of Embalenhle, which is located approximately 5 km to the west of Sasol.
6.9.2.2 Mining Activities
Mining activities surrounding Sasol include Winkelhaak Mines (Evander Goldfield). Mining activities and the extraction of material results in the formation of discard or slimes dams to accommodate the waste material. The surrounding residential areas of Evander, Embalenhle, Secunda and Trichardt will likely be exposed to elevated dust levels from the neighbouring slimes dams. Dust originating from slimes dams has in recent times become more than a nuisance factor. Subsurface mining operations results in small quantities of particulates, SO2, NO2 and CO which is released from shaft vents as a result from blasting and drilling operations and diesel powered vehicles working underground.
6.9.2.3 Veld Fires
A veld fire is a large-scale natural combustion process that consumes various ages, sizes, and types of flora growing outdoors in a geographical area. Consequently, veld fires are potential sources of large amounts of air pollutants that should be considered when attempting to relate emissions to air quality. The size and intensity, even the occurrence, of a veld fires depend directly on such variables as meteorological conditions, the species of vegetation involved and their moisture content, and the weight of consumable fuel per hectare (available fuel loading).
Once a fire begins, the dry combustible material is consumed first. If the energy released is large and of sufficient duration, the drying of green, live material occurs, with subsequent burning of this material as well.
Page | 57
Under suitable environmental and fuel conditions, this process may initiate a chain reaction that results in a widespread conflagration. It has been hypothesized, but not proven, that the nature and amounts of air pollutant emissions are directly related to the intensity and direction (relative to the wind) of the veld fire, and are indirectly related to the rate at which the fire spreads. The factors that affect the rate of spread are (1) weather (wind velocity, ambient temperature, relative humidity); (2) fuels (fuel type, fuel bed array, moisture content, fuel size); and (3) topography (slope and profile). However, logistical problems (such as size of the burning area) and difficulties in safely situating personnel and equipment close to the fire have prevented the collection of any reliable emissions data on actual veld fires, so that it is not possible to verify or disprove the hypothesis.
The major pollutants from veld burning are PM, CO and VOCs. Nitrogen oxides are emitted at rates of from 1 to 4 g/kg burned, depending on combustion temperatures16. Emissions of SOx are negligible17. A study of biomass burning in the African savannah estimated that the annual flux of particulate carbon into the atmosphere is estimated to be of the order of 8 Tg C, which rivals particulate carbon emissions from anthropogenic activities in temperate regions18.
6.9.2.4 Power Stations
There are numerous Eskom coal powered stations such as Kriel and Tutuka that are located within the Highveld Priority area. The burning of coal for power generation results in significant emissions being generated. At the power stations, various mitigation measures have been put in place at the stations to reduce the emissions before entering the atmosphere
6.9.2.5 Agriculture
Agricultural activity can be considered a significant contributor to particulate emissions, although tilling, harvesting and other activities associated with field preparation are seasonally based. The main focus internationally with respect to emissions generated due to agricultural activity is related to animal husbandry, with special reference to malodours generated as a result of the feeding and cleaning of animals.
The activity associated with irrigation farming includes the application of pesticides, herbicides, weed control, fertilizers, harvesting activities, phosphate and nitrogen addition.
Little information is available with respect to the emissions generated due to the growing of crops. The activities responsible for the release of particulates and gases to atmosphere would however include:
Particulate emissions generated due to wind erosion from exposed areas; Particulate emissions generated due to the mechanical action of equipment used for tilling and harvesting
operations; Vehicle entrained dust on paved and unpaved road surfaces; and Gaseous and particulate emissions due to fertilizer treatment and gaseous emissions due to the
application of herbicides and pesticides.
16 USEPA (1996). Compilation of Air Pollution Emission Factors (AP-42), 6th Edition, Volume 1, as contained in the
AirCHIEF (AIR Clearinghouse for Inventories and Emission Factors) CD-ROM (compact disk read only memory), US Environmental Protection Agency, Research Triangle Park, North Carolina.
17 Ibid Footnote 16. 18 Cachier H., Liousse P., Buat-Mernard P and Gaudichet A. (1995). Particulate content of savannah fire emissions.
Journal of Amos.chem, 22,123-148.
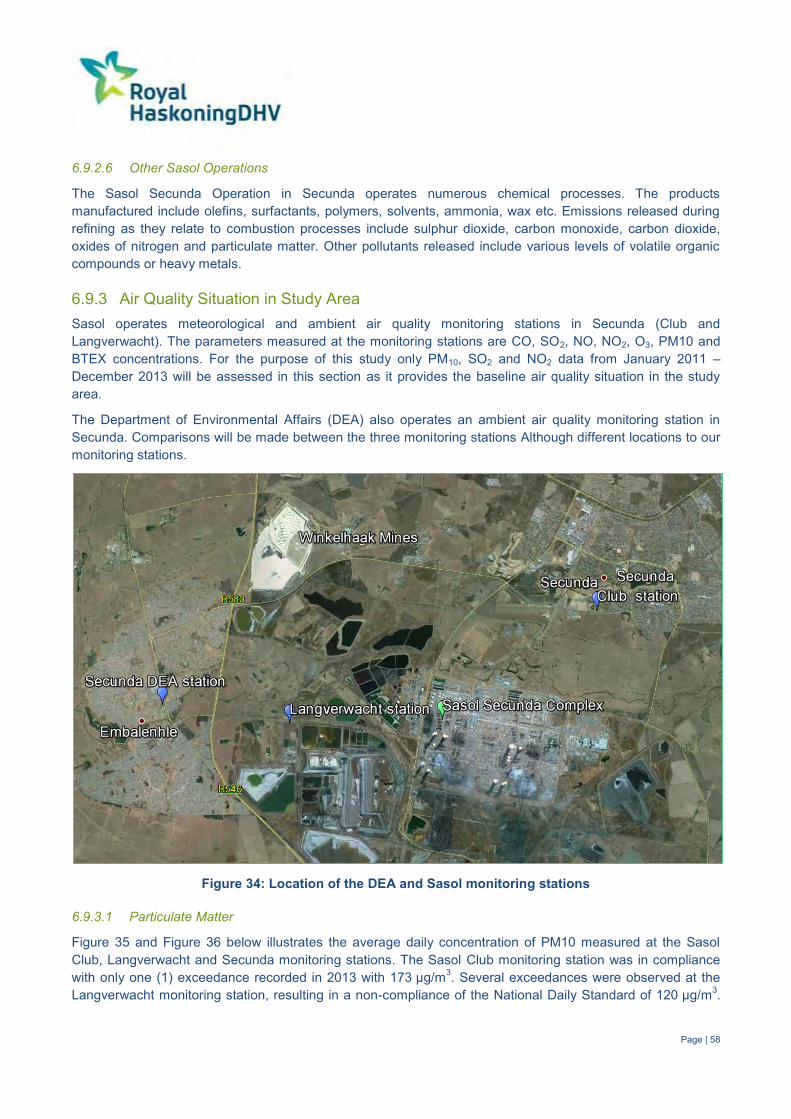
Page | 58
6.9.2.6 Other Sasol Operations
The Sasol Secunda Operation in Secunda operates numerous chemical processes. The products manufactured include olefins, surfactants, polymers, solvents, ammonia, wax etc. Emissions released during refining as they relate to combustion processes include sulphur dioxide, carbon monoxide, carbon dioxide, oxides of nitrogen and particulate matter. Other pollutants released include various levels of volatile organic compounds or heavy metals.
Air Quality Situation in Study Area 6.9.3Sasol operates meteorological and ambient air quality monitoring stations in Secunda (Club and Langverwacht). The parameters measured at the monitoring stations are CO, SO2, NO, NO2, O3, PM10 and BTEX concentrations. For the purpose of this study only PM10, SO2 and NO2 data from January 2011 – December 2013 will be assessed in this section as it provides the baseline air quality situation in the study area.
The Department of Environmental Affairs (DEA) also operates an ambient air quality monitoring station in Secunda. Comparisons will be made between the three monitoring stations Although different locations to our monitoring stations.
Figure 34: Location of the DEA and Sasol monitoring stations
6.9.3.1 Particulate Matter
Figure 35 and Figure 36 below illustrates the average daily concentration of PM10 measured at the Sasol Club, Langverwacht and Secunda monitoring stations. The Sasol Club monitoring station was in compliance with only one (1) exceedance recorded in 2013 with 173 µg/m3. Several exceedances were observed at the Langverwacht monitoring station, resulting in a non-compliance of the National Daily Standard of 120 µg/m3.
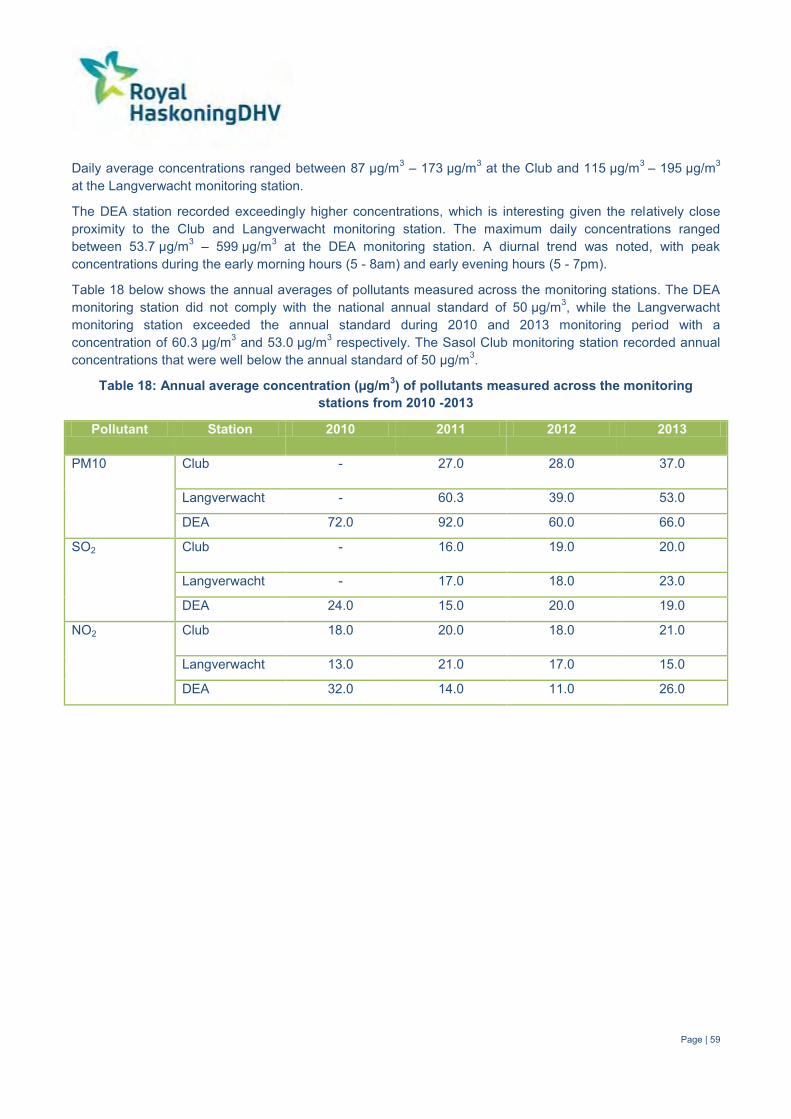
Page | 59
Daily average concentrations ranged between 87 µg/m3 – 173 µg/m3 at the Club and 115 µg/m3 – 195 µg/m3 at the Langverwacht monitoring station.
The DEA station recorded exceedingly higher concentrations, which is interesting given the relatively close proximity to the Club and Langverwacht monitoring station. The maximum daily concentrations ranged between 53.7 µg/m3 – 599 µg/m3 at the DEA monitoring station. A diurnal trend was noted, with peak concentrations during the early morning hours (5 - 8am) and early evening hours (5 - 7pm).
Table 18 below shows the annual averages of pollutants measured across the monitoring stations. The DEA monitoring station did not comply with the national annual standard of 50 µg/m3, while the Langverwacht monitoring station exceeded the annual standard during 2010 and 2013 monitoring period with a concentration of 60.3 µg/m3 and 53.0 µg/m3 respectively. The Sasol Club monitoring station recorded annual concentrations that were well below the annual standard of 50 µg/m3.
Table 18: Annual average concentration (µg/m3) of pollutants measured across the monitoring stations from 2010 -2013
Pollutant Station 2010 2011 2012 2013
PM10 Club - 27.0 28.0 37.0
Langverwacht - 60.3 39.0 53.0
DEA 72.0 92.0 60.0 66.0
SO2 Club - 16.0 19.0 20.0
Langverwacht - 17.0 18.0 23.0
DEA 24.0 15.0 20.0 19.0
NO2 Club 18.0 20.0 18.0 21.0
Langverwacht 13.0 21.0 17.0 15.0
DEA 32.0 14.0 11.0 26.0

Page | 60
Figure 35: Daily average PM10 concentrations (µg/m3) recorded at the Sasol Club and Langverwacht monitoring stations. The red line represents the daily average PM10 standard of 120 µg/m3
Figure 36: Daily average PM10 concentrations (µg/m3) recorded at the DEA monitoring station. The red line represents the daily average PM10 standard of 120 µg/m3

Page | 61
6.9.3.2 Sulphur Dioxide
The daily average SO2 concentrations generally falls below the National daily standard of 125 µg/m3, although concentrations do approach the standard on several occasions at both the Sasol Club and Langverwacht monitoring stations. The maximum daily concentration observed at the Sasol Club station ranged between 77 µg/m3 – 186 µg/m3 and 108 µg/m3 – 140 µg/m3 at the Langverwacht station (Figure 37).
The DEA monitoring station did not comply with the National daily standard of 125 µg/m3, as there were numerous exceedences observed (Figure 38). The maximum daily concentrations ranged between 232 µg/m3 – 635 µg/m3. It was observed that peak concentrations of daily SO2 were elevated during the morning hours (7:00 – 10:00) and early afternoon periods (13:00 -17:00). This signature is indicative of industrial sources such as stacks in which pollutants are emitted well above the surface inversion layer, which forms during the night. As a result, pollutants are unable to move to the surface during the night. After sunrise, convection mixing is initiated and the surface inversion breaks down, allowing pollutants to be transported to ground level.
The annual averages recorded across the monitoring stations are presented in Table 18 below. All monitoring stations complied with the National annual standard of 50 µg/m3.
Figure 37: Daily average SO2 concentrations (µg/m3) recorded at the Sasol Club and Langverwacht monitoring stations. The red line represents the daily average SO2 standard of 125 µg/m3

Page | 62
Figure 38: Daily average SO2 concentrations (µg/m3) recorded at the DEA monitoring station. The red line represents the daily average SO2 standard of 125 µg/m3
6.9.3.3 Nitrogen Dioxide
The maximum hourly NO2 concentrations recorded at the Sasol Club and Langverwacht monitoring stations is illustrated in Figure 39 below. The Club monitoring station recorded 6 hourly exceedance, while the Langverwacht station recorded two (2) exceedances. The maximum peak concentration recorded at the Sasol Club station ranged between 193 µg/m3 – 375 µg/m3, while 169 µg/m3 – 216 µg/m3 was recorded at the Langverwacht station.
Lower NO2 concentrations were recorded at the Secunda monitoring station (refer to Figure 40). Five (5) exceedences were observed during the 2010 – 2013 monitoring period. Overall the hourly average concentrations of NO2 were compliant with the hourly standard of 200 µg/m3.
All monitoring stations recorded annual NO2 concentrations that were well below the annual standard of 40 µg/m3.

Page | 63
Figure 39: Hourly average NO2 concentration (µg/m3) recorded at the Sasol Club and Langverwacht monitoring stations. The red line represents the daily average NO2 standard of 200 µg/m3
Figure 40: Hourly average NO2 concentration (µg/m3) recorded at the DEA monitoring station. The red line represents the daily average NO2 standard of 200 µg/m3

Page | 64
6.9.3.4 Health and Nuisance evaluation criteria
Table 19 below summarises the USEPA and California guidelines for pollutants anticipated to be released in this study. This list of pollutants will be finalised with more information during the impact assessment phase.
Table 19: Ambient air quality guidelines applicable to the study
Pollutant Averaging period US EPA (µg/m3) (µg/m3)
California (µg/m3)
RSA (µg/m3)
Ammonia Hourly average - - -
Annual average 100 - -
Hydrogen Sulphide
30 minute average 7 - -
Hourly average - 42 -
Daily average 150 - -
Annual average - 10 -
Acetone Hourly average - - -
Annual average - - -
Benzene Hourly average - - -
Annual average - - 5
Chloroform Hourly average - 150 -
Annual average - 300 -
Methanol Hourly average - 28000 -
Annual average - 4000 -
Phenol Hourly average - 5800 -
Annual average - 200 -
Toulene Hourly average - 37000 -
Annual average 5000 300 -
6.9.3.5 Odour
Odour thresholds are defined in several ways including absolute perception thresholds, recognition thresholds and objectionability thresholds. At the perception threshold, one is barely certain that an odour is detected but it is too faint to identify further. Recognition thresholds are normally given for 50% and 100% recognition by an odour panel. The acute WHO guideline values given for odourants most frequently represent odour limits rather than health risk thresholds as indicated in Table 20.
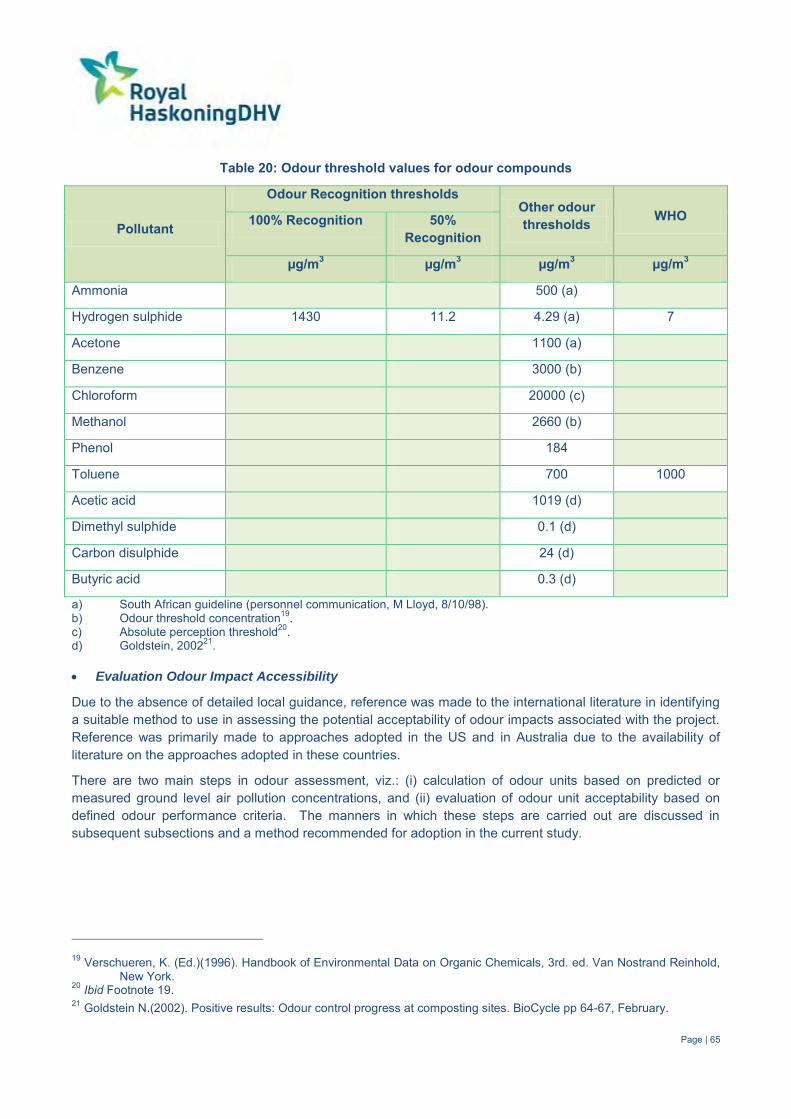
Page | 65
Table 20: Odour threshold values for odour compounds
Pollutant
Odour Recognition thresholds Other odour thresholds WHO 100% Recognition 50%
Recognition
µg/m3 µg/m3 µg/m3 µg/m3
Ammonia 500 (a)
Hydrogen sulphide 1430 11.2 4.29 (a) 7
Acetone 1100 (a)
Benzene 3000 (b)
Chloroform 20000 (c)
Methanol 2660 (b)
Phenol 184
Toluene 700 1000
Acetic acid 1019 (d)
Dimethyl sulphide 0.1 (d)
Carbon disulphide 24 (d)
Butyric acid 0.3 (d)
a) South African guideline (personnel communication, M Lloyd, 8/10/98). b) Odour threshold concentration19. c) Absolute perception threshold20. d) Goldstein, 200221. Evaluation Odour Impact Accessibility
Due to the absence of detailed local guidance, reference was made to the international literature in identifying a suitable method to use in assessing the potential acceptability of odour impacts associated with the project. Reference was primarily made to approaches adopted in the US and in Australia due to the availability of literature on the approaches adopted in these countries.
There are two main steps in odour assessment, viz.: (i) calculation of odour units based on predicted or measured ground level air pollution concentrations, and (ii) evaluation of odour unit acceptability based on defined odour performance criteria. The manners in which these steps are carried out are discussed in subsequent subsections and a method recommended for adoption in the current study.
19 Verschueren, K. (Ed.)(1996). Handbook of Environmental Data on Organic Chemicals, 3rd. ed. Van Nostrand Reinhold,
New York. 20 Ibid Footnote 19. 21 Goldstein N.(2002). Positive results: Odour control progress at composting sites. BioCycle pp 64-67, February.

Page | 66
Odour Unit Calculation
The detectability of an odour is a sensory property that refers to the theoretical minimum concentration that produces an olfactory response or sensation. This point is called the odour thresholds and defines one odour unit per cubic metre (OU/m³) i.e. the odour unit is the concentration of a substance divided by the odour threshold for that substance or the number of dilutions required for the sample to reach the threshold. This threshold is typically the numerical value equivalent to when 50% of a testing panel correctly detect an odour. Therefore, an odour criterion of less than 1 OU/m³ would theoretically result in no odour impact being experienced.
Different states in the US and Australia apply varying methodologies in the calculation of odour units and also differ in their selection of suitable detection limits. Examples of such differences include the following:
Averaging periods - the New South Wales (NSW) EPA (2001b)22 and Victoria EPA recommend the use of 3-minute average air pollution concentrations in OU calculation, whereas the Draft Queensland EPA (1999) guideline refers to 1-hour averages.
Percentiles - the NSW EPA (2001b)23 specify the use of the 99.9th percentile when selecting 3-minute averaging air pollutant concentrations to be used in OU calculation given a “level 3” assessment. The Queensland and Victoria EPAs both recommend that the 99.5th percentile be used.
Detection Limits (Refer to detection by human olfactory system) - the NSW EPA includes odour detection levels in a Technical Note as the basis for the calculation of odour units. These detection levels were found to be very low in certain instances representing the lower bounds of the detection range. The California Air Resources Board (CARB) refers to a detection range and specifies the use of the geometric mean for use as a detection threshold for use in odour unit estimation. For example, for hydrogen sulphide, the NSW EPA detection limit is given as 0.14 µg/m³, whereas the CARB recognise a detection range of 0.098 µg/m³ to 1960 µg/m³ but specify the use of the geometric mean which is 11.2 µg/m³ (0.008 ppm).
Odour Performance Criteria
In practice, the character of a particular odour can only be judged by the receiver’s reaction to it, and preferably only compared to another odour under similar social and regional conditions. The NWS EPA, having referred to the literature in its determining the level at which an odour is perceived to be of nuisance, gives this level as ranging from 2 OU/m³ to 10 OU/m³ depending on a combination of the following factors:
Odour Quality – whether the odour results from a pure compound or from a mixture of compounds (Pure compounds tend to have a higher threshold, lower offensiveness than a mixed compound).
Population Sensitivity - any given population contains individuals with a range of sensitivities to odour. The larger the population, generally the greater the number of sensitive individuals contained.
Background Level - refers to the likelihood of cumulative odour impacts due to the co-location of sources emitting odours.
Public expectation - whether a given community is tolerant of a particular type of odour and does not find it offensive. Background agricultural odours may, for example, not be considered offensive until a higher threshold is reached whereas odours from a waste disposal site or chemical facility may be considered offensive at lower thresholds.
Source Characteristics – emissions from a point source are more easily controlled than those that are diffused, e.g.: waste disposal sites.
22 NSW EPA (2001b). Draft Policy: Assessment and Management of Odour from Stationary Sources in NSW, New South
Wales Environment Protection Authority, Sydney. 23 Ibid Footnote 22.

Page | 67
Health Effects – whether a particular odour is likely to be associated with adverse health effects. In general, odour from an agricultural operation is less likely to present a health risk than emissions from a waste disposal or chemical facility.
Experience gained in NSW through odour assessments for proposed and existing facilities has indicated that an odour performance criterion of 7 OU/m³ is likely to represent the level below which “offensive” odours should not occur for an individual with a “standard sensitivity” to odours.
The NSW EPA policy therefore recommends that, as design criteria, no individual be exposed to ambient odour levels of greater than 7 OU/m3. Where a number of the factors listed above simultaneously contribute to making an odour ‘offensive’, odour criteria of 2 OU/m3 at the nearest sensitive receptor (existing or any likely future receptor) is appropriate. This is given as generally occurring for affected populations equal to or above 2000 people. A summary of the NSW EPA’s odour performance criteria for various population densities is shown in Table 21 below.
Table 21: NSW EPA odour performance criteria defined based on population density (NSW EPS, 2001a)
Population of Affected Community Odour performance criteria (odour units/m³) (a)
Urban area (>2000) 2.0 500 – 2000 3.0
125 – 500 4.0
30 – 125 5.0
10 – 30 6.0
Single residences (2) 7.0
a) The NSW EPA indicates that these should be regarded as interim criteria to be refined over time through experience and case studies. The EPA makes provision for the future updating of the odour performance criteria as new industry-specific research is completed, with the acceptable procedure for developing future criteria being outlined in a Technical Note.
The odour performance criteria specified by the NSW EPA is compared to that used in other jurisdictions is presented in Table 22 below. It is evident that the odour performance criteria range specified by the NSW EPA includes the criteria stipulated in various other jurisdictions. The exception being the South Coast Air Quality Management District in the US which permits odour units of up to 10 OU in certain instances.
Table 22: Odour performance criteria used in various jurisdiction in the US and Australia (after NSW EPA, 2001b)
Jurisdiction Odour Performance
Criteria (given for application to odour units) (OU)
New South Wales EPA (NSW EPA, 2001a, 2001b) 2 to 7
California Air Resources Board (Amoore, 1999) 5
South Coast Air Quality Management District (SCAQMD) (CEQA, 1993) 5 to 10
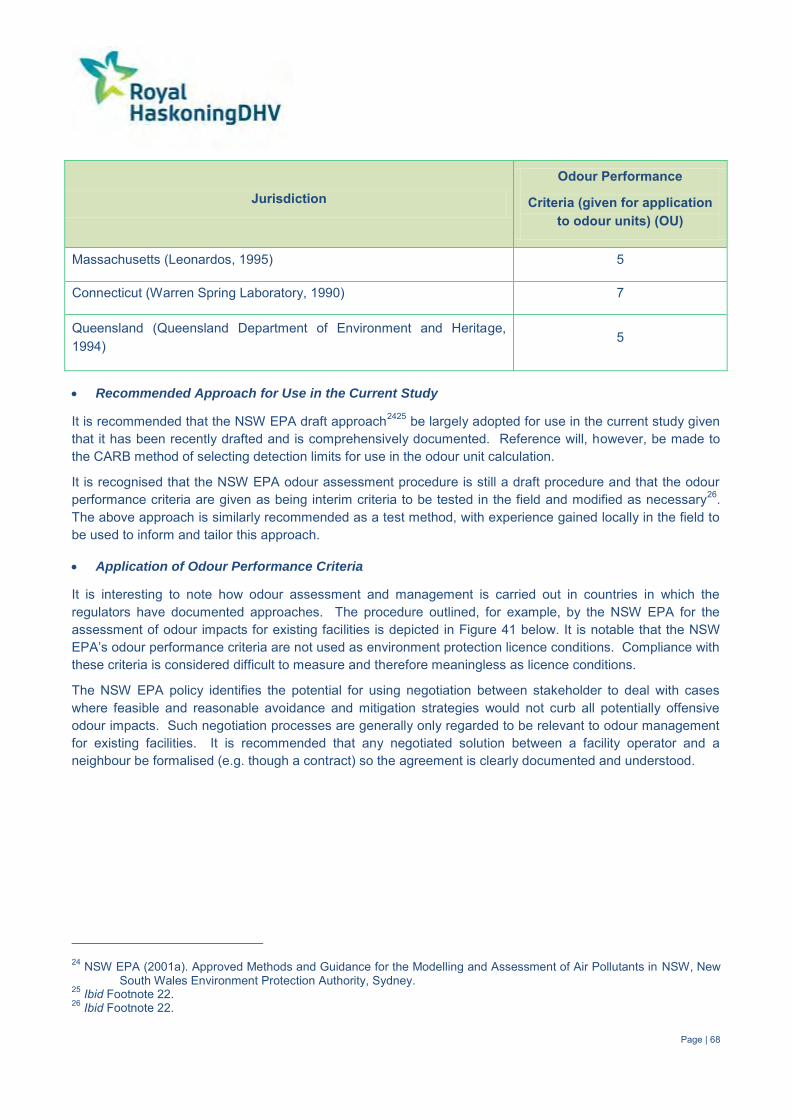
Page | 68
Jurisdiction Odour Performance
Criteria (given for application to odour units) (OU)
Massachusetts (Leonardos, 1995) 5
Connecticut (Warren Spring Laboratory, 1990) 7
Queensland (Queensland Department of Environment and Heritage, 1994)
5
Recommended Approach for Use in the Current Study
It is recommended that the NSW EPA draft approach2425 be largely adopted for use in the current study given that it has been recently drafted and is comprehensively documented. Reference will, however, be made to the CARB method of selecting detection limits for use in the odour unit calculation.
It is recognised that the NSW EPA odour assessment procedure is still a draft procedure and that the odour performance criteria are given as being interim criteria to be tested in the field and modified as necessary26. The above approach is similarly recommended as a test method, with experience gained locally in the field to be used to inform and tailor this approach.
Application of Odour Performance Criteria
It is interesting to note how odour assessment and management is carried out in countries in which the regulators have documented approaches. The procedure outlined, for example, by the NSW EPA for the assessment of odour impacts for existing facilities is depicted in Figure 41 below. It is notable that the NSW EPA’s odour performance criteria are not used as environment protection licence conditions. Compliance with these criteria is considered difficult to measure and therefore meaningless as licence conditions.
The NSW EPA policy identifies the potential for using negotiation between stakeholder to deal with cases where feasible and reasonable avoidance and mitigation strategies would not curb all potentially offensive odour impacts. Such negotiation processes are generally only regarded to be relevant to odour management for existing facilities. It is recommended that any negotiated solution between a facility operator and a neighbour be formalised (e.g. though a contract) so the agreement is clearly documented and understood.
24 NSW EPA (2001a). Approved Methods and Guidance for the Modelling and Assessment of Air Pollutants in NSW, New
South Wales Environment Protection Authority, Sydney. 25 Ibid Footnote 22. 26 Ibid Footnote 22.

Page | 69
Figure 41: Odour impact assessment procedure stipulated by the New South Wales Environmental Protection Agency for existing facilities27
27 Ibid Footnotes 22 and 24.

Page | 70
As anticipated from the majority of composting facilities, globally, odour and dust is expected to be the major airborne pollutants that would cause future impacts on the surrounding environment. These airborne pollutants must be compared to the relevant airborne pollutant standard and guideline (Table 23). The whole list of criteria pollutants listed in the South African National Ambient Air Quality Standards will not be applicable, however the annual benzene concentration will be used in the dispersion modelling to assess whether benzene released from the process will be compliant or not.
Table 23: Project specific ambient air quality and odour standards and guidelines
Airborne Pollutant Averaging Period Concentration Allowable frequency of exceedences
PM10 Daily Annual
75 40
4 0
PM2.5 Daily Annual
65 / 40a 25 / 20a
4 0
Benzene Annual 5 µg/m3 (1.6 ppb)
0
Odour Compounds
Ammonia Threshold 500 n/a Hydrogen Sulphide Threshold 4.29 n/a Acetone Threshold 1100 n/a Benzene Threshold 3000 n/a Chloroform Threshold 20000 n/a Methanol Threshold 2660 n/a Phenol Threshold 184 n/a Toluene Threshold 700 n/a Acetic Acid Threshold 1019 n/a Dimethyl sulphide Threshold 0.1 n/a Carbon disulphide Threshold 24 n/a Butyric acid Threshold 0.3 n/a a – Standard to come into effect from 01 January 2016.

Page | 71
Noise 6.10The study area is generally quiet as it is relatively far from the main roads and the Sasol Secunda Operations. Most of the study area has a typical rural noise climate / profile.
Health and Safety 6.11The nature of Sasol’s business brings with it substantial inherent safety, health and environmental (SH&E) risks. Sasol’s Safety and Health Essential Requirements are compulsory and applicable to all new projects such as the full-scale composting of sludge waste streams project.
In addition, the project will have a fully Integrated Electronic Safety System i.e. the NOSA Miracles System is currently deployed and files are at the SFM Offices.
Heritage 6.12
Regional Overview 6.12.1
6.12.1.1 Stone Age
Although stone tools occur sporadically all over, these are surface occurrences and have a low significance. No stratified sites are known to occur in the region of the study area. During this period, people had more advanced technology than the preceding MSA people and therefore succeeded in occupying even more diverse habitats. Also, during this time there is evidence of people’s activities derived from material other than stone tools. Ostrich eggshell beads, ground bone arrowheads, small bored stones and wood fragments with incised markings are traditionally linked with the Late Stone Age. The Late Stone Age people have also left us with a rich legacy of rock art, which is an expression of their complex social and spiritual beliefs.
6.12.1.2 Iron Age
Iron Age people started to settle in southern Africa c. AD 300, with one of the oldest known sites at Broederstroom south of Hartebeespoort Dam dating to AD 470. Having only had cereals (sorghum, millet) that need summer rainfall, Early Iron Age people did not move outside this rainfall zone, and neither did they occupy the central interior Highveld area.
Because of their specific technology and economy, Iron Age people preferred to settle on the alluvial soils near rivers for agricultural purposes, but also for firewood and water.
The occupation of the larger geographical area (including the study area) did not start much before the 1500s. By the 16th century things changed, with the climate becoming warmer and wetter, creating conditions that allowed Late Iron Age (LIA) farmers to occupy areas previously unsuitable, for example the Witwatersrand, the Mpumalanga Highveld and the treeless plains of the Free State. Various sites dating to this period, all located in the study area, have been investigated, e.g. Taylor 28 and Pelser et al29.
28 Taylor, M.O.V. (1979). Wildebeestfontein: a Late Iron Age site in the southeastern Transvaal. In Van der Merwe, N.J. &
Huffman, T.N. (eds.) Iron Age studies in Southern Africa. Goodwin Series No. 3. Cape Town: South African Archaeological Society. Pp. 120-129.
29 Pelser, A., Van Schalkwyk, J.A., Teichert, F. & Masiteng, I. (2007). The archaeological investigation of an Iron Age site on the farm Rietfontein 101IS, Emalahleni district, Mpumalanga Province. NCHM Research Journal 2:1-24.
Page | 72
This wet period came to a sudden end sometime between 1800 and 1820 by a major drought lasting 3 to 5 years. The drought must have caused an agricultural collapse on a large, subcontinent scale.
This was also a period of great military tension. Military pressure from Zululand spilled onto the Highveld by at least 1821. Various marauding groups of displaced Sotho-Tswana people moved across the plateau in the 1820s. Mzilikazi raided the plateau extensively between 1825 and 1837. The White settlers trekked into this area in the 1830s.
6.12.1.3 Historic Period
White settlers moved into the area during the first half of the 19th century. They were largely self-sufficient, basing their survival on cattle/sheep farming and hunting. Few towns were established and it remained an undeveloped area until the discovery of coal and later gold. During the Anglo-Boer War, a number of skirmishes occurred in the larger area. One of the last major battles that took place was at Bakenlaagte on 30th October 1901 and included the farms Nooitgedacht, Bakenlaagte, Kruisementfontein and Onverwacht. The main battle was preceded by a few days of the Boer forces harassing the British forces on their march to the east. The main opposing forces were the British No. 3 column under the command of Colonel George E. Benson, and the Boer Commandos under the command of Commandant Hansie Grobler of Bethal. Colonel Benson and the 73 other British soldiers who died were first buried here, but later they were reburied in the Primrose Cemetery in Germiston. The Boer forces lost 44 men during this action.
Identified Historical Sites in Study Area 6.12.2 Goedehoop Site No sites, features or objects dating to the Stone Age were found. No sites features or objects dating to the Iron Age were found. No sites features or objects dating to the Historic Period were found.
Grootvlei Site
No sites, features or objects dating to the Stone Age were found No sites features or objects dating to the Iron Age were found. No sites features or objects dating to the Historic Period were found.
Road Network 6.13The Goedehoop site can be accessed from the D2183 whilst the Grootvlei site can be accessed from the D772 (Figure 42).

Page | 73
Figure 42: Road network around the Goedehoop and Grootvlei sites

Page | 74
7 POTENTIAL IMPACTS ASSOCIATED WITH THE PROJECT
This Environmental Scoping Study (ESS) aims to identify the potential positive and negative impacts (both biophysical and social) associated with the proposed project. The following potential impacts have been identified for both sites i.e. Goedehoop and Grootvlei.
Construction Phase 7.1Table 24: Potential construction phase impacts
Affected Environment Potential Impact
Soils Removal and compaction of soil during construction activities. Erosion, degradation and loss of topsoil due to construction activities
as well as surface and stormwater run-off. Contamination of soils due to spillage, leakage, incorrect handling of
fuel and other hazardous materials. Geohydrology (groundwater) Contamination of groundwater due to spillage, leakage, and incorrect
handling of fuel and other hazardous materials. This potential impact is applicable to both sites.
Hydrology (surface water features including wetlands)
Irresponsible construction practices could lead to the pollution of wetlands and spruits (e.g. faecal contamination due to inadequate ablution facilities, or pollution of surface water through fuel/oil and diesel spillages).
Poor stormwater management could lead to the siltation of surface water features.
Decreased infiltration and increased surface water run-off due to soil compaction by heavy machinery.
Increased siltation of surface water resources due to soil erosion during flooding.
Ecology Geodehoop site Removal of high sensitivity vegetation i.e. Moist Soweto Highveld
Grassland for the construction of the composting facility. Grootvlei site Removal of medium sensitivity vegetation i.e. Degraded Soweto
Highveld Grassland for the construction of the composting facility. The following potential impacts are associated with both the Geodehoop and Grootvlei sites:
Impact on the remaining (albeit limited) faunal component, residing in or utilising the transformed agricultural lands on the site.
Alteration of the transformed agricultural lands will directly, and indirectly, impact on the smaller sedentary species (insects, arachnids, reptiles, amphibian and mammals) adapted to their ground dwelling habitats.
Construction machinery, vehicles and the anticipated increased human activity, will most likely directly and indirectly result in the short and long-term alteration of the faunal composition of the site.
Disruption in faunal (i.e. the Giant Bullfrog) migratory routes due

Page | 75
Affected Environment Potential Impact
to the erection of fences. Disruption of natural faunal cycles, such as the reproductive cycle
and foraging behaviour due to artificial lighting. Social Labour will be sourced locally as far as possible for farming and
composting operations. Air Quality Potential air pollution due to vehicle movement within the composting
plant area. Dust generation due to set up and removal of construction equipment;
and truck transport. Noise Noise will be generated during the construction phase at both sites;
however with the appropriate mitigation measures in place the impact will be minimal.
Traffic Increased traffic due to construction activities.
Waste General waste generated on both sites includes domestic waste and small amounts of building rubble. General waste will not have a significant impact on the environment provided that the waste is correctly disposed of.
Hazardous waste will be generated through the spillage of oil/diesel/chemicals used during construction. All material cleared after a spillage must be treated as hazardous waste and disposed of at a hazardous waste disposal site.
Heritage No sites, features or objects of cultural significance are known to exist on either the Goedehoop or Grootvlei sites. Should any heritage artefacts be exposed during excavation/construction activities, work on the area where the artefacts were discovered, shall cease immediately and the responsible person shall be notified as soon as possible.
Health and Safety Potential health and safety impacts during construction. The project has a fully Integrated Electronic Safety System - The NOSA Miracles System is currently deployed and files are at the SFM Offices.
Operational Phase 7.2Table 25: Potential operational phase impacts
Affected Environment Potential Impact
Soils Potential contamination of soils due to spillage of sludge during the pumping of the sludge into the windrow bunkers.
Improper management of the leachate and run-off from the composting facility could potentially contaminate soils.
Potential contamination of soils due to windrow bunker wall failure. Geohydrology (groundwater) Contamination of groundwater due to leaching of heavy metals and
hydrocarbons from the windrows. Improper design of the leachate barrier system (liner) could provide a
pathway for the contamination of the groundwater resources. Potential contamination of groundwater due to windrow bunker wall
failure. Hydrology (surface water and
wetlands) Improper stormwater and leachate management during the
operational phase could lead to contamination of surface water resources.

Page | 76
Affected Environment Potential Impact
Poor stormwater management could lead to the siltation of surface water features.
Spillage of sludge during the handling and treatment process could result in contaminated run-off entering surface water resources.
Potential contamination of surface water feature due to windrow bunker wall failure.
Social It is anticipated that 150 new jobs will be created during operation as the composting process is labour intensive.
Beneficiation of industrial waste streams through composting that was previously incinerated or disposed at landfills.
Air Quality Odours and emissions from the composting and agricultural processes.
Indirect positive impact on air quality due to the industrial waste streams being beneficiated into compost rather than being incinerated at the Secunda plant or disposed of at landfill.
Waste Generation of general and hazardous waste during operation activities.
Traffic Impact of trucks transporting sludge to the composting facility. It is estimated 5 to 10 trucks per day for every 100 000 ton of sludge.
Decommissioning Phase 7.3At this point of the project planning process, the necessity for and timing of decommissioning of the proposed project is not known. However, like construction impacts, decommissioning impacts are inherently temporary in duration. Impacts relating to decommissioning and rehabilitation activities (demolition, landscaping, compaction etc.) will be addressed within the EIA phase and in the EMPr.
Cumulative Impacts 7.4Cumulative impacts associated with the project will be further investigated in detail during the EIA study.
Page | 77
8 CONCLUSIONS AND RECOMMENDATIONS This ESS for the full-scale composting of sludge waste streams project has been undertaken in accordance with the Environmental Impact Assessment Regulations (2010) published in Government Notices R. 543 of 18 June 2010 read with Section 44, of the National Environmental Management Act, 1998 (Act No. 107 of 1998).
In line with Regulation 28 (Part 3) of the EIA Regulations, this issues-based ESS aimed to identify and provide:
A description of the proposed activity; A description of the environment that may be affected by the activity and the manner in which the
physical, biological, social, and economic aspects of the environment may be affected by the proposed activity;
The identification of all legislation and guidelines applicable to the development; A description of environmental issues and potential impacts, including cumulative impacts, that have been
identified; Details of the public participation process conducted to date; and A Plan of Study for Environmental Impact Assessment (refer to Chapter 9) including the methodology that
will be adopted in assessing the potential impacts that have been identified, including specialist studies or specialised processes that will be undertaken.
Based on the ESS undertaken, it can be concluded that there are no fatal flaws associated with the project. Potential environmental impacts have been identified and will be further investigated in the EIA phase. The methodology that will be used for assessment of potential significant impacts is contained in Chapter 9 (Plan of Study for EIA).
Both sites can be used for the development for the composting facility however, based on the Scoping Phase assessment, the Grootvlei site is preferred over the Goedehoop site as the Goedehoop site has a large valley-bottom wetland located on the southern portion of the site and the Moist Soweto Highveld Grassland located in the north-western and southern sections of the site is regarded as highly sensitive due to its water storing capacity and the fauna that it supports.

Page | 78
9 PLAN OF STUDY FOR ENVIRONMENTAL IMPACT ASSESSMENT
Potential environmental impacts (biophysical and social) associated with the proposed project have been identified in the ESS. No fatal flaws have been identified to date. All potentially significant and cumulative impacts will be further investigated and assessed within the EIA phase of the project. Mitigation measures will be contained in the EMPr to be compiled during the EIA phase.
The EIA phase will aim to adequately assess and address all potentially significant environmental issues in order to provide the Mpumalanga Department of Agriculture, Rural Development, Land and Environmental Affairs (MDARDLEA) and Department of Environmental Affairs (DEA) with sufficient information to make an informed decision regarding the proposed project.
Approach to Undertake the EIA Phase of the Project 9.1The following points below outline the proposed approach to undertaking the EIA phase of the project. It is believed that the proposed approach will adequately fulfil the competent authorities’ (MDARDLEA and DEA) requirements, the requirements of the EIA Regulations (2010) and the objectives of environmental best practice, so as to ensure transparency and to allow an informed decision regarding the project to be made.
Authority Consultation 9.1.1Ongoing consultation with MDARDLEA, DEA, the Govan Mbeki Local Municipality, Ward Councillors, and all other authorities identified during the ESS phase of the project (and further ones that may be identified during the EIA phase) will continue throughout the duration of the project. Authority consultation is therefore seen as a continuous process that takes place until completion of the environmental investigations.
Aims of the Environmental Impact Assessment 9.1.2The EIA will aim to achieve the following:
To supplement, where necessary, the assessment of the social and biophysical environments affected by the development;
To assess impacts on the study area in terms of environmental criteria; To identify and recommend appropriate mitigation measures for potentially significant environmental
impacts; To complete an EMPr for the inclusion of proposed mitigation measures; and To undertake a fully inclusive public participation process to ensure that I&AP issues and concerns are
recorded and addressed.
Detailed Studies to be undertaken in the EIA Phase – Specialist Studies 9.1.3The following specialist studies have been commissioned and will play a crucial role in the EIA process.
9.1.3.1 Geohydrology
The following activities are planned to finalise the input into the EIA study and EMPr.
Risk and Impact Assessment including mitigation measures. Proposed monitoring plan.

Page | 79
9.1.3.2 Hydrological Assessment
The following activities are planned to finalise the input into the EIA study and EMPr.
Stormwater Management Plan for the full-scale composting facility - the impact that the proposed development is likely to have on the hydrology and surface water resources in the area will depend largely on the design and implementation of a comprehensive Storm Water Management Plan (SWMP) that should, at least, follow the principles of the regulations contained in General Notice 704 of the National Water Act (No 36 of 1998). The purpose of a SWMP is to prevent the pollution of water resources in and around the study site. The SWMP will have the following deliverables: Determination of impact of all infrastructure on the Mean Annual Run-off; Determine the stormwater flows and volumes (1:50- and 1:100-year events) for both clean and dirty
water areas; Indicate the placement of berms, channels and pollution control dams on a map; Conceptual designs for the proposed infrastructure and The dirty water storage requirements to prevent spillage of not more than once, on average in 50
years and to comply with GN 704.
The SWMP will be designed using the DWA BPG G1: Storm Water Management30 as guideline.
Water Balance - accurate water balances are considered to be one of the most important and fundamental water management tools. The purpose of water balances includes31: Providing the necessary information that will assist in defining and driving water management
strategies; Auditing and assessment of the water reticulation system, with the main focus on water usage and
pollution sources. This includes identifying and quantifying points of high water consumption or wastage, as well as pollution sources. Seepage and leakage points can also be identified and quantified when the balances are used as an auditing and assessment tool;
Assisting with the design of storage requirements and minimising the risk of spillage; Assisting with the water management decision-making process by simulating and evaluating various
water management strategies before implementation.
The water balance will be determined using the standard DWA methodology32and will have the following deliverables:
A water process flow diagram; Formatting of the water balance into the required DWA format.
Monitoring Plan - water monitoring is a legal requirement and can be used in negotiations with authorities for permits. The most relevant environmental management actions require data and thus the objectives of water monitoring include the following33 Generation of baseline/background data before production commences; Identification of sources of pollution and extent of pollution (legal implications or liabilities associated
with the risks of contamination moving off site);
30 Department of Water Affairs. (2006a). Best Practice Guidelines for Water Resources Protection in the South African
Mining Industry. BPG G1: Storm Water Management. Pretoria: Department of Water Affairs. 31 Department of Water Affairs. (2006b). Best Practice Guidelines for Water Resources Protection in the South African
Mining Industry. BPG G2: Water and Salt Balances. Pretoria: DWA. 32 Ibid Footnote 31. 33 DWA. (2006c). Best Practice Guidelines for Water Resources Protection in the South African Mining Industry. BPG G3.
Water Monitoring Systems. Pretoria: DWA.

Page | 80
Monitoring of water usage by different users (control of cost and maximizing of water reuse); Assessment of impact on receiving water environment.
The water monitoring programme will be developed using the standard DWA methodology34 and will have the following deliverables:
Developing of a monitoring plan including sampling locations, elements to be analysed and sampling frequency.
The water monitoring programme will be designed according to the DWA BPG G335 as guideline.
9.1.3.3 Soils Assessment
The ARC-Institute for Soil, Climate and Water will undertake a detailed survey of the soils affected by the proposed project. The aim of the survey is to assess the soils occurring at the sites, to assess the agricultural potential and the potential impacts on the soil resource and propose mitigation measures to reduce or eliminate the identified impacts.
9.1.3.4 Ecological Assessment
More intensive vegetation and faunal surveys will be undertaken during the current 2015 wet season with focus on the remaining open moist grassland and valley bottom wetlands. These surveys will result in a more comprehensive species lists pertaining to the vegetation and faunal composition on the proposed site and more site specific mitigatory measures in order to ameliorate potential impacts of the project.
9.1.3.5 Air Quality Assessment
The proposed methodology which will be followed during the impact assessment phase is provided below:
The assessment which will be carried out is a Level 2 assessment which is in line with the objective of the study. Level 2 assessments are used for air quality impact assessments where:
The distribution of pollutant concentration and disposition are required in time and space.
The respective dispersion modelling can be treated by a steady state Gaussian plume model with first order chemical transformation.
Emissions assessed are from sources where the greatest impacts are in the order of a few kilometres (less than 50 km) downwind.
The model which will be used in the impact assessment is AERMOD, a state-of-the-art Planetary Boundary Layer (PBL) air dispersion model, was developed by the American Meteorological Society and USEPA Regulatory Model Improvement Committee (AERMIC). AERMOD is a steady-state plume dispersion model for stimulating transport and dispersion from point, area or volume sources based on an up to date characterization of the atmospheric boundary layer. AERMOD utilizes a similar input and output structure to ISCST3 and shares many of the same features, as well as offering additional features. AERMOD fully incorporates the PRIME building downwash algorithms, advanced depositional parameters, local terrain effects, and advanced meteorological turbulence calculations.
The AERMOD atmospheric dispersion modelling system is an integrated system that includes three modules:
Steady-state dispersion model designed for short-range (up to 50 km) dispersion of air pollutant emissions from stationary industrial sources.
34 Ibid Footnote 31. 35 Ibid Footnote 33.

Page | 81
A meteorological data pre-processor (AERMET) for surface meteorological data, upper air soundings, and optionally, data from on-site instrument towers. It then calculates atmospheric parameters needed by the dispersion model, such as atmospheric turbulence characteristics, mixing heights, friction velocity, Monin-Obukov length and surface heat flux.
A terrain pre-processor (AERMAP) which provides a physical relationship between terrain features and the behaviour of air pollution plumes. It generates location and height data for each receptor location. It also provides information that allows the dispersion model to simulate the effects of air flowing over hills or splitting to flow around hills.
The input requirements for AERMOD includes meteorological and emission source data. Meteorological data which includes wind speed, wind direction, average temperature, barometric pressure, relative humidity, average precipitation, cloud cover and ceiling height was obtained from the South African Weather Services for the period January 2010 – December 2013 from the DEA monitoring station (refer to Section 6.9.3 for the evaluation of meteorological data). AERMOD incorporates AERMET which uses a standard meteorological measurements and surface parameters representative of the modelling domain to compute boundary layer parameters used to estimate profiles of wind, turbulence and temperature used by AERMOD36.
The emissions inventory will need to be developed to determine the emission generated from each source. The inventory will be developed based on the composting process with the associated volumes and composition to be provided by the client. Odorous and particulate emission will be assessed as the main pollutants of concern. The calculated emission rates and source characteristics of each area source will input into AERMOD view dispersion model to predict the off-site air quality impacts.
The emissions in relation to each identified sensitive receptor will assessed. A thorough review of the existing baseline condition was carried out in the Scoping phase. The validated
data was obtained from the DEA monitoring station and two of Sasol’s long term monitoring stations which provides an adequate representation of the background concentrations from significant background sources. The intent is to compare the existing ambient air quality to the cumulative impact of new emissions.
Once dispersion modelling is carried out, comparisons will be made to both locally and internationally available health risk levels for these pollutants. Nuisance odour assessment will also be assessed based on the respective US- EPA guidelines.
Impact results will be presented in the forms of Isopleths plots which reflect the gridded contours of zones of impact at various distances from the contributing source. The dispersion patterns which will be generated by the contours will be a representation of the maximum predicted ground level concentration for the period being assessed.
Information gaps within the air quality assessment will be identified including mass balance. Consolidation of a draft and then final Air Impact Report (AIR) will be done which assesses the air quality
impacts associated with the composting of sludge waste streams.
9.1.3.6 Heritage
A full Phase 1 archaeological survey of the study area in accordance with the requirements of Section 38(3) of the National Heritage Resources Act (No 25 of 1999) will be conducted in the EIA phase for the Goedehoop site. Site-specific, detailed management and mitigation measures will furthermore be compiled for inclusion in the Environmental Management Programme (EMPr). The study should provide a map of the identified archaeological artefacts as well as a report detailing the finding of the study, and mitigation of any impacts.
36 Department of Environmental Affairs (2014). National Environmental Management: Air Quality Act (Act No 39 of 2004)
Regulations Regarding Air Dispersion Modelling.
Page | 82
Impact Assessment Methodology 9.1.4The potential environmental impacts associated with the project will be evaluated according to it nature, extent, duration, intensity, probability and significance of the impacts, whereby:
Nature: An overview of the impact and defines it as being beneficial, neutral or detrimental in its impact on the environment;
Spatial Extent: Defines physical extent or range of the impact. It will be indicated whether the impact will be limited to the site of the development activity specifically, limited to the immediate surroundings (local), the regional area, and/or the national area;
Duration: Indicates the lifetime of the impact as a result of the proposed activity; Probability: Describes the likelihood of an impact actually occurring; Cumulative: Describes the cumulative effect of the impacts on the environmental and social parameter;
and Severity: Scientifically evaluates how severe negative impacts would be, or how beneficial positive
impacts would be on a particular affected system or a particular affected party.

Page | 83
Table 26: Criteria to be used for the rating of impacts
Criteria Description
Spatial Extent National (4)
The whole of South Africa
Regional (3)
Provincial and parts of neighbouring provinces
Local (2)
Within a radius of 2 km of the construction site
Site (1)
Within the construction site
Duration
Permanent (4)
Mitigation either by man or natural process will not occur in
such a way or in such a time span that the impact can be
considered transient
Long-term (3)
The impact will continue or last for the entire operational life of
the development, but will be mitigated by direct human action
or by natural processes thereafter. The only class of
impact which will be non-transitory
Medium-term (2)
The impact will last for the period of the construction phase, where
after it will be entirely negated
Short-term (1)
The impact will either disappear with mitigation or will be mitigated through natural process in a span
shorter than the construction phase
Probability Of Occurrence
Definite (4)
Impact will certainly occur
Highly Probable (3)
Most likely that the impact will occur
Possible (2)
The impact may occur
Improbable (1)
Likelihood of the impact materialising is very low
Severity
Very Severe (4)
Irreversible and permanent change to the environment which
cannot be mitigated
Severe (3)
Long-term impacts on the environment that could be
mitigated
Average (2)
Medium impacts on the environment. Mitigation is easy, cheap, less time consuming as
the impact is partially reversible.
Negligible (1)
Environment is marginally affected by the proposed development. Completely
reversible with implementation of minor mitigation measures
Cumulative High (4)
Impact will result in significant cumulative impacts
Medium (3)
Impacts will result in medium significant cumulative impacts
Low (2)
Impact will result in Low cumulative impacts
Negligible (1)
Impact will result in negligible to no cumulative impacts

Page | 84
Significance is determined through a synthesis of the various impact characteristics. Significance is an indication of the importance of the impact in terms of both physical extent and time scale, and therefore indicates the level of mitigation required. This describes the significance of the impact on the social parameter.
The calculation of the significance of an impact uses the following formula:
(Extent + Duration + Probability + Cumulative effect) x Severity
The status of the impact determines whether the value is positive (beneficial) or negative (detrimental).
The summation of the different criteria produces a non-weighted value. By multiplying this value with the severity rating, the resultant value acquires a weighted characteristic which can be measured and assigned a significance rating.
The impact is rated in terms of the criteria presented in the table below.
Table 27: Significance rating of classified impacts
Impact Rating Description Quantitative Rating
Positive
High Of the highest positive order possible within the bounds of impacts that could occur.
+46 to +64
Medium Positive impact is real, but not substantial in relation to other impacts that might take effect within the bounds of those that could occur. Other means of achieving this benefit are approximately equal in time, cost and effort.
+21 to +45
Low Positive impacts are of a low order and therefore likely to have a limited effect. Alternative means of achieving this benefit are likely to be easier, cheaper, more effective and less time-consuming.
+5 to +20
Negligible impact
Negligible impact
Zero (or effective neutral) impact. +4 to -4
Negative
Low Impact is of a low negative order and therefore likely to have little real effect. In the case of adverse impacts, mitigation will be required, or both. Social, cultural, and economic activities of communities can continue unchanged.
-5 to -20
Medium A negative impact is real, but not substantial in relation to other impacts that might take effect within the bounds of those that could occur. In the case of adverse impacts, mitigation is both feasible and fairly possible. Social cultural and economic activities of communities are changed but can be continued (albeit in a different form). Modification of the project design or alternative action(s) may be required to avoid or minimise such impacts.
-21 to -45
High Of the highest negative order possible within the bounds of impacts that could occur. In the case of adverse impacts, there is no possible mitigation that could offset the impact, or mitigation is difficult, expensive, time-consuming, or a combination of these. Social, cultural and economic activities of communities are disrupted to such an extent that these come to a halt or modified beyond recognition.
-46 to -64
The suitability and feasibility of all proposed mitigation measures will be included in the assessment of significant impacts. This will be achieved through the comparison of the significance of the impact before and after the proposed mitigation measure is implemented. Mitigation measures identified as necessary will be included in an EMPr. The EMPr will form part of the Environmental Impact Assessment Report (EIAR).

Page | 85
Environmental Impact Assessment Report 9.1.5The EIAR will contain the following:
Details of the EAP who compiled the report and their expertise to carry out an EIA; Detailed description of the activity/ies; A description of the environment that might be affected by the activity and the manner in which the
physical, biological, social, economic and cultural aspects of the environment may be affected by the proposed activity;
Details of the public participation process conducted during the Scoping Phase and the ongoing consultation during the EIA phase;
Description of the need and desirability of the activity including advantages and disadvantages that the activity may have on the environment and the community that may be affected by the activity;
An indication of the methodology used in determining the significance of potential environmental impacts; A summary of the findings and recommendations of any specialist report or report on a specialised
process; A description of all environmental issues that were identified during the environmental impact assessment
process, an assessment of the significance of each issue and an indication of the extent to which the issue could be addressed by the adoption of mitigation measures;
An assessment of each identified potentially significant impact, including cumulative impacts, the nature of the impact, the extent and duration of the impact, the probability of the impact occurring, the degree to which the impact can be reversed, the degree to which the impact may cause irreplaceable loss of resources and the degree to which the impact can be mitigated;
A description of any assumptions, uncertainties and gaps in knowledge; An opinion as to whether the activity should or should not be authorised, and if the opinion is that it should
be authorised, any conditions that should be made in respect of that authorisation; An environmental impact statement which contains a summary of the key findings of the environmental
impact assessment; and a comparative assessment of the positive and negative implications of the activity.
A draft Environmental Management Programme (EMPr); and Copies of any specialist reports and reports on specialised processes.
Draft Environmental Management Programme 9.1.6During the compilation of the EIAR, a draft EMPr will be compiled in accordance with the EIA Regulations (2010). The draft EMPr will provide the actions for the management of identified environmental impacts emanating from the project and a detailed outline of the implementation programme to minimise and/or eliminate the anticipated negative environmental impacts. The draft EMPr will provide strategies to be used to address the roles and responsibilities of environmental management personnel on site, and a framework for environmental compliance and monitoring.
The EMPr will include the following:
Details of the person who prepared the EMPr and the expertise of the person to prepare an EMPr; Information on any proposed management or mitigation measures that will be taken to address the
environmental impacts that have been identified in the EIAR, including environmental impacts or objectives in respect of operation or undertaking of the activities, rehabilitation of the environment and closure where relevant;
A detailed description of the aspects of the activity that are covered by the draft EMPr; An identification of the persons who will be responsible for the implementation of the measures; Where appropriate, time periods within which the measures contemplated in the draft EMPr must be
implemented;
Page | 86
Proposed mechanisms for monitoring compliance with the EMPr and reporting thereon; An environmental awareness plan; and Procedures for managing incidents which have occurred as a result of undertaking the activity and
rehabilitation measures.
Public Participation Process 9.2The primary aims for the public participation process include the following:
Meaningful and timeous participation of I&APs; Promoting transparency and an understanding of the proposed project and its potential environmental
(social and biophysical) impacts; Accountability for information used for decision-making; Serving as a structure for liaison and communication with I&APs; Assisting in identifying potential environmental (social and biophysical) impacts associated with the
development; and The needs, interests and values of I&APs must be considered in the decision-making process.
Advertising 9.2.1The primary aim of adverts in the EIA phase is to provide information regarding the availability of reports for public review, as well as, if necessary, the advertisement of dates of public meeting/s.
Identification of and Consultation with Key Stakeholders 9.2.2The identification of I&APs and key stakeholders will continue into the EIA phase of the project as the public participation process is a continuous process that runs throughout the duration of an environmental study.
I&AP Database 9.2.3All I&AP information (including contact details), together with dates and details of consultations and a record of all issues raised is recorded within a comprehensive database of I&APs. This database will be updated on an on-going basis throughout the project, and will act as a record of the communication/involvement process.
Consultation and Public Involvement 9.2.4Consultation with I&APs is considered to be critical to the success of any EIA process. Therefore, one-on-one consultation (via telephone calls, fax and emails) and a public meeting during the EIA phase will be undertaken. The aim of this process will be to provide I&APs with details regarding the process and to obtain further comments regarding the project. Minutes of all meetings held will be compiled and forwarded to all attendees. These minutes will also be included in the EIAR.
Issues Trail 9.2.5All issues, comments and concerns raised during the public participation process of the EIA study will be compiled into an Issues Trail. This Issues Trail will be incorporated as part of the EIAR.
Public and Authority Review of the Draft Environmental Impact Assessment Report 9.2.6The draft EIAR will be made available at public places for public review and comment. The draft EIAR will also be submitted to MDARDLEA and DEA simultaneously. A 40-calendar day period will be allowed for this review process. An advertisement indicating the availability of this report for public scrutiny will be placed in the local

Page | 87
newspapers (Echo News and Ridge Times). I&APs registered on the project database will be notified of the availability of this report by correspondence.
Authority Review of the Environmental Impact Assessment Report 9.2.7After the public review period, all relevant comments received from the public will be considered and included into a final EIAR. This final document will be submitted to MDARDLEA and DEA for final review and decision-making. All registered I&APs will also be provided with an opportunity to comment on the final EIAR.
Environmental Authorisation and Waste Management Licence 9.2.8On receipt of the environmental authorisation and waste management licence for the project, I&APs registered on the project database will be informed and its associated terms and conditions by correspondence.


![SEA Scoping Report [Consultation Draft] Annex III](https://img.pdfslide.net/doc/110x75/589ecefa1a28ab3d4d8b54ca/sea-scoping-report-consultation-draft-annex-iii.jpg)