Embed Size (px)
Citation preview

SAE Paper Number 2004-21-0022
Driver Distraction, Telematics Design, and Workload Managers: Safety Issues and Solutions
Paul Green University of Michigan Transportation Research Institute (UMTRI)
Copyright © 2004 SAE International
ABSTRACT
Driving workload managers continually assess the difficulty of driving and regulate the flow of information to drivers that could interfere with driving, such as automatically diverting an incoming phone call to an answering machine when a driver is turning at an intersection. This paper summarizes the pertinent crash and human performance literature, identifies the unique nature of telematics tasks, and describes likely workload manager architectures, applicable regulations, and current industry efforts. In addition to promoting telematics system safety and enhancing warning systems, research on workload managers is likely to advance the science of driving and provide many other safety benefits.
WHAT IS A WORKLOAD MANAGER?
A workload manager is a system that attempts to determine if a driver is overloaded or distracted, and if so, alters the availability of telematics and the operation of warning systems. Although there are many in-vehicle task combinations that are of concern, those related to driving and concurrently using the phone are mentioned most often. In the United States, the 2003 Saab 9-3 and 9-5 contain a “dialog manager” that determines when to present non-safety critical messages to the driver based on the speed, windshield wiper movement, and other vehicle data (General Motors, 2003). Systems of this type, for example, will postpone a reminder for a 30,000-mile checkup that otherwise might be presented while driving in a torrential downpour, an inopportune time to distract a driver. In Europe, dialog managers in the Volvo S40 and V40 block telephone calls when drivers are turning or changing lanes, situations where drivers should be focusing on the primary task of driving (Victor, 2004). There has also been considerable interest in using a workload manager to alter when warnings are presented
to drivers. From the author’s perspective, the presence of a workload manager may be the difference between a warning system being useful and useless. For example, in a recent study at the University of Michigan Transportation Research Institute (UMTRI), driver performance and comments in response to lane departure and curve speed warnings were recorded (Sayer, Cullinane, Zylstra, Green, and Devonshire, in preparation). Driver reactions were typically, “Telling me that I am leaving the lane is not very useful because I already knew it.” A workload manager could overcome the false alarm problem by sensing driver inattention to the road and only present warnings about situations of which the driver is truly unaware. The enhancement of warning system effectiveness (e.g., for forward collision and side obstacle detection systems) could be an even greater safety benefit than control of telematics.
Thus, a workload manager is a device that attempts to determine if a driver is overloaded or distracted, and if they are, alters the availability of telematics and the operation of warning systems.
Certainly, workload managers seem like useful devices. But, do telematics-induced crashes (which workload managers are intended to prevent) really occur, and if so, why? What are some of the ways that workload managers might be designed? What is industry doing to develop and evaluate workload managers? What research and development is needed to advance workload managers? These and related questions are addressed in the sections that follow.
SAFETY ISSUE 1: ACCORDING TO THE CRASH LITERATURE, HAS TELEMATICS USE LED TO CRASHES?
There are numerous predictions concerning when various telematics systems will achieve various levels of market penetration in motor vehicles (Cole and Londal, 2000; Richardson and Green, 2000; Green, Flynn, Vanderhagen, Ziomek, Ullman, and Mayer, 2001; Frost and Sullivan, 2002). Although such predictions tend to be a bit optimistic, widespread use of telematics has

occurred for some systems and will occur for others. At the present time, the use of cell phones while driving is common, with about 3% of all drivers being on the phone at any given time. That number varies by about 1% depending upon the vehicle driven, road type, time of day, and survey (Crawford, Manser, Jenkins, Court, and Sepulveda 2001; Utter, 2001; Reinfeurt, Huang, Feaganes, and Hunter, 2001; Stutts, Huang, and Hunter, 2002; Johnson, Voas, Lacey, McKnight, Scott, and Lange, 2004). Similarly, navigation systems are also becoming more common, though market penetration in the U.S. has lagged behind Japan due to differences in the need for navigation information. It is only a matter of time before text messaging, email, and Internet access become widespread. Telematics can have significant benefits, allowing drivers to make better use of their time and to support driving in a variety of ways. However, the concern is that some tasks, when performed under some situations, can pose a significant risk to drivers, passengers, and other road users. There is a growing body of evidence that the use of telematics is associated with crashes. For several years the National Police Agency of Japan has been reporting data on crashes associated with navigation systems (http://www.npa.jp/english/index.htm). (See, for example, Green, 2001a). The National Police Agency statistics are interesting because they specifically identify phone and navigation systems as causal or contributing factors in crashes, a connection that is made apparent by the narratives provided by the drivers involved in these crashes. Drivers might say something such as “I started to enter information into the navigation system and was looking at the display. When I looked up, Mr. ***’s car was in front of me and I could not avoid it. I do not know how I got so close to his car.” Other evidence comes from NHTSA research (Wang, Knipling, and Goodman, 1996), several studies by Jane Stutts at North Carolina (Stutts, Reinfurt, and Rodgman, 2001; Stutts, Feaganes, Rodgman, Hamlett, Reinfurt, Gish, Mercadante, and Staplin, 2003; Stutts and Hunter, 2003), recent UMTRI research as part of the SAVE-IT project (Eby and Kostyniuk, 2003) and Thulin and Gustafsson (2004). Surprisingly, distraction-related crashes tend to be relatively more likely during the daytime, in good weather; conditions which are favorable to safe driving. When compared with all other crashes in which the driver is not impaired by alcohol or fatigue, rear-end collisions of all types tend to be much more common. In some analysis, intersection and run-off-road crashes become relatively more common. The crash literature makes three key points:
1. There are crashes in which telematics use has
been a contributing factor.
2. In crashes where telematics use is a contributing factor, drivers become so engrossed in the in-vehicle task that they lose sight of the driving task.
3. Crashes associated with telematics use are relatively more likely to occur in benign conditions (in good weather on good roads).
SAFETY ISSUE 2: ACCORDING TO THE HUMAN PERFORMANCE LITERATURE, WHY AND HOW DO TELEMATICS-RELATED CRASHES OCCUR?
Numerous studies in the literature examine multitasking while driving. Of these, at least 50 concern the use of phones, although many others concern navigation systems and with abstract tasks. There are a significant number of on-the-road studies (e.g., Brown, Tickner, and Simmonds, 1969; Brookhuis, de Vries, and de Waard, 1991; Tijerina, Johnston, Parmer, Winterbottom, and Goodman, 2000; Nunes and Recarte, 2002; Zylstra, Tsimhoni, Green, and Mayer, in preparation), though most have been conducted in the controlled context of a driving simulator (e.g., Nilsson and Alm, 1991; McKnight and McKnight, 1993; Nowakowski, Friedman, and Green, 2001; Strayer and Johnston, 2001; Tsimhoni, Smith, and Green, 2002; Uchida, Asano, and Hashimoto, 2002). (See Goodman, Bents, Tijerina, Wierwill, Lerner, and Benel, 1997, for a partial summary of the phone-related studies.) Although one can always pick at individual studies and find occasional flaws, the overwhelming abundance of evidence is irrefutable. Depending on the study, using telematics can increase following distance and variability, lane variance, lane departure, response time to a lead vehicle braking, steering entropy, and so forth. So, what is happening? Why is driving degraded? Is it pure distraction, driver overload, attention capture, or something else? Driver distraction is not a scientifically defined concept in the human factors literature. As used by layman, distraction refers to drawing attention to a different object, direction, or task. A distraction grabs and retains the driver’s attention. As defined here, there is some merit to that notion, but unfortunately, use of this term to categorize vehicle crashes lumps together everything from bees in cars to noisy children in the back seat to billboards with racy images. Distractions vary considerably in terms of how much they are under driver control, their time history, and where they cause the driver to look. These different distractions can have very different effects on crash likelihood, mitigation strategies, and responsibility. Other proponents talk about driver overload, referring to Wickens’ multiple resource theory (Horrey and Wickens, 2003) as the scientific basis for what occurs. They suggest that driving demands visual, cognitive, and manual resources of specific types to process specifically-coded information. In-vehicle tasks also have resource demands and those demands can exceed

the capacity of the resources available, leading to overload. Unfortunately, this quite elegant explanation does not predict what drivers will do in response to that overload. All too often, drivers allow the primary task, driving, to degrade. Other explanations refer to cognitive capture, where drivers get locked into a task until it is completed (though some switching between tasks may occur in the process). Capture clearly occurs within secondary tasks. For example, if a person is talking on a phone and hears a call-waiting signal, they might ask the first person to hold, connect the second person, ask them to hold, and then complete the first call. They do not switch back and forth continuously. Similarly, if a person is working on a computer, say editing a document, and they receive an incoming email message, they might, if it was high priority, stop to answer the email message, but they will not type a line in the document, then a word in the email message, etc., switching back and forth. This is because the task-switching restart costs are high in much of the same way there are costs associated with an interrupt service routine for a multitasking computer. Task capture is accentuated by interfaces with short time outs. So, if the driver does not continue to interact with the secondary task for a short period of time, they must start the task over from the beginning. An emerging explanation, inattention blindness, has elements of all of these explanations. When drivers are engaged in performing these combined tasks, their scanning behavior is disrupted and they fail to look where they should for the desired duration. For visual-manual tasks, such as destination entry, drivers spend too much time looking inside the vehicle and not looking at the road. There are video clips of this from the ongoing 100-car study at Virginia Tech (Neale, Klauer, Knipling, Dingus, Holbrook, and Petersen, 2002). Although it is theoretically possible to absorb some information peripherally (that is, there is some chance one might notice some event on the road when looking down), it is common sense that if a driver wants to see what is happening on the road, the driver needs to look at the road. Biologists call this “orienting behavior.” If this were not the case, then people would not need to look at the road when they drive. Participating in tasks that are cognitively engaging (for example, a cell phone conversation) disrupts the scanning pattern. In the case of cell phone conversations, drivers are observed to be looking at the sky much more often, not at the road, traffic, or road signs (Recarte and Nunes, 2000; McCarley, Vais, Pringle, Kramer, Irwin, and Strayer, 2001; Harbluk, Noy, and Eizenman, 2002; Strayer, Drews, and Johnston, 2003). As is commonly observed, the more difficult the thought, the more people shut off visual input because input processing interferes with the cognitive operation. In conversation, people look away from others, and
sometimes even close their eyes. This is counterproductive to driving safely. This loss of road-related visual input may occur because of inappropriate prioritization of the secondary task, with drivers giving that task inordinate attention. For example, in an UMTRI laboratory study, drivers would answer a ringing phone in 1 to 4 seconds after it began to ring, even in situations where the workload was nontrivial and driving safety was emphasized in the instructions (Nowakowski, Friedman, and Green, 2001). To provide a further example, suppose the President of the United States made a surprise visit to your building and stopped by your office or cubicle to chat. While you were chatting, the phone rang. Would you answer it? Many people would. Are you expecting to talk to someone more important? Do you have a conference call scheduled with God? For most of us, that call is unlikely. However, there is something about a ringing phone that compels people to immediately answer it, even though in many cases it could be a telemarketing call. Maybe there is a strange connection with Pavlov’s conditioning, where dogs salivate in response to a ringing bell when provided with food, to the point that they salivate when the bell is rung, whether or not they receive food. People too, respond to bells (and tones). The behavior to answer a ringing phone and engage in a conversation is so ingrained that is extremely unlikely that any amount of public awareness, education, or training will alter that highly reinforced behavior. For other tasks such as destination entry, there are similar problems. Again, once people initiate a task, they try to continue to perform it until completion. That does not mean they never look back at the road, but it is extremely rare for people to abandon the secondary task. Good design considers not how people should behave, but how they actually behave, whether or not is it desired, good, or even logical. The human performance literature makes these key points:
1. The many studies of how people multitask when they drive consistently find that multitasking while driving does not promote safety.
2. Use of telematics can lead to problems in one of three ways:
a. Drivers need to look at the device a great deal
to use it, so they have less time to devote to the road and either do not see hazards or see them too late.
b. The act of thinking about the in-vehicle task changes driver scanning patterns, pulling their gaze away from the road.

c. Completing in-vehicle tasks is very compelling, so drivers initiate and continue in-vehicle tasks even at their peril, and experience momentary overload when they do so.
SAFETY ISSUE 3: WHAT IS THE NONSCIENTIFIC OBSERVATION ABOUT HOW TELEMATICS ARE USED?
In addition to the scientific data (Strayer, Drews, and Crouch, 2003), observations of the lay public of their fellow motorists must be considered. If someone is weaving excessively and it is nighttime, they are probably drunk. If it is daytime, they are on the phone. Drivers are impaired in both cases. When vehicles weaving excessively are observed, other drivers respond defensively because they know that weaving vehicles present an unacceptable risk to them. Those other drivers may drop back, change lanes and pass, or perform some other action to get away from the weaving vehicle. While making those responses, the weaving vehicle gets the utmost attention.
Thus, drunk and distracted drivers are commonly observed to show similar signs of impairment and drivers respond similarly to them.
SAFETY ISSUE 4: WHY ARE TELEMATICS DIFFERENT FROM OTHER IN-VEHICLE TASKS?
The aggregate risk of using a telematics device is the product of duration of each use times the frequency of use (Wierwille, 1995; Wierwille and Tijerina, 1996); that is, exposure. Task completion times for non-telematics devices such as headlights, windshield wipers, and so forth are quite short, about 3-5 seconds (Wierwille, Hulse, Fischer, and Dingus, 1988). In contrast, task times for telematics devices can be 20, 40, or 60 seconds or more (Green, 1998), which is an order of magnitude increase. Furthermore, creeping functionality has significantly increased task times for systems such as climate control and entertainment. Operations in some cases no longer require a single button press, but navigation through a menu hierarchy. What makes these tasks particularly egregious is the amount of time that drivers seemed to be preoccupied by them. One could argue this is not a smart (or crash-risk minimizing) way for drivers to behave, but it is nonetheless how drivers behave. The author heard of a report in which a driver who was engaged in a cell phone call continued the call even after that driver had crashed into another driver and walked up to that victim. The call only ended when the irate victim tore the phone from the driver’s hand and stepped on it.
In summary,
1. Task times for telematics tasks can take an order of magnitude longer to complete than conventional tasks.
2. Drivers seem to be captivated to complete secondary tasks, often at the cost of driving safety.
SAFETY ISSUE 5: IF THERE IS A TELEMATICS-RELATED CRASH, WHO IS RESPONSIBLE?
Motor vehicle design and operation has a long history of regulation. Driving is a privilege and usually occurs on public property. Driver actions affect everyone. Accordingly, local, state, and federal governments regulate who is allowed to drive (via licensing), what constitutes safe operation, and how vehicles should be designed to be safe. Regulations cover performance in crash tests, visibility design requirements for wipers, specification of headlight beam patterns, limits of blood alcohol level, mandated use of safety devices such as seat belts and motorcycle helmets, speed limits, prohibition of reckless driving, and so forth. Accordingly, it is appropriate for government to regulate the use of devices that will detract drivers from safely operating their vehicles. The consequences of such actions endanger the motoring public, not just the driver in question. Responsibility is determined by current legal principles, principles that are reflected in both state and national laws, as well in standards and recommended practices. The author’s lay understanding of the legal issues is that the principle of strict liability, the applicable principle in many jurisdictions, is central to the discussion. According to that principle, “people are responsible for damages their actions or products cause, regardless of any fault on their part… Those engaged in the stream of commerce with respect to products should reasonably foresee that some people will misuse the product and should design the product so that injury does not occur.” (http://law.freeadvice.com/general_practice/legal_remedies/strict_liabilty.htm).
Thus, telematics devices can create risk to drivers and other road users and in some cases should not be used while driving. Although it is ultimately the driver’s decision when to use telematics devices, legally, responsibility for driver safety is shared by many, including OEMs and suppliers, under the principle of strict liability.

SAFETY ISSUE 6: FOR WHOM SHOULD TELEMATICS BE DESIGNED?
The legal literature refers to the “ordinary, prudent person” (http://www.judiciary.state.nj.us/charges/civil/510.htm), not engineers or computer techies. This is particularly important when considering usability. In the human-computer literature, the reference is “walk up and use,” for example in designing a kiosk so a first-time user can successfully complete a desired task without assistance. In the case of a motor vehicle, the test case is “sit down and use,” as in the case of a rental car driver using unfamiliar controls for the first time. In terms of safety, ISO guide 51 (International Standards Organization, 1997) talks about design for expected use and misuse. Engineers need to design systems for how people actually use them, not how the engineers would like them to be used. It is well known that people often do not read the owner’s manuals (http://www.mckinnonsc.vic.edu.au/la/it/ipmnotes/traindoc/rtfm.htm). Many are not computer literate, and phone and car literacy may be issues as well (Thimbleby, 1993). Although a vehicle might be targeted to a particular market segment, it must be operable by drivers of all types. Vehicles are designed to suit a wide anthropometric range, typically 5th percentile female to 95th percentile male (Reynolds, 1993), and should accommodate well-known variations in age (U.S. Department of Transportation, 2003). Vehicles need to fit both the physical and intellectual capabilities of drivers. A key element of the legal discussion is what constitutes foreseeable use and misuse. Using a lawnmower as a ceiling fan is not foreseeable (http://law.freeadvice.com/general_practice/legal_remedies/negligence_legalese.htm). However, people will participate in phone calls and enter destinations in almost any circumstances if left free to do so. At this point, the author does not know of any OEMs or suppliers that are contemplating a design feature to test drivers to determine if they are capable enough to be permitted to operate telematics. Given the absence of such screening, telematics must be operable by the expected user population.
Thus, workload managers and the telematics they control must be designed for an ordinary, reasonable person, not drivers of a particular age or with specific technical knowledge.
SAFETY ISSUE 7: WHAT ARE THE SAFETY AND USABILITY REQUIREMENTS FOR TELEMATICS DESIGN?
Standards and guidelines for telematics design have been written because of the data linking crashes to device use, the data showing degraded driving performance while concurrently using these devices, the common observations of poor driving when these devices are used, and the legal requirements to design devices for ordinary people considering expected use and misuse. To provide perspective, Table 1 shows some of the current test methods for telematics. All of these documents are voluntary, but widely recognized. A product not complying with these practices is unlikely to receive a favorable judgment in a product liability action. In essence, the methods will identify tasks that have long durations and/or draw the driver’s eyes away from the road for an extended period of time. At the present time, none of the test methods exempts systems with workload managers; something that could be considered in the future. Further research will be required before a basis exists for considering such exemptions. To varying degrees, the standards were set based on considerations of the appropriate standard of care, the burden of proof for setting criteria, and rules of evidence for considering the research literature. These high level principles, both legal and philosophical, deserve more attention by top management (Green, 2002).
Thus, telematics must meet the requirements of Society of Automotive Engineers (SAE) Recommended Practice J2364 and the Alliance of Automobile Manufacturers (AAM) guidelines, and may require testing using other procedures.
SAFETY ISSUE 8: CAN WORKLOAD MANAGERS REDUCE THE LIKELIHOOD OF TELEMATICS-INDUCED CRASHES?
The answer to this question depends on how the workload manager is implemented. Accordingly, some information on the design alternatives follows. HOW DOES A WORKLOAD MANAGER FUNCTION? As shown in Table 2, workload managers are divided into four broad categories depending on what is measured: (1) the driving situation, (2) driver input, (3) vehicle performance and response, and (4) driver state. For example, in a situationally-based system, the vehicle attempts to determine the driving situation—whether traffic is heavy, the road is narrow or winding, visibility is poor, the road is slippery, and so forth. Workload managers often use a look-up table to determine the workload from the rules. Real workload managers

depend primarily on sensors that are already installed in a vehicle. As a consequence, most systems are hybrids of the types listed in Table 2.
Table 1. Relationship of Test Methods
Development Phase
SAE Recommended Practice J2365
(Green, 1999a; Society of Automotive
Engineers, 2002)
SAE Recommended Practice J2364 (Green, 1999b;
Society of Automotive Engineers, 2004 a,b)
AAM Guidelines (Alliance of Automobile Manufacturers, 2003)
ISO Draft Standard
Preliminary (concept)
Calculation to predict static task time; no performance criteria in 2365 but could be used to estimate compliance with J2364 15 second rule
Early (first mockup or computer simulation)
Static method – Task time averaged over 10 subjects must be less than 15 seconds
Mockup or prototype
Interrupted vision method - Time averaged over 10 subjects must be less than 20 seconds
2.1a Glance behavior, (Alternative A) Single glance durations should not be > 2s and total glance time =< 20 s
Occlusion method-Details under discussion, no criterion provided
Mature design
2.1b Reference task (Alternative B) # of lane exceedances should not exceed reference task, car following should not be worse
(Based on Table 1, Society of Automotive Engineers, 2004b)
Table 2. Workload Manager Types
Manager Type Example Factors Advantages Disadvantages Situation Traffic, road width,
curvature, visibility, time of day, coefficient of friction, path (turning), headway, posted speed
*Road segments can be connected to crash data *Data for crash analysis is a well-developed civil engineering practice
*Collection of crash data by segment is not easy *Low number of crashes in some situations requires extrapolation * Requires navigation system for road data, traction control for friction
Driver input Steering wheel angle, throttle angle
* Data is often easy to obtain
* Easiest for electronic steering and braking-not widely available yet * Alone, it is not sufficient to predict workload
Vehicle response/ performance
Speed, lane position, acceleration
* Speed is easy to obtain
* Lane position requires lane tracker, not widely available * Good predictions use lateral acceleration (needs added sensor)
Driver state Heart rate, direction of gaze
* Direction of gaze is probably the best indicator of distraction
* All driver state measures require special, non-shared sensors

A common misconception is that overall by-segment crash data is sufficient to design a workload manager. Such situationally-based managers are unable to deal with individual differences (such as age, sex, impairment, and so forth) which have major effects on performance. Furthermore, distraction-related crashes tend to occur in better driving conditions, and hence using the overall crash rate for developing rules may not be appropriate. For starters, the data examined should be for only distraction-related crashes, not all crashes. Because distraction-related crashes constitute only a portion of all crashes, there is often not enough data to make predictions for many situations. Other ideas of how a workload manager might function come from recent UMTRI research in the SAVE-IT project. Zylstra, Tsimhoni, Green, and Mayer
(in preparation) report an experiment that examined how people drive on perfectly straight roads with light to medium traffic during the daytime, in some sense a baseline condition because there was no interference due to traffic, curvature, poor lighting, and so forth. One of the findings was when drivers were performing an in-vehicle task (that is, when they were distracted), they controlled their speed by intermittently adjusting the throttle. When not distracted, control was continuous. Figure 1 shows a sample time history for throttle position for one subject while just driving, driving and periodically glancing at the center console, or driving and performing an in-vehicle task (tuning a radio, dialing a phone number, or entering a destination). The in-vehicle tasks have different durations and therefore, the line lengths differ.
Baseline
L30
L10
Tuner
Nav
Phone
Time [s]
Thro
ttle
[%
]
Baseline
L30
Tuner
Nav
35
30
25
20
15
10
5
0
35302520151050
L30
Nav
"Fixed" Throttle Positions
Figure 1. Time history of throttle corrections for one subject for six trials on an expressway.
Note: L10 and L30 refer to just looking at the center console without performing a manual or cognitive task. “Tuner” is manually tuning the radio, “Nav” is entering a street address. “Phone” is dialing a 10-digit phone number, and “Baseline” is just driving. Notice that for baseline driving there are continuing corrections, while for navigation the throttle position changes very little (“flat lining”). For tuning the radio, there are periods of no change and periods of change. However, the radio was being tuned for the entire period shown in the figure. These data suggest that drivers ignore speed, then notice and correct it, and then ignore it for a while. Because of the inertia of the car and small size of the corrections, changes in vehicle speed can be very difficult to measure. Nonetheless, the data suggest
that drivers cannot continuously control their speed and perform in-vehicle tasks at the same time, implying that other aspects of driving performance could be degraded as well. What makes using throttle data quite difficult is that there are large individual differences in the pattern of throttle response and that throttle responses are affected by many external events, especially traffic.

Furthermore, distraction is most likely when a series of flat line events occur in succession, and developing an algorithm to identify them will require considerable effort. (For other research on algorithms, see Piechulla, Mayser, Gehrke, and König, 2003). Furthermore, it must be emphasized that the data presented here are for perfectly straight roads, a geometry that is not common in most parts of the U.S. except in the flat central states. It could be that the additional adjustments needed to regulate speed on curves mask the data of interest. That issue is the topic of future research. A particularly interesting approach is to collect driver eye fixations. As mentioned earlier, the ultimate indicator that the driver is not attending to the road is when they are looking elsewhere. Of all the ways to assess whether a driver is distracted, this approach holds the most promise of being accurate. However, there are major technical challenges to build affordable systems reliable enough to work in an automotive context with a wide range of drivers under varying lighting conditions. In addition, there is a great deal of work to be done to understand just where and when drivers look in order to build reliable workload managers. WHAT HARDWARE AND SOFTWARE ARE NEEDED? The elements of a workload manager can vary quite widely with the general architecture, sophistication of the system, and measures collected. However, there are a number of common elements: Sensors - Depending on the market segment, the extent to which existing sensors are used varies. Sensors may measure steering wheel angle, speed throttle angle, brake pressure, vehicle acceleration, lane position, headway, heart rate, and even where the driver is looking. Many systems also provide navigation data, external traffic data, links to weather information, etc. The author believes that the sensors are the largest cost-added element of a workload manager. As mentioned early in this paper, no matter what the source of distraction, the result, either direct or indirect, is that the driver is not looking at and absorbing information from the road. Although there are many exceptions, if drivers are looking at the road, they are absorbing what they see. Accordingly, there is now a growing belief that real-time measurement of driver eye fixations is part of the solution. These systems consist of high quality digital cameras, special image processing boards, a very fast processor, and, of course, specialized image-processing software. Measuring eye fixations is extremely difficult under any situation and particularly difficult to accomplish at low cost in a moving vehicle. Direction of gaze can be determined by measuring the electrical potentials around the orbit or shining an infrared beam off of the cornea and measuring its angle of reflection. Now various video-
based systems track the face, find the eye, and then by judging the amount of white on either side of the iris (Figure 2), determine the direction of gaze. Accurate assessment of direction of gaze is difficult because of the large volume traversed in typical head movements (the “head box”). Only recently are self-calibrating systems appearing. Given the resolution of a typical video camera, the number of pixels available for the eye image is quite low, say 14 pixels wide. Improvements will occur as camera resolution increases and with multiple cameras processing the face. Unfortunately, such enhancements increase the system cost, which is already at $30,000 for a research-caliber eye fixation system suitable for automotive use (See www.seeingmachines.com and www.smareye.com ) For use in production vehicles, the system cost will need to be reduced two orders of magnitude. The cost of these systems could tumble dramatically if the production ramped up from 100/year to several million.
Source: http://www.stlukeseye.com/Anatomy.asp
Figure 2. Simplified Eye Anatomy
The practical engineering solution is to measure head orientation, measurements highly correlated with the direction of gaze and easier to collect. Serious pursuit of this idea is beginning. Data network - The development of the CAN bus has enabled development of workload managers. However, there are manufacturer-specific implementations of the bus and many of the specialized sensors being considered may not reside on the bus, making cross-manufacturer implementations costly. Driving task assessment module – This module combines information from the various sensors to determine how “busy” the driver is at that moment. This module might rely upon driving situation-based rules (if it is raining and the lane width is less than 10 feet and ... then do not allow an incoming phone call) or computations (workload = the deviation of the steering wheel angle from straight ahead, plus the square of …). Systems that are rule-based predominate. Depending on the system, rules may evolve from expert opinion, driving performance studies, or some combination of both. Use of driver models to develop rules is rare.
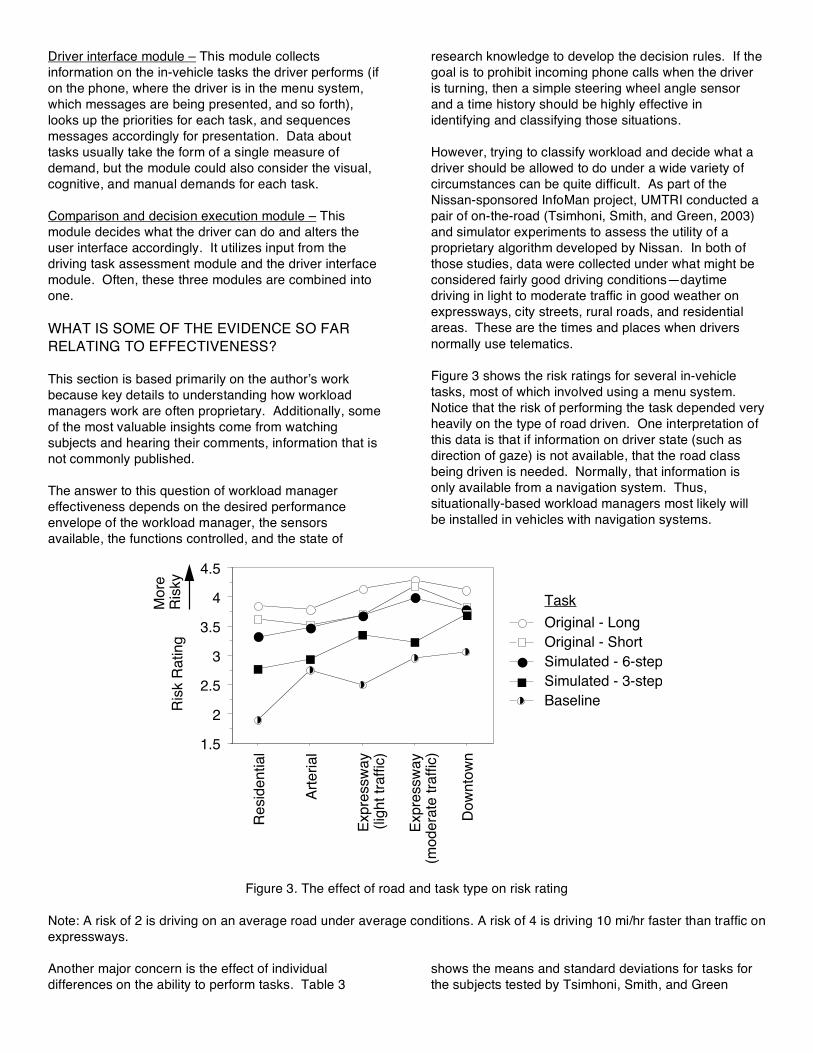
Driver interface module – This module collects information on the in-vehicle tasks the driver performs (if on the phone, where the driver is in the menu system, which messages are being presented, and so forth), looks up the priorities for each task, and sequences messages accordingly for presentation. Data about tasks usually take the form of a single measure of demand, but the module could also consider the visual, cognitive, and manual demands for each task. Comparison and decision execution module – This module decides what the driver can do and alters the user interface accordingly. It utilizes input from the driving task assessment module and the driver interface module. Often, these three modules are combined into one. WHAT IS SOME OF THE EVIDENCE SO FAR RELATING TO EFFECTIVENESS? This section is based primarily on the author’s work because key details to understanding how workload managers work are often proprietary. Additionally, some of the most valuable insights come from watching subjects and hearing their comments, information that is not commonly published. The answer to this question of workload manager effectiveness depends on the desired performance envelope of the workload manager, the sensors available, the functions controlled, and the state of
research knowledge to develop the decision rules. If the goal is to prohibit incoming phone calls when the driver is turning, then a simple steering wheel angle sensor and a time history should be highly effective in identifying and classifying those situations. However, trying to classify workload and decide what a driver should be allowed to do under a wide variety of circumstances can be quite difficult. As part of the Nissan-sponsored InfoMan project, UMTRI conducted a pair of on-the-road (Tsimhoni, Smith, and Green, 2003) and simulator experiments to assess the utility of a proprietary algorithm developed by Nissan. In both of those studies, data were collected under what might be considered fairly good driving conditions—daytime driving in light to moderate traffic in good weather on expressways, city streets, rural roads, and residential areas. These are the times and places when drivers normally use telematics. Figure 3 shows the risk ratings for several in-vehicle tasks, most of which involved using a menu system. Notice that the risk of performing the task depended very heavily on the type of road driven. One interpretation of this data is that if information on driver state (such as direction of gaze) is not available, that the road class being driven is needed. Normally, that information is only available from a navigation system. Thus, situationally-based workload managers most likely will be installed in vehicles with navigation systems.
1.5
2
2.5
3
3.5
4
4.5
Ris
k R
ating
Resid
ential
Art
erial
Expre
ssw
ay
(lig
ht tr
affic
)
Expre
ssw
ay
(modera
te tra
ffic
)
Dow
nto
wn
Baseline
Simulated - 3-step
Simulated - 6-step
Original - Short
Original - Long
More
R
isky
Task
Figure 3. The effect of road and task type on risk rating
Note: A risk of 2 is driving on an average road under average conditions. A risk of 4 is driving 10 mi/hr faster than traffic on expressways. Another major concern is the effect of individual differences on the ability to perform tasks. Table 3
shows the means and standard deviations for tasks for the subjects tested by Tsimhoni, Smith, and Green

(2003). Notice that task times for older subjects are 50 to 100% greater than for younger subjects, as is typically the case. (See also Green, 2001b.) So, for example, one of the shorter tasks (mean time of about 13 seconds) would clearly be acceptable per SAE Recommended Practice J2364 15-second criterion for younger subjects to perform, but unacceptable for middle-aged and older subjects. In this case, there might also be something strange occurring with the original data as the times for the middle-aged subjects
should not be larger than for older subjects. Keep in mind that there were only eight subjects in each age group. Nonetheless, if the workload manager utilizes only situation-based data, it may often be wrong about what drivers should be permitted to do because of differences among drivers. This suggests there may be some need to either measure driver performance directly, or base it on data available for their capabilities, at least by age.
Table 3. Static Total Task Time Values by Age (Mean±S.D.)
Simulated Task Real Task Age Group 3-Step 6-Step Short Long
Younger (20-39)
7.3±2.1 19.7±6.0 12.7±6.2 15.5±1.7
Middle age (45-54)
9.3±1.4 31.0±14.7 28.4±8.9 29.5±9.6
Older (65-72)
11.2±2.3 39.9±18.6 23.9±7.1 30.2±8.7
Thus, there is the belief that workload managers can be built to determine when drivers are likely to be overloaded or distracted, relying on situation-specific crash data, assessment of driver inputs to the vehicle (e.g., throttle holds), vehicle performance, and driver state (e.g., direction of gaze). A great deal more needs to be known to build systems that cover a wide range of driving situations and the individual differences of drivers, especially those due to age. Systems that ultimately may be best at identifying distracted drivers will need to determine the direction of gaze, for which the cost of measurement will need to be substantially reduced.
SOLUTION 1: INDUSTRY IS DEVELOPING IN WORKLOAD MANAGERS
Table 4 shows the author’s impressions concerning workload managers. Although truck applications are of interest, the focus is on passenger vehicles. To avoid confidentiality problems, implementation dates are not provided. The implementation predictions are based on historical observation and direct contact with colleagues. The author has had research connections with Nissan, Delphi, and Motorola on workload managers, so he has the best sense of those programs. To summarize, many suppliers and OEMs are conducting research on workload managers, especially those viewed as technology leaders, and some are likely to implement them. The large number of unknown cells in the table reflects the absence of public statements and published research by various suppliers and OEMs
concerning workload managers, not a lack of interest in them. Further, there is a long history of research on workload and workload management as part of many EU projects (GIDS (Michon, 1993), CEMVOCAS (http://www.inrets.fr/ur/lescot/CeMVocAS/Pagedepa.htm), BERTIE (Alm and Nilsson, 1990; Fairclough, Asby, Ross, and Parkes, 1990; Fairclough, 1991), EMMIS, TELAID, HARDIE (Ross, Midtland, Fuchs, Pauzie, Engert, Duncan, Vaughan, Vernet, Peters, Burnett, and May, 1996), HOPES, GEM, COMMUNICAR (http://www.public.asu.edu/~huanliu/DM03S/DrivingData.pdf driver workload evaluator), SANTOS (http://www.santosweb.de/english/HTML/content_set.html), ROESETTA (http://www.trg.soton.ac.uk/rosetta/workareas/2b_hmi/hmi_pr1_ergonomics.htm), HASTE (www.its.leeds.ac.uk/projects/haste/partners.htm), and now AIDE. See Hoedemaeker, de Ridder, and Janssen (2002) for a review and De Waard (1996) for related information. Current related work in the U.S. is the U.S. DOT-sponsored CAMP program (Deering, 2002) and the SAVE-IT project.
Thus, there has been a great deal of research on workload and workload managers, especially restricted research in Europe. Several suppliers and OEM have introduced or will introduce workload managers.

Table 4. Current Industry Situation for Workload Managers
Organization or Team
Status Implementation Likely
Bosch-BMW *Working with BMW on research (SANTOS project) yes Daihatsu * Unknown no Delphi * Working on SAVE-IT with U of Michigan, U of Iowa
* Looking at many measures including eye fixations, steering wheel angle, etc. * ISS test vehicle
yes
DaimlerChrysler * R&D in Germany yes Denso * Unknown unknown Ford * S40 and V40 in Europe have dialog managers
* Some research on distraction in its simulator in Dearborn unknown
Fiat * CRF involved in several EU projects on workload over many years yes GM * Internal effort related to GMability project
* Saab 9-3, 9-5 have dialog managers unknown
Honda * Unknown unknown Hyundai * Unknown unknown Johnson Controls * Unknown unknown Lear * Unknown unknown Magna * Unknown unknown Mazda * Unknown unknown Mitsubishi Motors * Unknown unknown Motorola * Conducting internal research at Motorola labs for several years
* Plans for several generations of interfaces * Demonstrated first generation with DaimlerChrysler
yes
Nissan * InfoMan project with U of Michigan and others yes Renault * Involved in several EU project on workload over many years
* Also has ties with INRETS yes
Subaru-Isuzu * Unknown unknown Toyota * Carrying out R&D in Japan yes Visteon * Had plans for an effort, now inactive no Volvo Truck * Pursuing research for Volvo cars (Ford) and Volvo/Mack/Renault trucks
* Interested in eye fixations * First product on market (S40, V40)
yes
United Tech. * Unknown unknown VW-Porsche-Audi * Unknown unknown Yazaki * No effort no
SOLUTION 2: CARRY OUT RESEARCH ON THE “SCIENCE OF DRIVING”
Industry leaders are moving ahead to produce workload managers to reduce the opportunities for telematics-induced crashes identified in the crash and human performance literature. It is apparent that even simple systems have the potential of reducing crashes for which they have some responsibility. Further, research on warning systems suggests that without some means to determine if a driver is aware of the situation for which a warning is desired, drivers will be overwhelmed with false alarms, and just ignore them. This is a perfect application for a workload manager.
However, the real value of workload managers may not just be that these products have the potential to save a significant number of lives, but that the knowledge gained from researching them will vastly improve the understanding of how people drive. Ultimately that knowledge will lead to large improvements in driving safety, comfort, convenience, and productivity. For that to occur, government and industry need to be much more proactive in exploring the “science of driving” (Green, 1996; http://www.umich.edu/~newsinfo/MT/00/Sum00/mt13j00.html). Relative to other fields of endeavor, the understanding of how people drive is extremely poor. Driver interfaces for particular applications are usually determined by testing a few alternatives and selecting

the best one, often the interface with the fewest failures. But one would never design a bridge by building a few a prototypes and seeing which fell down. Engineering is based on Newton’s Laws, Kirchoff’s Law, Thevenin’s Theorem, and other mathematical relations and procedures for relating physical inputs to system responses. Similar model building efforts are needed for driving, and research on driving workload may help encourage such developments. What will it take? More than 40,000 people are killed each year in the U.S. in motor vehicle crashes. For the sake of discussion, suppose just $1,000 was allocated for each fatality per year for 10 years, a long enough time horizon to study a major problem. The resulting funding would be $40,000,000 per year over a decade or $400,000,000. This should be new money for universities and others contracting with the federal government, not funds from current projects whose names were changed, and these funds would be in addition to any work funded by private industry. The project results would appear in the form of journal articles and proceedings papers, not government technical reports that take too long to get out the door. The emphasis of this program would be on the quantification of human performance, models, and methods, not on empiric evaluation of interface alternatives. To put this suggestion in perspective, the cost of the F-22 Raptor program is $61 billion dollars which buys 339 planes at approximately $170 million dollars per aircraft (Federation of American Scientists, 2004). (The actual unit cost could vary because the program is still in progress and the number of aircraft to be purchased keeps changing.) It truly is a remarkable aircraft. However, for the cost of just over two airplanes, a significant scientific program could be supported for over a decade to help understand a leading cause of death of young Americans. The research on workload managers has already led to products that can reduce the number of telematics-induced crashes and will soon be able to significantly enhance the effectiveness of warning systems. The real benefits will come in many forms from the research to develop them. ACKNOWLEDGMENTS
The research on which much of this paper was based was funded by Nissan Motor Company and Motorola. Their support is greatly appreciated.
REFERENCES
Alliance of Automobile Manufacturers (2003). Statement of Principles, Criteria and Verification Procedures on Driver Interactions with Advanced In-Vehicle Information and Communication Systems (draft version 3.0), Washington, D.C.: Alliance of Automobile Manufacturers.
Alm, H., & Nilsson, L. (1990). Changes in Driver Behaviour as a Function of Handsfree Mobile Telephones: a Simulator Study, (Report No. 47, DRIVE Project V1017 (BERTIE)), Linkoping, Sweden: Swedish National Road and Transport Research Institute.
Brookhuis, K.A. de Vries, G., and deWaard, D. (1991). The Effects of Mobile Telephoning on Driving Performance, Accident Analysis and Prevention, 23(4), 309-316.
Brown, I.D., Tickner, A.H., and Simmonds, D.C.V. (1969). Interference between Concurrent Tasks of Driving and Telephoning, Journal of Applied Psychology, 53(5), 419-424.
Cole, D. E.; Londal, G. F. 2000. Delphi X Forecast and Analysis of the North American Automotive Industry. Volume 1: Technology, (Technical Report No. UMTRI-2000-3-1), Ann Arbor, Michigan: The University of Michigan Transportation Research Institute.
Crawford, J. A., Manser, M.P., Jenkins, J.M., Court, C.M., Sepulveda E.D. (2001). Extent and Effects of Handheld Cellular Telephone Use While Driving (Technical Report SWUTC/01/167706-1), College Station, TX: Texas Transportation Institute, (http://swutc.tamu.edu/Reports/167706-1.pdf). De Waard, D. (1996). The Measurement of Drivers' Mental Workload (Ph.D. thesis), Haren, The Netherlands: University of Groningen, Traffic Research Centre.
Deering, R.K., (2002). Crash Avoidance Metrics Partnership Annual Report , April 2001-March 2002 (Technical Report DOT HS 809 531, Washington, D.C.: National Highway Traffic Safety Administration, U.S. Department of Transportation, (www-nrd.nhtsa.dot.gov/pdf/nrd-12/CAMPS.pdf).
Eby, D. W. and Kostyniuk, L. P. (2003). Driver Distraction and Crashes: An Assessment of Crash Databases and Review of the Literature (Technical Report UMTRI-2003-12), Ann Arbor, MI: The University of Michigan Transportation Research Institute.
Fairclough, S.H. (1991). Adapting the TLX to Measure Driver Mental Workload, (DRIVE Project V1017 (BERTIE) Report No. 71). Loughborough, U.K.: HUSAT Research Institute.
Fairclough, S.H. Asby, M.C.,Ross, T., and Parkes, A.M. (1990). Effects on Driving Behaviour of Handsfree Telephone Use, (DRIVE Project V1017 (BERTIE) Report no. 48), Loughborough, U.K.: HUSAT Research Institute.

Frost and Sullivan (2002). North American Automotive Entertainment and Navigation Systems Market, (http://www.just-auto.com/store/products_detail.asp?art=26338&pg=toc&lk=sup).
General Motors (2003). New GM-Saab Technology Knows When Drivers Are Too Busy to Receive Certain Information (http://www.gm.com/company/gmability/safety/news_issues/releases/saab_tech_061903.html).
Goodman, M., Bents, F.D., Tijerina, L., Wierwille, W., Lerner, N., and Benel, D. (1997). An Investigation of the Safety Implications of Wireless Communication in Vehicles, (Technical Report DOT HS 808 635), Washington, D.C.: National Highway Traffic Safety Administration, U.S. Department of Transportation.
Green, P. (1996). Customer Needs, New Technology, Human Factors, and Driver Science Research for Future Automobiles. Journal of the Japan Society of Mechanical Engineers 99(926), 15-18. (Published in Japanese).
Green, P. (1998). Visual and Task Demands of Driver Information Systems (Technical Report UMTRI-98-16). Ann Arbor, MI: The University of Michigan Transportation Research Institute.
Green, P. (1999a). Estimating Compliance with the 15-Second Rule for Driver-Interface Usabilty and Safety. Proceedings of the Human Factors and Ergonomics Society 43rd Annual Meeting. Santa Monica, CA: Human Factors and Ergonomics Society, CD-ROM. Green, P. (1999b). The 15-Second Rule for Driver Information Systems. ITS America Ninth Annual Meeting Conference Proceedings, Washington, D.C.: ITS America, CD-ROM.
Green, P. (2001a). Safeguards for On-Board Wireless Communications. Presentation at Second Annual Plastics in Automotive Safety Conference, Troy, Michigan.
Green, P. (2001b). Variations in Task Performance Between Younger and Older Drivers: UMTRI Research on Telematics. Paper presented at the Association for the Advancement of Automotive Medicine Conference on Aging and Driving, Southfield, MI.
Green, P. (2002). Why Safety and Human Factors Standards Are So Difficult to Establish. In de Waard, Brookhuis, Moraal, and Toffetti (Eds.). Human Factors in Transportation, Communication, Health and the Workplace, Maastricht, the Netherlands: Shaker Publishing.
Green, P., Flynn, M., Vanderhagen, G., Ziomek, J., Ullman, E., and Mayer, K. (2001). Automotive Industry Trends in Electronics: Year 2000 Survey of Senior Executives (Technical Report 2001-15). Ann Arbor, MI, The University of Michigan Transportation Research Institute.
Harbluk, J., Noy, Y.I., and Eizenman, M. (2002). The Impact of Cognitive Distraction on Driver Visual Behaviour and Vehicle Control (technical report TP#13880E), Ontario, Canada: Trasnport Canada, ( http://www.tc.gc.ca/roadsafety/tp/tp13889/en/menu.htm).
Hoedemaeker, M., de Ridder, S.N., and Janssen, W.H. (2002). Review of Euroopena Human Factors Research on Adaptive Interface Technologies for Automobiles (TNO report TM-02-C031), Soesterberg, The Netherlands: TNO Human Factors, (http://www.volpe.dot.gov/opsad/saveit/docs/hoedemaeker.pdf).
Horrey, W. J.and Wickens, C. D. (2003). Multiple Resource Modeling of Task Interference in Vehicle Control, Hazard Awareness and In-vehicle Task Performance. Driving Assessment 2003: Proceedings of the 2nd International Driving Symposium on Human Factors in Driver Assessment, Training and Vehicle Design, Iowa City, Iowa: University of Iowa, 7-12.
International Standards Organization (1997). Safety Aspects-Guidelines for the Inclusion in Standards (ISO/IEC guide 51 (ISO/IEC) TAB Safety N31), Geneva, Switzerland: International Standards Organization.
Johnson, Mark B; Voas, Robert B; Lacey, John H; McKnight, A Scott; Lange, James E (2004). Living Dangerously: Driver Distraction at High Speed, Traffic Injury Prevention, 5(1), March, 1-7.
Kelly, M. (2003). Why people don’t read instruction manuals or RTFM, (http://www.mckinnonsc.vic.edu.au/la/it/ipmnotes/traindoc/rtfm.htm).
McCarley, J. S., Vais, M., Pringle, H., Kramer, A. F., Irwin, D. E., and Strayer, D. L. (2001). Conversation Disrupts Visual Scanning of Traffic Scenes, Paper presented at Vision in Vehicles, Australia, (http://www.psych.utah.edu/AppliedCognitionLab/).
McKnight, A.J. and McKnight, A.S. (1993). The Effect of Cellular Phone Use upon Driver Attention, Accident Analysis and Prevention, 25,(3), 259-265.
Michon, J.A. (1993). Generic Intelligent Driver Support, London, U.K.: Taylor and Francis.
Neale, V.L., Klauer, S.G., Knipling, R.R., Dingus, T.A. Holbrook, G.T., and Petersen, A. (2002). The 100 Car Naturalistic Driving Study, Phase 1-Experiment Design (Technical Report DOT HS 808 536), Washington, D.C.: National Highway Traffic Safety Administration, U.S. Department of Transportation, (www-nrd.nhtsa.dot.gov/pdf/nrd-12/ 100CarPhase1Report.pdf).
Nilsson, L. and Nabo, A. (1998). Intelligent Cruise Control Simulaor Experiment: Effects of Different Levels of Automation on Driver Behaviour, Workload and Attitudes, Linkoping, Sweden, : Swedish National Road and Transport Research Institute.
Nilsson,L., and Alm, H. (1991). Elderly People and Mobile Telephone Use—Effects of Driver Behaviour, Proceedings of the Conference on the Strategic Highway Research Program and Traffic Safety on Two Continents, Gothenburg, Sweden and DDRIVE Project V1017 (BERTIE Report 53), Swedish National Road and Transport Research Institute.
Nowakowski, C., Friedman, D., and Green, P. (2001). Cell Phone Ring Suppression and HUD Caller ID: Effectiveness in Reducing Momentary Driver Distraction Under Varying Workload Levels (Technical Report 2001-29). Ann Arbor, MI, The University of Michigan Transportation Research Institute.
Nunes, L. and Recarte, M. A. (2002). Cognitive Demands of Hands-free-phone Conversation while Driving, Transportation Research. Part F, Traffic Psychology and Behaviour, 5F( 2), June, 133-144.
Piechulla, W., Mayser, C., Gehrke, H., & König, W. (2003). Reducing Drivers' Mental Workload by Means of an Adaptive Man-machine Interface, Transportation Research Part F, 6, 233-248 (doi:10.1016/j.trf.2003.08.001)
Recarte and Nunes (2000). Effects of Verbal and Spatial-Imagery Task on Eye Fixations while Driving, Journal of Experimental Psychology, Applied, 6(1), 31-43.
Reinfurt, D.W. Huang, H.F., Feaganes, J.R., and Hunter. W.W. (2001). Cell Phone Use While Driving in North Carolina, Chapel Hill, NC: University of North Carolina Highway Safety Research Center, (http://www.hsrc.unc.edu/pdf/2001/cellphone.pdf).
Reinfurt, D.W., Huang, H.F. Feaganes, J.R. and Hunter, W.W. (2001). Cell Phone Use while Driving in North Carolina (Technical Report), Chapel Hill, NC: University of North Carolina Highway Research Center.
Reynolds, H.M. (1993). Automotive Seat Design for Sitting Comfort (chapter 5) in Peacock, B. and Karwowski, W., Automotive Ergnomics, London, U.K.: Taylor and Francis.
Richardson, B. and Green, P. (2000). Trends in North American Intelligent Transportation Systems: A Year 2000 Appraisal (Technical Report UMTRI-2000-9). Ann Arbor, MI, The University of Michigan Transportation Research Institute.
Ross, T., Midtland, K., Fuchs, M., Pauzie, A., Engert, A., Duncan, B., Vaughan, G., Vernet, M., Peters, H., Burnett, G., & May, A. (1996). HARDIE Design Guidelines Handbook: Human Factors Guidelines for Information Presentation by ATT Systems, Luxembourg: Commission of the European Communities.
Sayer, J., Cullinane, B., Zylstra, B., Green, P., and Devonshire, J. (in preparation). Lateral Drift and Curve Speed Warnings: A Driving Simulator Evaluation of Auditory and Haptic Implementations (Technical Report UMTRI-2003-41). Ann Arbor, MI: The University of Michigan Transportation Research Institute.
Society of Automotive Engineers (2002). Calculation of the Time to Complete In-Vehicle Navigation and Route Guidance Tasks (SAE Recommended Practice J2365), Warrendale, PA: Society of Automotive Engineers.
Society of Automotive Engineers (2004a). Navigation and Route Guidance Function Accessibility While Driving (SAE Recommended Practice J2364), Warrendale, PA: Society of Automotive Engineers.
Society of Automotive Engineers (2004b). Rationale Document for SAE J2364 (SAE Information Report J2678), Warrendale, PA: Society of Automotive Engineers.
Strayer, D. L., & Johnston, W. A. (2001). Driven to Distraction: Dual-Task Studies of Simulated Driving and Conversing on a Cellular Phone, Psychological Science, 12, 462-466.
Strayer, D. L., Drews, F. A., & Johnston, W. A. (2003). Inattention-blindness behind the wheel [Abstract]. Journal of Vision, 3(9), 157a, (http://journalofvision.org/3/9/157/, doi:10.1167/3.9.157).
Strayer, D.L., Drews, F.A. and Johnston, W.A. (2003). Cell Phone Induced Failures of Visual Attention during Simulated Driving, Journal of Experimental Psychology: Applied, 9, 23-52, (www.psychology.stonybrook.edu/sbrennan-/ psy384/papers/strayer.pdf).

Stutts, J. C., and Hunter, W. W. (2003). Driver Inattention, Driver Distraction and Traffic Crashes, ITE Journal, July, 73(7), 34-36, 43-45.
Stutts, J. C., Reinfurt, D. W., and Rodgman, E. A. (2001). The Role of Driver Distraction in Crashes: An Analysis of 1995-1999 Crashworthiness Data System Data, Association for the Advancement of Automotive Medicine. 45th annual conference Proceedings. Barrington, Illinois, Association for the Advancement of Automotive Medicine, 287-301.
Stutts, J., Feaganes, J., Rodgman, E., Hamlett, C., Reinfurt, D., Gish, K., Mercadante, M., and Staplin, L. (2003). The Causes and Consequences of Distraction in Everyday Driving, Association for the Advancement of Automotive Medicine. 47th Annual Proceedings, Barrington, Illinois, 235-251.
Stutts, J.C. Feaganes, J.R. Rodgman, E.A. Hamlett, C. Meadows, T., Reinfurt, D.W. Gish, K. Mercadante, M., and Staplin. L. ( 2003). Distractions in Everyday Driving, Chapel Hill, NC: University of North Carolina Highway Safety Research Center, (http://www.aaafoundation.org/pdf/DistractionsInEverydayDriving.pdf).
Stutts, J.C. Huang, H.F. and Hunter. W.W. (2002). Cell Phone Use While Driving in North Carolina: 2002 Update Report Final Project Report to the North Carolina Governor’s Highway Safety Program, Chapel Hill, N.C.: University of North Carolina Highway Safety Research Center, (http://www.hsrc.unc.edu/pdf/2002/CellPhone2002Report.pdf).
Stutts, J.C., Feaganes, J.R. Rodgman, E.A. Hamlett, C. Reinfurt, D.W. Gish, K., Mercadante, M.and Staplin, L. (2003). The Causes and Consequences of Distraction in Everyday Driving, In Proceedings, 47th Annual Meeting, Association for the Advancement of Automotive Medicine, Des Plaines, IL: Association for the Advancement of Automotive Medicine, 235-51.
Thimbleby, H. (1993). Computer Literacy and Usability Standards, In User Needs in Information Technology Standards, 223-230, C. D. Evans, B.L. Meek and R.S. Walker (eds), Butterworth-Heinemann, (www.uclic.ucl.ac.uk/harold/srf/literacy.pdf).
Thulin, H.and Gustafsson, S. (2004). Mobile Phone Use while Driving: Conclusions from Four Investigations (VTI report 490A0), Linköping, Sweden: Swedish National Road and Transport Research Institute.
Tijerina, L., Johnston, S. Parmer, E., Winterbottom, M. D., and Goodman, M. 2000. Driver Distraction with Route Guidance Systems (Report No. DOT/HS 809 069), East Liberty, Ohio: Transportation Research Center, and Washington, D.C: National Highway Traffic Safety Administration, U.S. Department of Transportation.
Tsimhoni, O., Smith, D., and Green, P. (2002). Destination Entry while Driving: Voice Recognition Versus Touch Screen Keyboard. (Technical Report 2001-24). Ann Arbor, MI: The University of Michigan Transportation Research Institute.
U.S. Department of Transportation (2003). Highway Statistics, 1999, Section III: Driver Licensing, Washington, D.C.: U.S. Department of Transportation, Federal Highway Administration, Office of Highway Policy Information, (http://www.fhwa.dot.gov/ohim/hs99/dlpage.htm).
Uchida, N., Asano, Y., and Hashimoto, K. (2002). Effects of Cell Phone Conversation Load on Viewpoints Control while Driving, Jidosha Kenkyu [JARI research journal], 24, (6), June, 229-232.
Uchiyama, Y., Kojima, S., Hongo, T., Terashim, R., and Wakita, T (2004). Voice Information System that Adapts to Driver’s Mental Workload, R&D Review of Toyota CRDL, 39(1),16-22, www.tytlabs.co.jp/office/library/review/ rev391pdf/391_016uchiyama.pdf.
Utter, D. (2001). Passenger Vehicle Driver Cell Phone Use Results from the Fall 2000 National Occupant Protection Survey (research note DOT HS 809 293), Washington, D.C.: National Highway Traffic Safety Administration, U.S. Department of Transportation. (www-nrd.nhtsa.dot.gov/pdf/nrd-30/NCSA/RNotes/2001/809-293.pdf).
Victor, T. (2004). Personal communication.
Wang, J.-S., Knipling, R.R., and Goodman, M. J. (1996). The Role of Driver Inattention in Crashes: New Statistics from the 1995 Crashworthiness Data System. Association for the Advancement of Automotive Medicine 40th Annual Conference Proceedings, Association for the Advancement of Automotive Medicine Des Plaines, Iowa, 377-392.
Wierwille, W. W.; Hulse, M. C.; Fischer, T. J.; Dingus, T. A. (1988). Strategic Use of Visual Resources by the Driver while Navigating with an In-car Navigation Display System. FISITA. Congress. XXIInd. Automotive Systems Technology: the Future. Volume II. Technical Papers, Proceedings. Warrendale, PA: Society of Automotive Engineers, 2.661-2.675.

Wierwille, W.W. (1995). Development of an Initial Model Relating Driver In-Vehicle Visual Demands to Accident Rate, Proceedings of the 3rd Annual Mid-Atlantic Human Factors Conference, Blacksburg, VA: Virginia Polytechnic Institute and State University, 1-7.
Wierwille, W.W. and Tijerina, L. (1996). An Analysis of Driving Accident Narratives As a Means of Determining Problems Caused by In-Vehicle Visual Allocation and Visual Workload, in Gale, A.G., Brown, I.D., Haslegrave, C.M., and Taylor, S.P. (eds.), Vision in Vehicles V, Amsterdam, The Netherlands: Elsevier, 79-86.
Zylstra, B., Tsimhoni, O., Green, P., and Mayer, K. (in preparation). Driving Performance for Dialing, Radio Tuning, and Destination Entry while Driving Straight Roads (Technical Report UMTRI-2003-35). Ann Arbor, MI: The University of Michigan Transportation Research Institute.
CONTACT
Paul Green University of Michigan Transportation Research Institute Human Factors Division 2901 Baxter Road Ann Arbor, Michigan 48109-2150 USA Ph:1 734 763 3795, Fax :1 734 764 1221, [email protected] www.umich.edu/~driving
![9. Telematics and IVI [호환 모드] - Yonsei Universityweb.yonsei.ac.kr/hgjung/Lectures/DME427/9. Telematics and IVI.pdf · Telematics Telematics typically is any integrated use](https://img.pdfslide.net/doc/110x75/5bddac8609d3f27f5d8b6335/9-telematics-and-ivi-yonsei-telematics-and-ivipdf-telematics.jpg)