Embed Size (px)
Citation preview
R
Do
MKa
b
c
d
e
a
KTSDME
C
f
h1
Drug Resistance Updates 16 (2013) 108–115
Contents lists available at ScienceDirect
Drug Resistance Updates
jo ur nal homep age: www.elsev ier .com/ locate /drup
eview
rug-resistant tuberculosis in the WHO European Region: An analysisf surveillance data
atteo Zignola,∗, Masoud Darab, Anna S. Deana, Dennis Falzona, Andrei Dadub,ristin Kremerb, Harald Hoffmannc, Sven Hoffnerd,e, Katherine Floyda
Global Tuberculosis Programme, World Health Organization, Geneva, SwitzerlandTB and M/XDR-TB Programme, World Health Organization Regional Office for Europe, Copenhagen, DenmarkIML (Institute of Microbiology and Laboratory Medicine), synlab MVZ, Gauting, GermanyThe Public Health Agency of Sweden, Solna, SwedenMTC, Karolinska Institutet, Stockholm, Sweden
r t i c l e i n f o
eywords:uberculosisurveillancerug-resistanceDR-TB
uropean Region
a b s t r a c t
To review the latest information about levels of anti-tuberculosis (TB) drug resistance in the EuropeanRegion of the World Health Organization (WHO) and time-trends in multidrug-resistant TB (resistanceto isoniazid and rifampicin; MDR-TB) over the past fifteen years.
We analysed data on drug resistance among new and previously treated TB cases reported from 1997 to2012. Data are collected in surveys of representative samples of TB patients or from surveillance systemsbased on diagnostic drug susceptibility testing.
A total of 15.7% (95% confidence limits (CI): 9.5–21.9) of new and 45.3% (95%CI: 39.2–51.5) of previouslytreated TB cases are estimated to have MDR-TB in the Region. Extensively drug-resistant TB (MDR-TBand resistance to fluoroquinolones and second-line injectables; XDR-TB) had been reported by 38 ofthe 53 countries of the region (72%). The proportion of MDR-TB cases with XDR-TB is 11.4% (95%CI:
8.6–14.2). Between 1997 and 2012, population rates of MDR-TB declined in Estonia, Latvia and Germanyand increased in the United Kingdom, Sweden and Tomsk Oblasts of the Russian Federation.Surveillance of drug resistance has been strengthened in the WHO European Region, which has thehighest proportions of MDR-TB and XDR-TB ever reported globally. More complete data are neededparticularly from the Russian Federation.
© 2014 The Authors. Published by Elsevier Ltd.
Open access under CC BY-NC-ND license.
ontents
1. Introduction . . . . . . . . . . . . . . . . . . . . . . . . . . . . . . . . . . . . . . . . . . . . . . . . . . . . . . . . . . . . . . . . . . . . . . . . . . . . . . . . . . . . . . . . . . . . . . . . . . . . . . . . . . . . . . . . . . . . . . . . . . . . . . . . . . . . . . . . . 1092. Methods . . . . . . . . . . . . . . . . . . . . . . . . . . . . . . . . . . . . . . . . . . . . . . . . . . . . . . . . . . . . . . . . . . . . . . . . . . . . . . . . . . . . . . . . . . . . . . . . . . . . . . . . . . . . . . . . . . . . . . . . . . . . . . . . . . . . . . . . . . . . . 1093. Findings. . . . . . . . . . . . . . . . . . . . . . . . . . . . . . . . . . . . . . . . . . . . . . . . . . . . . . . . . . . . . . . . . . . . . . . . . . . . . . . . . . . . . . . . . . . . . . . . . . . . . . . . . . . . . . . . . . . . . . . . . . . . . . . . . . . . . . . . . . . . . . 109
3.1. Coverage of anti-TB drug resistance surveillance . . . . . . . . . . . . . . . . . . . . . . . . . . . . . . . . . . . . . . . . . . . . . . . . . . . . . . . . . . . . . . . . . . . . . . . . . . . . . . . . . . . . . . . . . . . 1093.2. Multidrug-resistant tuberculosis (MDR-TB) . . . . . . . . . . . . . . . . . . . . . . . . . . . . . . . . . . . . . . . . . . . . . . . . . . . . . . . . . . . . . . . . . . . . . . . . . . . . . . . . . . . . . . . . . . . . . . . . 1123.3. XDR-TB and resistance to second-line drugs . . . . . . . . . . . . . . . . . . . . . . . . . . . . . . . . . . . . . . . . . . . . . . . . . . . . . . . . . . . . . . . . . . . . . . . . . . . . . . . . . . . . . . . . . . . . . . . . 112
3.4. Trends in drug resistance . . . . . . . . . . . . . . . . . . . . . . . . . . . . . . . . . . . . . . . . . . .4. Discussion . . . . . . . . . . . . . . . . . . . . . . . . . . . . . . . . . . . . . . . . . . . . . . . . . . . . . . . . . . . . . . . . . .
References . . . . . . . . . . . . . . . . . . . . . . . . . . . . . . . . . . . . . . . . . . . . . . . . . . . . . . . . . . . . . . . . . .
∗ Corresponding author at: Global Tuberculosis Programme, World Health Organizationax: +41 22 791 1589.
E-mail address: [email protected] (M. Zignol).
ttp://dx.doi.org/10.1016/j.drup.2014.02.003368-7646 © 2014 The Authors. Published by Elsevier Ltd. Open access under CC BY-NC-ND
. . . . . . . . . . . . . . . . . . . . . . . . . . . . . . . . . . . . . . . . . . . . . . . . . . . . . . . . . . . . . . . . . . . . . . . . . 112. . . . . . . . . . . . . . . . . . . . . . . . . . . . . . . . . . . . . . . . . . . . . . . . . . . . . . . . . . . . . . . . . . . . . . . . . 114
. . . . . . . . . . . . . . . . . . . . . . . . . . . . . . . . . . . . . . . . . . . . . . . . . . . . . . . . . . . . . . . . . . . . . . . . . 115
, 20, Avenue Appia, 1211 Geneva 27, Switzerland. Tel.: +41 22 791 1847;
license.
ance U
1
hahoiohGer2c(ow2
twAdmbdacowc
Rat(rtsXtcwqmpra
lt
2
(
c1dpiae
M. Zignol et al. / Drug Resist
. Introduction
Resistance to anti-tuberculosis (TB) drugs represents a publicealth problem worldwide (Abubakar et al., 2013). The emergencend spread of drug-resistant Mycobacterium tuberculosis strainsas been documented since the early years of the introductionf chemotherapy for the treatment of TB, largely associated withnadequate treatment (Medical Research Council, 1948) and isften worsened by poor airborne infection control measures inealth care facilities and congregate settings (Kompala et al., 2013).lobally, a total of 450 000 (range 300 000–600 000) people arestimated to have contracted multidrug-resistant TB (MDR-TB;esistance to at least rifampicin and isoniazid) in 2012 (WHO,013a,b,c). Among them, approximately one quarter occurred inountries of the European Region of the World Health OrganizationWHO). In several of these countries, an alarmingly high proportionf TB patients have MDR-TB: up to half of all cases in some settingsithin the former Soviet Union (Jenkins et al., 2013; Skrahina et al.,
012; Zignol et al., 2012).Patients with MDR-TB require longer, expensive and more toxic
reatment regimens and are less likely to be cured comparedith those with drug-susceptible TB (Falzon et al., 2011, 2013).lthough policy guidance on the programmatic management ofrug resistant-TB (Falzon et al., 2011) and control of the trans-ission of resistant strains (WHO, 2009a,b) has been developed
y WHO, national TB control programmes face major challenges inetecting and treating MDR-TB and in controlling the developmentnd spread of drug-resistant TB. These include limited diagnosticapacity, shortages of high-quality medicines, insufficient numbersf health care professionals properly trained to care for patientsith MDR-TB, and suboptimal infection control measures in health
are facilities and congregate settings (Falzon et al., 2013).To address the problem of drug resistance in the WHO European
egion, a consolidated action plan to prevent and combat MDR-TBnd extensively drug-resistant TB (XDR-TB; MDR-TB with addi-ional resistance to a fluoroquinolone and a second-line injectable)WHO, 2011a,b) and a roadmap to prevent and combat drug-esistant TB (WHO, 2011a,b) have been developed. The Plan aimso contain the spread of drug-resistant TB by achieving univer-al access to prevention, diagnosis and treatment of MDR-TB andDR-TB in all countries of the Region. Surveillance of resistance
o anti-TB drugs is a fundamental component of the strategy toontrol drug-resistant TB, since it allows the proportion of casesith drug resistance in a population to be monitored and, conse-
uently, assessment of the effectiveness of prevention and controleasures. This information can in turn be used to plan appro-
riate measures for early detection, design effective treatmentegimens, assess epidemiological trends, and to promptly identifynd respond to outbreaks (Zignol et al., 2011).
In this article, we review the latest available information aboutevels of anti-TB drug resistance in the WHO European Region andime-trends in MDR-TB over the past fifteen years.
. Methods
The WHO European Region includes 53 Member StatesTables 1 and 2).
Drug resistance surveillance data have been collected from spe-ial surveys and/or continuous surveillance conducted between997 and 2012. Special surveys are epidemiological studiesesigned to measure drug resistance among a representative sam-
le of notified patients with pulmonary TB. Continuous surveillances based on routine diagnostic drug susceptibility testing (DST) ofll bacteriologically confirmed TB patients (WHO, 2009a,b; Zignolt al., 2012). The following three main principles, discussed in detail
pdates 16 (2013) 108–115 109
elsewhere (WHO, 2009a,b; WHO, 2010; Zignol et al., 2011), are usedby WHO to ensure quality and representativeness of surveillancedata on anti-TB drug resistance: (a) data should be representativeof TB cases in the country or geographical setting under study;(b) drug resistance among new TB cases should be clearly distin-guished from drug resistance among previously treated TB cases;and (c) laboratory methods for DST should be selected from amongthose that are endorsed by WHO and laboratory results should bequality-assured. Only data collected according to these principleswere used in our analyses. A global network of 29 Supranational TBReference Laboratories controls the quality of DST results; nearlyhalf of them (14/29) are in the WHO European Region (STOP TBPartnership, 2013; Van Deun et al., 2011).
Aggregated data from special surveys were collected by WHOusing a standard data collection form while continuous surveillancedata were captured on an annual basis through the electronic “WHOglobal TB data collection system” (WHO, 2013a,b,c). WHO classi-fies the survey and continuous surveillance data according to theirquality and representativeness using criteria detailed elsewhere(WHO, 2009a,b, 2010, 2013a,b,c) based on coverage of culture andDST services among TB patients. Data on resistance to rifampicinand isoniazid were assessed to measure the proportion of caseswith MDR-TB. Among confirmed cases of MDR-TB, data were col-lected to measure the frequency of XDR-TB.
The proportions of new and previously treated TB cases withMDR-TB, the proportion of MDR-TB cases with XDR-TB, the propor-tion of MDR-TB cases with resistance to any fluoroquinolone, andthe proportion of MDR-TB cases with resistance to any second-lineinjectable agent were calculated for each country. The proportion ofMDR-TB cases with fluoroquinolone resistance and the proportionof MDR-TB cases with resistance to second-line injectable agentsdiscussed in this paper include also XDR-TB cases. Robust stan-dard errors were used where data from sub-national areas wereavailable for multiple years (Spain). Country estimates for coun-tries with subnational level data only (the Russian Federation andSpain) and regional estimates were then derived using randomeffects logistic regression, with the country (or setting in case ofcountry estimates) as a cluster. All analyses were performed usingStata (Version 12; Stata Corp. LP, College Station, USA).
The MDR-TB rate is defined as the annual number of estimatednew MDR-TB cases per 100 000 population (UN, 2013). MDR-TBrates between 1997 and 2012 were calculated by multiplying thenotification rate of new TB cases reported annually to WHO (WHO,2013a,b,c) by the proportion of MDR-TB among new TB casesreported in the same setting and year. These data points were plot-ted in MS Excel and exponential lines were fitted. The averageannual percentage change in the rate of MDR-TB was calculatedfor settings where anti-TB drug resistance had been measured in atleast five different years.
3. Findings
3.1. Coverage of anti-TB drug resistance surveillance
Fig. 1 shows the coverage of surveillance of drug resistance inthe WHO European Region. Drug resistance data were availablefrom 51 of the 53 countries of the WHO European Region. The twoexceptions were Monaco and San Marino, where cases of TB havebeen notified only sporadically over the past fifteen years; thesetwo countries were therefore not included in our analyses. Mostcountries with surveillance data (88%; 45/51) have continuous
surveillance systems. The remaining six countries (Armenia, Azer-baijan, Romania, Tajikistan, Turkmenistan and Uzbekistan) haverelied on special surveys of representative samples of patients.Nationwide and population-representative data were available
110 M. Zignol et al. / Drug Resistance Updates 16 (2013) 108–115
Table 1MDR-TB among new and previously treated cases, by country, the WHO European Region.
Country Yeara New cases Previously treated cases Number of country-yeardata points
Cases w ith DSTresults (H + R)
MDR-TB % (95%CI)b
Cases w ith DSTresults (H + R)
MDR-TB % (95%CI)b
Albania 2012 172 0.6 15 0.0 3Andorra 2011 1 0.0 1 0.0 11Armenia 2007 552 9.4(7.0–12.4) 340 43.2 (37.9–48.7) 1Austria 2011 257 3.5 11 18.2 13Azerbaijan (Baku city) 2007 551 22.3(18.6–26.6) 552 55.8 (49.7–62.4) 1Belarus 2012 2164 34.8 1183 68.6 3Belgium 2011 524 1.3 35 11.4 13Bosnia and Herzegovina 2011 704 0.1 41 9.8 12Bulgaria 2012 687 2.3 142 23.2 2Croatia 2011 353 0.3 40 2.5 9Cyprus 2011 25 4.0 2 0.0 8Czech Republic 2011 392 1.5 16 6.3 14Denmark 2011 257 1.2 14 0.0 14Estonia 2012 193 19.7 46 50.0 16Finland 2012 206 1.5 14 0.0 15France 2009 2890 0.5 106 13.2 13Georgia 2012 1931 9.2 541 31.2 5Germany 2012 2198 1.5 116 10.3 16Greece 2010 115 0.9 15 6.7 4Hungary 2010 474 2.1 80 8.8 2Iceland 2012 4 0.0 1 100.0 14Ireland 2012 190 1.1 17 0.0 13Israel 2012 318 4.7 6 33.3 15Italy 2011 760 4.0 441 5.4 12Kazakhstan 2012 8154 22.9 10443 55.0 3Kyrgyzstan 2012 504 26.4 662 68.4 1Latvia 2012 666 11.1 100 32.0 16Lithuania 2012 1017 11.4 350 44.0 14Luxembourg 2011 7 0.0 1 0.0 9Malta 2012 13 0.0 1 0.0 11MonacoMontenegro 2012 58 0.0 5 0.0 8Netherlands 2012 628 1.6 28 3.6 16Norway 2011 229 1.3 22 0.0 14Poland 2012 4073 0.5 535 2.1 6Portugal 2011 1155 1.5 97 5.2 13Republic of Moldova 2012 1264 23.7 933 62.3 3Romania 2004 849 2.8(1.8–4.2) 382 11.0(80.–14.6) 2Russian Federation (39
Federal Subjectsc)2011 23.1 48.6 1–11e
San MarinoSerbia 2012 716 0.8 83 3.6 7Slovakia 2012 142 0.0 27 3.7 14Slovenia 2012 114 0.0 12 0.0 15Spain (Aragon, Catalonia
and Galicia regions)2005 0.2 7.1 1–9e
Sweden 2012 453 2.4 24 8.3 15Switzerland 2012 246 1.2 31 12.9 15Tajikistan 2011d 544 12.5(9.8–15.6) 496 56.0 1The Former Yugoslav
Republic of Macedonia2012 155 0.0 26 15.4 4
Turkey 2012 4742 3.2 641 21.8 1Turkmenistan (Aral Sea
region)2002 105 3.8(1.1–9.5) 98 18.4(11.3–27.5) 1
Ukraine 2012 11185 14.4 5925 32.2 1United Kingdom of Great
Britain and NorthernIreland
2011 4549 1.3 234 5.6 14
Uzbekistan 2011 705 23.2(17.8–29.5) 332 62 (52.5–70.7) 1
CI = confidence interval; DST = drug susceptibility testing; H + R = isoniazid plus rifampicin.a Data from the most recent year are shown.b CI are displayed only for countries that conducted a survey.c The 39 Federal Subjects are: Adygea Republic, Arkhangelsk Oblast, Belgorod Oblast, Bryansk Oblast, Chukotka Autonomous Okrug, Chuvasia Republic, Ivanovo Oblast,
Kaliningrad Oblast, Kamchatka Krai Oblast, Karelia Republic, Kemerovo Oblast, Khabarovsk Krai, Khakassia Republic, Komi Republic, Kostroma Oblast, Leningrad Oblast,Magadan Oblast, Mary-El Republic, Murmansk Oblast, Nizhni Novgorod Oblast, Novgorod Oblast, Omsk Oblast, Orel Oblast, Penza Oblast, Primorsky Krai, Pskov Oblast, Sakha(Yakutia) Republic, Sakhalin Oblast, Samara Oblast, Tambov Oblast, Tomsk Oblast, Trans-Baikal Krai (Chita Oblast), Tula Oblast, Tver Oblast, Ulyanovsk Oblast, Vladimir Oblast,Vologda Oblast, Voronezh Oblast, and Yamalo-Nents Autonomous Okrug.
d Data on previously treated cases refer to the year 2012.e For countries without national level data but for which data are available for more than one subnational area, the range of area-year data points is shown.
M. Zignol et al. / Drug Resistance Updates 16 (2013) 108–115 111
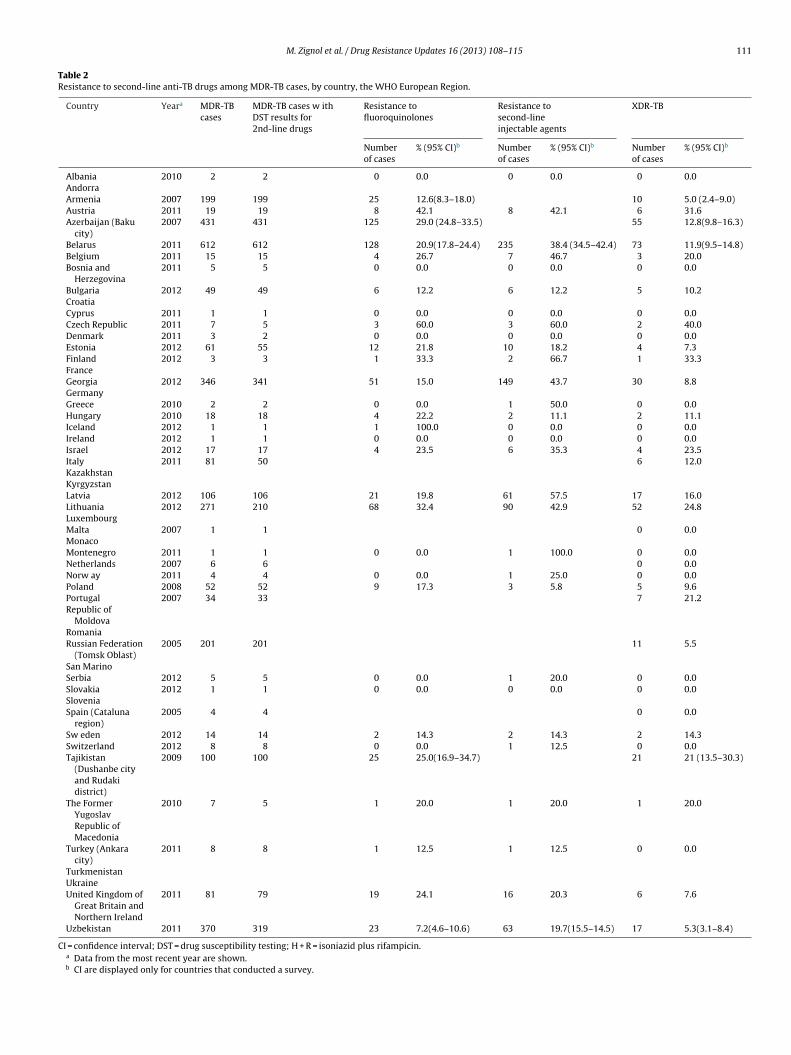
Table 2Resistance to second-line anti-TB drugs among MDR-TB cases, by country, the WHO European Region.
Country Yeara MDR-TBcases
MDR-TB cases w ithDST results for2nd-line drugs
Resistance tofluoroquinolones
Resistance tosecond-lineinjectable agents
XDR-TB
Numberof cases
% (95% CI)b Numberof cases
% (95% CI)b Numberof cases
% (95% CI)b
Albania 2010 2 2 0 0.0 0 0.0 0 0.0AndorraArmenia 2007 199 199 25 12.6(8.3–18.0) 10 5.0 (2.4–9.0)Austria 2011 19 19 8 42.1 8 42.1 6 31.6Azerbaijan (Baku
city)2007 431 431 125 29.0 (24.8–33.5) 55 12.8(9.8–16.3)
Belarus 2011 612 612 128 20.9(17.8–24.4) 235 38.4 (34.5–42.4) 73 11.9(9.5–14.8)Belgium 2011 15 15 4 26.7 7 46.7 3 20.0Bosnia and
Herzegovina2011 5 5 0 0.0 0 0.0 0 0.0
Bulgaria 2012 49 49 6 12.2 6 12.2 5 10.2CroatiaCyprus 2011 1 1 0 0.0 0 0.0 0 0.0Czech Republic 2011 7 5 3 60.0 3 60.0 2 40.0Denmark 2011 3 2 0 0.0 0 0.0 0 0.0Estonia 2012 61 55 12 21.8 10 18.2 4 7.3Finland 2012 3 3 1 33.3 2 66.7 1 33.3FranceGeorgia 2012 346 341 51 15.0 149 43.7 30 8.8GermanyGreece 2010 2 2 0 0.0 1 50.0 0 0.0Hungary 2010 18 18 4 22.2 2 11.1 2 11.1Iceland 2012 1 1 1 100.0 0 0.0 0 0.0Ireland 2012 1 1 0 0.0 0 0.0 0 0.0Israel 2012 17 17 4 23.5 6 35.3 4 23.5Italy 2011 81 50 6 12.0KazakhstanKyrgyzstanLatvia 2012 106 106 21 19.8 61 57.5 17 16.0Lithuania 2012 271 210 68 32.4 90 42.9 52 24.8LuxembourgMalta 2007 1 1 0 0.0MonacoMontenegro 2011 1 1 0 0.0 1 100.0 0 0.0Netherlands 2007 6 6 0 0.0Norw ay 2011 4 4 0 0.0 1 25.0 0 0.0Poland 2008 52 52 9 17.3 3 5.8 5 9.6Portugal 2007 34 33 7 21.2Republic of
MoldovaRomaniaRussian Federation
(Tomsk Oblast)2005 201 201 11 5.5
San MarinoSerbia 2012 5 5 0 0.0 1 20.0 0 0.0Slovakia 2012 1 1 0 0.0 0 0.0 0 0.0SloveniaSpain (Cataluna
region)2005 4 4 0 0.0
Sw eden 2012 14 14 2 14.3 2 14.3 2 14.3Switzerland 2012 8 8 0 0.0 1 12.5 0 0.0Tajikistan
(Dushanbe cityand Rudakidistrict)
2009 100 100 25 25.0(16.9–34.7) 21 21 (13.5–30.3)
The FormerYugoslavRepublic ofMacedonia
2010 7 5 1 20.0 1 20.0 1 20.0
Turkey (Ankaracity)
2011 8 8 1 12.5 1 12.5 0 0.0
TurkmenistanUkraineUnited Kingdom of
Great Britain andNorthern Ireland
2011 81 79 19 24.1 16 20.3 6 7.6
Uzbekistan 2011 370 319 23 7.2(4.6–10.6) 63 19.7(15.5–14.5) 17 5.3(3.1–8.4)
CI = confidence interval; DST = drug susceptibility testing; H + R = isoniazid plus rifampicin.a Data from the most recent year are shown.b CI are displayed only for countries that conducted a survey.
112 M. Zignol et al. / Drug Resistance Updates 16 (2013) 108–115
g resi
fRarnweraSuali
3
tiK2AH2
m
ararBi(iotrt
tCOKOO(TO
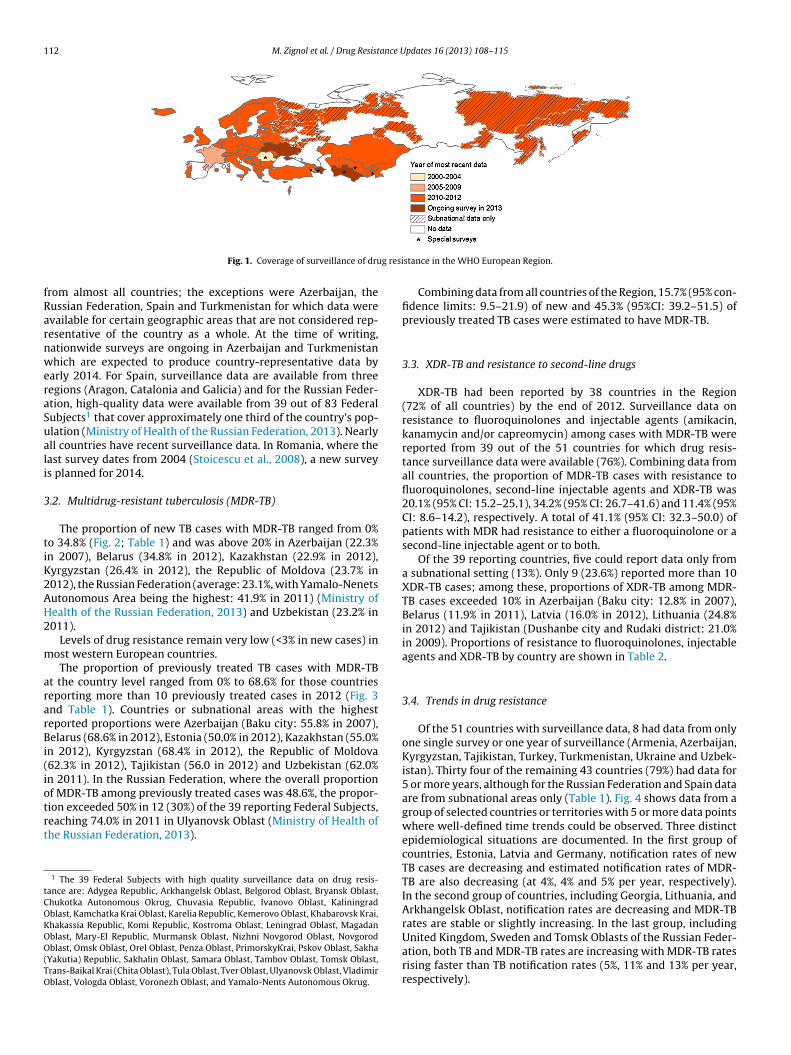
Fig. 1. Coverage of surveillance of dru
rom almost all countries; the exceptions were Azerbaijan, theussian Federation, Spain and Turkmenistan for which data werevailable for certain geographic areas that are not considered rep-esentative of the country as a whole. At the time of writing,ationwide surveys are ongoing in Azerbaijan and Turkmenistanhich are expected to produce country-representative data by
arly 2014. For Spain, surveillance data are available from threeegions (Aragon, Catalonia and Galicia) and for the Russian Feder-tion, high-quality data were available from 39 out of 83 Federalubjects1 that cover approximately one third of the country’s pop-lation (Ministry of Health of the Russian Federation, 2013). Nearlyll countries have recent surveillance data. In Romania, where theast survey dates from 2004 (Stoicescu et al., 2008), a new surveys planned for 2014.
.2. Multidrug-resistant tuberculosis (MDR-TB)
The proportion of new TB cases with MDR-TB ranged from 0%o 34.8% (Fig. 2; Table 1) and was above 20% in Azerbaijan (22.3%n 2007), Belarus (34.8% in 2012), Kazakhstan (22.9% in 2012),yrgyzstan (26.4% in 2012), the Republic of Moldova (23.7% in012), the Russian Federation (average: 23.1%, with Yamalo-Nenetsutonomous Area being the highest: 41.9% in 2011) (Ministry ofealth of the Russian Federation, 2013) and Uzbekistan (23.2% in011).
Levels of drug resistance remain very low (<3% in new cases) inost western European countries.The proportion of previously treated TB cases with MDR-TB
t the country level ranged from 0% to 68.6% for those countrieseporting more than 10 previously treated cases in 2012 (Fig. 3nd Table 1). Countries or subnational areas with the highesteported proportions were Azerbaijan (Baku city: 55.8% in 2007),elarus (68.6% in 2012), Estonia (50.0% in 2012), Kazakhstan (55.0%
n 2012), Kyrgyzstan (68.4% in 2012), the Republic of Moldova62.3% in 2012), Tajikistan (56.0 in 2012) and Uzbekistan (62.0%n 2011). In the Russian Federation, where the overall proportionf MDR-TB among previously treated cases was 48.6%, the propor-
ion exceeded 50% in 12 (30%) of the 39 reporting Federal Subjects,eaching 74.0% in 2011 in Ulyanovsk Oblast (Ministry of Health ofhe Russian Federation, 2013).1 The 39 Federal Subjects with high quality surveillance data on drug resis-ance are: Adygea Republic, Arkhangelsk Oblast, Belgorod Oblast, Bryansk Oblast,hukotka Autonomous Okrug, Chuvasia Republic, Ivanovo Oblast, Kaliningradblast, Kamchatka Krai Oblast, Karelia Republic, Kemerovo Oblast, Khabarovsk Krai,hakassia Republic, Komi Republic, Kostroma Oblast, Leningrad Oblast, Magadanblast, Mary-El Republic, Murmansk Oblast, Nizhni Novgorod Oblast, Novgorodblast, Omsk Oblast, Orel Oblast, Penza Oblast, PrimorskyKrai, Pskov Oblast, Sakha
Yakutia) Republic, Sakhalin Oblast, Samara Oblast, Tambov Oblast, Tomsk Oblast,rans-Baikal Krai (Chita Oblast), Tula Oblast, Tver Oblast, Ulyanovsk Oblast, Vladimirblast, Vologda Oblast, Voronezh Oblast, and Yamalo-Nents Autonomous Okrug.
stance in the WHO European Region.
Combining data from all countries of the Region, 15.7% (95% con-fidence limits: 9.5–21.9) of new and 45.3% (95%CI: 39.2–51.5) ofpreviously treated TB cases were estimated to have MDR-TB.
3.3. XDR-TB and resistance to second-line drugs
XDR-TB had been reported by 38 countries in the Region(72% of all countries) by the end of 2012. Surveillance data onresistance to fluoroquinolones and injectable agents (amikacin,kanamycin and/or capreomycin) among cases with MDR-TB werereported from 39 out of the 51 countries for which drug resis-tance surveillance data were available (76%). Combining data fromall countries, the proportion of MDR-TB cases with resistance tofluoroquinolones, second-line injectable agents and XDR-TB was20.1% (95% CI: 15.2–25.1), 34.2% (95% CI: 26.7–41.6) and 11.4% (95%CI: 8.6–14.2), respectively. A total of 41.1% (95% CI: 32.3–50.0) ofpatients with MDR had resistance to either a fluoroquinolone or asecond-line injectable agent or to both.
Of the 39 reporting countries, five could report data only froma subnational setting (13%). Only 9 (23.6%) reported more than 10XDR-TB cases; among these, proportions of XDR-TB among MDR-TB cases exceeded 10% in Azerbaijan (Baku city: 12.8% in 2007),Belarus (11.9% in 2011), Latvia (16.0% in 2012), Lithuania (24.8%in 2012) and Tajikistan (Dushanbe city and Rudaki district: 21.0%in 2009). Proportions of resistance to fluoroquinolones, injectableagents and XDR-TB by country are shown in Table 2.
3.4. Trends in drug resistance
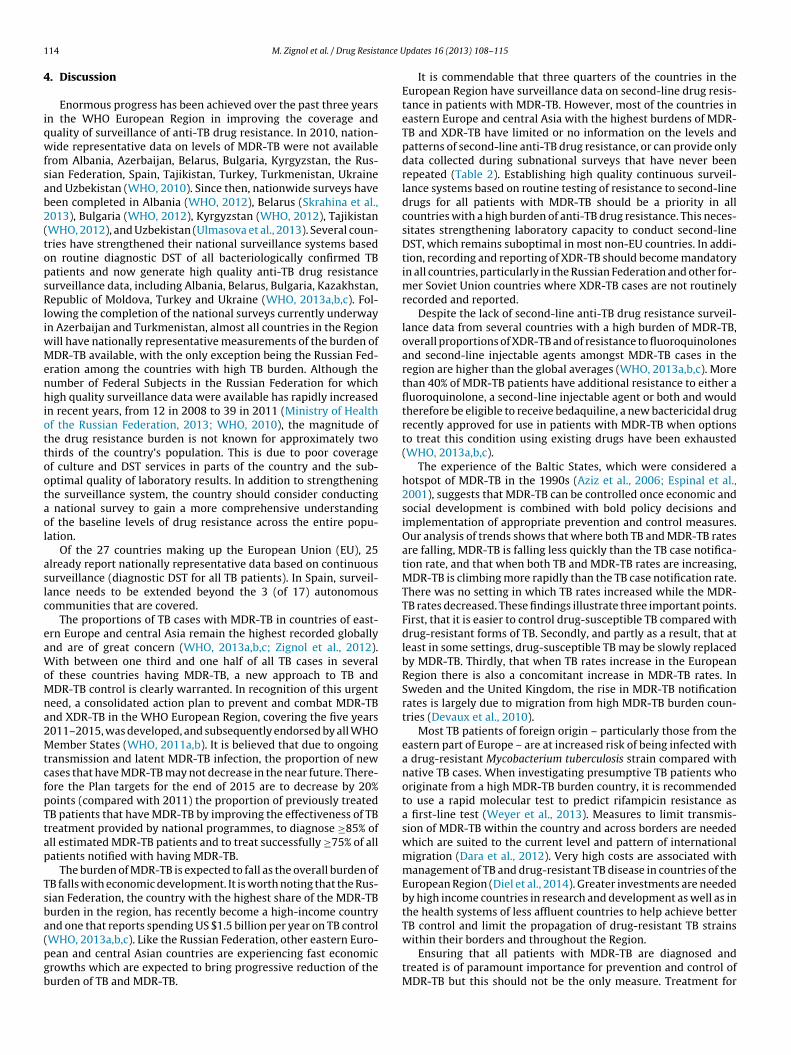
Of the 51 countries with surveillance data, 8 had data from onlyone single survey or one year of surveillance (Armenia, Azerbaijan,Kyrgyzstan, Tajikistan, Turkey, Turkmenistan, Ukraine and Uzbek-istan). Thirty four of the remaining 43 countries (79%) had data for5 or more years, although for the Russian Federation and Spain dataare from subnational areas only (Table 1). Fig. 4 shows data from agroup of selected countries or territories with 5 or more data pointswhere well-defined time trends could be observed. Three distinctepidemiological situations are documented. In the first group ofcountries, Estonia, Latvia and Germany, notification rates of newTB cases are decreasing and estimated notification rates of MDR-TB are also decreasing (at 4%, 4% and 5% per year, respectively).In the second group of countries, including Georgia, Lithuania, andArkhangelsk Oblast, notification rates are decreasing and MDR-TBrates are stable or slightly increasing. In the last group, including
United Kingdom, Sweden and Tomsk Oblasts of the Russian Feder-ation, both TB and MDR-TB rates are increasing with MDR-TB ratesrising faster than TB notification rates (5%, 11% and 13% per year,respectively).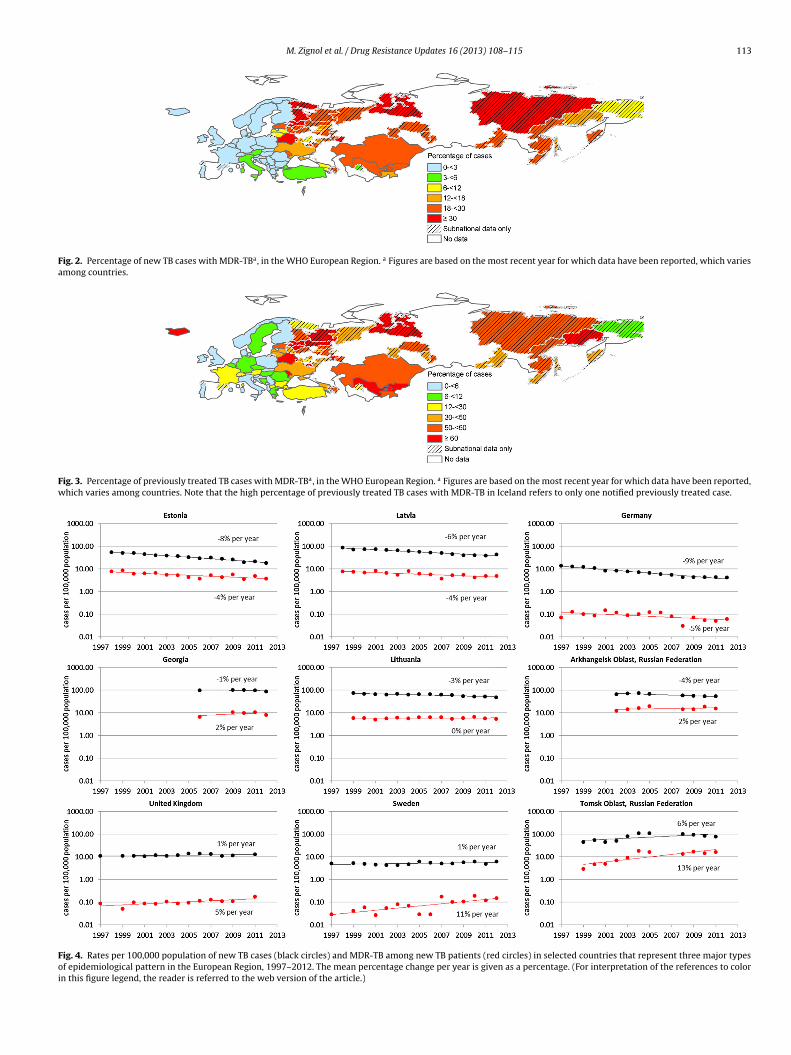
M. Zignol et al. / Drug Resistance Updates 16 (2013) 108–115 113
Fig. 2. Percentage of new TB cases with MDR-TBa, in the WHO European Region. a Figures are based on the most recent year for which data have been reported, which variesamong countries.
Fig. 3. Percentage of previously treated TB cases with MDR-TBa, in the WHO European Region. a Figures are based on the most recent year for which data have been reported,which varies among countries. Note that the high percentage of previously treated TB cases with MDR-TB in Iceland refers to only one notified previously treated case.
Fig. 4. Rates per 100,000 population of new TB cases (black circles) and MDR-TB among new TB patients (red circles) in selected countries that represent three major typesof epidemiological pattern in the European Region, 1997–2012. The mean percentage change per year is given as a percentage. (For interpretation of the references to colorin this figure legend, the reader is referred to the web version of the article.)
1 ance U
4
iqwfsab2(topsRliwMenhiottootaol
aslc
eaWoMna2MtcfpTtap
Tsba(pgb
14 M. Zignol et al. / Drug Resist
. Discussion
Enormous progress has been achieved over the past three yearsn the WHO European Region in improving the coverage anduality of surveillance of anti-TB drug resistance. In 2010, nation-ide representative data on levels of MDR-TB were not available
rom Albania, Azerbaijan, Belarus, Bulgaria, Kyrgyzstan, the Rus-ian Federation, Spain, Tajikistan, Turkey, Turkmenistan, Ukrainend Uzbekistan (WHO, 2010). Since then, nationwide surveys haveeen completed in Albania (WHO, 2012), Belarus (Skrahina et al.,013), Bulgaria (WHO, 2012), Kyrgyzstan (WHO, 2012), TajikistanWHO, 2012), and Uzbekistan (Ulmasova et al., 2013). Several coun-ries have strengthened their national surveillance systems basedn routine diagnostic DST of all bacteriologically confirmed TBatients and now generate high quality anti-TB drug resistanceurveillance data, including Albania, Belarus, Bulgaria, Kazakhstan,epublic of Moldova, Turkey and Ukraine (WHO, 2013a,b,c). Fol-
owing the completion of the national surveys currently underwayn Azerbaijan and Turkmenistan, almost all countries in the Region
ill have nationally representative measurements of the burden ofDR-TB available, with the only exception being the Russian Fed-
ration among the countries with high TB burden. Although theumber of Federal Subjects in the Russian Federation for whichigh quality surveillance data were available has rapidly increased
n recent years, from 12 in 2008 to 39 in 2011 (Ministry of Healthf the Russian Federation, 2013; WHO, 2010), the magnitude ofhe drug resistance burden is not known for approximately twohirds of the country’s population. This is due to poor coveragef culture and DST services in parts of the country and the sub-ptimal quality of laboratory results. In addition to strengtheninghe surveillance system, the country should consider conducting
national survey to gain a more comprehensive understandingf the baseline levels of drug resistance across the entire popu-ation.
Of the 27 countries making up the European Union (EU), 25lready report nationally representative data based on continuousurveillance (diagnostic DST for all TB patients). In Spain, surveil-ance needs to be extended beyond the 3 (of 17) autonomousommunities that are covered.
The proportions of TB cases with MDR-TB in countries of east-rn Europe and central Asia remain the highest recorded globallynd are of great concern (WHO, 2013a,b,c; Zignol et al., 2012).ith between one third and one half of all TB cases in several
f these countries having MDR-TB, a new approach to TB andDR-TB control is clearly warranted. In recognition of this urgent
eed, a consolidated action plan to prevent and combat MDR-TBnd XDR-TB in the WHO European Region, covering the five years011–2015, was developed, and subsequently endorsed by all WHOember States (WHO, 2011a,b). It is believed that due to ongoing
ransmission and latent MDR-TB infection, the proportion of newases that have MDR-TB may not decrease in the near future. There-ore the Plan targets for the end of 2015 are to decrease by 20%oints (compared with 2011) the proportion of previously treatedB patients that have MDR-TB by improving the effectiveness of TBreatment provided by national programmes, to diagnose ≥85% ofll estimated MDR-TB patients and to treat successfully ≥75% of allatients notified with having MDR-TB.
The burden of MDR-TB is expected to fall as the overall burden ofB falls with economic development. It is worth noting that the Rus-ian Federation, the country with the highest share of the MDR-TBurden in the region, has recently become a high-income countrynd one that reports spending US $1.5 billion per year on TB control
WHO, 2013a,b,c). Like the Russian Federation, other eastern Euro-ean and central Asian countries are experiencing fast economicrowths which are expected to bring progressive reduction of theurden of TB and MDR-TB.pdates 16 (2013) 108–115
It is commendable that three quarters of the countries in theEuropean Region have surveillance data on second-line drug resis-tance in patients with MDR-TB. However, most of the countries ineastern Europe and central Asia with the highest burdens of MDR-TB and XDR-TB have limited or no information on the levels andpatterns of second-line anti-TB drug resistance, or can provide onlydata collected during subnational surveys that have never beenrepeated (Table 2). Establishing high quality continuous surveil-lance systems based on routine testing of resistance to second-linedrugs for all patients with MDR-TB should be a priority in allcountries with a high burden of anti-TB drug resistance. This neces-sitates strengthening laboratory capacity to conduct second-lineDST, which remains suboptimal in most non-EU countries. In addi-tion, recording and reporting of XDR-TB should become mandatoryin all countries, particularly in the Russian Federation and other for-mer Soviet Union countries where XDR-TB cases are not routinelyrecorded and reported.
Despite the lack of second-line anti-TB drug resistance surveil-lance data from several countries with a high burden of MDR-TB,overall proportions of XDR-TB and of resistance to fluoroquinolonesand second-line injectable agents amongst MDR-TB cases in theregion are higher than the global averages (WHO, 2013a,b,c). Morethan 40% of MDR-TB patients have additional resistance to either afluoroquinolone, a second-line injectable agent or both and wouldtherefore be eligible to receive bedaquiline, a new bactericidal drugrecently approved for use in patients with MDR-TB when optionsto treat this condition using existing drugs have been exhausted(WHO, 2013a,b,c).
The experience of the Baltic States, which were considered ahotspot of MDR-TB in the 1990s (Aziz et al., 2006; Espinal et al.,2001), suggests that MDR-TB can be controlled once economic andsocial development is combined with bold policy decisions andimplementation of appropriate prevention and control measures.Our analysis of trends shows that where both TB and MDR-TB ratesare falling, MDR-TB is falling less quickly than the TB case notifica-tion rate, and that when both TB and MDR-TB rates are increasing,MDR-TB is climbing more rapidly than the TB case notification rate.There was no setting in which TB rates increased while the MDR-TB rates decreased. These findings illustrate three important points.First, that it is easier to control drug-susceptible TB compared withdrug-resistant forms of TB. Secondly, and partly as a result, that atleast in some settings, drug-susceptible TB may be slowly replacedby MDR-TB. Thirdly, that when TB rates increase in the EuropeanRegion there is also a concomitant increase in MDR-TB rates. InSweden and the United Kingdom, the rise in MDR-TB notificationrates is largely due to migration from high MDR-TB burden coun-tries (Devaux et al., 2010).
Most TB patients of foreign origin – particularly those from theeastern part of Europe – are at increased risk of being infected witha drug-resistant Mycobacterium tuberculosis strain compared withnative TB cases. When investigating presumptive TB patients whooriginate from a high MDR-TB burden country, it is recommendedto use a rapid molecular test to predict rifampicin resistance asa first-line test (Weyer et al., 2013). Measures to limit transmis-sion of MDR-TB within the country and across borders are neededwhich are suited to the current level and pattern of internationalmigration (Dara et al., 2012). Very high costs are associated withmanagement of TB and drug-resistant TB disease in countries of theEuropean Region (Diel et al., 2014). Greater investments are neededby high income countries in research and development as well as inthe health systems of less affluent countries to help achieve betterTB control and limit the propagation of drug-resistant TB strains
within their borders and throughout the Region.Ensuring that all patients with MDR-TB are diagnosed andtreated is of paramount importance for prevention and control ofMDR-TB but this should not be the only measure. Treatment for
ance U
Mioeps(i(
R
A
A
D
D
D
E
F
F
J
K
M
MModernizing surveillance of anti-tuberculosis drug resistance: from special sur-
M. Zignol et al. / Drug Resist
DR-TB and XDR-TB is long and associated with significant tox-cities and, globally, only slightly more than half of those startedn treatment successfully complete their course of therapy (Falzont al., 2013). It is therefore critical to invest resources in therevention of MDR-TB, including ensuring that all patients withusceptible TB are treated according to international standardsMigliori et al., 2012) and infection control practices are properlymplemented, particularly in health care and congregate settingsWHO, 2009a,b, 2011a,b).
eferences
bubakar, I., Zignol, M., Falzon, D., Raviglione, M., Ditiu, L., Masham, S., Adetifa, I.,Ford, N., Cox, H., Lawn, S.D., Marais, B.J., McHugh, T.D., Mwaba, P., Bates, M.,Lipman, M., Zijenah, L., Logan, S., McNerney, R., Zumla, A., Sarda, K., Nahid, P.,Hoelscher, M., Pletschette, M., Memish, Z.A., Kim, P., Hafner, R., Cole, S., Migliori,G.B., Maeurer, M., Schito, M., Zumla, A., 2013. Drug-resistant tuberculosis: timefor visionary political leadership. Lancet Infect. Dis. 13, 529–539.
ziz, M.A., Wright, A., Laszlo, A., De Muynck, A., Portaels, F., Van Deun, A., Wells,C., Nunn, P., Blanc, L., Raviglione, M., 2006. WHO/International union againsttuberculosis and lung disease global project on anti-tuberculosis drug resis-tance surveillance, epidemiology of antituberculosis drug resistance (the globalproject on anti-tuberculosis drug resistance surveillance): an updated analysis.Lancet 368, 2142–2154.
ara, M., de Colombani, P., Petrova-Benedict, R., Centis, R., Zellweger, J.P., Sand-gren, A., Heldal, E., Sotgiu, G., Jansen, N., Bahtijarevic, R., Migliori, G.B., WolfhezeTransborder Migration Task Force, 2012. Minimum package for cross-border TBcontrol and care in the WHO European region: a Wolfheze consensus statement.Eur. Respir. J. 40, 1081–1090.
evaux, I., Manissero, D., Fernandez de la Hoz, K., Kremer, K., van Soolingen, D.,EuroTB network, 2010. Surveillance of extensively drug-resistant tuberculosisin EUROPE, 2003–2007. Euro Surveill. vol. 15 (pii:19518).
iel, R., Vandeputte, J., de Vries, G., Stillo, J., Wanlin, M., Nienhaus, A., 2014. Costs oftuberculosis disease in the EU – a systematic analysis and cost calculation. Eur.Respir. J. 43, 554–565.
spinal, M.A., Laszlo, A., Simonsen, L., Boulahbal, F., Kim, S.J., Reniero, A., Hoffner,S., Rieder, H.L., Binkin, N., Dye, C., Williams, R., Raviglione, M.C., 2001. Globaltrends in resistance to antituberculosis drugs. World Health Organization-International Union against Tuberculosis and Lung Disease Working Group onAnti-Tuberculosis Drug Resistance Surveillance. N. Engl. J. Med. 344, 1294–1303.
alzon, D., Jaramillo, E., Schünemann, H., Arentz, M., Bayona, J., Blanc, L., Daley, C.,Duncombe, C., Fitzpatrick, C., Gebhard, A., Getahun, H., Henkens, M., Holtz, T.,Keravec, J., Keshavjee, S., Khan, A., Kulier, R., Leimane, V., Lienhardt, C., Mar-iandyshev, A., Migliori, G.B., Mirzayev, F., Mitnick, C., Nunn, P., Nwagboniwe, G.,Oxlade, O., Palmero, D., Pavlinac, P., Quelapio, M., Raviglione, M.C., Rich, M.L.,Royce, S., RüschGerdes, S., Salakaia, A., Sarin, R., Sculier, D., Varaine, F., Vitoria,M., Walson, J.L., Wares, F., Weyer, K., White, R.A., Zignol, M., 2011. WHO guide-lines for the programmatic management of drug-resistant tuberculosis: 2011update. Eur. Respir. J. 38, 516–528.
alzon, D., Jaramillo, E., Wares, F., Zignol, M., Floyd, K., Raviglione, M.C., 2013. Univer-sal access to care for multidrug-resistant tuberculosis: an analysis of surveillancedata. Lancet Infect. Dis. 13, 690–697.
enkins, H.E., Plesca, V., Ciobanu, A., Crudu, V., Galusca, I., Soltan, V., Serbulenco, A.,Zignol, M., Dadu, A., Dara, M., Cohen, T., 2013. Assessing spatial heterogeneityof multidrug-resistant tuberculosis in a high-burden country. Eur. Respir. J. 42,1291–1301.
ompala, T., Shenoi, S.V., Friedland, G., 2013. Transmission of tuberculosis inresource-limited settings. Curr. HIV/AIDS Rep. 10, 264–272.
edical Research Council, 1948. Streptomycin treatment of pulmonary tuberculosis.A Medical Research Council investigation. Br. Med. J. 2, 769–782.
igliori, G.B., Zellweger, J.P., Abubakar, I., Ibraim, E., Caminero, J.A., De Vries, G.,D’Ambrosio, L., Centis, R., Sotgiu, G., Menegale, O., Kliiman, K., Aksamit, T., Cir-
illo, D.M., Danilovits, M., Dara, M., Dheda, K., Dinh-Xuan, A.T., Kluge, H., Lange,C., Leimane, V., Loddenkemper, R., Nicod, L.P., Raviglione, M.C., Spanevello, A.,Thomsen, V.Ø., Villar, M., Wanlin, M., Wedzicha, J.A., Zumla, A., Blasi, F., Huitric,E., Sandgren, A., Manissero, D., 2012. European union standards for tuberculosiscare. Eur. Respir. J. 39, 807–819.pdates 16 (2013) 108–115 115
Ministry of Health of the Russian Federation, 2013. Tuberculosis in the Russian Fed-eration 2011: An Analytical Review of Statistical Indicators Used in the RussianFederation (in Russian).
Skrahina, A., Hurevich, H., Zalutskaya, A., Sahalchyk, E., Astrauko, A., Hoffner, S.,Rusovich, V., Dadu, A., de Colombani, P., Dara, M., van Gemert, W., Zignol, M.,2013. Multidrug-resistant tuberculosis in Belarus: the size of the problem andassociated risk factors. Bull. World Health Organ. 91, 36–45.
Skrahina, A., Hurevich, H., Zalutskaya, A., Sahalchyk, E., Astrauko, A., van Gemert,W., Hoffner, S., Rusovich, V., Zignol, M., 2012. Alarming levels of drug-resistanttuberculosis in Belarus: results of a survey in Minsk. Eur. Respir. J. 39,1425–1431.
Stoicescu, I.P., Homorodean, D., Chiotan, D., Moldovan, O., Diculencu, D., Popa, C.,Macri, A., Husar, I., Ditiu, L., Aziz, M.A., Hoffner, S., 2008. Romanian anti-TB drugsresistance surveillance 2003–2004. Pneumologia 57, 131–137.
STOP TB Partnership, 2013. Global Laboratory Initiative, Retrieved 17 February, 2014from http://www.stoptb.org/wg/gli/srln.asp
Ulmasova, D.J., Uzakova, G., Tillyashayhov, M.N., Turaev, L., van Gemert, W., Hoff-mann, H., Zignol, M., Kremer, K., Gombogaram, T., Gadoev, J., du Cros, P.,Muslimova, N., Jalolov, A., Dadu, A., de Colombani, P., Telnov, O., Slizkiy, A.,Kholikulov, B., Dara, M., Falzon, D., 2013. Multidrug-resistant tuberculosisin Uzbekistan: results of a nationwide survey, 2010-2011. Euro Surveill. 18(pii:20609).
UN, 2013. World Population Prospects: The 2012 Revision, Retrieved 17 February,2014 from http://esa.un.org/unpd/wpp/Excel-Data/population.htm
Van Deun, A., Wright, A., Zignol, M., Weyer, K., Rieder, H.L., 2011. Drug susceptibil-ity testing proficiency in the network of supranational tuberculosis referencelaboratories. Int. J. Tuberc. Lung Dis. 15, 116–124.
Weyer, K., Mirzayev, F., Migliori, G.B., Van Gemert, W., D’Ambrosio, L., Zig-nol, M., Floyd, K., Centis, R., Cirillo, D.M., Tortoli, E., Gilpin, C., Iragena, J.,Falzon, D., Raviglione, M., 2013. Rapid molecular TB diagnosis: evidence,policy-making and global implementation of Xpert®MTB/RIF. Eur. Respir. J. 42,252–271.
WHO, 2009a. Guidelines for Surveillance of Drug Resistance in Tuberculo-sis (WHO/HTM/TB/2009.422), 4th ed, Retrieved 17 February, 2014 fromhttp://whqlibdoc.who.int/publications/2009/9789241598675 eng.pdf
WHO, 2009b. WHO Policy on TB Infection Control in Health-Care Facil-ities, Congregate Settings and Households (WHO/HTM/TB/2009.419),Retrieved 17 February, 2014 from http://whqlibdoc.who.int/publications/2009/9789241598323 eng.pdf
World Health Organization, 2010. Multidrug and Extensively Drug-Resistant TB (M/XDR-TB) – 2010 Global Report on Surveillance andResponse (WHO/HTM/TB/2010.3), Retrieved 17 February, 2014 fromhttp://whqlibdoc.who.int/publications/2010/9789241599191 eng.pdf
WHO, 2011a. Consolidated Action Plan to Prevent and Combat Multidrug-and Extensively Drug-Resistant Tuberculosis in the WHO EuropeanRegion 2011–2015 (EUR/RC61/15), Retrieved 17 February, 2014 fromhttp://www.euro.who.int/ data/assets/pdf file/0007/147832/wd15E TBActionPlan 111388.pdf
WHO, 2011b. Roadmap to Prevent and Combat Drug-Resistant Tuberculosis.,ISBN 978 92 890 0246 2, Retrieved 17 February, 2014 from http://www.euro.who.int/ data/assets/pdf file/0011/148376/RC61 InfDoc3.pdf
WHO, 2012. Global Tuberculosis Control (WHO/HTM/TB/2012.16), Retrieved17 February, 2014 from http://www.who.int/tb/publications/global report/en/index.html
WHO, 2013a. Global Tuberculosis Control (WHO/HTM/TB/2013.11), Retrieved17 February, 2014 from http://www.who.int/iris/bitstream/10665/91355/1/9789241564656 eng.pdf
WHO, 2013b. The Use of Bedaquiline in the Treatment of Multidrug-Resistant Tuberculosis. Interim policy guidance (WHO/HTM/TB/2013.6),Retrieved 17 February, 2014 from http://apps.who.int/iris/bitstream/10665/84879/1/9789241505482 eng.pdf?ua=1
WHO, 2013c. The WHO Global TB Data Collection System, Retrieved 17 February,2014 from https://extranet.who.int/tme/
Zignol, M., van Gemert, W., Falzon, D., Jaramillo, E., Blanc, L., Raviglione, M., 2011.
veys to routine testing. Clin. Infect. Dis. 52, 901–906.Zignol, M., van Gemert, W., Falzon, D., Sismanidis, C., Glaziou, P., Floyd, K., Rav-
iglione, M., 2012. Surveillance of anti-tuberculosis drug resistance in the world:an updated analysis, 2007–2010. Bull World Health Organ. 90 (111-9D).