Embed Size (px)
Citation preview
2024516
814595
1514534
1664454
1064474
1814454
1434472
1294447
1694453
2654460
2764454
2954503
1574443
1414445
1564434
1134447
1604444
1164425
2874354
2934487
2414279
2704193
2134213
2434227
1084432
2734212
1774177
1664207
2654200
1234203
1804201
324208
444205
254215
204229
874239 37
4241
604235
424239 14
4222
414234
154210 23
4228
344221
364226
1034233
844231
1224238
194211
414219
384210
254250
404255
1304283
1974273
1974278
3294281
1374228
1114224
434197
534197
1054244
2314241
1614254
1384225
884188
1374223
394184
154200
384182
184202
124178
254173
334169 3
4192
144176
94181
614169
74168
354145
224138
334157
94141
2014114
1184169
874218
1244249
1044223
1304865
1104916
1484855
2504725
395071
725080
2764564
984983
2164760
595026
2904230
2594219
1724223
2534225
1244200
1164209
1204210
1994212
1794203
2284216
3614361
4124218
4084241
3714202
3934217
1824073
34094
24092
74068
294033
114069
1214059
894071
1854085
1834077
834082
1484077
2094081 436
4164
2074258
1134187
104160
284102
633992
183980 143991
4644146
314394
304293
254250
4104140
3634097
3034072
3304090
184208
504249
4964134
4294376
204655
634795
1914571
4434647
204620
414521
534642
1725113
3694729
75228
28 5102
115154
125384 13
4874
725048
595601
165169
714774
6094231
714845
3994023
2203835
373813
1973825
2203825
1373822
273719
994084
1204115
654088
314109
424083
1594129
274108
1034092 142
4112
1674123
2134117
2284122
2234117
2294118
2314129
2764134
1434117
2524124
3114138
1934093
1074047
304015
794821
1934528
1084804
1094661
1074688
1544755
1344716
1524429
264729
214679
274572
204615
1264701
544796
814769
2254787 354763 98
4777
504780
714904
1524823
494976
354915
164949
455075
265019
634977
164942
75043
1084970
165132
1605045
465004
334797
154836 37
4823
334892
134947
254995 28
4947 1065047
345041
105015
355016
135052
85084
125040
1145091
375065 38
5092 285094
595091
155081
185142
345092
205308
95216
1594139
2094126
2304125
1594208
2284117
2934107
2934141
2994113
2624128
3004140 456
4144
1724123
964174
2624194
5834165
4904120 445
4121
4644116 430
4115
5264094
4934108
4834097
5054110
5334094
4434117
3144126
5344113
3094131
4034127
5544123 518
4122
4804135
3274149
3494131
3714130
4154135
2074146
634135
784172
1864141
1804150
2224157
1214179
1544166 128
4172
3664183
1354189 143
4188
1744191
1864189
1174183
2264202
1414184
1294179
1274193
1964200
4084197
554685
3924368
2514564
214864
344806
1314794
114879
274953
364942
255060
624733 194821
1334517
2374386
1414594
1054555
774848
1144791
1754598
44798
53745
833662 62
3663
753660
413661
253665
3603810
3663794
1033757
663693
93706
13680
293622
63624
323633
463659
293693
753647
693686
483601
53636
93596
573581
243625
553685
493609
373607
213569
243566
273603
463580
1063619
1583587
113539 32
3508 63574
323518
363599 64
3616
103625
293611
303510
403618
303515
263499
1283518
2243541
653495
393587
93571
803450
413474
113488
3384143
2424198
384560
294569
954430
3303901
2423978
1454261
2273853
2353985
4853633
4333642
4903620
4823598
5063614
5163624
4643616
5453635 471
3609
663602
2133625
63551
293831
103785
313809
194011
5493610
5273638
5513630
1334185
5503725
364944
613519
303456
433456
763457
383492
873454
3033504
13559
373408 37
3402
603420 37
3400
383398
413394
373398
443399
473413
453412
473398
333387
483388
553393
323374
503372
303340 28
3462
653315
303358
383326
323350
1963514
114198
513309
483310
433304
7224250
105315
55095 136
4234
1964223
285002
135097
45076
25080
T24S
T23S
T22S
T21S
T20S
T19S
T18S
T17S
T16S
T14S
T13S
T12S
T11S
R 18 E R 19 ER 20 E
R 21 E
R 22 E
R 23 E
R 24 E
T15S
N
EW
S
4200
4100
4000
39003350
3400
3450
35003600
3650
37003800
3900
41004000
38003700
36003550
3500
390040004100
4200
4800
4200
4400
46004500
4300
40004100
4200
4100
4700
4600
4500
4150
4500
4600
4700
48004900
5000
4200
4300
4400
4125
4200
4300
4150
4300
4250
4300
4400
4500
4200
4150
4100
40004100
3900
3800
3700
4000
39003800
3700
PREPARED IN COOPERATION WITH THE UNITED STATES GEOLOGICAL SURVEY THE ARIZONA DEPARTMENT OF WATER RESOURCESD.W.R HYDROLOGIC MAP SERIES REPORT NO. 34
DEPTH TO WATER AND ALTITUDE OF THE WATER LEVEL SHEET 1 OF 2
THESE HYDROLOGIC MAPS ARE AVAILABLE UPON REQUEST FROM THE ARIZONA DEPARTMENT OF WATER RESOURCES,INFORMATION CENTRAL, 500 NORTH THIRD STREET, PHOENIX, ARIZONA, 85004. THE HYDROLOGIC DATA ON WHICH THESEMAPS ARE BASED ARE AVAILABLE AT THE ADWR BOOKSTORE. 602 417-2485
BASE MAP FROM U.S. GEOLOGICAL SURVEY1:250,000 TUCSON (1977), NOGALES (1969), AND DOUGLAS (1959)
INTRODUCTION
In December, 2001 and January, 2002 the Arizona Department of Water Resources field staff collected data on groundwaterelevations in numerous wells throughout the Upper San Pedro Basin of southeastern Arizona. These data are presented in thisreport as maps of groundwater elevation contours and changes in water level, including hydrographs of selected wells showingchanging water levels over time. The Department previously produced such maps showing groundwater conditions in 1990.These maps were published as Hydrologic Map Series (HMS) 31 in 1997 (Barnes, 1997). In 1990 the Department staff visited1,075 wells and obtained water level data from 753 of them. In 2001-2002 the Department staff revisited the 753 wellspreviously measured, as well as obtaining additional measurements from new wells. Hydrographs depicting changes in waterlevels in specific wells are also presented in this report. Much of the text from Barnes (HMS 31, 1997), remain valid to discussthe hydrology and geology of the basin. That text has been updated where necessary to discuss new geologic information,recent water level data, and to update water use estimates.
GENERAL SETTING
The Upper San Pedro Basin is an intermontaine valley which includes approximately 1,875 square miles in southeast Arizona.The basin is bounded on the west by the Huachuca, Whetstone, and Rincon Mountains, and on the east by the Mule, Dragoon,Little Dragoon and Winchester Mountains. The basin extends approximately 58 miles along the San Pedro River, from theInternational boundary with the Republic of Mexico on the south, to the Narrows, approximately 11 miles north of Benson.The north sloping, north-to-northwest-trending valley ranges from 6 to 39 miles wide, and is divided into two sub-basins, AllenFlat and Sierra Vista.
The basin is drained by the San Pedro River and its main tributaries, the Babocomari River and Tres Alamos Wash. The SanPedro River flows northward from its headwaters, 25 miles south of the International boundary. The river enters the basin justsouth of the community of Palominas at an altitude of 4,275 feet, and exits at the Narrows, at an altitude of 3,309 feet, yieldinga topographic gradient of nearly 17 feet per mile. Within the Upper San Pedro Basin the San Pedro River could be considereda perennial interrupted watercourse (Meinzer, 1923). The perennial reach runs from just south of Highway 90 to south ofFairbank.
The climate in the Upper San Pedro Basin is semiarid, characterized by hot summers and mild winters (Roeske and Werrell,1973, p. 9). Rainfall primarily occurs during two peak periods. During the months of December, January and February gentlerains, occasionally of long duration, are typical. Intense, short-duration rainfall resulting from monsoonal thunderstorms makeJuly and August the wettest months of the year. May is the driest month of the year, typically with little or no recordedprecipitation. Average annual rainfall ranges from 11 inches at Benson to 15 inches in the area around Fort Huachuca-SierraVista, to more than 22 inches at the Coronado National Memorial. Snowfall contributes a minor amount of precipitation in theUpper San Pedro Basin, with a yearly total of 1.5 to 3 inches throughout most of the valley floor, and from 5 to 15 inches in thefoothills of the mountains. Much more snow and rainfall occurs in the mountains surrounding the basin. June is the hottestmonth of the year, and average daytime temperatures range from the mid-to-high 90’s°F near Benson to approximately 90°Fin the southern part of the basin. The coolest month is January, when average daytime highs range from the low 60’s°F nearBenson to the high 50’s°F in the southern part of the basin. Extremes of 116°F at Benson in June 1904, and -7°F at St. Davidin December 1978 have been recorded (Sellers and others, 1985, p. 86-93, 112-114, 132, 133).
Anglo settlement of the Upper San Pedro Basin was hastened by mining which brought early settlers to the area around Bisbeeand Tombstone. The first homesteads were established in the late 1800’s. Mormons settled at St. David in 1877, and CampHuachuca, now Fort Huachuca, was established by the U.S. Army the same year (Barnes and Granger, 1960, p. 40, 49). Tosupply the needs of the booming mining districts, agriculture became important, resulting in the need for reliable sources ofwater. Early reports mention that groundwater under artesian pressure was first noted in 1887. Water reportedly flowed forseveral hours from a fissure caused by a strong earthquake (Lee, 1905, p. 169). There is evidence to support such a claim as anestimated magnitude 7.2 earthquake centered 30 miles southeast of Douglas, caused damage throughout southeastern Arizonain 1887 (Fellows, 1995, p. 1). The first flowing well in the Upper San Pedro Basin, and possibly the first in the state, was drilledin 1892 (Roeske and Werrell, 1973, p. 6). In his 1903 investigation of the valley, W.T. Lee (1905, p. 166) observed that over200 wells had been drilled between Benson and Fairbank, a distance of only 20 miles.
The major cities, towns and communities in the basin include Sierra Vista, Tombstone, Huachuca City, Fort Huachuca, Benson,St. David, Naco, Pomerene, Hereford, Palominas and Nicksville. Farming, ranching and mining are the notable industries inthe basin, with major groundwater users being farmers, the mining industry, and municipalities. In May, 2002 there wereapproximately 3,000 actively irrigated acres in the Upper San Pedro Basin (Arizona Department of Water Resources, 2003).
GEOLOGY
The Upper San Pedro Basin is an elongated trough formed by the uplift of the surrounding mountain blocks relative to theblocks underlying the valley floor. The resultant mountains are made up mainly of granite, schist, gneiss, volcanics and consoli-dated sedimentary rocks ranging in age from Precambrian to Tertiary. The structural and, to some degree, the hydrologicsystem are affected by the Tombstone Hills which jut out into the basin between Tombstone and the San Pedro River. Theseoutcrops are composed of Tertiary granite and volcanics. As the surrounding mountains eroded, the basin subsequently filledwith alluvium. The estimated maximum depth to bedrock along the axis of the basin may exceed 6,000 feet in the southernpart, and is less than 5,000 feet in the northern part (Oppenheimer and Sumner, 1980, map). Pediments, or shallow bedrock,exist in places beneath the alluvial fill along the mountain fronts (Heindl, 1952, p.70).
Within the elongated trough of basin fill are three deeper troughs with depths of up to 6000 feet below land surface (Drewes,1980,Gettings and Houser, 2000). Gettings and Houser (2000) found three deeper pockets of alluvium in the basin. One lies southof Sierra Vista and west of the San Pedro River, a second lies under and north of the Babocomari River and west of the SanPedro River, and a third lies northwest of Tombstone. Gettings and Houser (2000) also describe a more shallow area ofhardrock extending eastward from the Huachuca Mountains, under Sierra Vista toward the San Pedro River. Bedrock is foundat relatively shallow depths of 200-500 feet below land surface along this line. This study also found that much of the southernarea of the basin under the San Pedro River and to the east of the river was underlain by very shallow alluvium (on the orderof 150 to 500 feet). This study is notable because it defines the bedrock as much more shallow than prior studies had indicated,effectively reducing the aquifers estimated total groundwater storage volume.
Unconformably overlying the bedrock is the Pantano (?) Formation. The Pantano (?) Formation is a sedimentary deposit,which has been firmly established as Tertiary, and likely as Miocene in age. This unit is a poorly to moderately induratedconglomerate, with clasts ranging in size from pebbles to boulders. They are composed of granite, limestone and volcanics,embedded in a coarse sandstone matrix (Brown and others, 1966, p. 9-13). Gettings and Houser (2000), indicate that thePantano (?) Formation probably exceeds 1,000 feet in thickness in some areas near Sierra Vista and Fort Huachuca.Unconformably overlying the Pantano (?) Formation are the Quaternary and Tertiary (Pliocene) basin-fill deposits. The basin-fill deposits, unlike the Pantano (?) Formation, are post Basin and Range development (Brown and others, 1966, p.15). Thelower unit of the basin fill consists of whitish-gray to light-brown lenticular beds of strongly to weakly cemented gravel,sandstone, siltstone and clay. The lower unit can be up to 1,000 feet thick in places, near the center of the basin. The unit gradesinto coarse-grained beds a few feet thick near the mountain fronts (Roeske and Werrell, 1973, p. 10-11).
The upper unit of the basin fill is characterized by weakly cemented, sometimes compacted beds of reddish-brown to brownsediments of gravel, sandstone, siltstone and clays. The unit tends to be well-bedded silt, sandy-silt and clays in the center of thevalley and grading into clayey-silty gravel near the mountain fronts. This unit may be as much as 800 feet thick (Roeske andWerrell, 1973, p.11). This unit can form steep slopes where capped by well-cemented terrace deposits, but erodes into badlandstopography if not protected by the terrace deposits (Brown and others, 1966, p. 16). In 1902, W.P. Blake noted that in the areaof Benson on both sides of the San Pedro Valley, there are unconsolidated red clays and sediments in horizontal beds of greatthickness, often terraced by river erosion, and extending high up on both sides of the bordering mountains (Meinzer andKelton, 1913, p.60).
In places, the basin-fill deposits are overlain by the beds of the flood-plain alluvium. They are unconsolidated, lenticular, river-and stream-laid deposits of gravel, sand and silt. These beds are found along the channels and flood plain of the San PedroRiver and major tributaries, and range from less than a mile up to two miles in width, and from 40 to150 feet in thickness. Pooland Coes (1999), suggest that the thickness is better defined in the Sierra Vista subwatershed as within the upper 15 meters(approx 50 feet), of the surface.
The basin-fill deposits, consisting of the upper and lower units and the (Pantano (?) Formation), form the principal aquifer inthe Upper San Pedro Basin. The basin-fill deposits are stratigraphically complex. Locally, some areas exhibit confined condi-tions, but regionally the basin-fill aquifer is unconfined (Freethey, 1982, p. 49).
Unconfined
Both the upper and lower units are good sources of groundwater, and together they produce most of the water pumped from theregional aquifer. Yields of 100 to 2,800 gallons per minute have been reported from wells completed in the upper and lowerunits (Roeske and Werrell, 1973, p. 13). The Pantano (?) Formation is generally well cemented and not a reliable aquifer, butwell yields up to several hundred gallons per minute have been reported (Roeske and Werrell, 1973, p. 10). In Dec.2001-Jan.2002, measured depths to water in the unconfined areas of the regional aquifer ranged from less than 100 feet to nearly 600feet below land surface.
RECHARGE
The aquifers in the Upper San Pedro Basin are recharged by mountain-front runoff, river and streambed infiltration, underflowfrom Mexico, and seepage from applied irrigation. Due to high evapotranspiration rates, direct recharge from precipitationseepage is negligible. The average annual regional recharge is estimated to be about 29,600 acre-feet per year (Arizona Depart-ment of Water Resources, 2004).
DISCHARGE
Groundwater is discharged in the Upper San Pedro Basin by both natural and artificial means. Freethey and Anderson (1986,sheet 3), estimate that less than 1,000 acre-feet per year of groundwater was discharged to the Lower San Pedro Basin asoutflow under pre-developmental conditions. This figure is likely little changed today. Contributing to total discharge are wells,evapotranspiration, evaporation of surface water from the perennial reach of the San Pedro River (Hereford to Fairbank),contributions from the groundwater systems to the San Pedro and Babocomari Rivers as baseflows, and municipal, agricul-tural, industrial and domestic wells. Numerous springs along the San Pedro River also contribute to total groundwater dis-charge. Discharge for most of these springs has not been quantified. Production from wells and riparian evapotranspiration arethe major sources of groundwater discharge. Public supply wells (including domestic wells and military uses) and irrigationwells are the largest groundwater pumpers, followed by industrial users. In 2002, an estimated 26,000 acre-feet (ArizonaDepartment of Water Resources, 2004, table 2, p. 42 ) was pumped in the Upper San Pedro Basin; 16,100 was pumped formunicipal uses, 7,500 for agricultural uses, and 2,400 for other uses. (Arizona Department of Water Resources, 2004 ). A largenumber of flowing wells, exist in the basin, especially near Benson and St. David. In spite of the large numbers of flowing wells,total discharge from this source is thought to be quite small, owing to low rates of flow from each well. In 1990, an estimated37,000 acre-feet of goundwater was pumped, not including riparian demand. The peak year for pumping was 1981, when75,000 acre-feet were pumped. Since 1966, 1,412,000 acre-feet of groundwater has been pumped from the Upper San PedroBasin (Anning Duet, 1994, sheet 1 ). Pre-1966 pumping records are not available for this basin. Riparian groundwater demandhas been estimated at about 19,800 acre-feet for 2002, (Arizona Department of Water Resources, 2004).
MOVEMENT AND STORAGE
Direction of groundwater flow generally mirrors surface-water drainage in the basin. Groundwater moves from the mountainfronts and higher elevations toward the center of the basin, then moves in a north-northwest direction along the axis of thevalley. Natural flow direction has been disrupted near Sierra Vista due to the development of a significant groundwater depres-sion. Water under the influence of the depression now flows toward its center. In the southern part of the Allen Flat sub-basingroundwater flows to the south and west, into the Sierra Vista sub-basin. ln places, groundwater can also freely move betweenalluvial units within the aquifers. Some exchange of water between the confined parts of the regional aquifer and the flood-plain aquifer can also take place due to well casings perforated in both aquifers and due to corroded well casings.
There are an estimated 20,000,000 acre-feet of groundwater stored in the Upper San Pedro Basin (ADWR, 2004). Thisestimate is considerably less than the estimate reported in HMS 31 because a new geophysical study (Gettings and Houser,2000) indicates that bedrock is more shallow in the basin than previously assumed, thus limiting the vertical extent of theaquifer.
WATER LEVEL CHANGES
Ground water levels in the Upper San Pedro Basin fluctuate seasonally in response to pumping and recharge, especially in theflood-plain alluvium along the San Pedro River. Recent drought conditions in the Southwest have affected the Upper SanPedro Basin, and groundwater declines within the basin reflect the lack of recharge, particularly along stream courses. How-ever, as hydrographs point out in the following discussion, water level changes have not been drastic in the Upper San PedroBasin. There are areas where decline has been historically noted, and declines in these areas has continued. The most unex-pected changes have occurred in an area between Bisbee and Naco. Declines in the Bisbee-Naco area are among the largestobserved in the basin over the 11 year period between 1990 and Dec.2001-Jan.2002. Specific areas are discussed below.
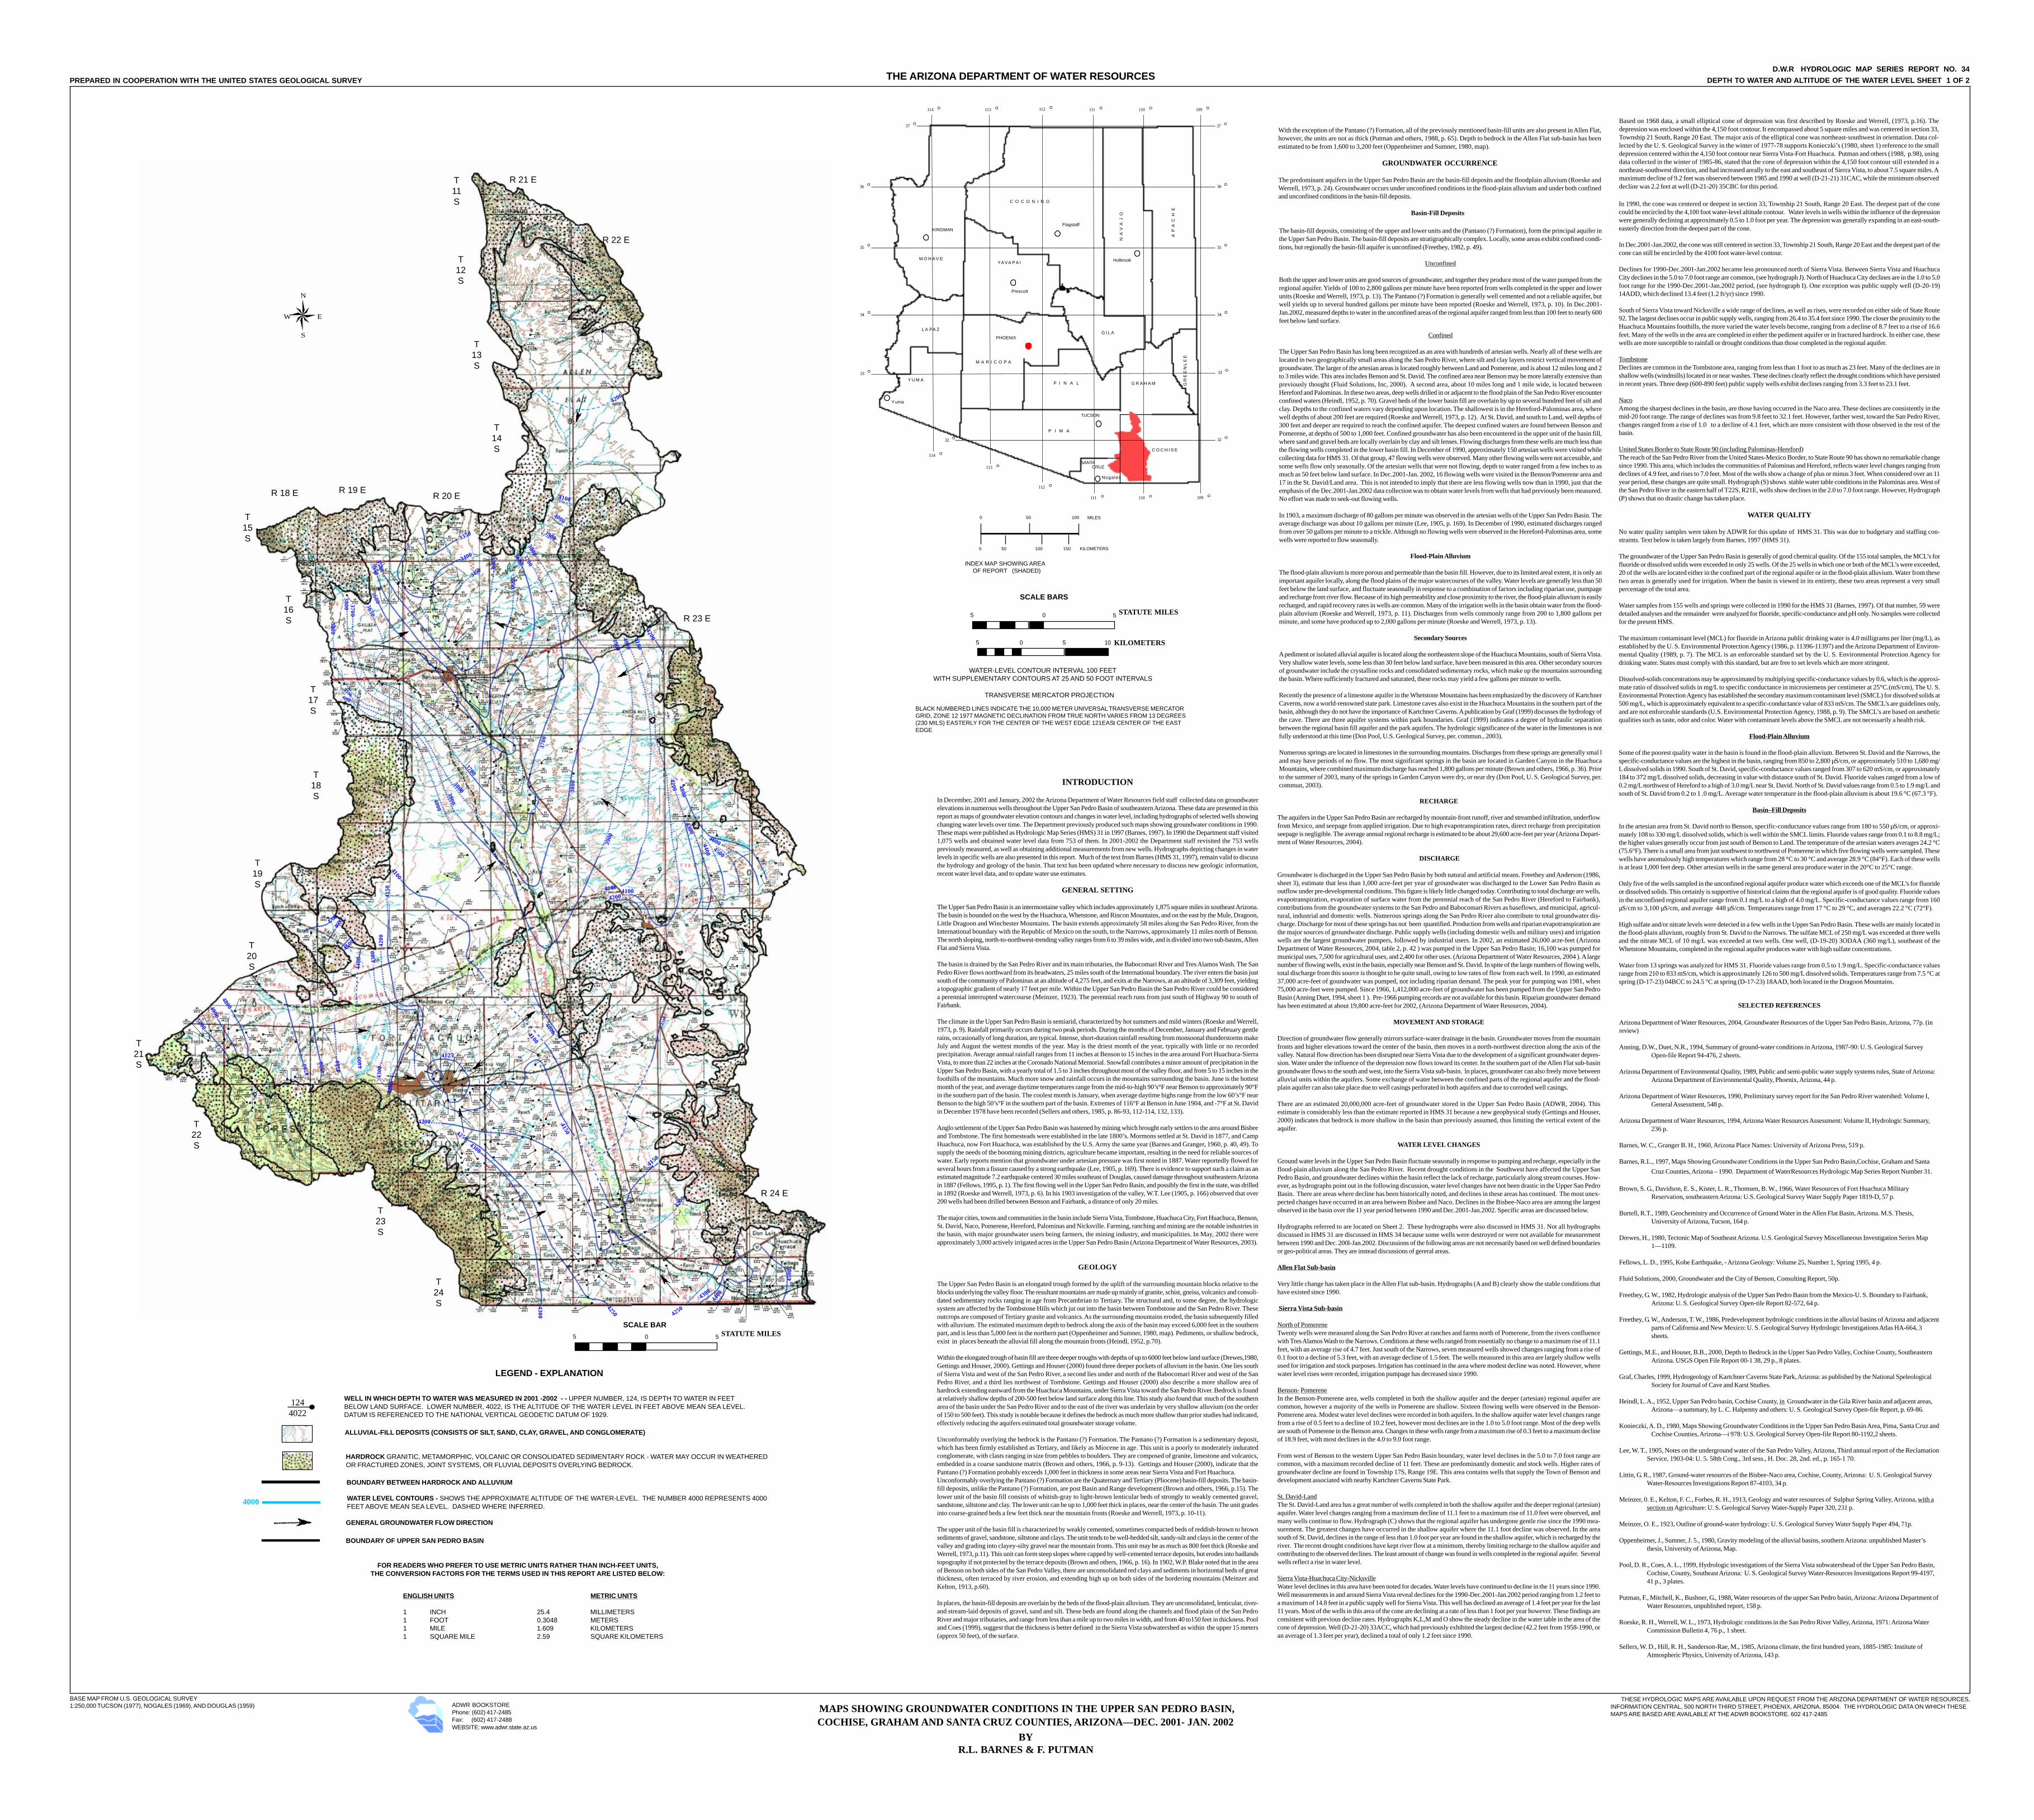
Hydrographs referred to are located on Sheet 2. These hydrographs were also discussed in HMS 31. Not all hydrographsdiscussed in HMS 31 are discussed in HMS 34 because some wells were destroyed or were not available for measurementbetween 1990 and Dec. 200l-Jan.2002. Discussions of the following areas are not necessarily based on well defined boundariesor geo-political areas. They are instead discussions of gereral areas.
Allen Flat Sub-basin
Very little change has taken place in the Allen Flat sub-basin. Hydrographs (A and B) clearly show the stable conditions thathave existed since 1990.
Sierra Vista Sub-basin
North of PomereneTwenty wells were measured along the San Pedro River at ranches and farms north of Pomerene, from the rivers confluencewith Tres Alamos Wash to the Narrows. Conditions at these wells ranged from essentially no change to a maximum rise of 11.1feet, with an average rise of 4.7 feet. Just south of the Narrows, seven measured wells showed changes ranging from a rise of0.1 foot to a decline of 5.3 feet, with an average decline of 1.5 feet. The wells measured in this area are largely shallow wellsused for irrigation and stock purposes. Irrigation has continued in the area where modest decline was noted. However, wherewater level rises were recorded, irrigation pumpage has decreased since 1990.
Benson- PomereneIn the Benson-Pomerene area, wells completed in both the shallow aquifer and the deeper (artesian) regional aquifer arecommon, however a majority of the wells in Pomerene are shallow. Sixteen flowing wells were observed in the Benson-Pomerene area. Modest water level declines were recorded in both aquifers. In the shallow aquifer water level changes rangefrom a rise of 0.5 feet to a decline of 10.2 feet, however most declines are in the 1.0 to 5.0 foot range. Most of the deep wellsare south of Pomerene in the Benson area. Changes in these wells range from a maximum rise of 0.3 feet to a maximum declineof 18.9 feet, with most declines in the 4.0 to 9.0 foot range.
From west of Benson to the western Upper San Pedro Basin boundary, water level declines in the 5.0 to 7.0 foot range arecommon, with a maximum recorded decline of 11 feet. These are predominantly domestic and stock wells. Higher rates ofgroundwater decline are found in Township 17S, Range 19E. This area contains wells that supply the Town of Benson anddevelopment associated with nearby Kartchner Caverns State Park.
St. David-LandThe St. David-Land area has a great number of wells completed in both the shallow aquifer and the deeper regional (artesian)aquifer. Water level changes ranging from a maximum decline of 11.1 feet to a maximum rise of 11.0 feet were observed, andmany wells continue to flow. Hydrograph (C) shows that the regional aquifer has undergone gentle rise since the 1990 mea-surement. The greatest changes have occurred in the shallow aquifer where the 11.1 foot decline was observed. In the areasouth of St. David, declines in the range of less than 1.0 foot per year are found in the shallow aquifer, which is recharged by theriver. The recent drought conditions have kept river flow at a minimum, thereby limiting recharge to the shallow aquifer andcontributing to the observed declines. The least amount of change was found in wells completed in the regional aquifer. Severalwells reflect a rise in water level.
Sierra Vista-Huachuca City-NicksvilleWater level declines in this area have been noted for decades. Water levels have continued to decline in the 11 years since 1990.Well measurements in and around Sierra Vista reveal declines for the 1990-Dec.2001-Jan.2002 period ranging from 1.2 feet toa maximum of 14.8 feet in a public supply well for Sierra Vista. This well has declined an average of 1.4 feet per year for the last11 years. Most of the wells in this area of the cone are declining at a rate of less than 1 foot per year however. These findings areconsistent with previous decline rates. Hydrographs K,L,M and O show the steady decline in the water table in the area of thecone of depression. Well (D-21-20) 33ACC, which had previously exhibited the largest decline (42.2 feet from 1958-1990, oran average of 1.3 feet per year), declined a total of only 1.2 feet since 1990.
Confined
The Upper San Pedro Basin has long been recognized as an area with hundreds of artesian wells. Nearly all of these wells arelocated in two geographically small areas along the San Pedro River, where silt and clay layers restrict vertical movement ofgroundwater. The larger of the artesian areas is located roughly between Land and Pomerene, and is about 12 miles long and 2to 3 miles wide. This area includes Benson and St. David. The confined area near Benson may be more laterally extensive thanpreviously thought (Fluid Solutions, Inc, 2000). A second area, about 10 miles long and 1 mile wide, is located betweenHereford and Palominas. In these two areas, deep wells drilled in or adjacent to the flood plain of the San Pedro River encounterconfined waters (Heindl, 1952, p. 70). Gravel beds of the lower basin fill are overlain by up to several hundred feet of silt andclay. Depths to the confined waters vary depending upon location. The shallowest is in the Hereford-Palominas area, wherewell depths of about 200 feet are required (Roeske and Werrell, 1973, p. 12). At St. David, and south to Land, well depths of300 feet and deeper are required to reach the confined aquifer. The deepest confined waters are found between Benson andPomerene, at depths of 500 to 1,000 feet. Confined groundwater has also been encountered in the upper unit of the basin fill,where sand and gravel beds are locally overlain by clay and silt lenses. Flowing discharges from these wells are much less thanthe flowing wells completed in the lower basin fill. In December of 1990, approximately 150 artesian wells were visited whilecollecting data for HMS 31. Of that group, 47 flowing wells were observed. Many other flowing wells were not accessible, andsome wells flow only seasonally. Of the artesian wells that were not flowing, depth to water ranged from a few inches to asmuch as 50 feet below land surface. In Dec.2001-Jan. 2002, 16 flowing wells were visited in the Benson/Pomerene area and17 in the St. David/Land area. This is not intended to imply that there are less flowing wells now than in 1990, just that theemphasis of the Dec.2001-Jan.2002 data collection was to obtain water levels from wells that had previously been measured.No effort was made to seek-out flowing wells.
In 1903, a maximum discharge of 80 gallons per minute was observed in the artesian wells of the Upper San Pedro Basin. Theaverage discharge was about 10 gallons per minute (Lee, 1905, p. 169). In December of 1990, estimated discharges rangedfrom over 50 gallons per minute to a trickle. Although no flowing wells were observed in the Hereford-Palominas area, somewells were reported to flow seasonally.
Flood-Plain Alluvium
The flood-plain alluvium is more porous and permeable than the basin fill. However, due to its limited areal extent, it is only animportant aquifer locally, along the flood plains of the major watercourses of the valley. Water levels are generally less than 50feet below the land surface, and fluctuate seasonally in response to a combination of factors including riparian use, pumpageand recharge from river flow. Because of its high permeability and close proximity to the river, the flood-plain alluvium is easilyrecharged, and rapid recovery rates in wells are common. Many of the irrigation wells in the basin obtain water from the flood-plain alluvium (Roeske and Werrell, 1973, p. 11). Discharges from wells commonly range from 200 to 1,800 gallons perminute, and some have produced up to 2,000 gallons per minute (Roeske and Werrell, 1973, p. 13).
Secondary Sources
A pediment or isolated alluvial aquifer is located along the northeastern slope of the Huachuca Mountains, south of Sierra Vista.Very shallow water levels, some less than 30 feet below land surface, have been measured in this area. Other secondary sourcesof groundwater include the crystalline rocks and consolidated sedimentary rocks, which make up the mountains surroundingthe basin. Where sufficiently fractured and saturated, these rocks may yield a few gallons per minute to wells.
Recently the presence of a limestone aquifer in the Whetstone Mountains has been emphasized by the discovery of KartchnerCaverns, now a world-renowned state park. Limestone caves also exist in the Huachuca Mountains in the southern part of thebasin, although they do not have the importance of Kartchner Caverns. A publication by Graf (1999) discusses the hydrology ofthe cave. There are three aquifer systems within park boundaries. Graf (1999) indicates a degree of hydraulic separationbetween the regional basin fill aquifer and the park aquifers. The hydrologic significance of the water in the limestones is notfully understood at this time (Don Pool, U.S. Geological Survey, per. commun., 2003).
Numerous springs are located in limestones in the surrounding mountains. Discharges from these springs are generally smal land may have periods of no flow. The most significant springs in the basin are located in Garden Canyon in the HuachucaMountains, where combined maximum discharge has reached 1,800 gallons per minute (Brown and others, 1966, p. 36). Priorto the summer of 2003, many of the springs in Garden Canyon were dry, or near dry (Don Pool, U. S. Geological Survey, per.commun, 2003).
With the exception of the Pantano (?) Formation, all of the previously mentioned basin-fill units are also present in Allen Flat,however, the units are not as thick (Putman and others, 1988, p. 65). Depth to bedrock in the Allen Flat sub-basin has beenestimated to be from 1,600 to 3,200 feet (Oppenheimer and Sumner, 1980, map).
GROUNDWATER OCCURRENCE
The predominant aquifers in the Upper San Pedro Basin are the basin-fill deposits and the floodplain alluvium (Roeske andWerrell, 1973, p. 24). Groundwater occurs under unconfined conditions in the flood-plain alluvium and under both confinedand unconfined conditions in the basin-fill deposits.
SELECTED REFERENCES
Arizona Department of Water Resources, 2004, Groundwater Resources of the Upper San Pedro Basin, Arizona, 77p. (inreview)
Anning, D.W., Duet, N.R., 1994, Summary of ground-water conditions in Arizona, 1987-90: U. S. Geological SurveyOpen-file Report 94-476, 2 sheets.
Arizona Department of Environmental Quality, 1989, Public and semi-public water supply systems rules, State of Arizona:Arizona Department of Environmental Quality, Phoenix, Arizona, 44 p.
Arizona Department of Water Resources, 1990, Preliminary survey report for the San Pedro River watershed: Volume I,General Assessment, 548 p.
Arizona Department of Water Resources, 1994, Arizona Water Resources Assessment: Volume II, Hydrologic Summary,236 p.
Barnes, W. C., Granger B. H., 1960, Arizona Place Names: University of Arizona Press, 519 p.
Barnes, R.L., 1997, Maps Showing Groundwater Conditions in the Upper San Pedro Basin,Cochise, Graham and Santa
Cruz Counties, Arizona – 1990. Department of WaterResources Hydrologic Map Series Report Number 31.
Brown, S. G., Davidson, E. S., Kister, L. R., Thomsen, B. W., 1966, Water Resources of Fort Huachuca MilitaryReservation, southeastern Arizona: U.S. Geological Survey Water Supply Paper 1819-D, 57 p.
Burtell, R.T., 1989, Geochemistry and Occurrence of Ground Water in the Allen Flat Basin, Arizona. M.S. Thesis,University of Arizona, Tucson, 164 p.
Drewes, H., 1980, Tectonic Map of Southeast Arizona. U.S. Geological Survey Miscellaneous Investigation Series Map1—1109.
Fellows, L. D., 1995, Kobe Earthquake, - Arizona Geology: Volume 25, Number 1, Spring 1995, 4 p.
Fluid Solutions, 2000, Groundwater and the City of Benson, Consulting Report, 50p.
Freethey, G. W., 1982, Hydrologic analysis of the Upper San Pedro Basin from the Mexico-U. S. Boundary to Fairbank,Arizona: U. S. Geological Survey Open-tile Report 82-572, 64 p.
Freethey, G. W., Anderson, T. W., 1986, Predevelopment hydrologic conditions in the alluvial basins of Arizona and adjacentparts of California and New Mexico: U. S. Geological Survey Hydrologic Investigations Atlas HA-664, 3sheets.
Gettings, M.E., and Houser, B.B., 2000, Depth to Bedrock in the Upper San Pedro Valley, Cochise County, SoutheasternArizona. USGS Open File Report 00-1 38, 29 p., 8 plates.
Graf, Charles, 1999, Hydrogeology of Kartchner Caverns State Park, Arizona: as published by the National SpeleologicalSociety for Journal of Cave and Karst Studies.
Heindl, L. A., 1952, Upper San Pedro basin, Cochise County, in Groundwater in the Gila River basin and adjacent areas,Arizona—a summary, by L. C. Halpenny and others: U. S. Geological Survey Open-file Report, p. 69-86.
Konieczki, A. D., 1980, Maps Showing Groundwater Conditions in the Upper San Pedro Basin Area, Pima, Santa Cruz andCochise Counties, Arizona—i 978: U.S. Geological Survey Open-file Report 80-1192,2 sheets.
Lee, W. T., 1905, Notes on the underground water of the San Pedro Valley, Arizona, Third annual report of the ReclamationService, 1903-04: U. 5. 58th Cong., 3rd sess., H. Doc. 28, 2nd. ed., p. 165-1 70.
Littin, G. R., 1987, Ground-water resources of the Bisbee-Naco area, Cochise, County, Arizona: U. S. Geological SurveyWater-Resources Investigations Report 87-4103, 34 p.
Meinzer, 0. E., Kelton, F. C., Forbes, R. H., 1913, Geology and water resources of Sulphur Spring Valley, Arizona, with asection on Agriculture: U. S. Geological Survey Water-Supply Paper 320, 231 p.
Meinzer, O. E., 1923, Outline of ground-water hydrology: U. S. Geological Survey Water Supply Paper 494, 71p.
Oppenheimer, J., Sumner, J. 5., 1980, Gravity modeling of the alluvial basins, southern Arizona: unpublished Master’sthesis, University of Arizona, Map.
Pool, D. R., Coes, A. L., 1999, Hydrologic investigations of the Sierra Vista subwatershead of the Upper San Pedro Basin,Cochise, County, Southeast Arizona: U. S. Geological Survey Water-Resources Investigations Report 99-4197,41 p., 3 plates.
Putman, F., Mitchell, K., Bushner, G., 1988, Water resources of the upper San Pedro basin, Arizona: Arizona Department ofWater Resources, unpublished report, 158 p.
Roeske, R. H., Werrell, W. L., 1973, Hydrologic conditions in the San Pedro River Valley, Arizona, 1971: Arizona WaterCommission Bulletin 4, 76 p., 1 sheet.
Sellers, W. D., Hill, R. H., Sanderson-Rae, M., 1985, Arizona climate, the first hundred years, 1885-1985: Institute ofAtmospheric Physics, University of Arizona, 143 p.
In 1990, the cone was centered or deepest in section 33, Township 21 South, Range 20 East. The deepest part of the conecould be encircled by the 4,100 foot water-level altitude contour. Water levels in wells within the influence of the depressionwere generally declining at approximately 0.5 to 1.0 foot per year. The depression was generally expanding in an east-south-easterly direction from the deepest part of the cone.
In Dec.2001-Jan.2002, the cone was still centered in section 33, Township 21 South, Range 20 East and the deepest part of thecone can still be encircled by the 4100 foot water-level contour.
Declines for 1990-Dec.2001-Jan.2002 became less pronounced north of Sierra Vista. Between Sierra Vista and HuachucaCity declines in the 5.0 to 7.0 foot range are common, (see hydrograph J). North of Huachuca City declines are in the 1.0 to 5.0foot range for the 1990-Dec.2001-Jan.2002 period, (see hydrograph I). One exception was public supply well (D-20-19)14ADD, which declined 13.4 feet (1.2 ft/yr) since 1990.
South of Sierra Vista toward Nicksville a wide range of declines, as well as rises, were recorded on either side of State Route92. The largest declines occur in public supply wells, ranging from 26.4 to 35.4 feet since 1990. The closer the proximity to theHuachuca Mountains foothills, the more varied the water levels become, ranging from a decline of 8.7 feet to a rise of 16.6feet. Many of the wells in the area are completed in either the pediment aquifer or in fractured hardrock. In either case, thesewells are more susceptible to rainfall or drought conditions than those completed in the regional aquifer.
TombstoneDeclines are common in the Tombstone area, ranging from less than 1 foot to as much as 23 feet. Many of the declines are inshallow wells (windmills) located in or near washes. These declines clearly reflect the drought conditions which have persistedin recent years. Three deep (600-890 feet) public supply wells exhibit declines ranging from 3.3 feet to 23.1 feet.
NacoAmong the sharpest declines in the basin, are those having occurred in the Naco area. These declines are consistently in themid-20 foot range. The range of declines was from 9.8 feet to 32.1 feet. However, farther west, toward the San Pedro River,changes ranged from a rise of 1.0 to a decline of 4.1 feet, which are more consistent with those observed in the rest of thebasin.
United States Border to State Route 90 (including Palominas-Hereford)The reach of the San Pedro River from the United States-Mexico Border, to State Route 90 has shown no remarkable changesince 1990. This area, which includes the communities of Palominas and Hereford, reflects water level changes ranging fromdeclines of 4.9 feet, and rises to 7.0 feet. Most of the wells show a change of plus or minus 3 feet. When considered over an 11year period, these changes are quite small. Hydrograph (S) shows stable water table conditions in the Palominas area. West ofthe San Pedro River in the eastern half of T22S, R21E, wells show declines in the 2.0 to 7.0 foot range. However, Hydrograph(P) shows that no drastic change has taken place.
WATER QUALITY
No water quality samples were taken by ADWR for this update of HMS 31. This was due to budgetary and staffing con-straints. Text below is taken largely from Barnes, 1997 (HMS 31).
The groundwater of the Upper San Pedro Basin is generally of good chemical quality. Of the 155 total samples, the MCL’s forfluoride or dissolved solids were exceeded in only 25 wells. Of the 25 wells in which one or both of the MCL’s were exceeded,20 of the wells are located either in the confined part of the regional aquifer or in the flood-plain alluvium. Water from thesetwo areas is generally used for irrigation. When the basin is viewed in its entirety, these two areas represent a very smallpercentage of the total area.
Water samples from 155 wells and springs were collected in 1990 for the HMS 31 (Barnes, 1997). Of that number, 59 weredetailed analyses and the remainder were analyzed for fluoride, specific-conductance and pH only. No samples were collectedfor the present HMS.
The maximum contaminant level (MCL) for fluoride in Arizona public drinking water is 4.0 milligrams per liter (mg/L), asestablished by the U. S. Environmental Protection Agency (1986, p. 11396-11397) and the Arizona Department of Environ-mental Quality (1989, p. 7). The MCL is an enforceable standard set by the U. S. Environmental Protection Agency fordrinking water. States must comply with this standard, but are free to set levels which are more stringent.
Dissolved-solids concentrations may be approximated by multiplying specific-conductance values by 0.6, which is the approxi-mate ratio of dissolved solids in mg/L to specific conductance in microsiemens per centimeter at 25°C.(mS/cm), The U. S.Environmental Protection Agency has established the secondary maximum contaminant level (SMCL) for dissolved solids at500 mg/L, which is approximately equivalent to a specific-conductance value of 833 mS/cm. The SMCL’s are guidelines only,and are not enforceable standards (U.S. Environmental Protection Agency, 1988, p. 9). The SMCL’s are based on aestheticqualities such as taste, odor and color. Water with contaminant levels above the SMCL are not necessarily a health risk.
Flood-Plain Alluvium
Some of the poorest quality water in the basin is found in the flood-plain alluvium. Between St. David and the Narrows, thespecific-conductance values are the highest in the basin, ranging from 850 to 2,800 µS/cm, or approximately 510 to 1,680 mg/L dissolved solids in 1990. South of St. David, specific-conductance values ranged from 307 to 620 mS/cm, or approximately184 to 372 mg/L dissolved solids, decreasing in value with distance south of St. David. Fluoride values ranged from a low of0.2 mg/L northwest of Hereford to a high of 3.0 mg/L near St. David. North of St. David values range from 0.5 to 1.9 mg/L andsouth of St. David from 0.2 to 1 .0 mg/L. Average water temperature in the flood-plain alluvium is about 19.6 °C (67.3 °F).
Basin–Fill Deposits
In the artesian area from St. David north to Benson, specific-conductance values range from 180 to 550 µS/cm, or approxi-mately 108 to 330 mg/L dissolved solids, which is well within the SMCL limits. Fluoride values range from 0.1 to 8.8 mg/L;the higher values generally occur from just south of Benson to Land. The temperature of the artesian waters averages 24.2 °C(75.6°F). There is a small area from just southwest to northwest of Pomerene in which five flowing wells were sampled. Thesewells have anomalously high temperatures which range from 28 °C to 30 °C and average 28.9 °C (84°F). Each of these wellsis at least 1,000 feet deep. Other artesian wells in the same general area produce water in the 20°C to 25°C range.
Only five of the wells sampled in the unconfined regional aquifer produce water which exceeds one of the MCL’s for fluorideor dissolved solids. This certainly is supportive of historical claims that the regional aquifer is of good quality. Fluoride valuesin the unconfined regional aquifer range from 0.1 mg/L to a high of 4.0 mg/L. Specific-conductance values range from 160µS/cm to 3,100 µS/cm, and average 448 µS/cm. Temperatures range from 17 °C to 29 °C, and averages 22.2 °C (72°F).
High sulfate and/or nitrate levels were detected in a few wells in the Upper San Pedro Basin. These wells are mainly located inthe flood-plain alluvium, roughly from St. David to the Narrows. The sulfate MCL of 250 mg/L was exceeded at three wellsand the nitrate MCL of 10 mg/L was exceeded at two wells. One well, (D-19-20) 3ODAA (360 mg/L), southeast of theWhetstone Mountains, completed in the regional aquifer produces water with high sulfate concentrations.
Water from 13 springs was analyzed for HMS 31. Fluoride values range from 0.5 to 1.9 mg/L. Specific-conductance valuesrange from 210 to 833 mS/cm, which is approximately 126 to 500 mg/L dissolved solids. Temperatures range from 7.5 °C atspring (D-17-23) 04BCC to 24.5 °C at spring (D-17-23) 18AAD, both located in the Dragoon Mountains.
COCHISE, GRAHAM AND SANTA CRUZ COUNTIES, ARIZONA—DEC. 2001- JAN. 2002
BYR.L. BARNES & F. PUTMAN
Basin-Fill Deposits
Based on 1968 data, a small elliptical cone of depression was first described by Roeske and Werrell, (1973, p.16). Thedepression was enclosed within the 4,150 foot contour. It encompassed about 5 square miles and was centered in section 33,Township 21 South, Range 20 East. The major axis of the elliptical cone was northeast-southwest in orientation. Data col-lected by the U. S. Geological Survey in the winter of 1977-78 supports Konieczki’s (1980, sheet 1) reference to the smalldepression centered within the 4,150 foot contour near Sierra Vista-Fort Huachuca. Putman and others (1988, p.98), usingdata collected in the winter of 1985-86, stated that the cone of depression within the 4,150 foot contour still extended in anortheast-southwest direction, and had increased areally to the east and southeast of Sierra Vista, to about 7.5 square miles. Amaximum decline of 9.2 feet was observed between 1985 and 1990 at well (D-21-21) 31CAC, while the minimum observeddecline was 2.2 feet at well (D-21-20) 35CBC for this period.
1834447
3650
4250
10
1804215
4300
4200
4400
MAPS SHOWING GROUNDWATER CONDITIONS IN THE UPPER SAN PEDRO BASIN,
LEGEND - EXPLANATION
794431
WELL IN WHICH DEPTH TO WATER WAS MEASURED IN 2001 -2002 - - UPPER NUMBER, 124, IS DEPTH TO WATER IN FEETBELOW LAND SURFACE. LOWER NUMBER, 4022, IS THE ALTITUDE OF THE WATER LEVEL IN FEET ABOVE MEAN SEA LEVEL.DATUM IS REFERENCED TO THE NATIONAL VERTICAL GEODETIC DATUM OF 1929.
1244022
ALLUVIAL-FILL DEPOSITS (CONSISTS OF SILT, SAND, CLAY, GRAVEL, AND CONGLOMERATE)
HARDROCK GRANITIC, METAMORPHIC, VOLCANIC OR CONSOLIDATED SEDIMENTARY ROCK - WATER MAY OCCUR IN WEATHEREDOR FRACTURED ZONES, JOINT SYSTEMS, OR FLUVIAL DEPOSITS OVERLYING BEDROCK.
BOUNDARY BETWEEN HARDROCK AND ALLUVIUM
WATER LEVEL CONTOURS - SHOWS THE APPROXIMATE ALTITUDE OF THE WATER-LEVEL. THE NUMBER 4000 REPRESENTS 4000FEET ABOVE MEAN SEA LEVEL. DASHED WHERE INFERRED.
4000
GENERAL GROUNDWATER FLOW DIRECTION
BOUNDARY OF UPPER SAN PEDRO BASIN
FOR READERS WHO PREFER TO USE METRIC UNITS RATHER THAN INCH-FEET UNITS,THE CONVERSION FACTORS FOR THE TERMS USED IN THIS REPORT ARE LISTED BELOW:
ENGLISH UNITS METRIC UNITS
1 INCH 25.4 MILLIMETERS1 FOOT 0.3048 METERS1 MILE 1.609 KILOMETERS1 SQUARE MILE 2.59 SQUARE KILOMETERS
4250
ADWR BOOKSTOREPhone: (602) 417-2485Fax: (602) 417-2488WEBSITE: www.adwr.state.az.us
MILES100500
0 50 100 150 KILOMETERS
INDEX MAP SHOWING AREA OF REPORT (SHADED)
109
109110
110
111
111
112113114
114
112
37 37
36 36
35 35
34 34
33 33
113
32 32
G R A H A M
C O C H I S E
GR
EE
NL
EE
KINGMAN
M O H A V E
Yuma
L A PA Z
YAVA P A I
P I M A
TUCSON
SANTA CRUZ
Nogales
P I N A L
M A R I C O P A
G I L APHOENIX
Prescott
Flagstaff
C O C O N I N O
NA
VA
JO
AP
AC
HE
Y U M A
Holbrook
SCALE BARSTATUTE MILES0 55
WATER-LEVEL CONTOUR INTERVAL 100 FEETWITH SUPPLEMENTARY CONTOURS AT 25 AND 50 FOOT INTERVALS
SCALE BARS
TRANSVERSE MERCATOR PROJECTION
BLACK NUMBERED LINES INDICATE THE 10,000 METER UNIVERSAL TRANSVERSE MERCATORGRID, ZONE 12 1977 MAGNETIC DECLINATION FROM TRUE NORTH VARIES FROM 13 DEGREES(230 MILS) EASTERLY FOR THE CENTER OF THE WEST EDGE 121EASt CENTER OF THE EASTEDGE
STATUTE MILES0 55
505 KILOMETERS

BASE MAP FROM U.S. GEOLOGICAL SURVEY1:250,000 TUCSON (1977), NOGALES (1969), AND DOUGLAS (1959)
THE ARIZONA DEPARTMENT OF WATER RESOURCESPREPARED IN COOPERATION WITH THE UNITED STATES GEOLOGICAL SURVEY
FOR READERS WHO PREFER TO USE METRIC UNITS RATHER THAN INCH-FEET UNITS, THE CONVERSIONFACTORS FOR THE TERMS USED IN THIS REPORT ARE LISTED BELOW:
ENGLISH UNITS METRIC UNITS
1 INCH 25.4 MILLIMETERS1 FOOT 0.3048 METERS1 MILE 1.609 KILOMETERS1 SQUARE MILE 2.59 SQUARE KILOMETERS
N
EW
S
THESE HYDROLOGIC MAPS ARE AVAILABLE UPON REQUEST FROM THE ARIZONA DEPARTMENT OF WATER RESOURCES,INFORMATION CENTRAL, 500 NORTH THIRD STREET, PHOENIX, ARIZONA, 85004. THE HYDROLOGIC DATA ON WHICH THESEMAPS ARE BASED ARE AVAILABLE AT THE ADWR BOOKSTORE. 602 417 2485
MAPS SHOWING GROUNDWATER CONDITIONS IN THE UPPER SAN PEDRO BASIN,
COCHISE, GRAHAM AND SANTA CRUZ COUNTIES, ARIZONA—DEC 2001-JAN 2002BY
R.L. BARNES & F. PUTMAN
TRANSVERSE MERCATOR PROJECTION
BLACK NUMBERED LINES INDICATE THE 10,000 METER UNIVERSAL TRANSVERSE MERCATORGRID, ZONE 12 1977 MAGNETIC DECLINATION FROM TRUE NORTH VARIES FROM 13DEGREES(230 MILS) EASTERLY FOR THE CENTER OF THE WEST EDGE TO 121/2 (220 MILS) EASTERLYFOR THE CENTER OF THE EAST EDGE
LEGEND - EXPLANATION
SCALE BARS
0 55
5 1005
STATUTE MILES
KILOMETERS
D.W.R HYDROLOGIC MAP SERIES REPORT NO. 34
SHEET 2 OF 2 CHANGES IN WATER LEVEL AND HYDROGRAPHS OF SELECTED WELLS
MILES100500
0 50 100 150 KILOMETERS
INDEX MAP SHOWING AREA OF REPORT (SHADED)
109
109110
110
111
111
112113114
114
112
37 37
36 36
35 35
34 34
33 33
113
32 32
G R A H A M
C O C H I S E
GR
EE
NL
EE
KINGMAN
M O H AV E
Yuma
L A PA Z
YAVA PA I
P I M A
TUCSON
SANTA CRUZ
Nogales
P I N A L
M A R I C O P A
G I L APHOENIX
Prescott
Flagstaff
C O C O N I N O
NA
VA
JO
AP
AC
HE
Y U M A
Holbrook
HYDROGRAPHS OF THE WATER LEVEL IN SELECTED WELLS SHOWN ON THE MAP
(Dashed line indicates an inferred water level)
DE
PT
H
TO
WA
TE
R I
N
FE
ET
BE
LOW
LA
ND
SU
RFA
CE
ISTOCK WELLDEPTH: 300 ft. (D-20-20) 02DDD
1960 1970 1980 1990 2000200
0J
UNUSED WELLDEPTH: 807 ft.
1960 1970 1980 1990 2000
200
400
(D-21-20) 16AAC1
250
4501960 1970 1980 1990 2000
ASTOCK WELLDEPTH: 415 ft. (D-14-21) 11BBC
EDOMESTIC WELLDEPTH: 60 ft. (D-18-21) 06AAB2
1960 1970 1980 1990 2000
0
200
MPUBLIC SUPPLY WELLDEPTH: 620 ft. (D-21-21) 31BDC
1960 1970 1980 1990 2000
175
375
(D-22-22) 06DACQUNUSED WELLDEPTH: 715 ft.
1960 1970 1980 1990 2000
0
200
RUNUSED WELLDEPTH: UNKNOWN (D-23-22) 18BBB
1960 1980 1990 2000
0
2001970
STOCK/DOMESTIC WELLDEPTH: 130 ft. (D-21-21) 22DDCN
1960 1970 1980 1990 2000
0
200
FSTOCK WELLDEPTH: 396 ft. (D-18-21) 01DCA
200
4001960 1970 1980 1990 2000
BSTOCK WELLDEPTH: 396 ft. (D-14-22) 34BDC
1960 1970 1980 1990 2000
250
GSTOCK WELLDEPTH: 253 ft. (D-19-21) 12DBB2
1960 1970 1980 1990 2000
100
300
KDOMESTIC WELLDEPTH: 700 ft. (D-21-20) 34DCC1
1960 1970 1980 1990 2000
400
600
OPUBLIC SUPPLY WELLDEPTH: 710 ft. (D-22-20) 01BBD
1960 1970 1980 1990 2000
250
450
1960 1970 1980 1990 2000
SUNUSED WELLDEPTH: 91.5 ft. (D-23-22) 33DCD2
0
200
T (D-24-23) 06AAA1
1960 1970 1980 1990 2000
STOCK/DOMESTIC WELLDEPTH: 520 ft.
300
100
PDOMESTIC WELLDEPTH: 180 ft. (D-22-21) 23CBA
1960 1970 1980 1990 2000
0
200
LPUBLIC SUPPLY WELLDEPTH: 722 ft. (D-21-20) 35DBB
1960 1970 1980 1990 2000
350
550
(D-19-23) 35ACDHSTOCK WELLDEPTH: UNKNOWN
1960 1970 1980 1990 2000400
200
DSTOCK WELLDEPTH: 350 ft. (D-18-20) 06BDD
1960 1970 1980 1990 2000
STOCK/DOMESTIC WELLDEPTH: 520 ft. (D-17-21) 32BABC
1960 1970 1980 1990 2000
0
200450
200
400
-16
12
-32
-28-27
-25
-28
-25
-23
-24-23-22
-16
-20
-21
1
-4
-10
-4
-2
1
-2
-8
0
0
-1
-1
-2 -4
-1
-1 0
-2
0 1
0
0
1 0
1
0 -2 -1
2 -1
1 1
-4
0
-1 5
2
2 7
1
-2 -2 -5
3
1 0 1 0
8
1 2
3
5
51 -4
T S
P
-4
-4
-4 -2
-1
-3 -2
-26
-30 1 -4
6 0
-4 -5
-6
-3
-4
-4
-3 -3 1
-3 Q
-14
-2
-1 -3
-3 -4
-2
9 -11
-6
4 0
N
0
0 15
0
3
11
0
-1
-3 -1
-1 -1
-3
-13 -14
-23
-5
-5
-4
-3
-12
-4 -3
-1
-1 1
-3
H 3
0 1
-1
-7
-1 3
-1 -4
2
5
0
-1
-10
G
-1 1
0
-2
-1
-18
1
-1
-12
11
-5
10
0 -1
0 -1
-3
9 5
-2 5
-4 F
3
4
-9
-3
-1
-3 4
8 -4
-2 -1
-11
2 -4
E
C
-6
-4
-3
3
18
-3
-3
-19
-4 B
A
2
0
0 2
-35 -9
-6
14 -3
15
17
-15 -9 -8
-11
-1
-6
-8 -11
-12
J
L
K O
M
-8
-5 -7
-6
-6
-5
-8 -7
-4
7
0
-3
-1
I -2
-4 -2
-1
-3
-5
-13
-5
21
2
5 -2
-3
-1
-6 -4
-3
4
-6
-2 -1
-6
-11
-1 -4
-6
-3
-11
0 -2 -7
-5
-3 -2
-1
-1
-2 -14
-1
-5 1
D 6
0
1
-1
5
-3
-2
-7
-5
-6
-7 -7
-7 -7
-6
-11
-6
-7 -3 -10
-2 -4
-5 0 -1 -3
-4 -6
-11
-10 -9 -10
-2 -4
-19
0
-4 -4
-1
-2
-4 0
6
8 7
4 9
1 7
7
11
4 2
6
7
6
11
4 1
4 5
-6
2-11
0
8
-3
-5
-2
0 -1
0
T24S
T23S
T22S
T21S
T20S
T19S
T18S
T17S
T16S
T14S
T13S
T12S
T11S
R 18 E R 19 ER 20 E
R 21 E
R 22 E
R 23 E
R 24 E
T15S
-1
-6
-6
1
1
1
1 1
0
R
0
0
0 5
510
-5
0
-5
-10
-5
0
-10
-15
-20
-5
-10
-20
-5 0
0
0 0 -5 -10
-20
-15 -2
5
-30
HARDROCK GRANITIC, METAMORPHIC, VOLCANIC OR CONSOLIDATED SEDIMENTARY ROCK - WATER MAY OCCUR IN WEATHEREDOR FRACTURED ZONES, JOINT SYSTEMS, OR FLUVIAL DEPOSITS OVERLYING BEDROCK.
WELL IN WHICH A HYDROGRAPH DEPICTING CHANGES IN DEPTH TO WATER IS SHOWNA
WELL IN WHICH WATER LEVEL WAS MEASURED IN DEC., 2001- JAN 2002 - - Number, +10, is the difference, in feet, between Dec.1990 andDec. 2001-Jan. 2002+10
ALLUVIAL-FILL DEPOSITS (CONSISTS OF SILT, SAND, CLAY, GRAVEL, AND CONGLOMERATE)
BOUNDARY OF UPPER SAN PEDRO BASIN
0 WATER LEVEL CHANGE CONTOURS - REPRESENTS THE APPROXIMATE LINE OF EQUAL CHANGE IN WATER LEVEL,0 to Dec. 2001-Jan. 2002. CONTOUR INTERVAL IS 5 FOOT. DASHED WHERE INFERRED.
BOUNDARY BETWEEN HARDROCK AND ALLUVIUM
ADWR BOOKSTOREPhone: (602) 417-2485Fax: (602) 417-2488WEBSITE: www.adwr.state.az.us
-5
-5
-10
-15-10
-10
-35