Embed Size (px)
Citation preview

Ann. Rev. Fluid Mech. 1987. 19 : 369-402Copyright © 1987 by Annual Reviews Inc. All rights reserved
DYNAMICS OF TORNADICTHUNDERSTORMS
Joseph B. Klemp
National Center for Atmospheric Research, Boulder, Colorado 80307
1. INTRODUCTION
Tornadic thunderstorms are the most intense and most damaging type ofconvective storm. Whereas ordinary convective cells grow, produce rain,and then decay over a period of 40 rain to an hour, certain thunderstormsmay develop into a nearly steady-state structure that persists for severalhours, producing heavy rain, large hail, damaging surface winds, andtornadoes. Although tornadoes may arise in a variety of storm conditions,these long-lived storms produce tornadoes most frequently and generatevirtually all of the most damaging ones. Prominent features of these tor-nadic thunderstorms, which are particularly common in the Great Plainsand midwestern regions of the United States, are illustrated in an idealizedschematic in Figure 1.
Our understanding of tornadic storms has evolved gradually over theyears as technological advances have been made in observing systems andcomputer models. The first indications that certain storms exhibit a specialbehavior came from early studies of data from upper-air soundings andsurface stations. While most thunderstorms moved with the mean windsover the lower and middle troposphere (Byers & Braham 1949), certainlarge storms were found to propagate consistently to the right of the meanwinds (Byers 1942, Newton & Katz 1958). Observing the shift in the winddirection as storms passed by surface stations, Byers (1942) and laterBrooks (1949) surmised that these intense storms have cyclonic ci r-culation (counterclockwise rotation about a vertical axis, viewed fromabove). Using data from scanning radar and ground observations, casestudies of a severe thunderstorm near Wokingham, England (Browning Ludlam 1962), and another near Geary, Oklahoma (Browning & Don-aldson 1963), revealed numerous distinctive features that were strikingly
3690066 4189/87/0115&369502.00
www.annualreviews.org/aronlineAnnual Reviews
Ann
u. R
ev. F
luid
Mec
h. 1
987.
19:3
69-4
02. D
ownl
oade
d fr
om a
rjou
rnal
s.an
nual
revi
ews.
org
by O
ntar
io C
ounc
il of
Uni
vers
ities
Lib
rari
es o
n 01
/30/
09. F
or p
erso
nal u
se o
nly.

310 KLEMP
similar in the two storms. Browning & Donaldson proposed that “these two storms may be representative of an important class of local storms ; namely those developing within a strongly sheared environment which remain persistently intense and tend toward a steady state circulation.”
Browning (1964) presented a conceptual model to explain the structure of these severe right-moving storms, which he named supercells. These storms develop when there is strong vertical shear of the environmental wind, as illustrated in Figure 2a, which plots the west-east ( U ) component of the wind field on the x-axis versus the south-north ( V ) component on the y-axis. Here, low-level winds (L) from the south turn gradually with height, becoming westerly at higher levels (H) in the upper troposphere ; the supercell storm moves to the right of the mean winds, in an easterly direction. Notice that in a coordinate framework moving with the storm, low-level air approaches the storm from the southeast, midlevel air from the south, and upper-level air from the west. Browning’s airflow model, shown schematically in Figure 2b, depicts a three-dimensional, nearly steady-state circulation (relative to the storm motion) in which warm, moist low-level air feeds continuously into a single large updraft, which is driven by buoyancy derived from the latent heating of condensing water vapor. Evaporativc cooling within the region of heaviest precipitation just north of the updraft drives the main downdraft, which ingests air passing around in front of the eastward-moving storm. As the colder and drier
Figure I An idealized tornadic thunderstorm as viewed from the southeast. The vertical scale is exaggerated by about a factor of two. (From Joe Golden, NWS-NOM, personal communication.)
www.annualreviews.org/aronlineAnnual Reviews
Ann
u. R
ev. F
luid
Mec
h. 1
987.
19:3
69-4
02. D
ownl
oade
d fr
om a
rjou
rnal
s.an
nual
revi
ews.
org
by O
ntar
io C
ounc
il of
Uni
vers
ities
Lib
rari
es o
n 01
/30/
09. F
or p
erso
nal u
se o
nly.

TORNADIC THUNDERSTORMS 371
downdraft air spreads out beneath the storm, it collides with the warmmoist inflow along a line called the gust front ; this convergence promotesthe lifting of potentially buoyant air into the updraft and sustains theconvection.
The important feature of this storm structure is the physical separationof the updraft and downdraft circulations such that each branch supports,rather than disrupts, the other. In weakly sheared environments, pre-cipitation forms within the updraft and produces negative buoyancy thatdestroys the convection. Subsequent research has largely substantiated thebasic features of Browning’s model.
Occasionally, severe storms are observed that move faster than, and tothe left of, the mean winds (cf. Hitschfeld 1960, Newton & Fankhauser
(b)
~ ~(~~lOkm
0 v~ IOOkm
Figure 2 Browning’s conceptual model for a right-moving supercell thunderstorm (SR).(a) Wind plot illustrating low-(L), middle-(M), and high-(H) level winds relative ground (solid arrows) and relative to the storm (dashed arrows). Motion of the SR storm shown with an open arrow. The motion and relative wind vectors for a possible left-movingsupercell (SL) are also shown. (b) Three-dimensional airflow within the SR storm viewedfrom the south-southeast. Updraft and downdraft circulations are shown relative to thestorm motion, depicted with a five-fold exaggeration in the vertical scale. Also depicted arcthe approximate extent of precipitation at the ground (hatched area), and positions of thegust front (barbed line) and tornado (when present). (Adapted from Browning 1964.)
www.annualreviews.org/aronlineAnnual Reviews
Ann
u. R
ev. F
luid
Mec
h. 1
987.
19:3
69-4
02. D
ownl
oade
d fr
om a
rjou
rnal
s.an
nual
revi
ews.
org
by O
ntar
io C
ounc
il of
Uni
vers
ities
Lib
rari
es o
n 01
/30/
09. F
or p
erso
nal u
se o
nly.

372 I(LEMP
1964, Hammond 1967). Browning (1968) noted that the environmentalwinds shown in Figure 2a could also promote a left-moving severe storm(SL). This SL storm experiences relative winds that are a mirror image the winds in the SR storm about the line LMH. Thus, Browning speculatedthat the SL storm would similarly have a structure in mirror image to theSR storm shown in Figure 2b and that a single thunderstorm might splitinto two parts, one an SR storm and the other an SL storm, which wouldmove along diverging paths. Hammond (1967) and later others haveconfirmed this type of SL storm structure, while numerous investigatorshave documented the splitting and subsequent divergence of severe storms(of. Hitschfeld 1960, Fujita & Grandoso 1968, Achtemeier 1969, Charba& Sasaki 1971, Fankhauser 1971).
By the mid-1970s, technological advances in radar and computers madeit possible to investigate the internal structure of supercell thunderstormsin far greater detail. Scanning storms simultaneously with two Dopplerradars permitted calculation of the three-dimensional wind field withinstorms (Ray et al. 1975, Miller 1975), while three-dimensional numericalmodels began to simulate storms in highly idealized environments(Wilhelmson 1974, Miller & Pearce 1974, Schlesinger 1975). More recently,simulations of specific supercell thunderstorms have reproduced manyof the important features of the observed storms (Klemp et al. 1981,Wilhelmson & Klemp 1981). With more comprehensive data, new theoriesarose to explain the mechanisms that govern the important physical pro-cesses in these severe thunderstorms, such as the development of rotation,storm splitting, storm propagation, the preferential enhancement of right-moving cyclonically rotating storms, and the intensification of low-levelrotation as a storm enters its tornadic phase.
In the following sections, I discuss the essential fluid processes pro-moting these special storm features that characterize the tornadic supercellthunderstorm. In doing so, I draw heavily from the results of three-dimensional numerical-modeling studies, in which storms can be generatedunder controlled conditions and which provide complete kinematic andthermodynamic data both in and around a storm. However, althoughthese models have demonstrated good qualitative agreement with observedstorms, some of the mechanisms derived from the detailed analyses ofsimulated storms must still be tested against future data that will be ob-tained from the increasingly sophisticated storm-observing systems.
Over the past several years, a number of excellent reviews have com-prehensively documented the progress in convective-storm research (cf.Lilly 1979, Houze & Hobbs 1982, Kessler 1985). In this more limitedreview, I focus on selected aspects of tornadic thunderstorm dynamics,without attempting to represent all points of view, in order to avoid unduedistraction for the reader unfamiliar with this topic.
www.annualreviews.org/aronlineAnnual Reviews
Ann
u. R
ev. F
luid
Mec
h. 1
987.
19:3
69-4
02. D
ownl
oade
d fr
om a
rjou
rnal
s.an
nual
revi
ews.
org
by O
ntar
io C
ounc
il of
Uni
vers
ities
Lib
rari
es o
n 01
/30/
09. F
or p
erso
nal u
se o
nly.

TORNADIC THUNDERSTORMS 373
2. EARLY DEVELOPMENT OF ROTATION
During its early development, an isolated cumulus grows as a buoyantthermal (or perhaps as a cluster of thermals). At this stage, it has longbeen known (Byers & Braham 1949) that wind shear inhibits the convec-tion, tending to tear apart the rising thermals. However, when a vigorousupdraft does develop in a sheared environment, it invariably exhibitssignificant rotation about a vertical axis, typically in the form of a pair ofcounterrotating vortices (Wilhelmson 1974, Schlesinger 1975, Kropfli ,Miller 1976, Wilhelmson & Klemp 1978). This vortex-pair circulationarises as a result of the tilting into the vertical of horizontal vortex linesembedded initially in the environmental shear. Rotunno (1981) pointedout that the manner in which tilting produces vertical vorticity in the earlyconvection may differ significantly from that in the mature thunderstormpropagating transverse to the mean winds.
To illustrate the evolution of rotation, we consider the basic governingequations that describe the relevant storm processes. For a compressibleatmosphere, the appropriate analogue to the incompressible Boussinesqequations may be written in the following form (Ogura & Phillips 1962,Lilly 1979)"
c~v +v" Vv+V~r = B~+F,(1)
Ot
v- ~,,-= 0, (2)where v = (u, v, w) is the three-dimensional velocity vector in Cartesiancoordinates (x, y, z), F represents the turbulent mixing, ~ is the unit vectorin the vertical direction, and B is the total perturbation buoyancy, includingthe influences of temperature and water vapor as well as drag caused byliquid water. Here, n = p’/fi, where p’ is the pressure perturbation abouta mean state corresponding to an adiabatic atmosphere (i.e. the meanpressure/5 and mean density ¢5 are related by/5 ~ pc,/~0), and henceforthwe refer to ~r as the pressure. The Coriolis force has been omitted from(1), since it does not play a fundamental role in the storm dynamics to discussed (Klemp & Wilhelmson 1978).
Taking the curl of (1) then yields expressions for the vertical (~) horizontal (toh) components of vorticity to = V x
d( Owd-~ = toh" Vhw + ~ ~z + F~ , (3)
~ ~ ,--,,-.-,tilting stretching mixing
d~- = to" Vvl, + V x (B[) + Fh , (4)tilting and baroclinic mixingstretching generation
www.annualreviews.org/aronlineAnnual Reviews
Ann
u. R
ev. F
luid
Mec
h. 1
987.
19:3
69-4
02. D
ownl
oade
d fr
om a
rjou
rnal
s.an
nual
revi
ews.
org
by O
ntar
io C
ounc
il of
Uni
vers
ities
Lib
rari
es o
n 01
/30/
09. F
or p
erso
nal u
se o
nly.

374 KLEMP
where Vh = (U,V) and F~,F~ are the respective mixing terms withF’ -- V x F, and d/dt is the Lagrangian time derivative.
Focusing on the generation of vertical vorticity, we see that the firstterm on the right-hand side of (3) contributes to ( by tilting horizontalvortex lines into the vertical, while the second term alters ~ through thevertical stretching of vortex tubes. Clearly, if convection begins in anenvironment containing no vertical vorticity, then the initial productionof ( must arise through the tilting of horizontal vorticity contained in theambient wind shear. The important parameter characterizing the verticalwind shear is the environmental wind-shear vector S = dV/dz, whereV = (U, V). S has two components: speed shear represented by [SI, anddirectional shear caused by turning of the shear vector. Notice that thewind field shown in Figure 2a has only speed shear, with S being orientedparallel to the line LMH. Numerical storm simulations have shown thata unidirectional wind shear is sufficient to produce supercell-like stormswith characteristic structure similar to that shown in Figure 2b (Klemp& Wilhelmson 1978). However, directional shear also exerts importantinfluences on storm evolution, as is discussed in Section 4.
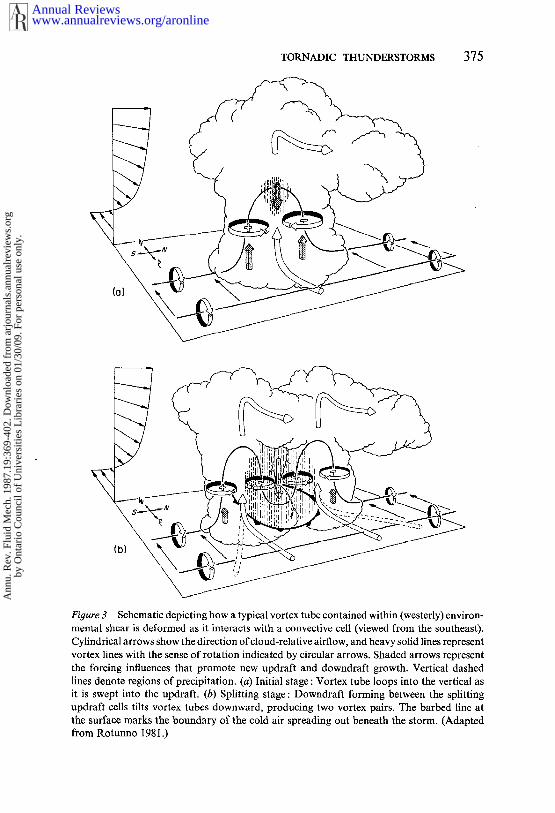
For simplicity, consider first an isolated cumulus growing in unidi-rectional wind shear in which the westerly velocity U increases with heightand V = 0. In its early convective growth, the cloud moves roughly withthe mean westerly flow (averaged over the depth of the cloud). Thus, in storm-relative framework, low-level inflow approaches the cloud from theeast while upper-level outflow returns toward the east, as illustrated inFigure 3a. A vortex-pair circulation develops as south-north-orientedvortex lines are swept into the updraft and tilted into the vertical.
This mechanism is contained in the linearized vertical vorticity equationgiven by (ignoring the mixing term)
d~ dU Owdt- dz Oy"
(5)
Positive (cyclonic) vertical vorticity is generated along the southern flankof the updraft (Sw/Oy > 0), while negative (anticyclonic) vorticity is pro-duced on the northern flank (Ow/Oy < 0). As the updraft intensifies, vor-ticity that has been tilted into the vertical can be amplified substantiallyby the stretching of vortex tubes, which is a nonlinear effect.
3. STORM SPLITTING
Although the cloud in Figure 3a is still a rather ordinary cumulus, forcinginfluences are already promoting its transition to a supercell storm. Asprecipitation accumulates within the updraft, increasing negative buoy-
www.annualreviews.org/aronlineAnnual Reviews
Ann
u. R
ev. F
luid
Mec
h. 1
987.
19:3
69-4
02. D
ownl
oade
d fr
om a
rjou
rnal
s.an
nual
revi
ews.
org
by O
ntar
io C
ounc
il of
Uni
vers
ities
Lib
rari
es o
n 01
/30/
09. F
or p
erso
nal u
se o
nly.
TORNADIC THUNDERSTORMS 375
Fi#ure 3 Schematic depicting how a typical vortex tube contained within (westerly) environ-mental shear is deformed as it interacts with a convective cell (viewed from the southeast).Cylindrical arrows show the direction of cloud-relative airflow, and heavy solid lines representvortex lines with the sense of rotation indicated by circular arrows. Shaded arrows representthe forcing influences that promote new updraft and downdraft growth. Vertical dashedlines denote regions of precipitation. (a) Initial stage : Vortex tube loops into the vertical it is swept into the updraft. (b) Splitting stage: Downdraft forming between the splittingupdraft cells tilts vortex tubes downward, producing two vortex pairs. The barbed line atthe surface marks the boundary of the cold air spreading out beneath the storm. (Adaptedfrom Rotunno 1981.)
www.annualreviews.org/aronlineAnnual Reviews
Ann
u. R
ev. F
luid
Mec
h. 1
987.
19:3
69-4
02. D
ownl
oade
d fr
om a
rjou
rnal
s.an
nual
revi
ews.
org
by O
ntar
io C
ounc
il of
Uni
vers
ities
Lib
rari
es o
n 01
/30/
09. F
or p
erso
nal u
se o
nly.

376 KLEMP
ancy produces a downdraft within the cloud. Enhanced by evaporativecooling, the downdraft outflow at the surface, being colder than the sur-rounding environment, spreads out beneath the storm. In weak wind shear,this outflow spreads out in all directions, cutting off the supply of warmmoist air, and the storm cell dissipates rapidly. However, in strong shear(i.e. ISI "" 10-2 s-~ over the lowest several kilometers), two factors act toextend the longevity of the storm: storm-relative low-level inflow from theeast prevents the cold air from moving out ahead of the storm (Wilhelmson& Klemp 1978, Thorpe & Miller 1978), and lifting pressure gradientsreinforce new updraft growth on the southern and northern flanks of thecentral updraft (Schlesinger 1980, Rotunno & Klemp 1982). In responseto these forcing influences, the updraft splits gradually into two cells thatmove laterally apart, as illustrated in Figure 3b.
The lifting vertical pressure gradients appear to be the fundamentallyimportant factor in splitting the cloud into two cells that then move apart.Although the cold low-level downdraft outflow increases the convergencealong the updraft flanks, numerical simulations demonstrate that updraftsplitting occurs even if this central downdraft is prevented from forming(Rotunno & Klemp 1982, 1985). This is accomplished in the models not allowing any precipitation to fall relative to the surrounding air.Without this falling precipitation, the negative buoyancy required to gen-erate the downdraft is greatly reduced,
The origin of these lifting forces can be elucidated through a detailedanalysis of the terms in the vertical momentum equation, as generatedby three-dimensional storm-simulation models. By dividing the pressureinto components ~ = nan + ~Zb, produced by dynamic interactions ~an andthrough buoyancy effects rib, the vertical component of (1) can be writtenin the form
Ow O on (O b - v’Vw --B + F~St ~ c~z \ c% ~--~’
advection ~ ~ mixingdynamics buoyancyforcing forcing
(6)
and expressions for the dynamics and buoyancy components of the pres-sure are obtained from the divergence of (1)
V" (t~Wz~,) = - V" (/~v" Vv) + V" (7)
v. (~Wb) = ~ (#B). (8)
The dynamics forcing term in (6) thus represents the contribution vertical accelerations from the portion of the vertical pressure gradient
www.annualreviews.org/aronlineAnnual Reviews
Ann
u. R
ev. F
luid
Mec
h. 1
987.
19:3
69-4
02. D
ownl
oade
d fr
om a
rjou
rnal
s.an
nual
revi
ews.
org
by O
ntar
io C
ounc
il of
Uni
vers
ities
Lib
rari
es o
n 01
/30/
09. F
or p
erso
nal u
se o
nly.

TORNADIC THUNDERSTORMS 377
created by dynamic interactions, while the buoyancy forcing term includesthe pressure gradient arising through buoyancy effects. Since a large por-tion Of the buoyancy pressure gradient may be balanced by the buoyancyterm itself, the buoyancy forcing, as defined in (6), represents the netinfluence of buoyancy on vertical accelerations. The divergence of theturbulent mixing term V" ¢5F has a generally minor influence on the pres-sure, since these terms largely cancel through the continuity equation (2) thus, they are omitted in further discussions (Klemp & Rotunno 1983).Pressure decompositions similar to this have been used to analyze numer-ous aspects of storms simulated with three-dimensional models (Wilhelm-son 1974, Schlesinger 1980, Rotunno & Klemp 1982, 1985, Klemp &Rotunno 1983).
Schlesinger (1980) first noted that the lifting pressure gradients on theflanks of a splitting updraft are dynamic in origin. Rotunno & Klemp(1982) proposed that these lifting pressure gradients on the updraft flanksare induced by the midlevel rotation. To assess the influence of rotationon the pressure we expand the right-hand side of (7) in the form
vfluid extension terms
d~ In ~6d2.2 1412
[-Or Ou 3u Ow 3v Ow-]
~ ~xx J(9)
-2fi~x ~yy + +~zz~yy ;fluid shear terms
Consider first the fluid shear te~ &/Ox" Ou/Oy. For a wind field in purerotation, this term is simply - ~{~. For pu~oses of qualitative analysis,note that in the interior of a flow, the Laplaeian of a variable is roughlyproportional to the negative of the variable itself (i.e. V2~ ~ - ~). Com-bining these relations then yields
=fin ~ __~2, (10)
which suggests that the strong midlevel rotation on the updraft flank (seeFigure 3b) acts to lower the pressure and thereby induces updraft growthon these flanks. The second and third fluid shear terms in (9) are relatedsimilarly to the x- and y-components of vorticity, respectively. These te~sare amplified by the vortex ring that forms around the updraft because ofthe horizontal buoyancy gradients on its flanks [i.e. through the baroclinicgeneration te~ in Equation (4)]. Therefore, these two rotational te~salso contribute to lowering the pressure on the flanks of the midlevelupdraft, although (unlike the first te~) they are not specific to the flanks
www.annualreviews.org/aronlineAnnual Reviews
Ann
u. R
ev. F
luid
Mec
h. 1
987.
19:3
69-4
02. D
ownl
oade
d fr
om a
rjou
rnal
s.an
nual
revi
ews.
org
by O
ntar
io C
ounc
il of
Uni
vers
ities
Lib
rari
es o
n 01
/30/
09. F
or p
erso
nal u
se o
nly.

378 KLEMP
that are transverse to the shear. Rotunno & Klemp 0982) found that thefluid extension terms in (9) do not contribute to the lifting pressure gradi-ents on the updraft flanks. Consequently, strong rotation about the verticalaxis appears to be the special feature .that promotes the splitting withinevolving supercell thunderstorms.
As the splitting progresses and the two updraft centers move apartlaterally, the downdraft dividing the two cells tilts the vortex lines down-ward, producing two vortex-pair circulations as shown in Figure 3b(Rotunno 1981). As each updraft begins to propagate transverse to themean wind shear, the direction of storm-relative inflow turns as indicatedby the dashed cylindrical arrows in Figure 3b. In this configuration, thelow-level inflow contains a streamwise component of the horizontal shearvorticity, as well as the transverse component that produced the originalvortex pair. Browning & Landry (1963) and Barnes (1970) proposed the tilting of the streamwise vorticity in the environmental shear was theimportant contributor to the rotation in supercell storms. Rotunno (1981),Lilly (1982), and Davies-Jones (1984) also emphasized the importance the streamwise vorticity ; using simplified linear models, they demonstratedthat if the environmental vorticity vector is parallel to the storm-relativeinflow, the vertical vorticity generated through tilting will tend to be inphase with the vertical velocity (as opposed to the transverse componentthat produces vertical vorticity maxima on the updraft flanks, as shownin Figure 3a).
Following Lilly (1986a), we consider a steady updraft propagating trans-verse to the environmental wind shear (i.e. to the south at velocity cy inthe situation shown in Figure 3). In a coordinate framework relative tothe moving updraft, flow approaches from the south with a velocity -Cy.The linear vertical vorticity equation (3) then becomes (ignoring mixing)
O~ dU Ow--Cy ~ = ~z ~’ (11)
which can be integrated immediately, with the result being
dU w( (12)dz (-c~)
Thus, the vertical vorticity is coincident with the vertical velocity in thissimplified situation.
Davies-Jones (1984) and Rotunno & Klemp (1985) extended the lineartheory by providing interpretations of vertical vorticity generation withinstorms that remain valid even in fully nonlinear flow. Using the equationsof motion as written in (1) and (2), we can show through Ertel’s theorem
www.annualreviews.org/aronlineAnnual Reviews
Ann
u. R
ev. F
luid
Mec
h. 1
987.
19:3
69-4
02. D
ownl
oade
d fr
om a
rjou
rnal
s.an
nual
revi
ews.
org
by O
ntar
io C
ounc
il of
Uni
vers
ities
Lib
rari
es o
n 01
/30/
09. F
or p
erso
nal u
se o
nly.

TORNADIC THUNDERSTORMS 379
(see Dutton 1976, p. 382) that for a conserved scalar variable ® dependingonly on the thermodynamic properties of the flow, it follows that
d~= 0. (13)
Here, we identify 0 as the entropy of the moist fluid flow. Since to. V® = 0in the initial, undisturbed state, it will remain zero throughout the evolvingstorm. This result means that vortex lines must lie along isentropic surfaces.Thus, as isentropic surfaces are drawn up into the storm, their embeddedvortex lines are similarly deformed.
This effect was illustrated by Rotunno & Klemp (1985) within a numeri-cally simulated storm evolving in a unidirectional (west-to-east) shear (seeFigure 4). In the initial state, the isentropic surfaces are horizontal and thevortex lines in the environmental shear are oriented south to north. Aslow-level flow rises into the updraft (t = 10 min) the vortex lines followthe deforming iscntropic surfaces, producing cyclonic vertical vorticity onthe southern flank and anticyclonic vorticity along the northern flank (notshown). After the splitting updraft begins moving toward the south (t 40 min), vortex lines are continuously turned into the vertical along thesouthern flank as the isentropic surfaces are lifted into the updraft. As theevaporatively cooled downdraft (centered on the symmetry plane) bringsmidlevel air to the ground, a depression appears in the low-level isentropicsurface (t = 40, 60 min). Vortex lines turned upward along the southernupdraft flank turn back downward and produce anticyclonic vorticity onthe northern flank (t = 60 min). At t = 40 and 60 min, the vortex linesshown in the foreground curl underneath along the boundary of the colddowndraft and disappear from view. This redirection of vortex lines isdiscussed further in Section 6.
4. PREFERENTIAL ENHANCEMENT OFCYCLONICALLY ROTATING STORMS
The splitting process described above leads naturally to a pair of rotatingstorms--a cyclonic one moving to the right of the mean winds and ananticyclonic one moving to the left. However, right-moving, cyclonicallyrotating supercell storms are, in fact, observed far more commonly.Davies-Jones (1985) notes that out of 143 storms in which radar detectedstrong rotation, only 3 rotated anticyclonically. Although it is tempting toattribute this bias to the ambient rotation in the atmosphere caused bythe Coriolis force (which is cyclonic in the Northern Hemisphere), scaleanalyses suggest that this effect should be small (Morton 1966). Numerical
www.annualreviews.org/aronlineAnnual Reviews
Ann
u. R
ev. F
luid
Mec
h. 1
987.
19:3
69-4
02. D
ownl
oade
d fr
om a
rjou
rnal
s.an
nual
revi
ews.
org
by O
ntar
io C
ounc
il of
Uni
vers
ities
Lib
rari
es o
n 01
/30/
09. F
or p
erso
nal u
se o
nly.

380 KLEMP
storm simulations indicate that the Coriolis force does enhance the cyclonicrotation in the right-moving storm but does not selectively suppress theanticyclonically rotating storm (Klemp & Wilhelmson 1978).
By simulating supercell storms in a variety of wind-shear conditions,Klemp & Wilhelmson (1978) demonstrated that a clockwise turning with
10 min
40 min
Figure 4 Numerically simulated three-dimensional perspective (viewed from the east) of
low-level isentropic surface that is being drawn up into the storm updraft at t = 10, 40, and
60 min. The environmental wind shear is directed from west to east, and the flow is symmetric
about the vertical plane along the northern border. Vortex lines (heavy solid lines) lie
approximately on the isentropic surface. The base plane spans 20 km in the south-northdirection, and the vertical scale is exaggerated by a factor of two. (From Rotunno & Klemp
1985.)
www.annualreviews.org/aronlineAnnual Reviews
Ann
u. R
ev. F
luid
Mec
h. 1
987.
19:3
69-4
02. D
ownl
oade
d fr
om a
rjou
rnal
s.an
nual
revi
ews.
org
by O
ntar
io C
ounc
il of
Uni
vers
ities
Lib
rari
es o
n 01
/30/
09. F
or p
erso
nal u
se o
nly.

TORNADIC THUNDERSTORMS 381
height of the environmental wind-shear vector is the key factor that selec-tively promotes the cyclonic, fight-moving storm. This turning is apparentin the composite wind sounding (Figure 5) compiled by Maddox (1976)for a large number of tornadic storms. Notice that if we superimpose x, y-axes over the U, V-axes in Figure 5, the wind-shear vector S is locallytangent to the curve V(U) at all levels in the sounding. In this compos-ite, the wind-shear vector turns clockwise with height, from the north-northeast near the surface to the east-southeast at 700 mbar (about 3 kmabove the ground).
Figure 6 illustrates the evolving storm structures for two wind profiles--one having a unidirectional environmental wind-shear vector (top) andthe other having a shear vector that turns clockwise with height throughthe lower levels (bottom). With the winds below 2.5 km given by the dashedline in the accompanying wind plot, the initial cloud splits into two stormsafter 40 min that move apart as they propagate to the northeast. In theabsence of surface drag and Coriolis effects, they evolve into identical,mirror-image right- and left-moving storms. In this simulation the line ofsymmetry is oriented east-west and moves toward the north at 12.7 m s-1.When the low-level shear vector turns cyclonically with height, the initialconvective cell evolves into an intense, cyclonically rotating right-movingstorm, while on the left flank, only weaker short-lived cells form along thegust front. Notice that the significant factor here is the turning of the wind-shear vector, not the turning of the wind vector itself. (In either windprofile, the ground-relative winds turn clockwise with height.)
Rotunno & Klemp (1982) found that the basis for the selective enhance-ment of either the right- or left-moving storm is contained within lineartheory. As an initially axisymmetric updraft interacts with a mean wind
V 200
sfc
U 4~0Figure 5 Mean wi~ad sounding (in m s-~) for 62 tornado outbreak cases. The soundings arccomposited by computing the winds at each level relative to the estimated storm motion.Heavy arrows indicate the direction of the shear vector at each level (labeled in mbar). Theestimated mean storm motion is denoted by ®. (Adapted from Maddox 1976.)
www.annualreviews.org/aronlineAnnual Reviews
Ann
u. R
ev. F
luid
Mec
h. 1
987.
19:3
69-4
02. D
ownl
oade
d fr
om a
rjou
rnal
s.an
nual
revi
ews.
org
by O
ntar
io C
ounc
il of
Uni
vers
ities
Lib
rari
es o
n 01
/30/
09. F
or p
erso
nal u
se o
nly.

382 KLEMP
U(rn/s]
Figure 6 Plan views of numerically simulated thunderstorm structures at 40, 80, and 120min for two environmental wind profiles (displayed at upper left) having wind shear betweenthe surface and 7.5 km. The storm system in the lower portion of the figure evolves inresponse to the wind profile, in which S turns clockwise with height between the ground and2.5 km (heavy solid line in wind plot), while the upper system develops when S is unidi-rectional (same wind profile except following the heavy dashed line below 2.5 km). The planviews depict the low-level (I .8 km) rainwater field (similar to radar reflectivity) contoured 2 g kg-1 intervals, the midlevel (4.6 km) updraft (shaded regions), and the location of surface cold-air outflow boundary (barbed lines). The maximum updraft velocity is labeled(in m s 1) within each updraft at each time. The dashed lines track the path of eachupdraft center. Arrows in the wind plot indicate the supercell propagation velocities for theunidirectional (dashed) and turning (solid) wind-shear profiles. (Adapted frown Klemp Weisman 1983.)
www.annualreviews.org/aronlineAnnual Reviews
Ann
u. R
ev. F
luid
Mec
h. 1
987.
19:3
69-4
02. D
ownl
oade
d fr
om a
rjou
rnal
s.an
nual
revi
ews.
org
by O
ntar
io C
ounc
il of
Uni
vers
ities
Lib
rari
es o
n 01
/30/
09. F
or p
erso
nal u
se o
nly.

TORNADIC THUNDERSTORMS383
shear S that turns clockwise with height, favorable vertical pressure gradi-ents are dynamically induced on the right flank while unfavorable gradientsarise on the left. To demonstrate this effect, consider an updraft per-turbation in a homogeneous fluid (B = 0). The linearized inviscid verticalmomentum and pressure equations (6)-(8) are then simply
dw- (14)
dt
V2x = -2S" VhW. (15)
We can evaluate the qualitative behavior of (15) by again using the approxi-mation Vzx ~ -x, which yields
~ ~ S" VhW. (16)
Thus, linear theory suggests that as an updraft interacts with the shearflow, a high-to-low pressure gradient devel6ps across the updraft in thedirection of the local shear vector at each level. For a constant shearmagnitude, this pressure effect increases in amplitude with height beneaththe level of the maximum updraft velocity.
To visualize the influences of these shear-induced pressure variations,consider first the unidirectional shear profile represented in Figure 3. Herethe shear vector points from west to east at all levels, producing highpressure on the upshear (west) side of the updraft and low pressure on thedownshear (east) side, as depicted in Figure 7a. As the updraft intensityincreases above the ground, these pressure perturbations promote low-level lifting on the downshear side (and descent on the upshear side) thatreinforces the storm inflow. However, these vertical pressure gradients donot contribute to a preferential growth on either of the flanks that aretransverse to the shear or to storm splitting (which, as discussed in Section3, is an inherently nonlinear effect).
Expressing the linearized vertical vorticity equation (3) in terms of we have
d(~ = k" (S × Vhw), (17)
which indicates that the vortex pair generated through tilting is orientedat right angles to the shear vector. For the unidirectional shear in Figure7a, Equation (17) is identical to Equation (5), producing cyclonic anticyclonic vorticity on the southern and northern flanks, respectively.
Figure 7b illustrates the corresponding situation when S turns clockwisewith height through the lower levels of the atmosphere. Here, the winds
www.annualreviews.org/aronlineAnnual Reviews
Ann
u. R
ev. F
luid
Mec
h. 1
987.
19:3
69-4
02. D
ownl
oade
d fr
om a
rjou
rnal
s.an
nual
revi
ews.
org
by O
ntar
io C
ounc
il of
Uni
vers
ities
Lib
rari
es o
n 01
/30/
09. F
or p
erso
nal u
se o
nly.

384 KLEMP
(a)
Figure 7 Schematic illustrating the pressure and vertical vorticity perturbations arising asan updraft interacts with an environmental wind shear that (a) does not change directionwith height and (b) turns clockwise with height. The high (H) to low (L) horizontal pressuregradients parallel to the shear vectors (flat arrows) are labeled along with the preferredlocation of cyclonic (+) and anticyclonic (-) vorticity. The shaded arrows depict orientation of the resulting vertical pressure gradients. (Adapted from Rotunno & Klemp1982.)
www.annualreviews.org/aronlineAnnual Reviews
Ann
u. R
ev. F
luid
Mec
h. 1
987.
19:3
69-4
02. D
ownl
oade
d fr
om a
rjou
rnal
s.an
nual
revi
ews.
org
by O
ntar
io C
ounc
il of
Uni
vers
ities
Lib
rari
es o
n 01
/30/
09. F
or p
erso
nal u
se o
nly.

TORNADIC THUNDERSTORMS 385
change with height from easterly, to southerly, and finally to westerly,such that S turns through 180° (pointing toward the north at the ground,and turning to the east and then to the south at higher levels). In thissituation, the turning shear vector produces vertical pressure gradientsthat favor ascent on the southern flank (designated the right flank byfacing in the direction of the mean-shear vector) and descent on thenorthern (left) flank. This influence, in conjunction with the nonlinearprocesses that promote splitting, enhances the development of the right-moving storm and inhibits the growth of the left-moving storm. Whenthere is significant turning of the shear vector, growth on the left flankmay be suppressed to the extent that there would be no apparent splittingat all ; the initial storm just begins moving to the right of the mean windsat a certain stage in its development (as occurs in the storm simulationwith turning shear in Figure 6). As the vbrtex pair forms perpendicularlyto the shear vector, the production of cyclonic vorticity is also on the rightflank, where the favorable pressure gradients are promoting new updraftgrowth. For a wind profile in which S turns counterclockwise with height,the situation would be reversed and the left-moving, anticyclonically rotat-ing member of the split pair would be selectively enhanced.
5. STORM PROPAGATION
As storms begin to propagate with a component transverse to the meanwinds, those that will become supercell thunderstorms generally continueto intensify and evolve toward a mature structure such as that shownschematically in Figure 2b. Their ability to persist in a quasi-steady-stateconfiguration for a period of hours is a truly remarkable feature of thesestorms. Browning & Foote (1976) analyzed the radar observations of storm in northeastern Colorado that maintained a supercellular structurefor more than 5 hours and produced a swath of damaging hail (some aslarge as baseballs) over a 300-km-long path.
Comprehensive analyses of tornadic thunderstorms using multiple-Doppler radar observations have provided detailed documentation of theimportant features of these storms (cf. Ray et al. 1975, 1981, Brandes1977, 1978, Eagleman & Lin 1977). Numerical simulations have alsoprovided an informative view of supercell thunderstorms, particularlythose conducted in idealized environmental conditions, where variousenvironmental influences can be selectively evaluated (cf. Weisman Klemp 1982, 1984). Figure 8 depicts the model-equivalent of the visiblecloud for a right-moving supercell storm during its mature phase for acase of unidirectional wind shear in the absence of Coriolis effects. Evenunder these idealized conditions, there are strong qualitative similarities
www.annualreviews.org/aronlineAnnual Reviews
Ann
u. R
ev. F
luid
Mec
h. 1
987.
19:3
69-4
02. D
ownl
oade
d fr
om a
rjou
rnal
s.an
nual
revi
ews.
org
by O
ntar
io C
ounc
il of
Uni
vers
ities
Lib
rari
es o
n 01
/30/
09. F
or p
erso
nal u
se o
nly.

386 KLEMP
Figure 8 Numerically simulated cloud depicting a supercell storm in its mature phase. The unidirectional environmental wind-shear vector points toward the east (i.c. increasing westerlies with height), and the storm is viewed from the southeast. The shaded surface coincides with the 0.1 g kg-' contour in the model cloud-water field. The storm simulation is described in detail by Rotunno & Klemp (1985).
with the illustration in Figure 1. In this situation, a mirror-image, left- moving storm also develops, which is accommodated using appropriate symmetry conditions along the northern boundary of the computational domain.
The flow structure within this quasi-steady storm (see Figure 9) exhibits features that are characteristic of supercell storms. At low levels, there is a zone of convergence (gust front) where the warm, moist low-level inflow collides with the cold downdraft outflow. Strong cyclonic rotation is visible within the midlevel (4 km) updraft, and this flow turns downstream into the anvil outflow at higher levels. The hooklike feature on the southern side of the rainwater field at low and midlevels corresponds to the hook echo that is frequently observed by radar in tornadic storms. Although the environmental winds blow only in the east-west direction, this storm is propagating toward the south at about 5 m s-'.
The mechanism that causes the transverse propagation of supercell storms has remained an intriguing although illusive issue over the years. Researchers have proposed a variety of theories that appeal to a diverse spectrum of physical processes. Several of these interesting approaches are summarized below.
www.annualreviews.org/aronlineAnnual Reviews
Ann
u. R
ev. F
luid
Mec
h. 1
987.
19:3
69-4
02. D
ownl
oade
d fr
om a
rjou
rnal
s.an
nual
revi
ews.
org
by O
ntar
io C
ounc
il of
Uni
vers
ities
Lib
rari
es o
n 01
/30/
09. F
or p
erso
nal u
se o
nly.

TORNADIC THUNDERSTORMS 387
Analoyies With Obstacle Flow
Even in the early storm observations, researchers recognized that theupdrafts in large storms remain erect, in defiance of the strong environ-mental wind shear in which they are embedded. Substantial portions ofenvironmental air therefore diverge and flow around the storm in a mannerthat resembles flow past a bluff obstacle at high Reynolds number, withseparation occurring behind the obstacle (cf. Newton & Newton 1959,Newton 1963, and also the flow at z =- 8 km in Figure 9). From controlledlaboratory experiments it is well known that flow past a cylinder produceshigh pressure near the forward stagnation point and low pressure alongthe flanks and in the separated region at the rear. If the cylinder is rotating,
Figure 9 Perspective view of the flow structure within the numerically simulated supercellthunderstorm shown in Figure 8, displayed along horizontal cross sections located at 0, 4,and 8 km above the ground. The horizontal flow vectors are spaced 2 km apart (every secondgrid point) and are scaled such that the distance separating adjacent vectors corresponds to25 m s- ~. Vertical velocity is contoured in 5 rn s ~ intervals with the zero line removed exceptat the lowest level, where w is contoured at z = 0.25 km in 1 m s-~ increments. Regions ofprecipitation exceeding 0.5 and 2 g kg-~ are differentially shaded, and the barbed line denotesthe location of the cold-air boundary at the surface.
www.annualreviews.org/aronlineAnnual Reviews
Ann
u. R
ev. F
luid
Mec
h. 1
987.
19:3
69-4
02. D
ownl
oade
d fr
om a
rjou
rnal
s.an
nual
revi
ews.
org
by O
ntar
io C
ounc
il of
Uni
vers
ities
Lib
rari
es o
n 01
/30/
09. F
or p
erso
nal u
se o
nly.

388 KLEMP
a net pressure gradient (lift) arises that is transverse to the mean-flowdirection ; this is called the Magnus effect (Prandtl & Tietjens 1934a). Byers(1942) and later Fujita & Grandoso (1968) proposed that cyclonicallyrotating storms deviate to the right of the mean winds as a result of thehorizontal pressure gradients produced by this effect.
A more detailed examination of the flow in and around storms revealssignificant complications in the obstacle-flow analogy. Updrafts areentraining and/or detraining substantial amounts of air over most of theirvertical height. As the updraft is embedded within a strongly sheared flow,both the magnitude and direction of the storm-relative flow may varysignificantly with height. In fact, at the lower levels, the storm-relative flowdirection is reversed (see the low-level environmental flow in Figures 2b and9), which would cause the Magnus effect to work in the wrong direction. Innumerical storm simulations, Rotunno & Klemp (1982) found that thepressure gradient across the updraft aligns more consistently with thedirection of the shear vector at each level as suggested by linear theory[see Equation (16)] than with the direction of the storm-relative flow.Finally, the updraft is not a tangible entity that can be deflected later-ally. Since the updraft is continually regenerated from below, horizontalforces acting on the rising air parcels do not necessarily promote updraftpropagation.
Variations on the obstacle-flow analogy were proposed by Newton &Newton (1959) and Alberty (1969). They argued that low pressure on flanks (Alberty) and downwind (Newton & Newton) of the storm, duced by obstacle-flow effects, cause vertical pressure gradients that inducelifting on the flanks and, thereby, transverse propagation. I believe thisapproach correctly focuses attention on the influence of vertical pressuregradients on propagation, although the inference of pressure distributionsfrom obstacle-flow analogies suffers from the complications mentionedabove.
Rotationally Induced Propagation
Based on analyses of numerically simulated supercell storms, Rotunno &Klemp (1985) proposed that storm propagation transverse to the environ-mental wind shear is dynamically induced by the strong midlevel rotationthat develops along the flank of the storm. This mechanism is basicallythe same as the one responsible for storm splitting (described in Section3) ; the strong midlevel rotation on the updraft flank lowers the pressurelocally, which promotes lifting pressure gradients and thus new updraftgrowth that displaces the updraft laterally.
The factors influencing propagation were evaluated by examining againthe forcing terms in the vertical momentum equation (6). Rotunno
www.annualreviews.org/aronlineAnnual Reviews
Ann
u. R
ev. F
luid
Mec
h. 1
987.
19:3
69-4
02. D
ownl
oade
d fr
om a
rjou
rnal
s.an
nual
revi
ews.
org
by O
ntar
io C
ounc
il of
Uni
vers
ities
Lib
rari
es o
n 01
/30/
09. F
or p
erso
nal u
se o
nly.

TORNADIC THUNDERSTORMS389
Klemp found the dynamically induced vertical pressure gradient to be theonly term in (6) that causes new growth on the flank of the updraft thatis transverse to the wind shear. Although the buoyancy forcing within theupdraft is substantial, it is nearly coincident with the updraft and thereforedoes not contribute to propagation. The nature of the dynamics forcingcan be further clarified by considering the terms in (9) that govern thedynamics pressure ~tdn. By defining ~tdn = rcs + ~e, they computed the con-tribution to nd~ from the fluid shear terms (~) and the fluid extensionterms (he) and established that the shear terms were responsible for thepropagation. The fluid extension terms have their strongest influence, asexpected, along the centerline of the updraft.
To further isolate the dynamically forced pressure gradients, Rotunno& Klemp (1985) recomputed the storm simulation shown in Figures 8 and9 but now prohibited the formation of precipitating water drops. This wasaccomplished by allowing water vapor to condense and release latent heat,but not allowing liquid water to fall relative to the air. With the physicsaltered in this manner, the initial storm still splits and evolves into amirror-image pair of storms that exhibit strong rotation at midlevels andpropagate apart, transverse to the mean wind shear. The downdrafts aremuch weaker, and no cold outflow occurs beneath the storm (essentiallyeliminating the downdraft branch of the circulation depicted in Figure2b). Thus, even without the precipitation-driven downdrafts, the forcespromoting transverse propagation continue to operate.
The relationship between the updraft and the shear-induced low pressureis depicted in a three-dimensional perspective (viewed from the east) Figure 10. The low-res region corresponds closely in location and amplitudeto the full perturbation pressure ~ ; it induces new lifting on the southernflank of the updraft and thereby propagation of the entire storm towardthe south. Recalling the qualitative relationship V2rcs ~ -rc~, one wouldexpect low pressure to arise where the fluid shear terms are negative [seeEquation (9)]. For a fluid in pure rotation these terms are negative, whereasfor a purely shearing flow they are positive or zero (see Prandtl & Tietjens1934b, p. 82). Thus, Rotunno & Klemp (1985) attributed the loweredpressure to the rotational component of the flow structure.
This study suggests that the gust front may be less important in govern-ing supercell storm propagation than previously believed. Beneath thestorm, strong lifting is usually maintained by the convergence of the cold-downdraft outflow and the warm moist inflow (clearly visible in the low-level cross section in Figure 9). Weaver & Nelson (1982) and others havedocumented that new convection forming along this gust front-inducedconvergence line frequently governs storm propagation. However, in thissimulation without precipitation (and thus without a low-level gust front),
www.annualreviews.org/aronlineAnnual Reviews
Ann
u. R
ev. F
luid
Mec
h. 1
987.
19:3
69-4
02. D
ownl
oade
d fr
om a
rjou
rnal
s.an
nual
revi
ews.
org
by O
ntar
io C
ounc
il of
Uni
vers
ities
Lib
rari
es o
n 01
/30/
09. F
or p
erso
nal u
se o
nly.

390 KLEMP
Shear-InducedLow Pressure
<~ IUpdr
FigurelO Three-dimensional perspective (looking west) of the updraft ( > 20 m s- 1) togetherwith the shear-induced pressure ( < - 3.6 mbar) for a simulation with no precipitation in environment with unidirectional (westerly) wind shear. The cylindrical arrow indicates thedirection of storm-relative inflow, the shaded arrow denotes the rotationally induced forcing,and the open arrow shows the southerly direction of propagation. The displayed surfaceplane is 20 × 20 km, and the vertical scale is exaggerated by a factor of two. (Adapted fromRotunno & Klemp 1985.)
transverse propagation occurs in a similar fashion to that in the fullsimulation. This result indicates that the cold downdraft outflow may playa secondary role in supercell storm propagation.
In a related study, Weisman & Klemp (1984) computed the con-tributions of the dynamics and buoyancy forcing terms in (6) to the overallstrength of the updraft for both supercellular and nonsupercellular storms.By integrating these terms along updraft trajectories, they found that thedynamics forcing contributed about 60% of the updraft intensity in thesupercell storm but only about 35% of the updraft intensity in the non-supercellular storm. These results suggest that the dynamically inducedvertical pressure gradients are fundamentally important in driving a super-cell’s updraft circulation, as well as in displacing it laterally.
Forced Propagating Gravity Waves
Although the updrafts within convective storms may be highly unstable,they generate substantial perturbations in the surrounding stable environ-ment. An approach developed by Lindzen (1974) and Raymond (1975,1976) proposes that the motion of convective storms is controlled bypropagating gravity waves, forced by the moist convection. The convectiveheating is parameterized, typically by relating it to the lifting at the level
www.annualreviews.org/aronlineAnnual Reviews
Ann
u. R
ev. F
luid
Mec
h. 1
987.
19:3
69-4
02. D
ownl
oade
d fr
om a
rjou
rnal
s.an
nual
revi
ews.
org
by O
ntar
io C
ounc
il of
Uni
vers
ities
Lib
rari
es o
n 01
/30/
09. F
or p
erso
nal u
se o
nly.
TORNADIC THUNDERSTORMS 391
of cloud base caused by the gravity-wave motion. The gravity waves andconvection can thus interact symbiotically to generate instabilities thatselect the preferred modes--termed wave-CISK by Lindzen (1974). Thismechanism is a variation on CISK (Conditional Instability of the SecondKind), which was introduced by Charney & Eliassen (1964) and Ooyama(1964) to explain the role of small-scale convection in intensifyinghurricanes.
In applying wave-CISK, one solves the linear wave equations subject toan appropriate forcing term that represents the nonlinear aspects of thesystem, most particularly the moist convection. To illustrate this approach,we consider the linear inviscid equations, ignoring vertical variations inthe mean density. The thermodynamic equation, expressed in terms of thebuoyancy B, can be written as
0B0~ +V- V~,B+ N~w = Q, (18)
where N is the buoyancy frequency (also called the Brunt-Vfiisfilfifrequency), and Q is the latent heating term, which can be approximatedby the vertical mass flux through cloud base at z = b multiplied by theaverage gradient of nonadiabatic heating between cloud base and cloudtop (see Raymond 1975, Lilly 1979)
Ow, ifOwN~b > O"
Q = c~z z=0 ~z z=0 ’ (19)(0, otherwise.
Combining (18) with the linearizations of (1) and (2) and consideringdisturbances of the form w = ~(z)exp[i(k’x-c0] yields the Taylor-Goldstcin equation (ef. Drazin & Reid 1981) with a forcing term:
~32~ { N21 d2Vk_k2}~ = e~_.
(20)Oz~ + ~ + (e- vk) 2 (c- G)~’
where k is the horizontal vector wave number, c is the phase speed,V~ = V’k/k is the component of V in the direction of k, and k = ]kl. Thefactor e arises in the Fourier modes from the constraint Q _> 0 imposed in(19), and Lindzen (1974) showed that e = 1/2 is an appropriate estimate.Solving for the eigenmodes of (20), one seeks the most unstable mode characterize the nature of the propagating disturbance.
Raymond (1975, 1976) solved this equation for observed wind profilesassociated with several supercell and splitting-storm cases. The resultingestimates for the motion of the most unstable modes were generally in
www.annualreviews.org/aronlineAnnual Reviews
Ann
u. R
ev. F
luid
Mec
h. 1
987.
19:3
69-4
02. D
ownl
oade
d fr
om a
rjou
rnal
s.an
nual
revi
ews.
org
by O
ntar
io C
ounc
il of
Uni
vers
ities
Lib
rari
es o
n 01
/30/
09. F
or p
erso
nal u
se o
nly.

392 KLEMP
good agreement with the observed storm propagation if he overestimatedthe heating using a value of e = 3/2. However, to generate splitting andtransverse propagating modes, the wave-CISK model required directionalturning of the environmental wind-shear vector. This requirement is con-trary to the results of three-dimensional numerical cloud models thatconsistently produce splitting storms (such as that shown in Figures 8 and9) in strong unidirectional wind shear. Also, the neglect of the nonlinearterms in the momentum equation may be a crucial deficiency when appliedto supercell storms developing in strong wind shear.
Raymond (1983) reformulated the wave-CISK equation in terms of parameterized mass flux and increased the realism of the model by allowingfor lagged feedback influences in both updrafts and downdrafts. Thismodel uses the more reasonable value of e-- 1/2 and produces goodagreement with observations for simulations of midlatitude and tropicalsquall lines (Raymond 1984). Currently, however, it does not seem thatwave-CISK is a viable candidate for explaining supercell propagation.
Optimization of Helicity
Recently, Lilly (1986b) demonstrated that supercell storms have a highlyhelical circulation and proposed that this helicity promotes the longevityand transverse propagation of these storms. The helicity H is definedas the inner product of vorticity and velocity, H --- to- v. A more usefuldimensionless parameter, relative helicity RH, results from normalizingthe helicity by Itol Ivl such that RH lies in the range of _ 1. Lilly points torecent research that has established the importance of helicity in stabilizingturbulent flows. Highly helical eddies are found to decay much more slowlythan those with low helicity and thus eventually become dominant in theflow. He proposes that high helicity may similarly reduce the turbulentdissipation in supercell storms and thereby enhance their longevity. Conse-quently, Lilly suggests that as a supercell develops, it should evolve natur-ally into a structure that optimizes its helicity.
To illustrate the highly helical nature of supercells, Lilly computed RHthroughout a numerically simulated storm and showed that below a heightof about 10 km, the average value of RH was about 0.5. As an exampleof purely helical flow, Lilly considered Beltrami flows in which, by defi-nition, the vorticity is everywhere parallel to the velocity, such that to = ~v.Since -V2v = V x to = Eto = x2v, the proportionality constant x equalsthe magnitude of the three-dimensional wave number I kl. If both the meanand perturbation flows are helical, the combined flow is helical only if theBeltrami coefficient for each flow is the same. For a unidirectional (west-erly) wind shear, Lilly estimated the transverse propagation speed e byinserting ~ for the disturbance (storm) into the mean-flow Beltrami equa-
www.annualreviews.org/aronlineAnnual Reviews
Ann
u. R
ev. F
luid
Mec
h. 1
987.
19:3
69-4
02. D
ownl
oade
d fr
om a
rjou
rnal
s.an
nual
revi
ews.
org
by O
ntar
io C
ounc
il of
Uni
vers
ities
Lib
rari
es o
n 01
/30/
09. F
or p
erso
nal u
se o
nly.

TORNADIC THUNDERSTORMS 393
tion, with the result
[/~ x~2 i/~’~2 = (dU/dz~2,(21)
where the half-wavelengths h and W correspond to the height and widthof the updraft, respectively. Solving for the propagation speed yields
cy = +_yhdU/dz, where y = (1 +2h2/W2)-1/2~-1. (22)
Although this expression is derived from highly idealized assumptionsand requires a knowledge of the scale of the storm, it seems to providequalitatively reasonable estimates of the transverse propagation speed.For example, setting h = W= 10 km and dU/dz = 0.005 s-l (5 m -1
km-1), we have cy ~- 9 m s 1.The role of helicity in supercell thunderstorm dynamics is an intriguing
issue that will surely be further analyzed in future research. However, theconcept of optimizing helicity is difficult to test ; it implies that a wholerange of structures could exist (each with a different overall helicity) andthat the stabilizing influence of helicity selects the optimal state. Since innature and in numerical simulations we see only the structure that doesevolve, it is hard to judge whether or not this structure is optimal. Also, Ifeel the importance of minimizing dissipation in supercell storms must bestudied further. Supercells are continuously forced by both buoyant anddynamical processes, and the residence time of air parcels within such astorm is short compared with the storm’s lifetime. Therefore, it is not yetclear if minimizing dissipation is a key factor influencing the behavior ofthe storm.
6. TRANSITION TO THE TORNADIC PHASE
Although not all supercell storms produce tornadoes, most of the intensetornadoes are generated by them. In a radar study of Oklahoma stormsduring 1971-75, for example, Burgess (1976) found that 62% of the storms that exhibited strong storm-scale rotation developed tornadoes,whereas none occurred in storms that did not rotate.
When a storm does move into its tornadic phase, significant alterationof the storm-scale structure occurs that disrupts the nearly steady con-figuration illustrated in Figures 2b and 9. Lemon & Doswell (I 979) providean excellent description of storm features that are consistently observedduring this transition. These features include a rapid increase in low-levelrotation, a decrease in updraft intensity, a small-scale downdraft formingbehind the updraft, and a flow at low levels in which cold-outflow and
www.annualreviews.org/aronlineAnnual Reviews
Ann
u. R
ev. F
luid
Mec
h. 1
987.
19:3
69-4
02. D
ownl
oade
d fr
om a
rjou
rnal
s.an
nual
revi
ews.
org
by O
ntar
io C
ounc
il of
Uni
vers
ities
Lib
rari
es o
n 01
/30/
09. F
or p
erso
nal u
se o
nly.

394 KLEMP
warm-inflow air spiral around the center of circulation. This low-levelflow is depicted schematically in Figure 11; as the downdraft (labeledRFD) adjacent to the updraft intensifies, downdraft outflow progressescyclonically around the center of rotation (marked by the northernencircled T), which is the likely location for tornado formation. As thisoutflow pushes into the path of the oncoming moist inflow, a new updraftand center of rotation may also develop tornadic intensity (denoted bythe southern encircled T in Figure 11). At the same time, the spreadingdowndraft outflow cuts off the supply of warm moist air to the originalcirculation center (called occlusion), causing the original updraft toweaken.
STORM MOTION
N
0 5 I0 km
Figure 11 Schematic plan view of a tornadic thunderstorm near the surface. The thick lineencompasses the radar echo. The barbed line denotes the boundary between the warm inflowand cold outflow and illustrates the occluding gust front. Low-level position of the updraftis finely stippled, while the forward-flank (FFD) and rear-flank (RFD) downdrafts coarsely stippled. Storm-relative surface flow is shown along with the likely location oftornadoes (encircled T’s). (From Lemon & Doswell 1979, as adapted by Davies-Jones 1985.)
www.annualreviews.org/aronlineAnnual Reviews
Ann
u. R
ev. F
luid
Mec
h. 1
987.
19:3
69-4
02. D
ownl
oade
d fr
om a
rjou
rnal
s.an
nual
revi
ews.
org
by O
ntar
io C
ounc
il of
Uni
vers
ities
Lib
rari
es o
n 01
/30/
09. F
or p
erso
nal u
se o
nly.

TORNADIC THUNDERSTORMS 395
Although a supercell storm may persist in a nearly steady configurationfor up to several hours, the transition to the tornadic phase illustrated inFigure 11 may take place in less than about 10 min. Barnes (1978) andLemon & Doswell (1979) have suggested that this transition is initiatedby the rear-flank downdraft (see Figure 11), which forms at midlevels,descends to the surface, and then intensifies the low-level rotation by pro-ducing strong shear (Barnes) or temperature gradients (Lemon & Dos-well) between this downdraft and the updraft.
More recent numerical storm simulations (Klemp & Rotunno 1983,Rotunno & Klemp 1985) and observational studies (Brandes 1984a,b)indicate a reverse sequence of events ; the low-level rotation intensifies,followed by formation of the rear-flank downdraft. Figure 12 illustratesschematically the flow structure within a numerically simulated supercellevolving in a unidirectional wind shear (as in Figures 8 and 9) at time when the low-level rotation is intensifying rapidly, but prior to theformation of the occluded gust front shown in Figure 11.
Klemp & Rotunno (1983) proposed that the rear-flank downdraft thatpromotes this occlusion is, in fact, dynamically induced as strong low-level
Figure 12 Three-dimensional schematic view of a numerically simulated supercell thun-derstorm at a stage when the low-level rotation is intensifying. The storm is evolving inwesterly environmental wind shear and ig viewed from the southeasl. The cylindrical arrowsdepict the flow in and around the storm. The thick lines show the low-level vortex lines, withthe sense of rotation indicated by the circular-ribbon arrows. The heavy barbed line marksthe boundary of the cold air beneath the storm.
www.annualreviews.org/aronlineAnnual Reviews
Ann
u. R
ev. F
luid
Mec
h. 1
987.
19:3
69-4
02. D
ownl
oade
d fr
om a
rjou
rnal
s.an
nual
revi
ews.
org
by O
ntar
io C
ounc
il of
Uni
vers
ities
Lib
rari
es o
n 01
/30/
09. F
or p
erso
nal u
se o
nly.

396 KLEMP
rotation lowers the pressure locally and draws down air from above. Bydecomposing the pressure field at a time when the simulated rear-flankdowndraft was intensifying, they demonstrated that the fluid shear termdv/dx" ~u/dy was responsible for virtually the entire adverse vertical pres-sure gradient near the ground. As discussed earlier, a region in pure rotationsatisfies 8v/Ox’Ou/8y = -~(2, and thus qualitatively we have rc ,,, -(2.Since the intensifying ( is largest near the ground, a downward-directedpressure gradient results, which in turn promotes the downdraft. Theretarding influence of rotation has been recognized in a variety of fluidflows (cf. Binnie & Hookings 1948) and has been called the vortex valveeffect; Lemon et al. (1975) suggested that as the rotation increases withinthe storm, this effect may be responsible for its collapse.
An expanded view of the low-level flow in Figure 12 is displayed inFigure 13a and indicates the location of the rotation-induced low pressure.As the rear-flank downdraft intensifies, the downdraft outflow spreads outnear the ground and, as shown in Figure 13b, initiates a new center ofconvergence and rotation farther east along the gust front (as also depictedin Figure 11). The descending air in the rear-flank downdraft evaporatesthe cloud water and produces a region of cloud-free air (called the clearslot) immediately behind the convergence line, as indicated in Figure 13b.
In the numerical simulation just described, the maximum low-level ver-tical vorticity remained less than one half the maximum at midlevels forover an hour, and then in less than 10 min it intensified to double themidlevel maximum. What factors are responsible for this rapid ampli-fication of the low-level rotation? Analyses of the storm simulations dem-onstrate clearly that the intensification is stimulated by the baroclinicgeneration of strong horizontal vorticity [see Equation (4)] along the low-level boundary of the cold air pool forming beneath the storm (Klemp Rotunno 1983, Rotunno & Klemp 1985). This horizontal vorticity is thentilted into the vertical and strongly stretched as the inflow enters the low-level updraft. To see how this situation arises, notice that in the evolvingstorm, precipitation is swept around to the northern side of the cyclonicallyrotating storm. As it falls to the north and northeast of the updraft,evaporation cools the low-level air (see Figure 9). With time, this cold poolof air advances progressively into the path of the low-level inflow to thestorm. By the time shown in Figure 9, a significant portion of the inflowis approaching along the boundary of this cold air pool. The horizontaltemperature gradients thus baroclinically generate horizontal vorticitythat is nearly parallel to the inflowing streamlines. This process generateshorizontal vorticity that is several times the magnitude of the mean shearvorticity and that is more favorably oriented to be tilted into verticalcyclonic vorticity. This same mechanism may also be responsible for
www.annualreviews.org/aronlineAnnual Reviews
Ann
u. R
ev. F
luid
Mec
h. 1
987.
19:3
69-4
02. D
ownl
oade
d fr
om a
rjou
rnal
s.an
nual
revi
ews.
org
by O
ntar
io C
ounc
il of
Uni
vers
ities
Lib
rari
es o
n 01
/30/
09. F
or p
erso
nal u
se o
nly.

TORNADIC THLrNDERSTORMS 397
tornadoes that form occasionally in nonsupercellular storms. If a stormencounters a preexisting cold front or an outflow boundary from anotherstorm, strong horizontal vorticity (baroclinically generated along thatboundary) may be swept into the storm and amplified.
The low-level vortex lines depicted in Figures 12 and 13 further illustratethe baroclinic vorticity generation mechanism. Since the environmentalshear is westerly, the horizontal vortex lines embedded in the shear areoriented south-north with the sense of rotation as indicated in the undis-
[b)
Fi#ure 13 Expanded three-dimensional perspective, viewed from the southeast, of the low-level flow (a) at the time depicted in Figure 12, and (b) about 10 min later after the rear-flank downdraft has intensified. Features are drawn as described in Figure 12, except thatthe vector direction of vortex lines are indicated by arrows along the lines. The shaded arrowin (a) represents the rotationally induced vertical pressure gradient, and the striped arrow (b) denotes the rear-flank downdraft.
www.annualreviews.org/aronlineAnnual Reviews
Ann
u. R
ev. F
luid
Mec
h. 1
987.
19:3
69-4
02. D
ownl
oade
d fr
om a
rjou
rnal
s.an
nual
revi
ews.
org
by O
ntar
io C
ounc
il of
Uni
vers
ities
Lib
rari
es o
n 01
/30/
09. F
or p
erso
nal u
se o
nly.
398 rce~r~v
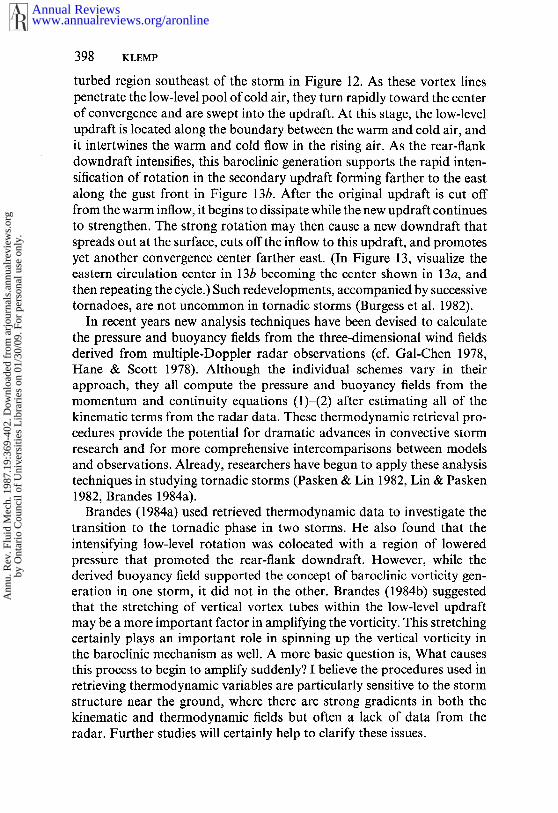
turbed region southeast of the storm in Figure 12. As these vortex linespenetrate the low-level pool of cold air, they turn rapidly toward the centerof convergence and are swept into the updraft. At this stage, the low-levelupdraft is located along the boundary between the warm and cold air, andit intertwines the warm and cold flow in the rising air. As the rear-flankdowndraft intensifies, this baroclinic generation supports the rapid inten-sification of rotation in the secondary updraft forming farther to the eastalong the gust front in Figure 13b. After the original updraft is cut offfrom the warm inflow, it begins to dissipate while the new updraft continuesto strengthen. The strong rotation may then cause a new downdraft thatspreads out at the surface, cuts off the inflow to this updraft, and promotesyet another convergence center farther east. (In Figure 13, visualize theeastern circulation center in 13b becoming the center shown in 13a, andthen repeating the cycle.) Such redevelopments, accompanied by successivetornadoes, are not uncommon in tornadic storms (Burgess et al. 1982).
In recent years new analysis techniques have been devised to calculatethe pressure and buoyancy fields from the three-dimensional wind fieldsderived from multiple-Doppler radar observations (cf. Gal-Chen 1978,Hane & Scott 1978). Although the individual schemes vary in theirapproach, they all compute the pressure and buoyancy fields from themomentum and continuity equations (1)-(2) after estimating all of kinematic terms from the radar data. These thermodynamic retrieval pro-cedures provide the potential for dramatic advances in convective stormresearch and for more comprehensive intercomparisons between modelsand observations. Already, researchers have begun to apply these analysistechniques in studying tornadic storms (Pasken & Lin 1982, Lin & Pasken1982, Brandes 1984a).
Brandes (1984a) used retrieved thermodynamic data to investigate thetransition to the tornadic phase in two storms. He also found that theintensifying low-level rotation was colocated with a region of loweredpressure that promoted the rear-flank downdraft. However, while thederived buoyancy field supported the concept of baroclinic vorticity gen-eration in one storm, it did not in the other. Brandes (1984b) suggestedthat the stretching of vertical vortex tubes within the low-level updraftmay be a more important factor in amplifying the vorticity. This stretchingcertainly plays an important role in spinning up the vertical vorticity inthe baroclinic mechanism as well. A more basic question is, What causesthis process to begin to amplify suddenly? I believe the procedures used inretrieving thermodynamic variables are particularly sensitive to the stormstructure near the ground, where there are strong gradients in both thekinematic and thermodynamic fields but often a lack of data from theradar. Further studies will certainly help to clarify these issues.
www.annualreviews.org/aronlineAnnual Reviews
Ann
u. R
ev. F
luid
Mec
h. 1
987.
19:3
69-4
02. D
ownl
oade
d fr
om a
rjou
rnal
s.an
nual
revi
ews.
org
by O
ntar
io C
ounc
il of
Uni
vers
ities
Lib
rari
es o
n 01
/30/
09. F
or p
erso
nal u
se o
nly.

TORNADIC THUNDERSTORMS399
7. DISCUSSION
The advancements in thunderstorm research have documented clearly thatthe strong rotation within supercells is a dominant factor in shapingthe very special characteristics of these storms. This rotation is derivedprimarily from horizontal vorticity embedded in the environmental windshear that is swept up into the storm and tilted toward a vertical axis. Thestrong rotation on the flanks of the midlevel updraft promotes splitting ofthe initial convective cell as well as transverse propagation of the storm.This rotation also contributes to the formation of a long-lived structure inwhich the precipitating downdrafts support, rather than destroy, continuedconvection. As evaporatively cooled air moves into the path of the storm’sinflow, baroclinic generation of horizontal vorticity along the boundaryof the cold air causes the intensification of low-level rotation that maytrigger the transition of a storm into its tornadic phase.
An important question that remains unresolved is, How is the tornadiccirculation embedded within the storm-scale structure? The tornado itselfappears nearly axisymmetric, while the storm structure in the vicinityof the tornado (along the boundary between warm-updraft and cold-downdraft air) is highly asymmetric. In both numerical models and obser-vations, the issue is complicated by the nearly two orders of magnitudedifference in the horizontal scale of the tornado and the parent storm.Future research with high-resolution radar and more powerful super-computers will undoubtedly contribute to the resolution of this out-standing issue.
To date, tornadic thunderstorm research has led to a refined under-standing of the environmental conditions that promote these storms andan improved ability to identify the salient features within an evolving stormthat indicate a strong likelihood of impending tornadic activity. Otherfactors, however, such as the storm-initiation processes and the inter-actions between storms and with the larger-scale environment, greatlycomplicate the prospects for forecasting the precise time and location oftornadoes with a significant lead time. Further research in these areas willbe necessary in order to improve this outlook substantially.
Literature Cited
A~htemeier, G. L. 1969. Some observationsof splitting thunderstorms over Iowa onAugust 25~6, 1965, Preprints, ConfSevere Local Storms, 6th, pp. 89-94. Bos-ton : Am. Meteorol. Soc.
Alberty, R. L. 1969. A proposed mecha-nism for cumulonimbus persistence in the
presence of strong vertical shear. Mon.Weather Rev. 97 : 590-96
Barnes, S. L. 1970. Some aspects of a severeright-moving thunderstorm deduced frommesonetwork observations. J. Atmos. Sci.27 : 634-48
Barnes, S. L. 1978. Oklahoma thunder-
www.annualreviews.org/aronlineAnnual Reviews
Ann
u. R
ev. F
luid
Mec
h. 1
987.
19:3
69-4
02. D
ownl
oade
d fr
om a
rjou
rnal
s.an
nual
revi
ews.
org
by O
ntar
io C
ounc
il of
Uni
vers
ities
Lib
rari
es o
n 01
/30/
09. F
or p
erso
nal u
se o
nly.

400 ~:L~M~,storms on 29-30 April 1970. Part I:Morphology of a tornadic storm. Mort.Weather Rev. 106 : 673-84
Binnie, A. M., Hookings, G. A. 1948. Lab-oratory experiments on whirlpools. Proe.R. Soc. London Ser. A 194:348~415
Brandes~ E. A. 1977. Gust front evolutionand tornado genesis as viewed by Dopplerradar. J. Appl. Meteorol. 16:333-38
Brandes, E. A. 1978. MesOcyclone evolutionand tol~nadogenesis: some observations.Mon. Weather Rev. 106:995-1011
Brandes, E. A. 1984a. Relationships betweenradar-derived thermodynamic variablesand tornadogenesis. Mon. Weather Rev.112 : 1033-52
Brandes, E. A. 1984b. Vertical vorticity.generation and mesocyclone sustenancein tornadic thunderstorms: the observa-tional evidence. Mon. Weather Rev. 112 :2253q59
Brooks, E. M. 1949. The tornado cyclone.Weatherwise 2 : 32-33 "
Browning, K. A. 1964. Airflow and pre-cipitation trajectories within severe localstorms which travel to the right of thewinds. J. Atmos. Sei. 21 : 634~39
Browning, K. A. 1968. The organization ofsevere local storms. Weather 23 : 429-34
Browning, K. A., Donaldson, R. J. Jr. 1963.Airflow structure of a tornadic storm. J.Atmos Sci. 20 : 53345
Browning, K. A., Foote, G; B. 1976. Airflowand hailgrowth in supercell storms andsome implications for hail suppression. Q.J. R. Meteorol. Soc. 102 : 499-533
Browning, K. A., Landry, C. R. 1963. Air-flow within a tornadic storm. Preprints,Weather Radar Conf., lOth, pp. 116-22.Boston : Am. Meteorol. Soc.
Browning, K. A., Ludlam, F. H. 1962. Air-flow in convective storms. Q. J. R. Meteo-rol. Soc. 88 : 117-35
Burgess, D. W. 1976. Single Doppler radarvortex recognition. Part 1: mesocyclonesignatures. Preprints, Conf Radar Meteo-rol., 17th, pp. 97-103. Boston: Am.Meteorol. Soc.
Burgess, D. W., Wood, V. T., Brown, R.A. 1982. Mesocyclone evolution statistics.Preprints, Conf Severe Local Storms, 12th,pp. 422 24. Boston : Am. Meteorol. Soc.
Byers, H. R. 1942. Nonfrontal thunder-storms. Misc. Rep. No. 3. Chicago : Univ.Chicago Press. 26 pp.
Byers, H. R., Braham, R. R. Jr. 1949. TheThunderstorm. Washington DC: Gov.Print. Off. 287 pp.
Charba, J., Sasaki, Y. 1971. Structure andmovement of the severe thunderstorms of3 April 1964 as revealed from radar andsurface mesonetwork data analysis. J.Meteorol. Soc. Jpn. 49:191-213
Charney, J. G., Eliassen, A. 1964. On thegrowth of the hurricane depression. 3".Atmos. Sci. 21 : 68-75
Davies-Jones, R. P. 1984. Streamwise vor-ticity: the origin of updraft rotation insupercell storms. J. Atmos. Sci. 41 : 2991-3006
Davies-Jones, R. P. 1985. Tornado dynam-ics. See Kessler 1985, pp. 197-236
Drazin, P. G., Reid, W. H. 1981. Hydrody-namic Stability. Cambridge: CambridgeUniv. Press. 525 pp.
Dutton, J. A. 1976. The Ceaseless Wind. NewYork : McGraw-Hill. 579 pp.
Eagleman, J. R., Lin, W. C. 1977. Severethunderstorm internal structure fromdual-Doppler radar measurements. J.Appl. Meteorol. 16:1036-48
Fankhauser, J. C. 1971. Thunderstorm-environment interactions determined fromaircraft and radar observations. Mon.Weather Rev. 99 : 17142
Fujita, T., Grandoso, H. 1968. Split of athunderstorm into anticyclonic and cy-clonic storms and their motion as deter-mined from numerical model experiments.J~ Atmos. Sci. 25 : 416-39
Gal-Chen, T. 1978. A method for the ini-tialization of the anelastic equations : im-plications for matching models with ob-servations. Mon. Weather Rev. 106 : 587-6O6
Hammond, G. R. 1967. Study of a left mov-ing thunderstorm of 23 April 1964. ESSATech. Memo. IERTM-NSSL 31, Natl.Severe Storms La.b., Norman, Okla. 75 pp.
Hane, C. E., Scott, B. C. 1978. Tempera-ture and pressure perturbations withinconvective clouds derived from detailedair motion. Preliminary testing. Mon.Weather Rev. 106 : 654~51
Hitschfeld, W. 1960. The motion and erosionof convective storms in severe verticalwind shear. J. Meteorol. 17:270-82
Houze, R. A. Jr., Hobbs, P. V. 1982. Or-ganization and structure of precipitatingcloud systems. Adv. Geophys. 24 : 225-315
Kessler, E., ed. 1985. Thunderstorm Mor-phology and Dynamics. Norman: Univ.Okla. Press. 411 pp. 2nd ed.
Klemp, J. B., Rotunno, R. 1983. A studyof the tornadic region within a supercellthunderstorm. J. Atmos. Sci. 40:359-77
Klemp, J. B., Weisman, M. L. 1983. Thedependence of convective precipitationpatterns on vertical wind shear. Preprints,Conf Radar Meteorol., 21st, pp. 44-49.Boston : Am. Meteorol. Soc.
Klemp, J. B., Wilhelmson, R. B. 1978. Simu-lations of right- and left-moving stormsproduced through storm splitting. J.Atmos. Sci. 35 : 1097-1110
Klemp, J. B., Wilhelmson, R. B., Ray, P. S.
www.annualreviews.org/aronlineAnnual Reviews
Ann
u. R
ev. F
luid
Mec
h. 1
987.
19:3
69-4
02. D
ownl
oade
d fr
om a
rjou
rnal
s.an
nual
revi
ews.
org
by O
ntar
io C
ounc
il of
Uni
vers
ities
Lib
rari
es o
n 01
/30/
09. F
or p
erso
nal u
se o
nly.
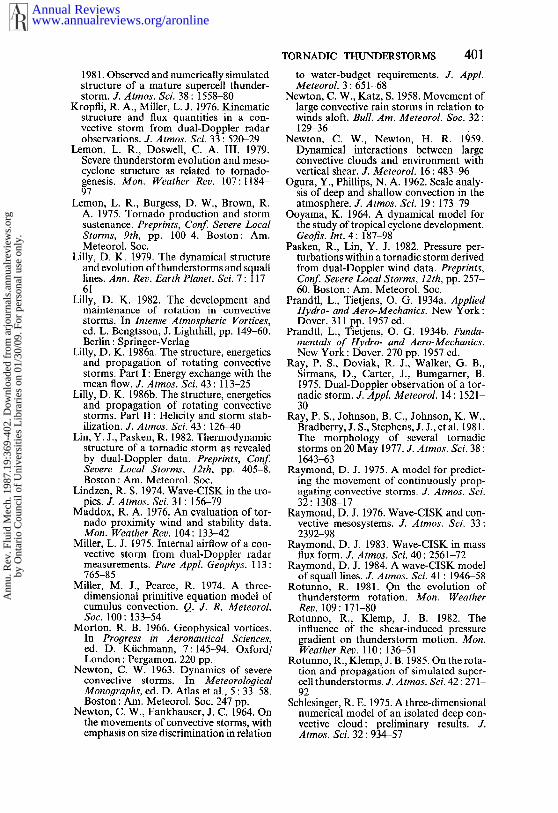
1981. Observed and numerically simulatedstructure of a mature supercell thunder-storm. J. Atmos. Sci. 38:1558-80
Kropfli, R. A., Miller, L. J. 1976. Kincmaticstructure and flux quantities in a con-vective storm from dual-Doppler radarobservations. J. Atmos. Sci. 33:520-29
Lemon, L. R., Doswell, C. A. III. 1979.Severe thunderstorm evolution and meso-cyclone structure as related to tornado-genesis. Mon. Weather Rev. 107: 1184-97
Lemon, L. R., Burgess, D. W., Brown, R.A. 1975, Tornado production and stormsustenance. Preprints, Conf Severe LocalStorms, 9th, pp. 100~4. Boston: Am.Meteorol. Soe.
Lilly, D. K. 1979. The dynamical structureand evolution of thunderstorms and squalllines. Ann. Rev. Earth Planet. Sci. 7 : 11261
Lilly, D. K. 1982. The development andmaintenance of rotation in convectivestorms. In Intense Atmospheric Vortices,ed. L. Bengtsson, J. Lighthill, pp. 149~50.Berlin : Springer-Vcrlag
Lilly, D. K. 1986a. The structure, energetiesand propagation of rotating convectivestorms. Part I : Energy exchange with themean flow. J. Atmos. Sci. 43 : 113-25
Lilly, D. K. 1986b. The structure, energeticsand propagation of rotating convectivestorms. Part II: Helicity and storm stab-ilization. J. Atmos. Sci. 43 : 126-40
Lin, Y. J., Pasken, R. 1982. Thermodynamicstructure of a tornadic storm as revealedby dual-Doppler data. Preprints, Conf.Severe Local Storms, 12th, pp. 405-8.Boston : Am. Meteorol. Soc.
Lindzen, R. S. 1974. Wave-CISK in the tro-pics. J. Atmos. Sci. 31 : 156-79
Maddox, R. A. 1976. An evaluation of tor-nado proximity wind and stability data.Mon. Weather Rev. 104:133~12
Miller, L. J. 1975. Internal airflow of a con-vective storm frown dual-Doppler radarmeasurements. Pure Appl. Geophys. 113:765-85
Miller, M. J., Pearce, R. 1974. A three-dimensional primitive equation model ofcumulus convection. Q. ,I. R. Meteorol.Soc. 100:133-54
Morton, R. B. 1966. Geophysical vortices.In Progress in Aeronautical Sciences,ed. D. Kiichmann, 7: 145-94. Oxford/London : Pergamon. 220 pp.
Newton, C. W. 1963. Dynamics of severeconvective storms. In MeteorologicalMonographs, ed. D. Atlas et al., 5 : 33-58.Boston : Am. Meteorol. Soc. 247 pp.
Newton, C. W., Fankhauser, J. C. 1964. Onthe movements of convective storms, withemphasis on size discrimination in relation
TORNADIC THUNDERSTORMS 401to water-budget requirements. J. Appl.Meteorol. 3 : 651-68
Newton, C. W., Katz, S. 1958. Movement oflarge convective rain storms in relation towinds aloft. Bull. Am. Meteorol. Soc. 32:129-36
Newton, C. W., Newton, H. R. 1959.Dynamical interactions between largeconvective clouds and environment withvertical shear. J. Meteorol. 16 : 483-96
Ogura, Y., Phillips, N. A. 1962. Scale analy-sis of deep and shallow convection in theatmosphere. J. Atmos. Sci. 19 : 173-79
Ooyama, K. 1964. A dynamical model forthe study of tropical cyclone development.Geofis. Int. 4:187 98
Pasken, R., Lin, ¥. J. 1982. Pressure per-turbations within a tornadic storm derivedfrom dual-Doppler wind data. Preprints,Conf Severe Local Storms, 12th, pp. 257-60. Boston: Am. Meteorol. Soc.
Prandtl, L., Tietjens, O. G. 1934a. AppliedHydro- and Aero-Mechanics. New York:Dover. 311 pp. 1957 ed.
Prandtl, L., Tietjens, O. G. 1934b. Funda-mentals of Hydro- and Aero-Mechanics.New York : Dover. 270 pp. 1957 ed.
Ray, P. S., Doviak, R. J., Walker, G. B.,Sirmans, D., Carter, J., Bumgarner, B.1975. Dual-Doppler observation of a tor-nadic storm. J. Appl. Meteorol. 14: 1521-3O
Ray, P. S., Johnson, B. C., Johnson, K. W.,Bradberry, J. S., Stephens, J. J., et al. 1981.The morphology of several tornadicstorms on 20 May 1977. J. Atrnos. Sci. 38 :1643-63
Raymond, D. J. 1975. A model for predict-ing the movement of continuously prop-agating convective storms. J. Atmos. Sei.32:1308-17
Raymond, D. J. 1976. Wave-CISK and con-vective mesosystems. J. Atmos. Sci. 33:2392-98
Raymond, D. J. 1983. Wave-CISK in massflux form. J. Atmos. Sci. 40:2561-72
Raymond, D. J. 1984. A wave-CISK modelof squall lines. J. Atmos. Sci. 41 : 194658
Rotunno, R. 1981. Qn the evolution ofthunderstorm rotation. Mon. WeatherRev. 109:171-80
Rotunno, R., Klemp, J. B. 1982. Theinfluence of the shear-induced pressuregradient on thunderstorm motion. Mon.Weather Rev. 110 : 136-51
Rotunno, R., Klemp, J. B. 1985. On the rota-tion and propagation of simulated super-cell thunderstorms. J..4 tmos. Sci. 42 : 27192
Schlesinger, R. E. 1975. A three-dimensionalnumerical model of an isolated deep con-vective cloud: preliminary results. J.Atmos. Sci. 32:934-57
www.annualreviews.org/aronlineAnnual Reviews
Ann
u. R
ev. F
luid
Mec
h. 1
987.
19:3
69-4
02. D
ownl
oade
d fr
om a
rjou
rnal
s.an
nual
revi
ews.
org
by O
ntar
io C
ounc
il of
Uni
vers
ities
Lib
rari
es o
n 01
/30/
09. F
or p
erso
nal u
se o
nly.

402 r:t~E~,Schlesinger, R. E. 1980. A three-dimensional
numerical model of an isolated deepthunderstorm. Part II : Dynamics of up-draft splitting and mesovortex coupletevolution. J. Atmos. Sci. 37 : 395-420
Thorpe, A. J., Miller, M. J. 1978. Numericalsimulations showing the role of the down-draught in cumulonimbus motion andsplitting. Q. J. R. Meteorol. Soc. 104:873-93
Weaver, J. F., Nelson, S. P. 1982. Multiscaleaspects of thunderstorm gust fronts andtheir effects on subsequent storm devel-opment. Mon. Weather Rev. 110 : 707-18
Weisman, M. L., Klemp, J. B. 1982. Thedependence of numerically simulated con-vective storms on vertical wind shear and
buoyancy. Mon. Weather Rev. 1 I0 : 504-2O
Weisman, M. L., Klemp, J. B. 1984. Thestructure and classification of numericallysimulated convective storms in direction-ally varying wind shears. Mon. WeatherRev. 112 : 2479-98
Wilhelmson, R. B. 1974. The life cycle of athunderstorm in three dimensions. J.Atmos. Sci. 31 : 1629-51
Wilhelmson, R. B., Klemp, J. B. 1978. Athree-dimensional numerical simulationof splitting that leads to long-lived storms.J. Atmos. Sci. 35 : 1037~53
Wilhelmson, R. B., Klemp, J. B. 1981. Athree-dimensional numerical simulationof splitting severe storms on 3 April 1964.J. Atmos. Sci. 38:1581-1600
www.annualreviews.org/aronlineAnnual Reviews
Ann
u. R
ev. F
luid
Mec
h. 1
987.
19:3
69-4
02. D
ownl
oade
d fr
om a
rjou
rnal
s.an
nual
revi
ews.
org
by O
ntar
io C
ounc
il of
Uni
vers
ities
Lib
rari
es o
n 01
/30/
09. F
or p
erso
nal u
se o
nly.
Ann
u. R
ev. F
luid
Mec
h. 1
987.
19:3
69-4
02. D
ownl
oade
d fr
om a
rjou
rnal
s.an
nual
revi
ews.
org
by O
ntar
io C
ounc
il of
Uni
vers
ities
Lib
rari
es o
n 01
/30/
09. F
or p
erso
nal u
se o
nly.