Embed Size (px)
Citation preview

EARTHQUAKE HAZARD EVALUATION IN THE PACIFIC NORTHWEST
Robert S. Crosson
Geophysics Program AK-50 University of Washington
Seattle, Washington 98195
USGS CONTRACT NO. 14-08-0001-16723 Supported by the EARTHQUAKE HAZARDS REDUCTION PROGRAM
OPEN-FILE NO. 81-965
U.S. Geological Survey OPEN FILE REPORT
This report was prepared under contract to the U.S. Geological Survey and has not been reviewed for conformity with USGS editorial standards and stratigraphic nomenclature. Opinions and conclusions expressed herein do not necessarily represent those of the USGS. Any use of trade names is for descriptive purposes only and does not imply endorsement by the USGS.

TABLE OF CONTENTS
Introduction ....................
Network Operation ...............
Seismicity and Earthquake Hazards
Digital Data Acquisition ........
Special Studies .................
Summary and Recommendations .....
Appendix
A. Seismic aspects of St. Helens eruption ...........
B. Review of seismicity of the Puget Sound
region from 1970 to 1978 .........................
C. Compilation of earthquake hypocenters for western
Washington - 1978 ................................
D. The magnitude 4.6 south Puget Sound earthquake of
March 11, 1978: Main shock and aftershocks .......
E. Reports and Publications .........................

Introduction
This report covers the contract year October 1, 1979 through September
30, 1980 for contract number 14-08-0001-16723, "Earthquake Hazard Studies in
the Pacific Northwest". As the final report under this contract, we will
briefly summarize the accomplishments and present status of this research over
the last three years. Support under this contract covered operation of the
western Washington seismograph network and earthquake hazard related studies
resulting from the network operation. A major aspect of this project is the
establishment of an accurate and complete data base of instrumentally observed
and located earthquakes in western Washington. Most of the resources of this
project go to support network operation and routine data reduction.
In the past three years, the network supported by this project has grown
to 23 stations regionally covering the western part of the State of
Washington. In addition, other projects have supported the installation of
stations near Mt. St. Helens, on the Olympic Peninsula, and in the south
Cascade range. A clear regional pattern of seismicity has been identified
which places some general constraints on seismic hazard evaluation. The most
significant geophysical event of this entire period has obviously been the
eruption of Mt. St. Helens. The network proved invaluable in the earliest
identification of seismicity relates to that eruption, the only clear
preliminary warning of the impending events. Subsequently, the regional
network has formed the stable backbone of monitoring efforts, supplemented by
additional temporary and permanent network stations. Since the St. Helens
eruptions, much of our workload has been dominated by the requirements of the
volcano monitoring effort. Nevertheless, a number of additional activities are
being carried out or completed. These include the preparation and publication

of yearly summary bulletins, the routine operation and maintenance of field
stations, development of the digital on-line data recording system,
preparation of routine reports, investigation of more significant earthquakes,
and additional special research tasks. In the three year contract period, we
have completed hypocenter bulletin summaries through 1978, completed
development and installation of the digital on-line data acquisition system,
added several new stations, completed investigation of a significant Puget
Sound earthquake in 1978, prepared a preliminary report on Mt. St. Helens
seismicity and eruption, prepared and co-hosted a conference on Puget Sound
seismic hazards, and developed a method for efficiently computing travel times
in earth models with laterally varying velocity structure. The St. Helens
eruption sequence and subsequent seismic activity have amply demonstrated the
importance and utility of the regional network. Supplementation of this
network with stations in the south Cascade range, near Mt. St. Helens, and on
the Olympic Peninsula along with stations in eastern Washington now provide a
statewide coverage for earthquake studies never previously achieved.
Network Operation
Generally, stable operation of the network continued through this report
period. With the increase in earthquake activity near Mt. St. Helens, four
additional stations were planned for the regional network in the southwest
part of the State. Two of those stations were installed in this report period.
A program of recyclying seismometers which have been in the field for extended
time periods was initiated. Implementation of full triggered digital network
recording on our DEC 11/34 and 11/70 computer systems was accomplished during
this report period. Much effort funded by this and several other projects has
been expended in achieving this goal. Digital recording has substantially

improved the time resolution available for phase picking. In addition, it has
opened up new avenues of research including the possibility of applying a
variety of signal analysis techniques to learn more about the sources of local
earthquakes and to automatically discriminate event types and and pick phases.
Seismicitv and Earthquake Hazards
The Mt. St. Helens eruption has produced in excess of 10,000 locatable
earthquakes. This large number coming in so short a period of time, has
produced a data handling problem of sizable proportions, setting back our
schedule of processing of regional earthquakes. Data for 1979 are in the
process of final verification and 1980 data are complete except for the 2nd
quarter eruption period. As of 1980, we plan to produce a statewide bulletin
based on uniform processing. Regional velocity models must be used for various
parts of the network.
Mt. St. Helens seismicity has been monitored closely and has in fact
proved to be a valuable short-term predictor for volcanic eruptions. Detailed
reports on the eruption behavior and seismicity of St. Helens are being
prepared under other project support and will not be considered here. However,
Appendix A is a reproduction of a preliminary article on seismic aspects of
the eruption published in Nature magazine.
A good understanding of regional seismicity has been obtained by
reviewing over eight years of network data from western Washington. On a large
scale, the most intense small earthquake activity is roughly coincident with
the Puget Sound depression, extending northward to the Strait of Georgia and
terminating southward at about the southern limit of Fuget Sound. The most
significant finding, having significance for earthquake hazards, is the

division of hypocenters into shallow and deep suites. The deep suite forms a
rather uniform planar surface dipping about 15 degrees in a northwesterly
direction. These earthquakes appear to provide indirect evidence of a dipping
lithospheric slab beneath Puget Sound, although they do not appear to be
directly caused by slip on a thrust surface. A quiet zone between 30 and 40 km
depths beneath Puget Sound separates the deep suite from a highly populated
shallow suite of earthquakes. Many characteristics of the shallow suite are
significantly different from the deep suite suggesting the conclusion that the
causes of these two suites are fundamentally different. Appendix 5 summarizes
a report prepared for the Fall 1980 Puget Sound earthquake hazards conference.
In this Appendix, some of the implications for earthquake hazards are stated.
We have completed analysis of a main shock-aftershock sequence which
occurred in March of 1978 in the south Puget Sound basin. The aftershock zone,
though small, is in approximate agreement with a dominantly strike-slip focal
mechanism suggesting a N20W right lateral fault surface. There is no known
fault upon which this earthquake can be placed. The results of our
investigation are summarized in a manuscript reproduced in Appendix D.
Finally, an enhanced 1978 bulletin for western Washington was published
by the State Department of Natural Resources. Because this bulletin contains
some new material,it is reproduced and included as Appendix C of this report.
Digital Data Acquisition
A major effort has taken place in developing the digital data
acquisition capability for our statewide network. This effort has been shared
between several projects. The St. Helens activity has forced us to enhance
this capability at a faster rate than otherwise might have been the case. The

result is that we now have full on-line recording capability and interactive
high-speed graphics terminal picking and preliminary processing of the data.
We continue to operate two Develocorders under this project at half-speed.
This has proved necessary as a backup system and also to ensure that we
acquire certain important pieces of data such as coda durations which are
still truncated by the digital system. Also, we continue to have problems from
time-to-time with missed events on the digital system and the film ensures
that we do not lose data in such instances. We are continually working on
correcting all known bugs in the digital system.
Special Studies
With the advent of digital recording, progress in seismology will
involve taking increasing advantage of the information in the complete
seismograra. A basic requirement is for machine identification of various
classes of transient events, for example explosions vs. 'tectonic 1
earthquakes, or transient telemetry noise vs. seismic events. We have
initiated a project to investigate the utility of linear predictive filtering
and pattern recognition to discriminate between various classes of seismic
events. The study is being carried out by Duane Hesser. This research is
stimulated by success in applying similar theories to the problem of speech
recognition both analysis and synthesis of speech.
An interesting set of two long-term swarms occurred between 1970 and
1975 near Seattle. These have never been studied in detail so we have started
a project, being carried out by Tom Yelin, to look carefully at the time
history, locations, magnitude characteristics, and focal mechanisms of these
earthquakes.

Finally, we are preparing a review of Mt. St. Helens seismicity, and
that of the other Cascade volcanoes Mt. Rainier and Mt. Baker, based on alomst
8 years of Develocorder film records.
Summary and Recommendations
The contract period of the last three years has been one of significant
change as well as consolidation of previous gains. The broad features of
regional seismicity are fairly clear and the separation of earthquakes into
deep and shallow zones has been a major finding, of considerable importance
for earthquake hazard related studies. The eruption of Mt. St. Helens has
dominated the second half of the current contract report period, and has
stimulated substantial growth of the network effort in Washington. A period of
consolidation is now required to complete reports of our current findings,
complete processing of data which was delayed by the heavy burden of St.
Helens activity, to solve many minor operational problems related to the rapid
growth of the statewide network and switch to digital data acquisition, to
further explore the implications of the St. Helens eruption and to complete
integration of our statewide network operation.

APPENDIX A
Seismic Aspects of the Mt. St. Helens Eruption

Reprinted from Nature. Vol. 285, No. 5766, pp. 529-536, June 19 1980 © Macmillan Journals Ltd., 1980
Eruption of Mt. St. Helens:
Seismologyfrom the Geophysics Program*, University of Washington
ON May 18,1980 at 0832 local time a major geological event occurred with the cataclysmic eruption of Mt. St. Helens in Washington's Cascade Range. The erup tion followed two months of intense seismic activity, surface deformation, and sporadic, but minor steam and ash eruptions. These geophysical and geolo gical precursors signaled the reawakening of the volcano after a period of quiescence since activity was last recorded in 1856 (Crandell & Mullineaux Science 187, 438; 1975; Crandell & Mullineaux, US Geol. Survey Bull. 1383-c, 25p; 1978).
The cataclysmic explosions of May 18 caused an estimated $2 billion or more in damage, although the volcano lies in a relatively remote area. The cost in human life has been substantial with 22 confirmed dead and 60 to 70 still missing at the time of writing. A large sector of the north and northeast side of the mountain was devastated by pyroclastic flows, mudflows and tephra fallout. The direct blast from the explosions leveled entire forested areas on the north side; the affected area is estimated to be 400 km2 . Two river systems with sources near the mountain have been extensively altered by mudflows and flooding. The morphology of the volcano has drastically changed from a nearly symmetrical cone to an assymmetric edifice approximately 400 m lower in height, although much of the south and west sides of the volcano remain relatively untouched by the explosion.
Seismic activity was the first indication of the reawakening of Mt. St. Helens, beginning abruptly with an earthquake of magnitude 4 at 1547 local time on March 20, 1980. This earthquake was located just north of the summit by the regional
seismograph network which included one station 3.5 km west of the summit. Since this was the largest earthquake recorded in the southern Washington Cascade range during seven years of instrumental observations, an aftershock study was begun on March 21 in an effort to examine seismo-tectonic processes near Mt. St. Helens. To improve the seismic coverage in the area, three portable seismic recorders were installed within 15 km of the summit, and a second telemetered station was added to the permanent network 35 km northeast of the epicenter.
A rapid increase in the number of small shocks made it clear that an unusual earthquake sequence was beginning at Mt. St. Helens. The initial aftershock activity failed to follow the usual decay in the number of events with time, and on March 22 a second magnitude 4 earthquake occurred in the same region. By March 24, additional earthquakes larger than magnitude 4 had occurred and the general seismicity increased to the point that a volcanic mechanism was required to
*The seismic monitoring of Mt. St. Helens has involved a large number of individuals, many of them students and staff of the University of Washington Geophysics Program. This preliminary, descriptive report was compiled by the folio wing people, listed alphabetically: R. S. Crosson, E. T. Endo, S.D. Malone, L.J. Noson, and C.S. Weaver. Crosson is a Professor of Geophysics, Malone is a Senior Associate, and Noson is a network seismologist, all with the University of Washington. Endo and Weaver are geophysicists with the US Geological Survey, Menlo Park, California, and both are currently on assignment in Seattle. Significant contributions to the seismic monitoring were made by J.M. Coakley and E.E. Criley (both USGS) and by J.W. Ramey and E.H. Wildermuth (both UW).
explain the concentrated, high rates of seismicity. Additional temporary seismo graph stations were installed to provide data adequate for obtaining accurate hypocenter locations in the hope that careful tracking of the hypocenters would increase our overall ability to monitor the volcanic hazard. Twenty four hour observation of the seismographic records began on March 24, and this effort has continued to the present as part of the hazard warning effort. A final, dramatic increase of seismic activity occurred on March 25, when the rate of seismicity reached its peak. Seismic stations within 8 km of the summit were continuously saturated, and individual earthquakes could no longer be distinguished from background seismic levels. More distant stations were used to resolve individual earthquakes for determining occurrence rates, magnitudes, and other earthquake parameters.
On March 27, two days after the seis micity peak, the first steam eruption occurred at 1236 local time. Moderate steam and ash eruptions continued for the next few weeks, declining in frequency until by April 23 only occasional small steam bursts were observed. On May 8 steam and ash eruptions resumed, occurring periodically for several days. Between May 14 and the cataclysmic eruption on May 18 there was only minor eruptive activity.
As the seismic energy release beneath St. Helens occurred at a high rate, count statistics for the whole episode have been kept only for earthquakes exceeding magnitude 3.2. After reaching a peak of 8 to 10 earthquakes per hour at this magnitude threshold during the evening of

53CT
March 25, the rate of activity declined irregularly until the explosive event of May 18. Figure 1 shows a smoothed curve of the rate of occurrence against time. The rate of seismic energy release generally follows the count curve although the decrease is not as great. This reflects the fact that large earthquakes continued at a slightly increasing rate during April and May, while the smaller events declined in frequency. Earthquakes larger than magnitude 4 occurred at an average rate of 5 per day in early April and 8 per day during the week preceding May 18, while the number of events larger than magnitude 3 went from 77 per day to 28 per day during the same period. The largest earthquakes recorded were approximately magnitude 5
and occurred late in the sequence. We estimate the total seismic energy release to date to be equivalent to a single magnitude 6.7 earthquake.
Several periods of harmonic tremor were observed. Normally, a nearly mono chromatic 1 Hz signal, lasting from a few minutes to half an hour, was observed on stations within 30 km of the mountain. In several cases these signals were large enough to be observed on seismic stations 250 km distant. There was no apparent correlation of these monochromatic tremor periods and eruptions or unusual earthquake activity. During the intense earthquake activity of March 25-26 harmonic tremor would have been completely masked by the earthquake signals.
By May 1, a total of 15 seismograph stations were operating within a radius of 32 km of the summit. The station distribution is excellent for control of hypocenter coordinates though the velocity model is still poorly known for the immediate area. Virtually all of the earthquakes occurred in an area of 5 km radius centered approximately 2 km directly north of the summit crater (Figure 2). Depths ranged from 0 to about 5 km with a few events possibly as deep as 10 km beneath the average topographic surface.
Mapof epicenters above approximately 3.2 for period May I, 1980 to May 18, 1980. Epicenters are open circles, seismograph stations are solid triangles, and bodies of water are shaded. Tree- lines and rivers are drawn. Dark area is epicenter cluster centered 2 km north of the summit.
At this preliminary stage of investigation, we have not been able to obtain good depth measurements of very shallow earthquakes, but it seems probable that many moderate earthquakes (magnitudes 3 to 4) occurred at shallow depths near the base of the volcanic edifice or up in the cone itself.
The blast of May 18 was not preceded by any anomalous seismic activity on a time scale of hours to days. At 0832 local time, an earthquake occurred at a depth of 3 km beneath the volcano. This event may have triggered a landslide off the north side of the mountain which led immediately to the explosion. The details of the explosion and
its relation to the earthquake and landslide have not yet been worked out. A standard Wood-Anderson seismograph in Seattle recorded a magnitude 5.1 event at this time though the signals are more complicated than expected for a single earthquake. After the initial seismic event was over (it lasted for over 8 minutes) the earthquake activity dropped back to a level of only one or two discrete events per minute. This period of relative quiesence lasted for over three hours when both the earthquake activity and volcanic tremor increased. There was a steady increase in the level of seismic activity from 1140 PDT until 1530
Earthquake occurrence rate against time for the Mt. St. Helens eruptive sequence.
Large ash and
Cataclysmic pumice eruotion eruption
Period of no steam and ash eruptions
20 25 MARCH

531
PDT when all seismic stations within 100 km were completely saturated and strong tremor was recorded 250 km away. Around 1730 PDT the tremor and earthquake activity abruptly diminished.
Since May 18 the earthquake activity dramatically declined until by the end of May there were only a few small earthquakes per day in the vicinity of the mountain. There was a moderate earthquake swarm coincident with an ash eruption on May 25. Low amplitude seismic noise, often with tremor-like characteristics, has been recorded nearly continuously since the May 18 eruption; although the noise is usually only monitored on the two stations still operating on the flanks of the mountain.
Comparison of the St. Helens sequence with the eruptive behaviour of other volcanoes may yield clues to the physical processes involved and to the predictable aspects of these processes. A particularly interesting example is the eruption of the Kamchatka volcano Bezymianny in 1956 (Gorshkov Bull. Volcan. 20, 77; 1959). This volcano went through a cycle remarkably similar to that of Mt. St. Helens: a) a period of almost one month of volcanic earthquakes, b) strong ash eruptions lasting over one month, c) a stage of moderately declining activity lasting nearly 3 months, d) a gigantic explosion approximately six months after initial activity, and e) a post-eruptive stage of about six months of declining but sporadic activity. Except for the time table which is longer and the fact that earthquakes were estimated to be of greater depth (up to 50 km) in the case of Bezymianny, these two volcanic histories are sufficiently similar to suggest the possibility that a moderately predictable process is involved. The explosion of Bezymianny was in fact accompanied by a strong earthquake although the exact time sequence is not as well known as at Mt. St. Helens. The resultant craters of the two volcanoes are also very similar in size and shape.
Our preliminary conclusions are that seismicity provides an intermediate term warning of explosive volcanic hazard (scale of weeks to months) but no apparent short term warning (hours to days). The rate processes which may be extracted from the seismic data such as the strain energy release rate may be valuable in establishing the overall magma injection characteristics and other variables in the volcanic cycle when a sufficiently good understanding of the physical processes is available. Other measurements such as ground deformation must be made to provide basic information upon which to model the entire process. Unfortunately, it is still not clear that reliable short term prediction is feasible. Considering the wealth of seismic data that we have obtained, along with the variety of other observations made on Mt. St. Helens, a unique opportunity exists to probe the inner workings of an explosive volcano. D
Volcsmologyfrom Robert L. Christiansen*
THE explosive eruption of Mount St. Helens completely destroyed its north flank, opening a crater 1.5 km wide, and producing an eruption cloud that deposited a blanket of ash over a large area of the northwestern United States. The eruption, the culmination of a series of seismic and eruptive events that began in late March, was notable for the rapidity with which activity began and progressed and for the magnitude of energy released, both seismically and eruptively. Although further eruptions (including the eruption of lava into the volcano's crater) are likely, it seems probable that the greatest energy release occurred within two months of the initial earthquake of the sequence.
Activity began with a single shock of magnitude4 on Marcn 20and grew within 5 days to a swarm in which magnitude 4 + earthquakes occurred at a rate of more than 8 per hour. An interesting decrease in seismicity (although to rates including more than 5 earthquakes of magnitudes 4 -f per day high by any ordinary standard) occurred during the day and a
half before the first eruption, which was a crater-forming burst beginning at 1238 on March 27.
After a pause until about 0300 the following morning, the volcano erupted again, this time for a sustained period of nearly two hours. Similar eruptions continued for the following four days, with both short, essentially single-burst eruptions and sustained longer eruptions. The eruptions were all probably steam- generated and produced only lithic-crystal ash that apparently was derived by shallow explosions within a 350-year old summit dome. A moderate amount of this ash was distributed 50 km away and some was reported as far as 100 km to the east, but most of it fell within 5-20 km of the volcano's summit.
Phreatic eruptions continued after April 1 but were mainly of short duration and occurred at successively longer intervals. They ceased temporarily after a small eruption that produced ash on the volcano's upper flank on the morning of April 22. Up to that time the summit crater,
The new crater formed by the explosive eruption.

REVIEW OF SEISMICITY IN THE PUGET
SOUND REGION FROM 1970 THROUGH 19?8
Robert S. Crosson
Brief Summary
October, 1980

APPENDIX B
Review of seismicity of Puget Sound region, 1970-78

In an attempt to improve our knowledge of earth
quake hazards in the Puget Sound region, earthquakes
recorded with the western Washington regional seismo
graph network from 1970 through 1978 were reviewed. The
most obvious characteristic of the spatial distribution
of earthquakes is the diffuse zone of high seismicity
in the central Puget Sound region. Within this central
basin distribution, several clusters of earthquakes
exist which are either long term swarms, aftershock
sequences, or just persistent source zones (Figure 1).
An apparent epicenter lineation passes through the south
west corner of the central basin earthquake zone. This
lineation is due mainly to small earthquakes (M < 2) and
its significance remains uncertain.
A significant division of earthquakes into shallow
and deep suites (Figure 2) is based on spatial separation,
energy release statistics, and b_ value determinations as
well as focal mechanism evidence (Figures 3, 4, 5, 6, and
7). The deep suite forms a sub-planar zone which dips at
an azimuth of about 60° between the depths of 40 and 70 km
(Figure 8). This group of earthquakes may be subduction
related although the focal mechanisms and spatial dis
tribution do not yield simple interpretations.
Central basin earthquakes of the shallow suite have
a bi-modal depth distribution (Figure 9) 5 influenced to

an extent by the existence of swarms. This bi-modal
distribution is not so clearly apparent in the energy
release distribution. However, both energy release and
occurrence rate are maximum in the interval from 20 to
25 km depths for the shallow suite.
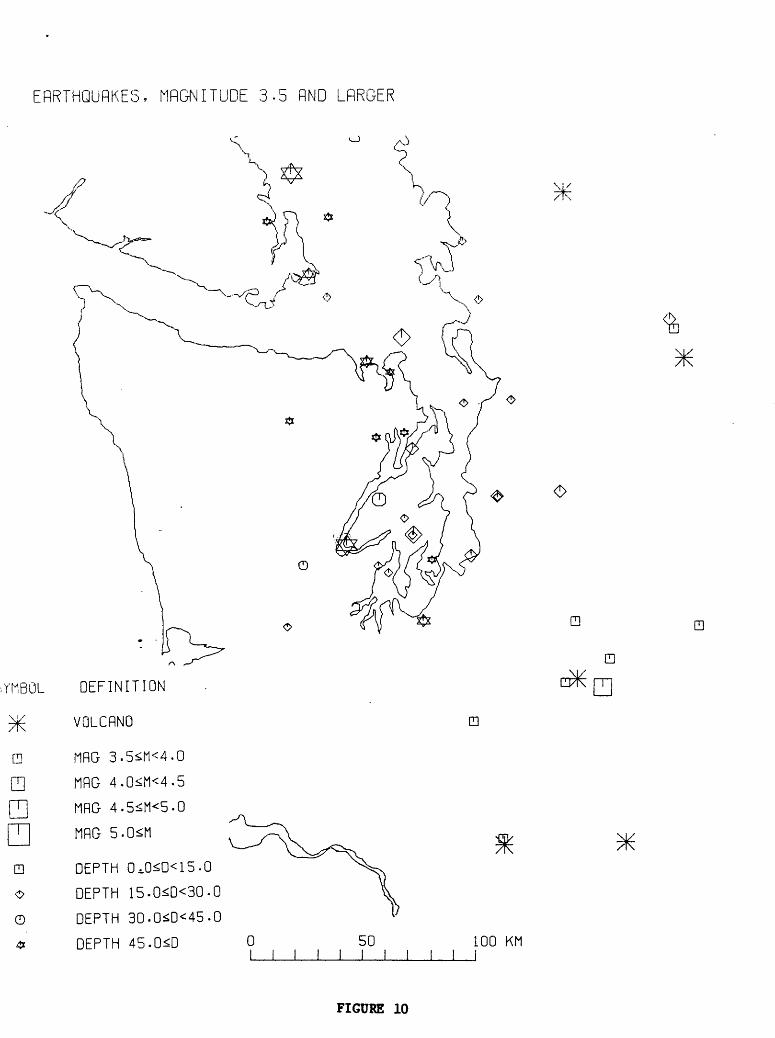
Earthquakes above magnitude 4 are confined largely to
the central Puget Sound basin and north to the Strait of
Georgia, with a distinct preference for the deepest earth
quakes to be on the west side of Puget Sound (Figure 10).
Magnitude statistics indicate that the deep suite of
earthquakes appears to have a significantly lower b_ value
than the region as a whole, indicating a population
enriched in larger magnitude earthquakes. It is obviously
dangerous to extrapolate directly to large magnitude earth
quakes (magnitude 6 and 7) but evidence to date indicates
that potentially destructive Puget Sound earthquakes
occur in the zone from 40 to 70 km depths.
A suitable regional tectonic model has still not
emerged from these data. The seismically quiet zone from
30 to 40 km depths beneath Puget Sound could well repre
sent a weak stress decoupling between shallow and deep
parts of the lithosphere, possibly where shear strain rates
due to subduction are highest. Among the major problems
facing us are the better resolution of the vertical and
lateral crustal seismic velocity distribution, explanation
of the localization of both shallow and deep seismicity

beneath Puget Sound, and the establishment of direct
evidence for or against continued subduction beneath
western Washington.

Figure 1. Epicenters of all earthquakes with depthsless than 35 km, 1970-78.
Figure 2. Epicenters of all earthquakes with depths35 km or greater, 1970-78.
Figure 3. Depth distributions for number of earthquakes(dots) and cumulative energy release (solid) for all earthquakes, 1970-78.
Figure 4. Recurrence curve for all earthquakes shallowerthan 35 km, 1970-78.
Figure 5. Recurrence curve for all earthquakes 35 kmor deeper, 1970-78.
Figure 6. Lower hemisphere, equal area plot of distri bution of tectonic compressional axes (P) and tensional axes (T) determined from focal mechanisms of magnitude 3 and above earthquakes with depths greater than 35 km.
Figure 7. Same as Figure 6, except for earthquakes inshallow suite above 35 km depth.
Figure 8. Cross-section projecting all hypocentersinto a plane which strikes at an azimuth of 60 degrees. Total aperture width for projection is 300 km. The center of the projection is at 47°30'N arid 122°30 T W. Includes earthquakes from 1970-78 magni tudes 2.0 or greater.
Figure 9. Depth-count histogram of central basin earth quakes only. All events from 1970-78.
Figure 10. Epicenters of earthquakes of magnitude 3-5and greater, with symbols showing depth ranges and symbol sizes showing magni tude ranges. Earthquakes from 1970-78.

flLL ERRTHQUfiKES -LT.35 KM DEPTH, 1970-78
O
50 100 KM
FIGURE 1

RLL ERRTHQUflKES -GE-35 KM DEPTH, 1970-78
o
50 100 KM
FIGURE 2

LOG |0(ERGS) (SOLID)
13 14 15 16 17 18 19 20 21
10
i I i ( ± T I T
Q_LU Q
20
30
40
50
60
70
J
0 100 200 300 400
NUMBER OF EVENTS (DOTS)
FIGURE 5

SH
ALL
OW
ER
T
HA
N
35
KM
iLJ
Q LLJ o C
D
CO
LU ID o X h-
cr
<
LJ
01.
02.0
3.0
4
.0
5-0
MA
GN
ITU
DE
6.0
7.0
8.0
FIG
UR
E 4

DE
EP
ER
T
HA
N
35
KM
01
-02.0
3.0
4.0
5
.0
MA
GN
ITU
DE
6.0
7.0
8.0
FIG
UR
E 5

1974-78; MAG ,GE, 3,0; DEPTHS ,GT, 35 KM
N
T P
P
P
T
T
P
TT
T T
pT
TT
T
LOWER HEMISHPERE; EQUAL ANGLE
T
FIGURE 6

1974-78; MAG ,GE, 3,0; DEPTHS ,LE. 35
N
p
p
T T
T
TT
TT
T
IT T
LOWER HEMISPHERE; EQUAL ANGLE
P
FIGURE 7

X -
SE
CTI
ON
, R
LL
QUR
KES
-GE
. M
flG 2
-0,
flPER
TUR
E 30
0 KM
flZ
IMU
TH
OF
PRO
JEC
TIO
N
= 60
DE
GRE
ESsw
« o
-
*
IK
in
m
jtf*
JL*
» m
*kD
81
= &
*'(
!> r
f58
e o*
00?
*_i
NE
00
'Cg
(JDO
O
GO
0
^0
fi
w,
fel
*«. ^
ffv.
xwr1
oCX
D o^
« ^f
e2°-
& o
,0^00'
rto°(
9
o o
o o
O
O
(!)
O
_ O
oCD
oC
Do
o O
oo
m o
J3Le
o o
o
RS
O
SN
0
O <
^'
O
O°
O O
^Q
0
O
O *
O
O°
)ft«
OQ
O
0 10
20
30
40
50
60
70
80
90
10
0 KM
10 20 30 40
50
60
70 80
90
KM
FIG
UR
E 8

0 5 10
£15
:ENT
RRL
BRSI
N ER
RTHQ
URKE
S
CL
LJ
Q20 25 30 35
T
: I1
I I
0 10
20
30
40
50
60
70
80
NU
MBE
R
OF
ERR
THQ
UR
KES
90
100
110
120
FIG
UR
E 9
ERRTHQURKES, MAGNITUDE 3-5 RND LflRGER
CD
oG
4*
DEFINITION
VOLCflNO
MRG 3.5<M<4.0
MRG 4.0<M<4.5
MRG 4.5<M<5-0
MRG 5-0<M
DEPTH 0.0<D<15.0
DEPTH 15.0<D<30-0
DEPTH 30.0^D<45.0
DEPTH 45-0<D
CD
a m\ m
50 1 I I
100 KM
FIGURE 10

APPENDIX C
Compilation of Earthquake Hypocenters - 1978

STATE OF WASHINGTON
DEPARTMENT OF NATURAL RESOURCES
BERT L. COLE, Commissioner of Public Lands
RALPH A. BESWICK, Supervisor
DIVISION OF GEOLOGY AND EARTH RESOURCES
VAUGHN E. LIVINGSTON, JR., State Geologist
INFORMATION CIRCULAR 72
COMPILATION OF EARTHQUAKE HYPOCENTERS
IN
WESTERN WASHINGTON-1978
By
LINDA LAWRANCE NOSON
and
ROBERT S. CROSSON
1980
For sale by Department of Natural Resources, Olympia, WashingtonPrice $.50

CONTENTS
Page
Summary ............................................................................. 1
Introduction.......................................................................... 1
Earthquake analysis procedure ................... .-*.................................. 7
Significant events .................................................................... 8
Acknowledgments ..................................................................... 9
References cited ..................................................................... 9
Appendix I - 1978 hypocenter list .................................................... 10
Appendix II - corrections to 1977 list ................................................ 18
ILLUSTRATIONS
Figure 1. Location map for stations operating in 1978 ................................ 2
2. Map showing epicenters for 1978 by magnitude............................. 3
3. Map showing epicenters for events greater than 2.8 magnitude............. 4
4. Map showing epicenters for 1978 by depth ................................. 5
5. Station activity graph ..................................................... 7
TABLES
Table 1. Summary of network station data ........................................... 6

COMPILATION OF EARTHQUAKE HYPOCENTERS
IN
WESTERN WASHINGTON-1978
By
LINDA LAWRANCE NOSON
and-»
ROBERT S. CROSSON
SUMMARY
The Geophysics Program at the University
of Washington operates a continuously recording,
telemetered seismograph network located west of
the Cascade Mountains and centered along the
Puget Sound Lowland. Station locations (fig. 1)
have been chosen to best record earthquakes
in the lower Puget Sound basin, an area of his
torically high seismicity. This report is the
seventh in an annual series designed to provide
a standardized compilation of earthquake loca
tions, determined by using network data.
Locations for 367 earthquakes recorded in 1978
are listed in Appendix I. Machine plotted maps
show the distribution of epicenters by magnitude
(fig. 2) and depth (fig. 4). Figure 3 shows
the distribution of epicenters for events greater
than magnitude 2.8.
The number of events successfully located
each year depends on numerous factors: The
number of stations operating, location of earth
quakes relative to recording stations, earth
quake magnitude, experience of personnel handl
ing data, and of course, the number of earth
quakes that occur in the area monitored. Ignor
ing the inherent variability of the data set may
lead to incorrect interpretations. When used
carefully, the data in this report may enhance
evaluations of seismic hazard potential, as well
as contribute to basic studies in seismology,
earth structure, and tectonics.
INTRODUCTION
The seismograph network operated by the
University of Washington consists of 21 short-
period telemetered seismograph stations and one
on-site recording World Wide Standard Station
at Longmire, Washington (LON). Stations extend
from Mount St. Helens (SHW) at 46° N. latitude
north to Mount Baker (MBW) at 49° N. latitude,
an area approximately 300 km N-S by 150 km
E-W. Each station (except LON) consists of a
single component vertical short-period seismome-

2 EARTHQUAKE HYPOCENTERS
GLACIER PEAK
MT. RAINIER
STATION LOCATIONS 1978MT. ST. HELENS
MTN. CREST
VOLCRNO
STflTIONUNIVERSITY OF WRSHINCTON
GEOPHYSICS PROGRflM
50 100 KM l I I I I i I i
FIGURE 1. Location map for stations operating in 1978,

EPICENTERS BY MAGNITUDE 3
124 122* 121*
UNIVERSITY OF WASHINGTON
GEOPHYSICS PROGRflMI I I I
50 100 KM I I I I I I
WESTERN WASHINGTON EARTHQUAKES - 1978
* MTN. CREST
)K VOLCRNO
O MRG O.OsM<2.0
O MRG 2.0*M<3.0
MRG
FIGURE 2. Map showing epicenters for 1978 by magnitude.

4 EARTHQUAKE HYPOCENTERS
WESTERN WASHINGTONEARTHQUAKES-1978
MAGNITUDES >2.8
UNIVERSITY OF WASHINGTON
GEOPHYSICS PROGRflM
FIGURE 3. Map showing epicenters for events greater than 2.8 magnitude.

EPICENTERS BY DEPTH 5
UNIVERSITY OF WflSHlNGTON
GEOPHYSICS PROGRflM
50 100 KM I I I I I I
WESTERN WASHINGTON EARTHQUAKES-1978
* MTN. CREST
)K VOLCflNO
« DEPTH 30.0*0
Q DEPTH 15.0^D<30.0
CD DEPTH 0.0*D<15.0
FIGURE 4. Map showing epicenters for 1978 by depth (in kilometers).

6 EARTHQUAKE HYPOCENTERS
ter, an amplifier and a voltage-controlled oscil
lator, which converts the output voltage from
each amplifier to a frequency modulated audio
tone capable of being telemetered to the central
recording laboratory at the University of Wash
ington. The first report in this series (Crosson,
1974) contains a description of network instru
mentation, background information, a glossary
of terms, and a compilation of earthquake data
for 1970, 1971, and 1972. In this report, we
provide revised and updated information on
instrumentation and analysis procedures. Table
1 of the second report (Crosson, 1975) shows the
revised crustal velocity structure used in the
determination of earthquake locations compiled
since 1973. Details of the method used to de
termine this velocity structure can be found in
a separate publication (Crosson, 1976a, 1976b).
Station delays, which are also determined with
the model, are reported in the second report
and repeated here in table 1. This table pro
vides a summary of network station information,
including station coordinates, elevations, P-time
corrections (P-delays), and installation dates.
Stations added since the second report have
provisional delays. Compilations of hypocenter
locations for events recorded in 1974, 1975,
1976, and 1977 may be found in Crosson and
Millard (1975), Crosson and Noson (I978a),
Crosson and Noson (1978b), and Crosson and
Noson (1979). Information for larger historic
earthquakes in Washington State from 1840 to
TABLE 1. Summary of network station data
List of NEIS abbreviated stations in western Washington
Sta. LAT Name beg Mn Sec
LON Deg Mn Sec
ELEV Km
P DEL Sec
INSTALL Date
MAG* 1 Hz
LOCATION
SPWGMUGSMBLNCPWBMWJCWFMtfBFWSHWMCWMBWSTWLONHTWLMUSMtfLYWOHWFTWGHWRPW
047047OUTOK 8OH 6OUTOK 8OK 6OK 6046OK 804804804604 T04604T04804804 T04 T048
33321200582T11552911404T09454840193219520226
13.3052.5011.4026.5025,8034.9536.6054.0012.0033.0046.8002.40O.T5
00.0012.5004.8010.20OT.2024.0036.0030.0054.00
122122121122123121121121123122122121123121121122123122122122122121
14474758084855401214495340484617200631121630
45.1010.8040.2018.6410.8019.2046.2019.2053.4012.0056.4058.8012.0036.0008.6528.8030.0006.0054.6005.0021.0049.00
0.0080.5061.3050.585O.T921.0240.6161.8900.9021.4230.6931.6T60.3080.8530.8291.1950.8400.10T0.0540.14T0.2680.850
1,0,0-00-00000000
0
-
.029
.100
.399
.13T
.241
.385
.033
.246
.113
.319
.125
.433
.009
.011
.000*
.200*
.100*
9/1T/692/2T/TO6/11/TOT/2/TOT/29/707/2T/712/18/T19/4/T210/25/T210/25/7211/8/7211/8/726/2T/T3
6/11/T56/30/753/24/T54/18/T55/2T/T59/24/759/24/7512/1/7T
6500014500016500011500013500019000012000010000015000045000TOOOO
60000
SEWARD PARK GOLD MT GRASS MT BLYN MT CAPITOL PEAK RATTLESNAKE MT JIM CREEK MT FREMONT BAW FAW MT MT ST. HELENS MT CONSTIT MT BAKER STRIPED PEAK LONG MIRE HAYSTACK LADD MT SOUTH MT LYMAN OAK HARBOR FAIRMONT GARRISON HILL ROCKPORT
f Provisional station P delay* Magnification at 1 Hz> not determined where blank

EARTHQUAKE ANALYSIS PROCEDURE 7
1965 was compiled by Rasmussen (1967).
Since no new stations were added to
the network in 1978, the network configu
ration was essentially uniform throughout
the year. Inevitable failure does occur in
the operation of some stations, which affects ,
the uniformity of station coverage. A station
activity graph (fig. 5) shows the major gaps
in station operation in order to indicate
approximately where such failure may affect
the data in this report.
The basic information for this series is
contained in Appendix I. The Appendix listing
is a direct copy of a machine listing. Appendix
II lists corrected information for six earthquakes
whose magnitudes were reported incorrectly in
the compilation of hypocenters for 1977 (Crosson
and Noson, 1979). These errors resulted from
data entry. To assess the accuracy and con
sistency of past magnitude determinations, we
are reviewing film records of earthquakes re
corded from 1975 to the present.
EARTHQUAKE ANALYSIS PROCEDURE
A Geotech Develocorder with film speed
of 15 mm/min records signals received onto six
teen millimeter film. The film is then scanned
on a Develocorder viewer with a magnification
of X 20. Events detected are classified into the
following categories: teleseisms (greater than
1000 km distant), regionals (less than 1000 km,
with an S wave to P wave time generally greater
than 10.0 seconds) and local events (nominally
within the network perimeter). Each 300 foot
reel of film represents 96 hours of recording
time during which, typically, a total of 30 or
more events are detected. All events are
classified and entered into a master catalog.
1978
c/) o
I JAN I FEB I MAR I APR I MAY I JUN I JUL I AUG I SEP I OCT I NOV I DECSPWGMW6SMBLNCPWRMWJCWFMWBFWSHWMCWMBWSTWLONHTWLMWSMWLYWOHWFTWGHWRPW
FIGURE 5. Station activity graph.
8 EARTHQUAKE HYPOCENTERS
Local earthquakes large enough to be well re
corded on three or more stations are prepared
for computer location runs. Usually, six or
fewer local events will be successfully located
during each four-day interval.
The location program, based on the stan
dard nonlinear least squares inversion scheme of
Geiger (1912), was especially written for use
with data from the western Washington array.
The accuracy of the locations determined with
this program depends on the crustal model, sta
tion distribution and quality of the arrival time
data. The main data set consists of P wave
arrival times, coda lengths, and a weighting
factor for each reading. S wave arrivals are
used as supplementary data where necessary.
Using the crustal model developed by Crosson
(1976a, 1976b) and the current station distribu
tion (fig. 1), hypocenter parameters are gen
erated until the observed minus predicted
arrival times (residuals) are a minimum. The
quality of the data can then be estimated by
examining the residuals for each event. Higher
quality and quantity of data generally produces
more reliable locations. The standard deviation
(SD) of residuals for each earthquake is tabu
lated in the Appendix I. Although there are
many possible indicators of solution quality,
the standard deviation is an easily understood
and useful one. An SD less than 0.1 second
indicates a solution that fits the observed
arrival-time data very well. A value greater
than 0.5 usually indicates a poor solution.
Events with an SD greater than 0.5 are usually
removed from the data set. Earthquakes re
corded on three or four stations theoretically
always have an SD of zero. Since there is no
measure of error, these events are removed
unless they have very clear P-arrivals, locations
Within the perimeter of the network, and are
recorded at stations distributed around the
estimated hypocenter.
Explosions are removed from the data
set wherever possible. Criteria useful in dis
tinguishing explosions are: Shallow depths,
positive P wave polarity, size, clustering, time
of the day of occurrence, coda frequency, and
of course, direct verification. When explosions
occur in unusual locations and are nonrepeti-
tive, positive identification is difficult. Sus
pected or possible explosions that are not
subject to reasonable verification are indicated
in the Appendix by a symbol ($). In particu
lar, explosion contamination may be present in
data, recorded in the southern part of the net
work. All events from this area since 1970 are
currently being reviewed.
Magnitudes of earthquakes are determined
using a coda or signal duration technique. The
method used is presented by Crosson (1972).
SIGNIFICANT EVENTS
During 1978, a total of 367 earthquakes
were successfully located. Depending upon the
location with respect to population centers and
the depth of origin, most events with a magni
tude greater than approximately 2.8 were felt.
Ten of twelve 1978 events with magnitudes
greater than 2.8 caused ground motion large
enough to be detected by people living near the
epicenter. These events are flagged in Appendix
I by an asterisk (*). No structural damage was
reported to have resulted from any of these
earthquakes. Three events during the year had
magnitudes greater than 4.0. The largest
(m = 4.6) occurred on March 11, 1978 with an
epicenter 4 km southwest of Port Orchard.
Figures 2 and 4 show that this was an area of
high seismicity during 1978 due to aftershock
activity related to the event. Sixty-five earth-

REFERENCES CITED
quakes were located within a 10 km radius of
the epicenter. A more detailed study of this
earthquake is in preparation. A second felt
event with a magnitude of 4.0 occurred in ap
proximately the same location on March 31.
Both of these events were felt widely in the
Puget Sound area. A third earthquake (m = 4.0)
occurred near Fall City on December 31. During
1978, six events were located within 10 km of
this epicenter.
ACKNOWLEDGMENTS
The cooperation of many people and organ
izations is necessary to complete these reports.
Although individual acknowledgment is impossible,
we want to stress our appreciation to those in
volved. The contributions of the following merit
special recognition. Laurens Engel provided
major technical support and fulfilled the demand
ing task, often in adverse conditions, of network
operation and maintenance. Access to lands and
facilities for the purpose of station installation
has been generously provided by the State
Department of Natural Resources, U.S. Forest
Service, State Parks Commission, Weyerhauser
Company, U.S. Navy, U.S. National Park Service,
and the City of Seattle Parks Department. The
U.S. Geological Survey provided support for
radio telemetering operations. Research support
has been provided by the U.S. Geological Survey
under contracts #14-08-0001-15896 and #14-08-
0001-16723.
REFERENCES CITED
Crosson, R. S.,-1972, Small earthquakes, structure, and tectonics of the Puget Sound region:
Seismological Society of America Bulletin, v. 62, no. 5, p. 1133-1171.
Crosson, R. S., 1974, Compilation of earthquake hypocenters in western Washington 1970-1972:
Washington Division of Geology and Earth Resources Information Circular 53, 25 p.
Crosson, R. S., 1975, Compilation of earthquake hypocenters in western Washington-1973: Wash
ington Division of Geology and Earth Resources Information Circular 55, 14 p.
Crosson, R. S.; Millard, R. C., 1975, Compilation of earthquake hypocenters in western Washington-
1974: Washington Division of Geology and Earth Resources Information Circular 56, 14 p.
Crosson, R. S., 1976a, Crustal structure modeling of earthquake data; 1, Simultaneous least squares
estimation of hypocenter and velocity parameters: Journal Geophysical Research, v. 81,
p. 3036-3046.
Crosson, R. S., 1976b, Crustal structure modeling of earthquake data; 2, Velocity structure of the
Puget Sound region, Washington: Journal Geophysical Research, v. 81, p. 3047-3054.
Crosson, R. S.; Noson, L. J., 1978a, Compilation of earthquake hypocenters in western Washington-
1975: Washington Division of Geology and Earth Resources Information Circular 64, 12 p.
Crosson, R. S.; Noson, L. J., 1978b, Compilation of earthquake hypocenters in western Washington-
1976: Washington Division of Geology and Earth Resources Information Circular 65, 13 p.
Crosson, R. S.; Noson, L. J., 1979, Compilation of earthquake hypocenters in western Washington-
1977: Washington Division of Geology and Earth Resources Information Circular 66, 12 p.
Geiger, L., 1912, Probability method for the determination of earthquake epicenters from the arrival
time only: St. Louis University Bulletin, v. 8, p. 56-71.
Rasmussen, Norman, 1967, Washington State earthquakes 1840 through 1965: Seismological Society
of America Bulletin, v. 57, no. 3, p. 463-476.

10 EARTHQUAKE HYPOCENTERS
APPENDIX I_
CATALOG OF EARTHQUAKES (1978)
Earthquakes located with the western Washington seismograph network are listed chronologically
in this Appendix. The columns are generally self-explanatory except the following features should
be noted:
(a) The origin time listed is that calculated for the earthquake on the basis of multistation
arrival times. It is given in Coordinated Universal Time (UTC), which is identical to
Greenwich Civil Time, in hours (HR), minutes (MN), and seconds (SEC). To convert
to Pacific Standard Time (PST), subtract eight hours.
(b) The epicenter location is given in north latitude (LAT N) and west longitude (LONG W)
in degrees, minutes, and seconds.
(c) In most cases the depths, which are given in kilometers, are freely calculated by com
puter from the arrival-time data. In some instances, depths must be fixed arbitrarily
to obtain epicenter solutions. Such depths are noted by an F (fixed) in the column
immediately following the depth.
(d) The residual standard deviation (SD) is taken about the mean of the station first-arrival
residuals. It is only meaningful as a general statistical measure of the goodness of the
solution when 5 or more stations are used in the solution. Good solutions are normally
characterized by SD values less than about 0.4.
(e) NO is the number of station observations used in calculating the earthquake location.
Three observations at minimum are required and generally the greater the number of
observations used, the better the solution quality.
(f) MAG is the local Richter magnitude as calculated using the coda length magnitude rela
tionship determined for western Washington. Where blank, data were insufficient or
impossible to obtain for a reliable magnitude determination. Normally, the only earth
quakes with undetermined magnitudes are those with very small magnitudes.
(g) SDMAG is the magnitude standard deviation. Where blank, either no magnitude was
calculated or only one station observation was used to determine the magnitude.
(h) Felt earthquakes as determined by the University of Washington, various news and other
agencies, are designated by a star (*) following the listing.
(i) Possible, but unverified, explosions are designated by a ($) following the listing.

APPENDIX I Continued
APPENDIX I 11
Of ri* MN SEC JAN <L 10 49 28.9
2 It 22 21.3t 17 51 44.73 15 9 4,37 4 14 25,49 16 46 16.5
10 16 47 58.411 9 14 21.413 1 42 17.5let 19 10 3.310 10 33 31.419 6 46 36.222 16 47 13.823 9 14 59,924 7 10 48.524 8 9 14.025 12 52 53. 125 14 3 27.62o 2 7 55.726 7 9 53.02/ 13 56 24,429 13 14 38,2
Ftd 1 11 39 24.03 12 9 30.43 19 30 41,43 16 37 45.73 2* 7 58.49 11 14 37.9
10 14 9 16.111 5 3 43.911 6 12 13.212 10 16 11,712 17 58 36,914 22 19 4,415 10 42 6,522 18 52 40.423 4 46 42.724 21 36 2.426 14 0 34.426 2i 46 18.627 6 9 23.727 7 12 28.227 10 26 54.42f 11 47 12.827 16 47 26.928 3 46 11,42d 10 10 21.4
MAR 2 5 41 27.93 6 34 9.23 6 58 53.83 10 42 25.94 7 53 52.0491 36.44 13 59 51.05 18 13 36.16 16 20 49.37 14 14 1,9
11 1 13 29.8li 5 25 12.211 15 52 11.3
LAT N 47-59-39 47-3:5-1645-4S-5347-34-1347-47-3547-32-2348-55-5947-42-2447-44-3446-43-29*t7-li-3047-51-3047-29-1247-46-3748-45-2246- 9-4847-30- 647-23-5247-31-2047- 7- 747-25-2747-25-2946-3 f-4o47-31- ^47- 3-1148-41-50H7-31-2847-33-5047-43-1546-13-2247-27- 448-21- 247-30-5447-13-3647-39-4048- <»-5347-35-4547-25-3047-42-4847-29-2048-13-2646-35- 448-12-4947-47-2248-13-1347-35-2747-54-5548- 1-1446-11-1747-51- 946- 2-4247-42-3147-21-3747-22-5248- 3- 648- 4-2047-42-3546-47- 047-51-3347-25- 4
LONG, U i2i-30-54 i22- 8-13122-34- 7123-15-36122-23-47122-10-36122-18-23122-42-14122-45-26123-33-44121-59- 2122- 5-52122-45-36122-27-13123-12-47122-28- 6*121-55-16122-46-10122-37-52123- 9-25121-49-55124- 0-58122- 8-30122- 1- 7122-12- 8122-11-16121-58-28122-47-10123-14-49121-46-17122-43-27x22-32-25122-39-27122-42- b123- 0- 5121-55-27122- 2-52121-58- 3122-12-49122-24-10122-34-10122-23- 5122-33-21122-23-14122-33-56124- 9-60121-32-40122-33-52122-29-45122-18- 0122-40-10122-35-57122-42-24122-38-44122-58-22122-37- 5122-14- 2121-49-27122-37-54122-42-31
DEPTH SO 3,9 0,0 4,4 .28.1
44.521.424.2
.753.127.839,514.322.316.515.253.87.4
21.723.322.747,618.733.52.7
12.25.114.719,123.343.716.620,920,921.917.547.05.16.15.220.518.617.520.416.516.716.736,4
.152.1l.OF
20.3.7
20.911.725.556.558,519,611.519.024.6
.3
.1
.1
.1
.2
.2
.0
.3
.2
.1
.1
.1
.1 1.0.1.2.2.3.2.2.1.2.2.2.2.2.3.1.3.1.2.1.4.3.3.4.1.3.1.3.2.0.2.2.0.3.3.2.2.1.1.1.2.2.2
0.0.3
NO4 75
15677
205
1966977966
19121218107
139
14172095
156567675
16879
147766685
1346
136774
20
MAG S014G 1.1 .2 1.4 .31.72.41.41.42.72.01.02.61 .31.71.3.7
1.31.5.8
1.0a. 32.01.5E.a1.51.31.61.41.92.03.11.7.6
2.21.31.21.01.11.01.61.42.11.?1.61.42.11.32.01.61.51.81.61.91.8.7
1.43.41.51.51.4.9
4.6
.1 S
.2
.5
.3
.2
.4,5.4.2.1.4.2.4.2.3.4.<*,2.4.3.1.1.3.4.4.2.3.3.5.3.4.1.3.5.2.3.3.3.4.4.2.3.1.2.3.4
0.3.3.1.3.1.3.2.4.3.3.2.1
$
S
*
S
i
$
$
*
*

12 EARTHQUAKE HYPOCENTERS
APPENDIX I Continued
Or HR MN SEC MAR 11 16 31 9.9
11 16 37 31.* 11 16 49 .2 11 16 6 17.6 11 19 40 46.6 11 21 18 40.8 12 A 22 14.5 12 5 41 48.3 12 13 35 55.0 12 15 53 49.2 IL 20 18 5.61517171919202020222223252o26262727272626292929293131
APk 11234667tJ99U1416171819191919202224
1711192
15131423111623656
1148
138
2213
12142869
2219116
1214202
15191111151034
101823
5336135053217
5870
412615513
465128141
1751162673
39371852128
595336414643591030333211515041
7 4223 47
28.347.633.745.513.38.0
34.112.549.735.139.632.737.94.15.411.126.96.0
26.513.646.73.1
38.545.222.5
.114.148.634.633.853.932.428.19.4
22.62.3.
35.626.756.954.03.7
51.137.813.339.95.933.8
.128.6
LAT N 47-2^-11 48-23-25 47-23-54 47-24-24 47-2«t-25 47-24-31 47-24-44 47-25-16 47-23-59 47-33-44 47-23-5847-16-4647-26-1947-23-4947-30-1347-24-1648-34-3147-24-3347-23-3847-24-4747-43- 847-47-5347-24-1348-2J-4947-3D-1847-51-5448-24-2446-55- 247- 1-5747-24- 147-4U-4347-38-4218-31-5648-11-5247-27-2447-29-5147-24-5747-27-5246-19-5847-32-5147-22-5247-43-3647-25- 847-25-1046-15-1546-43-1146-27-3247-40-3246-57-3148-47-5747-37-1547-25-4847-23-4447-25- 247-29-1947-25-1247-43- 646-31-3946-53-5148-30-41
LONG W 122-40-4t 122-18-25 122-41-42 122-41-35 122-42-13 122-42-10 122-41-57 122-42- 2 122-41-37 122-16-47 122-40-36122-41-34122-48-11122-40-41122-24-14122-41-3V122-59-23122-40-33122-40-13122-42-33122-22-43122-47-48122-42-43122-43-50121-39-33122-43-41122-32-35122- 0-16121-55- 5122-41-21122-10-11122-31-58122-51-56122-45-31122-38-31121-56-19122-42-46123- 0-22122-35-21122-54- 8122-39-43121-38-38122-42-37122-43-19122-12-27121-59-59122-31- 9121-34-31121-58-30122- 8-14122-49-30122-41-45122-40-56122-41-55121-55-49122-42-3t122-54-26122-43-15121-10-33122-41- 8
DEPTH 24.6 15.2 22.1 23.9 23.2 22.9 23.0 25.7 22.7 l.OF
21.27.2
21.721.318.422.048.724.020.523.916.520.024.051.916.99.824.98.012.720.516.921.457.923.68.2
20.323.843.622.017.821.59.123.324.68.72.7
20.27.46.67.2
24.322.519.423.720.924.36.626.910.120.3
SO .2 .2 .1 .3 .2 .2 .1 .1 .1 .1 .0.0.1.0.3.2.1.1.0.2.2.2.2.1.3
3.0.2.1.2.0.2.1.2.3.1.2.3.4.2.3.2.2.2.2.2.3.0.2.4.3
0.0.1.2.1.2.2.1.2.1.3
NO 5 7 5 7
14 13 6 7 9 6 556687566
101076964
1258567
14205
112067
2069
12996598745666
105968
MAG SOMAG 1.0 .4 1.4 .3 .8 .5
1.5 .3 1.8 .1 2.2 .1 1.7 .3 1.5 .1 1.4 .2 1.2 .4 S .9 .4
1.21.01.01.01.21.11.2.9
1.41.41.31.21.21.4,1
1.81.31.41.11.1.9
2.12.91.21.34.01.01.22.21.21.51.81.91.51.51.11.21.31.9.7.9
1.01.21.11.31.11.01.61.1
.3
.3
.2
.3
.3
.2
.2
.3
.3
.4
.5
.5
.2
.1
.6
.4
.6
.4
.3
.4
.1
.3
.3
.3
.4
.1
.4
.4
.3
.2
.3
.3
.4
.2
.3
.3
.4
.3
.2
.3
.3
.3
.5
.5
.3
.4
.4
.5
.3
*
*
$
S$

APPENDIX I Continued
APPENDIX I 13
OY HR NN SEC APR 25 8 46 49.0
25 9 52 31.7 23 15 28 59.0 2i> 19 6 32.6 20 12 26 20*5 26 15 49 53.2262627283030
HAY 1122555666799
10101011121314IP16171820212424242425262626272931
JUN 1223344444
21 5022290
190
20131635
2129
1158
182
1517188
114
19144
18149
1419222338
1015232303358
12268
1420
0146
5716204628345829181
4418233222290
195048591
215243506
412
5538Ib4347544611283852511652123257374
33
10.318.651.840.450.49.455.414.127.77.3
28.547.558.72.4
50.445.244.952.12.6
45.110.136.320.55.518.511.150.96.0
36.319.915.053.94.7
58.530.137.838.851.438.255.225.448.524.226.038.14.2
13.537.922.550.116.93.7
41.95 3 44 24.9
LAF M 47-53- 6 47-17-13 4 8-47 -Z 7 4S-47-23 47-24-46 47-17-5647-24-3448-33-5147-17-3847-23-2247-22-t>248-31-5447-52- 747-24-5047-24-2247-25-5147-19-2948-29-1247-45-4247-43-4647-32-1147-24-3147-19-5047-13- 247-2P-ZO47- 9-4247-24-4547- 2-1948-27-5647-48-1847-33- 447-46-1947-24-1447-54-3648-48-5447-53-5348-19-3948-53-1848-39-5648-12-1147-35-5647-31-1547-56-5048- 9-4247-30-2348-19- 247-24-4047-25-5347-44-1547-14-5447-17-1847-34-3747-34-1547-32-3947- 4- 648-13-1247-24-4447-24- 348-31-5148-31-44
LONG W 122-30-29 122-40- 1 122-21-54 122-21-41 122-42-24 122-40-14122-41-55123- 1- 1122-39-53122-42- 3122-30-46122- 2-10121-44- 7122-42-22122-41-10122-49-26>122-38-24122-33-42121-45-60122-35-42122-23-42122-41-38122-37-59121-38-53122-41-25123- 5-42122-43-42122-12-20122-33-40122-31-48122- 3-11121-58-57122-41-34121-54- 2122- 8-11122-36-33122-11-25122-50-33123- 0- 9122-44-42122- 5-13122-40-41121-46-19122-17-55123-25- 3122-46-28122-44- 6122-PO-45121-30- 2122-48-40122-53-51122-47- 0122-49-11122- 1-39123- 0-42122-30-31122-42-31122-40-52122-23- 5122-23-21
DEPTH 53.0 23.6 2.3 3.6
23.6 29.322.015.923.323.911.11.7
20.922.122.223.326.117.44.616.319.321.722.3l.OF
25.843.323.53.520.63.613.827.623.515.54.87.47.4
15.319.121.013.33.411.112.16.6
20.239.28.611.618.719.414.716.517.939.928.823.220.715.316.8
SO .2 .2 .1 .2 .1 .2 1.2.3.1.4.3.1.2.1.3.2.4.3.1.1.1.2.3.1.3.2.2.3.1.3.1.2.2.3.2.3.1.0
0.00.0.2.1.2
0.0.4.1.3.2.1.2.1.2.1 4.1.1.2.1
0.0
NO 13 18 6 6 8 868
1396o5
156
1611191856585
1219105
105
1896
1411111865465594
116556856
1178
10674
1AG 1.5 2.2 1.4 1.3 1.2 1.2.9
1.41.81.1.7
1.71.11.7.5
1.91.62.32.3.5.6.6.7
1.22.02.71.51.31.4.7
1.8l.l1.11.82.51.12.51.31.0.8.7
1.11.21.0.6
1.5.8
1.0.9.6
1.2.8.9
1.1.7.8.8.7
1.5.8
SDHAG .4 .4 .3 $ .2 .4 .3.1.3.4.2.3.3.3.2.4.2.3.4.3.4.4.4.3.2.3.3.4.4 $.4.5.4.2.4.4.2.3.3.5.4.2.4.4 S.3.4.1.6.2.3.3 S
0.0.3.5.5.3.1.3.4.4.4.1

14 EARTHQUAKE HYPOCENTERS
APPENDIX I Continued
OY HR MN SEC LAT N LONG W DEPTH SO NO HAG SOHAG
JUL
;d
10101111li111111121416182020212222232526272726291223457dad8do99
1314141?151919±920212i2122232325262929
151
102111223
15155306
143y768
112
13131632
171413603
11111519216
175572
173
1314368
1805
1912456
158
462534414349165557543
534540344951275655194620505534283527105
471
555450531220253
445736421711203836401
471422561342
14.28.3
43.213.65.335.457.311.047.98.1
32.944.531.04.3
24.820.82.1
16.027.16.52.1
12.7.3
36.48.76.5
16.636.732.515.554.437.553.046.350.556.450.1
.92.543.18.7
43.841.47.21.2
56.423.79.758.33.1
31.051.915.718.145.756.124.054.434.341.8
47-2i-2247-24-5347-24-5547-15-4648-27-2247-47-J.446-58-5447-47-5647-36-1046-38-1546-5d-6047-23- 447-19-3148-25-2747-45-5247-32-4647-19-2648- 8-3447-24-4347-34- 347-26-5747-25-4246-56-1548-14-2247-31-2846-55-5348-23-4146-41- 747-43-2447-42-4847-2&-1047-55- 948-30-5546-51-1047-19-5246-5>- 347-45-6046-51- 847-37-1847-24-5147-45-5048-29-5346-33-4547-37-1647-37-1648-12-2347-36-4946-53-4848-ld-ll47-45-1947- 9- 847- 9-1048- 3-3548-44-2346- 7-2146-5 J-5 346-18-4346-21-1047-52-4748-49-45
122- 5-50122-42- 3122-42-54123-10-19123-13-32121-55-27121-11-48121-46-28121-49-53122-36- 6121-13-22122-48-24121-56-11122-29-19122-27-44122-43-15^122-35-44122-46-57122-42-19122-22-30122-21-39121-48-20121- 8-13122-22-37122-35-12121-15-14123-34-43122- 5-13122- 1-10.k24-l<t-53121-55-14121-57-12123-12-44121-54-51122-37-41121-56-43122-32-48121-54-56122-12- 8122- 4-28122- 7-41j.23-14-22122-17-38122-12- 7122-11-49121-25-40122-11- 5122- 0-10122- 6-30122-14- 9123- 7-19123- 7-34121-39-38122-57-50122-44- 1122- 0-36121-17- 5123-26-53122-36-39122-27-19
15.322.623.742.949.730.3l.OF9.26.72.0l.OF31.522.323.221.249.615.227.622.223.427.020.73.1
23.223.010. OF16.117.722.821.625.320.032.79.622.24.719.39.525.118.020.69.120.527.625.29.526.311.412.720.917.416.97.3
20.527.73.2
16.813.317.21.5
.2
.1
.1
.3
.1
.1
.3
.3
.3
.2
.30.0.2.4.1.2.3.1.2.1.2.2.2.2.1.2
3.0.2.1.1.2.4.2.3.0.2.0.4.1.2.2.2.2.1.0.2.1.4
0.0.2.1.1.2.1.2.3.3.0.2.3
1069
1375
1465
1194
12168
16657878
1486649697
138
10b
105
108
147598756846
10756
141365
117
.9
.81.11.91.51.12.21.5.9
1.52.2.8
1.32.2.8
3.3.4.8.9.9
1.01.13.41.2.8
1.7.9
1.61.01.0.8
1.61.51.5.9
1.6.4
1.31.01.4l.l,9
1.51.1.9
1.5.7
1.4.8.9
1.31.31.21.?1.91.51.41.51.51.3
.1
.1
.3
.3
.3
.3
.4
.2O.D0.0.3.3.3.3.3.2.2.4.2.5.3.4.3.2.2.2
0.0.2.3.2.3.3.4.4.3.3.4. -t.5.3.1.3.4.4.4.1.2.2.5.2.1.3.1.3.3.4.4.1.3.2

APPENDIX I Continued
APPENDIX I 15
OYJUL 29
30AtlG 2
4456739
10ii1113171719192324262o272*202929293131
StP 3536a9s»
101112141*151617Id2021212324262720292*293D
HR UN SEC7 56 31.96
1812 1.0b 53*9
11 56 50.113221320161
22222267
1*1
11140
10170223
14222
1059
13d513
15202213
16152
15
2333
2319171209
18Ad5
30 19OCT 2
15 23.619 59.25 23.2
37 3.519 6.149 6.551 57.454 15.155 5.946 30.75 9.0
56 24.851 18.325 8.237 18.520 15.911 59.*39 42.959 28.617 11.351 10.336 44.820 40.123 24.946 8.30 37.2
45 .416 25.217 46.851 40.757 32.646 11.136 56.9^ 12.8
53 34.13 10.7
31 4.113 27.149 26.811 23.832 .652 11.851 1.822 3.236 15.12 47.3
57 32.834 52.834 18.534 9.927 55.846 29.552 14.427 47.74 9.9
13 25 57.7
L4F N47-24-2847- 9-1847-29- 546-33- 046-37-5147-47-1348-27-2448-14-3046-12-3647-44-4447-32-4647-25-1047-25- 147-3A-4847-43- 847-47-4648-39-3448-37-4146-21-2947-47-2848-48-3948- 8-5647-45-1547-37-2648-17-2147-55-1847-25-3548-13-4147-26- 847-47-3947-50-4347-29-1747-35-1747-25-1047-41-4448-29-2246-13-3248-14-2949- 0- 247-35-1447-3b-3546-50-2647-23-2947-19-3946-52-4147-23- 647-19-2547-51-3947-3J-2947-24-1847-42- 94b-12-2748-15-5748-10-2747-42-5047-13-3947-13-264a- 7- 447-47-2747-33-48
LONG W123-11- 8123-20-56121-50-43122-36- 3122-37-24122-46-56122-25-28121-42- 8122- 3-30122-22-51122- 1- 6122-43- 5122-42-51122-28-49121-31-23122- 8-16;123-35-15122-59-34123-13-24122-31-20121-19-10122-46- 3122-33-53122-57-30122-34-44123-22-24123- i-38121-41-35123- 6-13122-21-56122-29-16122-53-26122-48-45122-42-47122-32-16123- 9- 3122-43-24121-33-26123- 5-23121-44-17123- 8-29121-50-13122-20-19122-19-14122-20-26121-50-11i22-33-48122-37-46122-50- 8122-41-55i.22-5d-4o123-30-43123-11- 1121-51-37122-16-38122-46-60122-47-24123- 3-41122-31-43122-40-46
DEPTH40.931.620.715.38.58.916.217.113.820.718.423.323.619.28.7l.OF
53.914.620.95.21.3
25.521.646.923.636.25.917.46.5
26.622.317.020.323.45.936.324.02.414.68.36.05.014.217.321.020.08.520.511.621.32.7l.OF
42.92.2
21.319.921.827.346.223.3
SO.3
0.0.2.1.3.1.2.4
0.0.3.1.2.2.1.3.5.2.2.4.1.2.2.2.3.2.2.1.2.1.1.1.2.2.2
0.0.4.2.0.4.4
3.0.1.1.1.2.1.2.1.2.1.2.3.2.1.2.2.2.3.2.0
NO94
111094
11745
10111415156
177
1758
109
17755688
1465
1345959745
13666
12556 3
5154
1177765
HAS1.2.8
1.51.5.9.6
1.41.71.0.8
1.11.31.61.72.31.13.91.23.6.?
1.91.31.23.2.7
1.2.9
1.41.61.42.1.*
1.01.9.6
1.21.41.21.31.6.6.9
2.2.3
1.41.01.4.5
1.0.7.7
2.02.21.1.7.4.7.3.6.6
SOHAG.3.1.3.3.2.5.4.5
.2
.1
.4
.3
.4
.4
.2
.4
.3 *
.5
.2
.2
.2
.2
.3
.4
.5
.3
.2
.4
.2
.2
.4
.1
.2
.4
.20.0.4.4.1.4.2.2.2.1.4.1.3.3.1.2.1 $.2.2.4 $.5.2.5.3.2.5

16 EARTHQUAKE HYPOCENTERS
APPENDIX I Continued
OlT HR MN SECOCT 2 14 42 54.2
56666689
131414151616161717171718191922252o2627272d
NOV 2226b9
121214151721212425252o2930
DeC i133669
13
6 5 3.44 55 42.58 5517 5410 261516
515
17 2B139
149
13202067d
19122
1316115
13iii131513
21191830
2010y
153y
1769122
11179
1305
224
13 2014 1
14164645331322135116245781
256
28303916255959315152592723102755292153IS20471624354212524233
46.534.034.530.843.743.8
,933.4
.7
.155.536.035.826.343.617.951.659.145.67.8
Id.o15.8a.3.417.350.234.518.939.146.318.656.4
.951.556.459.010.241.230.816.817.331.02d.226.158.61.8
37.915.942.72.9.148,927.644. Z
9 5d,95 27.4
59 11,359 10.5
Id 1 52 23.6
LAF N48-34-3347-19-2847-39-3447-22-3047-41-4747-31-1547-22- 647-52-5646-53-3248-35- 547-46- 147-12-1347-24-5146-57- 647-U- 948-19-3348-17-5047-13-3447-59-4647-53-5946-51-234d-23-2847-34- 047-32-5446-27-4643-11-1048-47-2546-51-1047-24-1647-51-4947-49-3348-12-2148-15-4246-44-2747-30-3747-13-4647- 2-i748-33-1247-42-5647-31-1646-13-1946-53-2847-23-4746-5J-4447-2'*-3647-41-13.47-53- 749- 3-5347- 5-1347-33-4947-23- 947-29-4047-44-2647-24-3347-lo-1948-l>-3647-49- 647-25-4647-35-4448-21-46
LONG W122-16-60122-17-47122-14-57122-15-54121-57-50122-51-18±22-21-41122-22-20121-56-34122-21-36122-50-45122- 5-22121-50-14122- 6-45122-24-14122-26-42"*123- 9-29122-14-46122-50- 2123- 7-18121-57-14i2a- 4-14121-3e-28122-20-47122-18-10122-57-55122- 0-53121-55-59122-23-20122- 0-29122-43-22122-45-50122-10-10122-2d-23122-33- i123- 1-24121-56-39122-15-3d122-14-29122-28-26122-27-16121-56-51122-56-42iZl- 6-19122-41-51121-47-31122-47-43123- 6-46122-25-27122-34-26122-40-54123- 1-18122-18-26122-41-60122-16-22123- 8-34122-20-60122-4d-35122-12-21122-30-33
DEPTH6.56.9
27.12.721.522.712.132.57.3
10, OF22.719.920.74.322.820.241.73,3
50.147.111.920.36.622.723.523.712.23.6
17.517.122.025,517.o8.025.?31.73.0.8
23.717.952,511.414.13.521.97.85,5
13. D43.725.631.015.625.423,918.348.67.624.625.219.3
SO.3.1.1,4,Z.2.1.3.4.3.0.2.1.3.2.2.1.2.1.1.2.1.2.2.3.3.2.3.1.0.1.2.1.2.2.1
0.0.3.2.1.2.3.2.3.2
0.0 2.1.4.1
0.0.3.2.0.3.3.1.1
0.0.4
NO65
107664
1294575
101086
141267d59
7d5
101157
116
1186559a5
10111165689
114
1766767948
HAG1.0.8
1.41.01.0.5.7
1.41.51.41.31.31.01.91.61.3.8
1.61.31.01.11.1.7
1.0.0
1.11.41.11.21.4.3
1.9!.*>1.91.21.11.1l.l1.21.21.12.02.01.91.01.3.9
1.51.21.5.4
2.51.71.2.7
1.61.01.3,9
1.6
SOMAG.3.4.2.3.3.4.1.4. ^.4.2.3.4.3.4.4.3.4.3.5.3.3.2.4
0.0.3.2 S.5.1.3 3.4.5.1.3.2
0.0 S.1 $.4.2.2.2.1.1.3.4.4.1.4.4. ?,2.1.3.4.2.3.4.1.4

APPENDIX I Continued
APPENDIX I 17
DECOY18182328293131
HR121*7
12d33
MN19565918412330
SEC38.446.419*558.334*44o.634.4
LAT N46-55-2848-22- 546-33-2247-18-3648-15-5747-35-2547-35-37
LONG W123-21-53122-50-60122-22-39123- 9-49122-32-4912J.-5U-39121-53- 5
DEPTH10. OF18.310.642.023*819.918*8
SO.4.2.2.3.1.2.1
NO46
11196
206
HAG1.41.41.63.41.04.01.4
S01AG.3.2.3.2.4.3.4
*
*

18 EARTHQUAKE HYPOCENTERS
APPENDIX M^
CATALOG OF EARTHQUAKES (1977)
Corrected Values
DY HR MN SFC LAT N LfNG W DFPTH SD NO MAG SO*AGFEBAUG
OCT
NCV
116
277
121513
149
16654
14
23133
22242458
55.628.212.957.925.17.2
39.3
46- 5-4446-10-254*-13-6Q45-56-5646-15- 448-14-3546-45-58
122-43-5312?-ll-49l?l-57-25122-15-17122- 6-41123-47-4312?- 3- f
2.?6.6? .51 .fF7.0
49.3'.1
.2
.3
.2
.4
.1
.2
.2
9Q676
1310
1 *1.41.31.61.03.?1.6
..?
.1
.6
.?
.1
.1
.3

APPENDIX D
The Magnitude 4.6 south Puget Sound earthquake of Mar. 11, 1978

THE MAGNITUDE 4.6SOUTH PUGET SOUND EARTHQUAKE OF MARCH 11, 1978;
MAIN SHOCK AND AFTERSHOCKS
Thomas S. Yelin and Robert S. Crosson Geophysics Program AK-50 University of Washington Seattle, Washington 98195

On March 11, 1978, a magnitude 4.6 earthquake occurred 35 km southwest of Seattle at a depth of about 24 km beneath the Kitsap Peninsula, in the south-central Puget Sound basin (we define the Puget Sound basin to extend approximately from Olympia on the south to Port Townsend on the north and from Seattle on the east to the Hood Canal on the west). The earthquake was felt widely over the south-central basin but there were no reports of signi ficant property damage. In the nine months following the March 11 earthquake, 44 aftershocks occurred in the immediate vicinity of the main shock. Only two of them had magnitudes greater than 2. The rate of aftershock occurrence decayed with time in approximately a 1/t fashion (Figure 1).
This sequence of earthquakes is noteworthy for two reasons. The main shock is the largest earthquake recorded in the south-central basin since 1970. It is also the first well-defined example of a classical main shock- aftershock sequence observed in the Puget Sound basin since the western Washington regional seismographic network began operation in 1970.
Epicenters for the years 1970-1977 in the region adjoining the immediate area of the 1978 sequence are shown in Figure 2. -The distribution is generally diffuse, with only a few distinct areas of clustering. The hypocenter region of the March 11 earthquake had only a moderate amount of seismicity during the years 1970-1977.
We first located the earthquakes in this sequence with the velocity model and station corrections developed by Crosson (1976). The locations resulting from this initial analysis are summarized in Figures 3 and 4. Figure 3 is an.epicenter map which suggests a fault plane striking N45°W. Figure 4a is a projection of the hypocenters onto a vertical plane striking N45°E. The alignment of hypocenters in this cross section supports the idea of a nearly vertical fault plane striking N45°W. Figure 4b is a projection of the hypo- centers 'onto a vertical plane striking N45°W, at right angles to the plane of Figure 4a. This cross section indicates that the distribution of hypocenters dips to the northwest.
We constructed first motion projections for the main shock using both a constant gradient velocity model and the layered model used to locate the earthquakes. Polarity readings from the USGS network in the vicinity of Mount Hood were helpful in providing some additional constraint on the focal mech anism. The mechanisms obtained from the two different models are essentially identical, with conjugate fault planes striking N18°W and N78°E and dipping, respectively, 80° to the east and 60° to the south (Figure 5). Very similar focal mechanisms were obtained for the largest aftershock (M=4.0) and a composite of three smaller aftershocks. Thus, there is a discrepancy in orienta tion between the fault plane determined by the first motion projections and the fault plane suggested by epicentral and hypocentral alignments. This discrepancy may be due to several causes. The locations and/or fault planes may be influenced by the lateral heterogeneities which we know exist in the crust of this region. Another possibility is that poor location control in certain spatial directions may be influencing the locations and also indirect ly influencing the focal mechanisms determined.

In an attempt to evaluate these effects we carried the analysis further by calculating error ellipsoids (Flinn, 1965) for each location to reveal direc tions in space along which relatively poor location control exists.
Figure 6 is a lower hemisphere stereographic plot of the three axes of each error ellipsoid. Twenty five (53%) of the earthquakes have error ellipsoids whose major axis to minor axis ratio is 3:1 or greater and whose intermediate to minor axis ratio stands as 1.5:1 or less. No ellipsoid had a major to minor axis ratio of less than 2:1. The axis orientations of these 25 ellipsoids are plotted in Figure 7. All the major axes in this group have plunges of 60° or greater. This reflects the fact that, in general, depth is the most poorly controlled hypocenter coordinate. The orientation of the minor and intermediate axes are seen to be rather evenly distributed in azimuth compared to the orientations of the major axes. The majority of minor and intermediate axes have plunges of less than 20°. Thus, the majority of the earthquakes have error ellipsoids which are considerably elongated, with their axis of elongation plunging steeply to the northwest and north-northwest. The lengths of the major axes range from about 1 km to 2.4 km. These prob ably represent lower limits on the true errors and in any event should be interpreted only in relative terms. The major axis errors are a significant fraction of the apparent spatial extent of the sequence. The results of this error analysis indicate that there is a true lack of control of hypocenters along the major axis directions indicated in Figure 7. The approximate direction of hypocenter alignment (as determined from Figures 3 and 4b) is also indicated in Figure 7 by the the solid square. We believe this direction is close enough to the average direction of elongation of the error ellipsoids that the hypocenter alignment could be at least partially the result of the relatively poor control of hypocenters parallel to that elongation.
In an effort to reduce the error of relative location, with the hope that we might be able to detect a spatial structure which was less likely to be a product of location error, we relocated the earthquakes using the master event technique (Evernden, 1969), as applied to tightly grouped local earthquake sequences. Residuals from a single well-located earthquake were used in the location procedure as station corrections. The main shock of March 11 was used as the master event. Figure 8 is an epicenter map of the solutions obtained with the master event technique. Comparison with Figure 3 shows that the epicenters have generally become more tightly grouped, suggesting that the source area is smaller than previously indicated. There is an apparent alignment of epicenters trending NNW, much closer to the NNW nodal plane of Figure 5. Figures 9a and 9b are projections of the master event hypocenters onto vertical planes striking N70°E and N20°W, respectively. Comparison of Figures 4a and 9a show that the vertical alignment of hypo- centers is preserved. Comparison of Figures 4b and 9b also show that the distribution of hypocenters still seems to plunge in a linear alignment. A near-vertical fault plane trending north-northwest appears to be favored although the evidence is somewhat ambiguous, due to the small aftershock volume. Focal mechanisms for the master event locations, which are essentially identical to the initial mechanisms, are in accord with this conclusion. The i'dentical nature of the initial and master event mechanisms is not su- prising in light of the fact that the locations of most of the earthquakes were not changed by more than a kilometer or two.
We proceeded to calculate error ellipsoids for the master event solutions

and plotted the three axes of each ellipsoid on a stereo net (Figure 10). Twenty two (49%) of the master event ellipsoids were significantly elongated, with major to minor axis ratios of 3:1 or greater and intermediate to minor axis ratios of 1.5:1 or less. As was the case with the initial solutions, no ellipsoid had a major to minor axis ratio of less than 2:1.. The axes of these 22 ellipsoids are plotted on Figure 11. Once again, these ellipsoids have directions of elongation that plunge steeply (60° or greater) to the northwest and north-northwest. The other two axes of the ellipsoids are again distributed relatively evenly in azimuth with most plunging less than 20°. For the most part, the length of the major axes lie between .75 km and 1.5 km. These lengths should again be interpreted in relative terms. The approximate axis of hypocenter alignment (as determined from Figures 8 and 9b) is plotted as a solid square on Figure 11.
The alignment of epicenters and hypocenters obtained with the master event technique may well be a real feature of the spatial distribution of this sequence of earthquakes. Unfortunately, clear resolution of the problem for this case is not possible in.view of the small source region and the fact that the alignment that does exist is close to but not exactly in the direction of poorest location control. It is difficult to determine how different the alignment and location control bias must be before alignment may be regarded as a real feature of the distribution. However the focal mechanism evidence, when combined with the spatial alignment provides a stronger indication of the true fault orientation than either does alone. It is clear that both error ellipse calculation and master event locations are extremely valuable when evaluating the spatial distribution of tightly clustered hypocenters.
There is no geologic evidence for any through-going fault in this region along which these earthquakes might have occurred. This is not suprising in view of their depth and the glacial overburden which obscures the basement structure in this region. If the spatial arrangement of hypocenters is real, the area of fault surface involved is approximately 12-15 km2 (roughly 2.5x5km^) For either choice of conjugate fault planes the dominant component of motion is strike slip. The axis of maximum compression (P) has an azimuth of 32° and a plunge of 14° to the northeast. Other shallow earthquakes (depth less than 30 km) in the Puget Sound region seem also to result from a roughly north-south compression of the crust (Crosson, 1972).

References
Crosson, R.S. (1972). Small earthquakes, structure, and tectonics of the Puget Sound Region, Bull, of the Seis. Soc. Am. 62, 1133-1171.
Crosson, R.S. (1976). Crustal structure modeling of earthquake data, 1. simultaneous least squares estimation of hypocenter and velocity parameters, J. Geophys. Res. 74, 3036-3046.
Evernden, J.F. (1969). Identification of earthquakes and explosions by use of teleseismic data, J. Geophys. Res. 74, 3828-3856.
Flinn, E.A. (1965). Confidence regions and error determinations for seismic event location, Rev. Geophys. 3, 157-185.

CAPTIONS FOR FIGURES
Figure 1: Distribution of south Puget Sound sequence in time.
Figure 2: Epicenters in south Puget Sound for the years 1970-1977 (box contains area of 1978 sequence).
Figure 3: Map of initial epicenters of 1978 sequence.
Figure 4a: Projection of initial hypocenters onto a vertical plane striking N45°E.
Figure 4b: Projection of initial hypocenters onto a vertical plane striking N45°W.
Figure 5: Fault plane solutions for main shock using both linear and layered velocity models for the focal sphere projections (open circles = dilatation, closed circle = compression, P = axis of maximum compres sion, T = axis of maximum tension).
Figure 6: Lower hemisphere stereographic plot of the three principle axes ofthe error ellipsoids of all the initial hypocenter solutions. Solid square denotes direction of hypocenter alignment as determined from Figures 3 and 4b. All other solid figures denote two or more axes with essentially identical orientations.
Figure 7: , Same as Figure 6 except that only initial ellipsoids with major to minor axis ratios of 3:1 or greater and intermediate to minor axis ratios of 1.5:1 or less are plotted. Symbols as in Figure 6.
Figure 8-: Map of master event epicenters.
Figure 9a: Projection of master event hypocenters onto a vertical plane striking N70°E.
Figure 9b: Projection of master event hypocenters onto a vertical plane striking N20°W.
Figure 10: Lower hemisphere stereographic plot of the three principle axes of the error ellipsoids of all the master event hypocenter solutions. Solid square denotes direction of hypocenter alignment as determined from Figures 8 and 9b. Other symbols as in Figure 6.
Figure 11: Same as Figure 10 except that only master event ellipsoids with major to minor axis ratios of 3:1 or greater and intermediate to minor axis ratios of 1.5:1 or less are plotted. Solid square as in Figure 10. Other symbols as in Figure 6.

24222018enU
J
ID
C314
<*:S
lZ
UJ
OQ
21
64200
DIS
TR
IBU
TIO
N
OF
EflR
THQ
UflK
ES
IN
TIM
E
sBH
4080
120 160
200 TIME FROM FIRST
EVENT (OflYS)
240280

05 10 KM
FIGURE 2

MRG 0.0<M<1.0°
MRG 1 -0<M<2.0
MRG 2.0<M<3-0
MRG 3-0<M<4.0
O MRG 4-0<M0 5 KM
FIGURE 3

DE
PT
H
KM
CO
o
H Q a 8
Oo
en
CO
(X
)
G
o O
O
O
O
O
O
IA
IA
IA
IA
IA
A
A
A
A-P
=-
CO
f\
) *
O
O
O
O
G

NW SE
10
Q. LUQ
20
30 -10
O.O<M<I.O1.0<M<2.0 2.0<M<3.0
3.0<M<4.0
o
O
0
KM10
FIGURE 4B

FIGURE 5

A MINOR AXISO IN1EWEDIAIE AXISO WJORAXIS
FIGURE 6
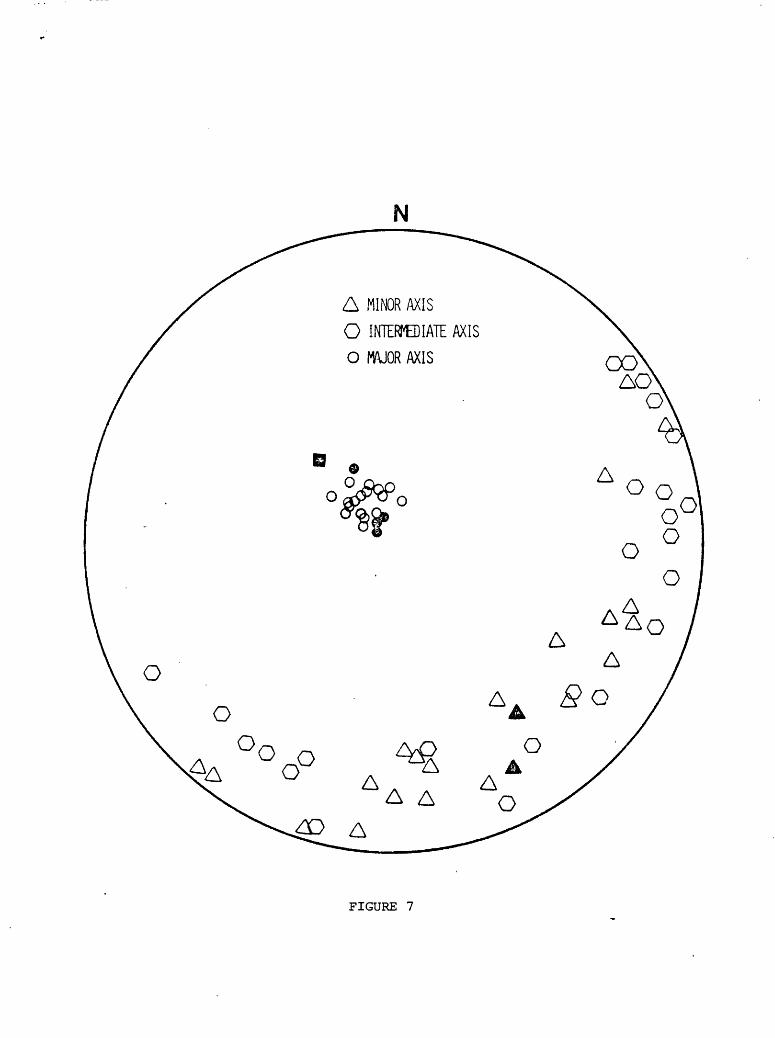
FIGURE 7

O MflG 0.0<M<1.0
MflG 1 .0<M<2-0
MflG 2.0<M<3.0
MflG 3.0<M<4.0
MflG 4.0<M
0 5 KM
FIGURE 8

DE
PT
H
KM
CO
hO
O
H 8
CO
K
)
G
o O
O
IAO
O
O
O
IA
IA
IA
IA
AA
A
C
O
K)
A
0000
O
G
G
Oen
S3

NW SE
10 -
a.uu Q
20
30
o
O
O.O<M<I.O1.0<M<2.0 2.0<M<3.0 3-0<M<4.0 4.0<M
O
O
-10 0
KMFIGURE 9B
10

FIGURE 10

FIGURE 11

APPENDIX E
Reports and Publications

Crosson, R.S., E.T. Erido, S.D. Ma lone, L.J. Noson, and C.S. Weaver, Eruption
of Mt. St. Helens: Seismology, Nature, 185., 529-531, 1980.
Crosson, R.S., Seismicity and tectonics of the Puget Sound region: Results
from the regional seismograph network. Earthquake Notes , 50.,
p58, 1980 (abs).
tloson, L.J., and R.S. Crosson, Compilation of earthquake hypocenters in
western Washington - 1978, Department of Natural Resources, Inf.
Circular 72, 18p, 1980.
Yelin, T., and R.S. Crosson, A significant sequence of earthquakes in south
Puget Sound, Earthquake Motes. 50. p61, 1980 (abs).