Embed Size (px)
Citation preview
1
Spring 2018Instructor: Kai Sun
ECE 522 Power Systems Analysis II
1 – General Background
2
Couse Outline•My contact:
– Office: MK612 Email: [email protected]
• Lectures: – 11:10‐12:25 on Tuesday and Thursday at MK419 (about 26 lectures)
• References:– P. Kundur, Power System Stability and Control, McGraw‐Hill, 1994– H. Saadat, Power System Analysis (3rd Ed), McGraw‐Hill, 2010 (ECE421/422 textbook)– EPRI Power System Dynamics Tutorial, EPRI, Product ID: 1016042, 2009
http://www.epri.com/abstracts/Pages/ProductAbstract.aspx?ProductId=000000000001016042
• Prerequisite: ECE421 ‐ Electric Energy Systems
• Course objectives:– Understanding basic approaches for power system modeling, analysis and control– A broad familiarity with engineering categories, criteria and control measures on power system
stability issues including small‐signal stability, transient stability and voltage stability– Knowledge in emerging techniques for planning and operating modern interconnected power
systems

3
Course Outline (cont’d)1. General background on modern power systems (2 lectures)
– Overview of grid operations and planning (NERC reliability criteria)
– Fundamental definitions and classification of power system stability
2. Power system modeling (10‐12 lectures)
– Synchronous machines (Park’s transformation; equivalent circuits; classic and detailed models; equations of motion)
– Loads (static and dynamic loads; acquisition of model parameters)
– Frequency regulation (governing systems; AGC)
– Voltage regulation (excitation systems; var compensators)
• Midterm exam in early march

4
Course Outline (cont’d)3. Power system stability problems and control measures (9‐10 lectures)
– Small‐signal stability (power oscillation; eigen‐analysis; measurement‐based modal analysis; power system stabilizer)
– Transient stability (direct methods; numerical methods and DSA)
– Voltage stability (voltage collapse; P‐V and V‐Q curves and other analysis methods; mitigation measures)
4. Emerging topics on grid operations and planning (2‐3 lectures)
– Synchrophasor‐based wide‐area monitoring and control
– Simulation and mitigation of cascading outages
– Integration of renewable resources
• Project presentation in late April
• Final exam
5
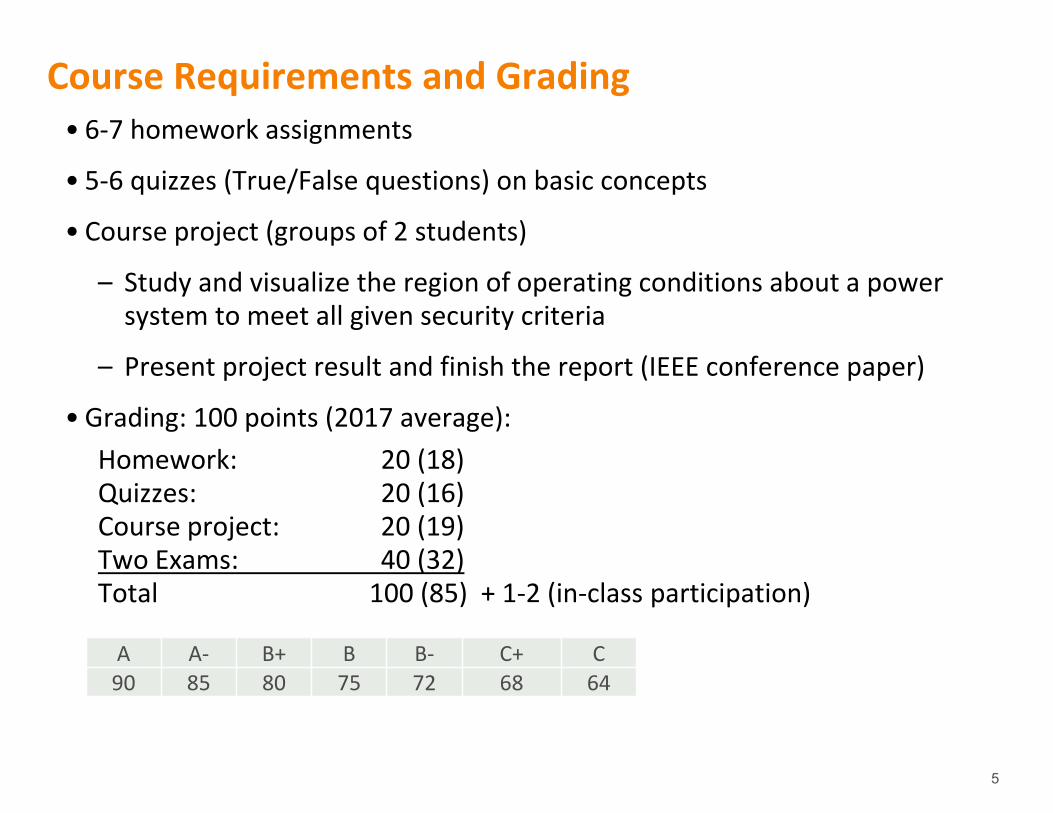
Course Requirements and Grading• 6‐7 homework assignments
• 5‐6 quizzes (True/False questions) on basic concepts
• Course project (groups of 2 students)
– Study and visualize the region of operating conditions about a power system to meet all given security criteria
– Present project result and finish the report (IEEE conference paper)
• Grading: 100 points (2017 average):Homework: 20 (18)Quizzes: 20 (16)Course project: 20 (19)Two Exams: 40 (32)Total 100 (85) + 1‐2 (in‐class participation)
A A‐ B+ B B‐ C+ C90 85 80 75 72 68 64
6
General Background: Outline
•Overview of power system operations and NERC reliability guidelines
•Introduction of power system stability (basic concepts, definitions and examples)
•Materials– Part I (Chapters 1&2) of Kundur’s book– IEEE/CIGRE Joint Task Force on Stability Terms and Definitions, “Definition and Classification of Power System Stability,” IEEE Transactions on Power Systems, Vol. 19, No. 2., pp. 1387 – 1401, May 2004 (must read this paper before next class)
– Reliability Standards for the Bulk Electric Systems of North America, NERC, December 2017
7
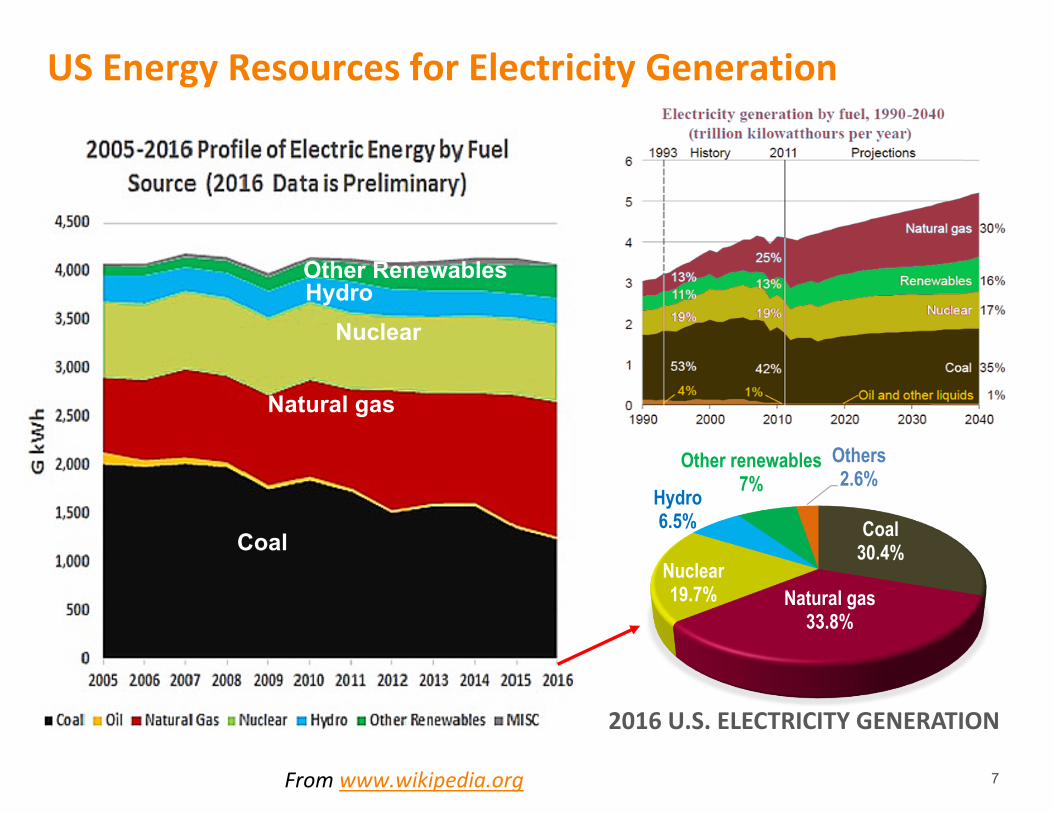
US Energy Resources for Electricity Generation
Coal30.4%
Natural gas33.8%
Nuclear19.7%
Hydro6.5%
Other renewables7%
Others2.6%
2016 U.S. ELECTRICITY GENERATION
From www.wikipedia.org
Coal
Natural gas
NuclearHydroOther Renewables

8

9
Reliability Challenges with Integration of Wind Power• Main challenges:
– Geographical and temporal mismatches between supply and demand
– Inaccuracy in short‐term wind forecasting and uncertainties in operating wind generation
– Decreased system inertia and frequency response• Some results as such as:
– Cost for building new transmission or for mitigating congestion with old transmission
– Additional cost for ramping flexibility and frequency control
Legend:
• Wind
• People

10
8GW
11GW10+ GW in 3 hrs
• “Duck Chart”: emerging issues in California (50% from renewables by 2030)– Two short steep ramps ~ 3‐4GW/hr starting around 4 AM and 4 PM– Oversupply risk (during the day with high solar energy) – Decreased frequency response (no AGC with renewables)
Reliability Challenges with Integration of Solar Power
Source: “What the duck curve tells us about managing a green grid,” CAISO Fast Facts, 2016

11
Structure of an AC Power System
Source: Green Transmission Efficiency Initiative: A Series of Workshops. EPRI PID 1019531, 2009.
• Generation– Low voltages <25kV due to
insulation requirements• Transmission system
– Backbone system interconnecting major power plants (11~35kV) and load center areas
– HV (<300): 161kV, 230kV– EHV: 345kV, 500kV, 765kV,
etc.• Sub‐transmission system
– Transmitting power to distribution systems
– Typically, 35/69kV‐138kV• Distribution system
– Typically, 4kV‐34.5kV

12
Electric Transmission Grids in North America
Sources: U.S. Energy Information Administration, based
on Energy Velocity.
13
NERC (North American Electric Reliability Corporation)
• As a non‐government organization, formed by the electric utility industry in 1968 to promote the reliability of bulk power systems in North America.
• Initially membership was voluntary and member systems followed the reliability criteria for planning and operating bulk power systems to prevent major system disturbances following severe contingencies
• As of June 2007, FERC (U.S. Federal Energy Regulatory Commission) granted NERC the legal authority to enforce reliability criteria with all users, owners, and operators of the bulk power systems in the U.S.
• NERC Membership is now mandatory and member systems comply with NERC’s Reliability Standards (approved by FERC) to both promote reliable operations and to avoid costly monetary penalties if caught non‐compliant. Every system operator should read, understand and follow NERC’s Reliability Standards. (Visit http://www.nerc.com for more information on NERC.)
14
Bulk Electric System (BES)• NERC definition: The Bulk Electric System (BES) is a term commonly applied to the portion of an electric utility system that integrates “all Transmission Elements operated at 100 kV or higher and Real Power and Reactive Power resources connected at 100 kV or higher” except for some exclusions.– Exclusions are such as radial systems, customer‐side generation/reactive power devices and local networks (<300kV)
• For short, a BES is the part of the transmission/sub‐transmission system connecting power plants, major substations, and HV/EHV transmission lines
•Most of power system reliability concerns are about a BES
• Another more general term is “Bulk Power System” (or Bulk‐Power System), which includes “facilities and control systems necessary for operating an interconnected electric energy transmission network (or any portion thereof) and electric energy from generation facilities needed to maintain transmission system reliability, … not including facilities used in the local distribution of electric energy.”

15
US Electric Industry Structure• 3,000+ utilities in the US in 1996. Fewer than 1000 engaged in power generation
Categories Examples
Investor‐owned utilities 240+ (360+ in 2015), 66.1% of electricity
AEP, American Transmission Co., ConEd, Dominion Energy, Duke Energy, Entergy, Exelon, First Energy, Florida Power & Light, Hawaii Electric Co., MidAmerican, National Grid, Northeast Utilities, Tampa Electric Co.,Oklahoma Gas & Electric, Pacific Gas & Electric (PG&E), Oncor, Southern California Edison, We Energies, Xcel Energy,
Publicly owned utilities 2000+, 10.7%
Nonprofit state and local government agencies, including Municipals, Public Power Districts, and Irrigation Districts, e.g. New York Power Authority (NYPA), Long Island Power Authority (LIPA),
Federally owned utilities~10, 8.2%
Tennessee Valley Authority (TVA), Bonneville Power Administration (BPA), Western Area Power Administration (WAPA), etc.
Cooperatively owned utilities ~1000, 3.1%
Owned by rural farmers and communities
Non‐utilities, 11.9% (increasing)
Generating power for own use and/or for sale in whole‐sale power markets, e.g. Independent Power Producers (IPPs) such as wind farm operators
E. F. Giles, K. L. Brown, “2015 UDI Directory of Electric Power Producers and Distributors,” (123rd Ed), Platts, McGraw Hill Financial, 2014

16
Transmission Owner
Deregulation: Competitive US Power Market Structure
• Government sets down rules and laws for market participants to comply with
• On electricity prices– Typically, determined by bid‐based,
security‐constrained, economic dispatch– In a day‐ahead market, the independent
system operator (ISO) determines a nodal price by matching offers from generation owners to bids from consumers at each node (internal or external) and calculating a supply‐demand equilibrium on the power‐flow model usually on hourly basis.
– A locational marginal price (LMP) is the weighted average of nodal prices calculated separately for each load zone.
– The real‐time market establishes the real‐time LMP by balancing the differences between day‐ahead commitments and actual demands.
Generation Owner
Generation Owner…Generation
Owner
Distribution Owner
DistributionOwner
ServiceProvider
ServiceProvider
…Distribution
Owner
ServiceProvider

17
Regional Transmission Organizations (RTO) and Independent System Operators (ISO)
California was the 1st
state to implement full deregulation

18
• In a traditional economic dispatch, actual fuel cost function Ci of each power plant is known by the system operator.
• In an electricity market, Ci depends on the bidding strategy and is unnecessarilty equal to the fuel cost.
11
1
5.3 0.008dC PdP
22
2
5.5 0.012dC PdP
33
3
5.8 0.018dC PdP
Equal incremental cost
19
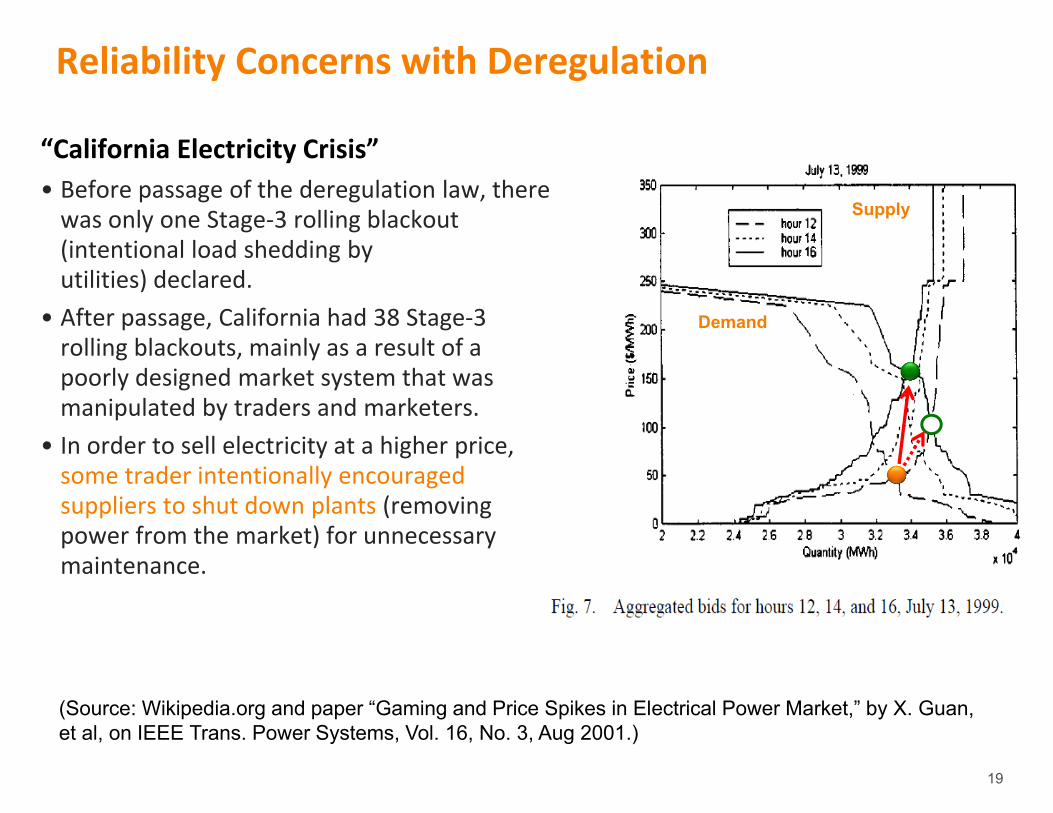
Reliability Concerns with Deregulation
Demand
Supply
“California Electricity Crisis”• Before passage of the deregulation law, there was only one Stage‐3 rolling blackout (intentional load shedding by utilities) declared.
• After passage, California had 38 Stage‐3 rolling blackouts, mainly as a result of a poorly designed market system that was manipulated by traders and marketers.
• In order to sell electricity at a higher price, some trader intentionally encouraged suppliers to shut down plants (removing power from the market) for unnecessary maintenance.
(Source: Wikipedia.org and paper “Gaming and Price Spikes in Electrical Power Market,” by X. Guan, et al, on IEEE Trans. Power Systems, Vol. 16, No. 3, Aug 2001.)
20
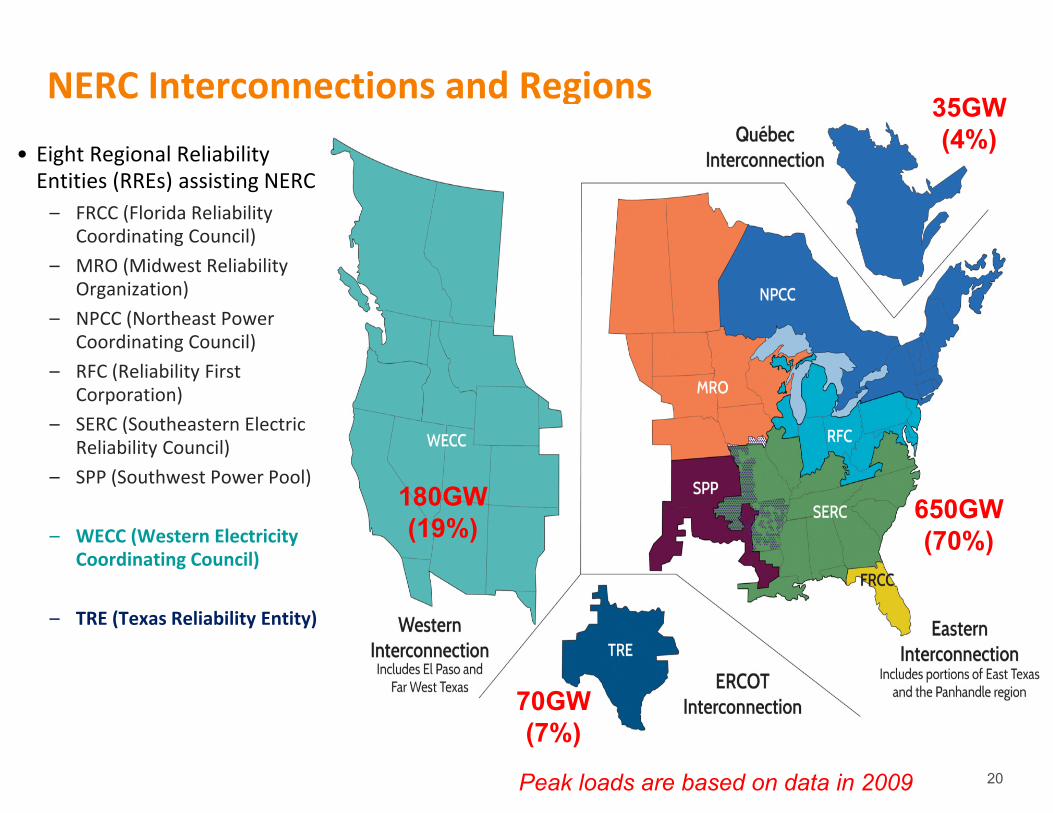
NERC Interconnections and Regions
650GW(70%)
180GW(19%)
70GW(7%)
35GW(4%)
Peak loads are based on data in 2009
• Eight Regional Reliability Entities (RREs) assisting NERC– FRCC (Florida Reliability
Coordinating Council)– MRO (Midwest Reliability
Organization)– NPCC (Northeast Power
Coordinating Council)– RFC (Reliability First
Corporation)– SERC (Southeastern Electric
Reliability Council)– SPP (Southwest Power Pool)
– WECC (Western Electricity Coordinating Council)
– TRE (Texas Reliability Entity)
21
22
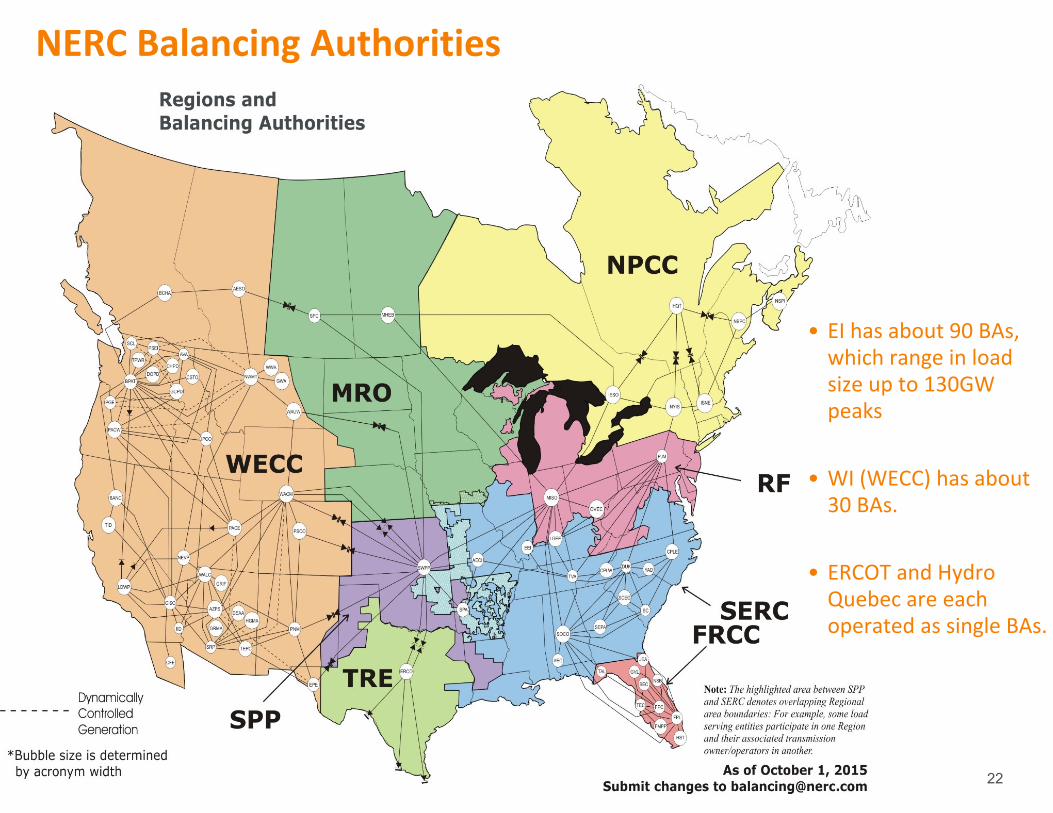
NERC Balancing Authorities
• EI has about 90 BAs, which range in load size up to 130GW peaks
• WI (WECC) has about 30 BAs.
• ERCOT and Hydro Quebec are each operated as single BAs.
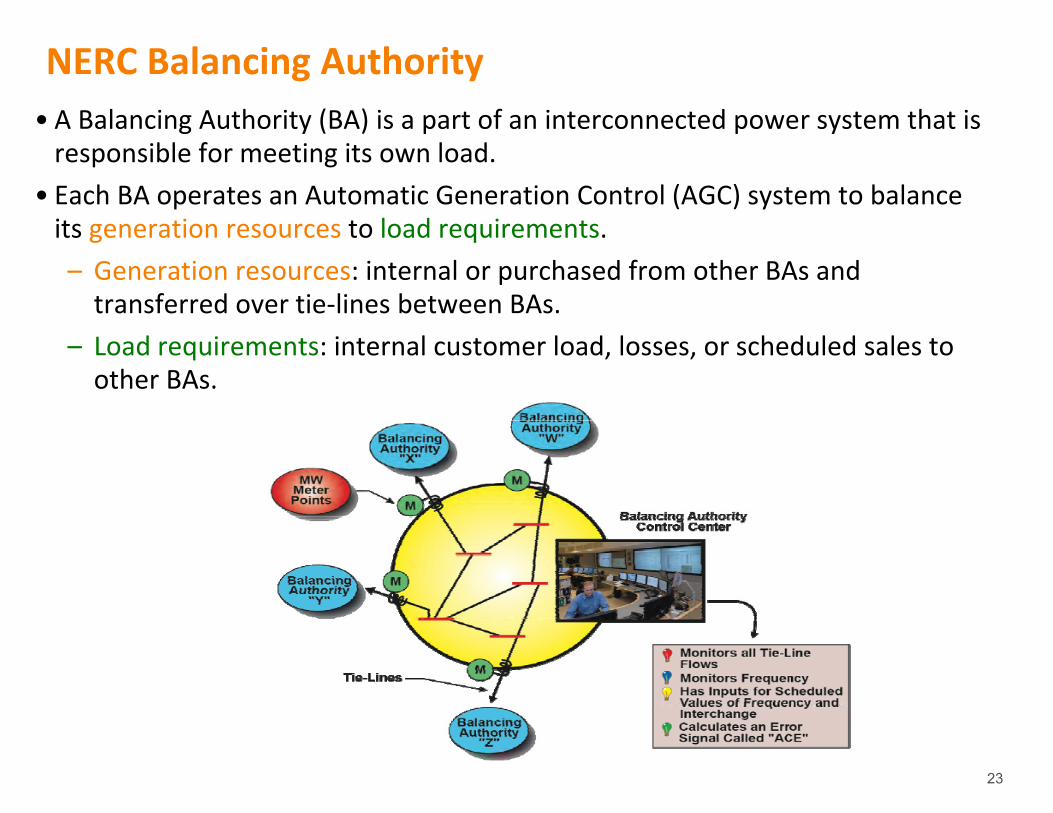
23
NERC Balancing Authority• A Balancing Authority (BA) is a part of an interconnected power system that is responsible for meeting its own load.
• Each BA operates an Automatic Generation Control (AGC) system to balance its generation resources to load requirements. – Generation resources: internal or purchased from other BAs and transferred over tie‐lines between BAs.
– Load requirements: internal customer load, losses, or scheduled sales to other BAs.
24
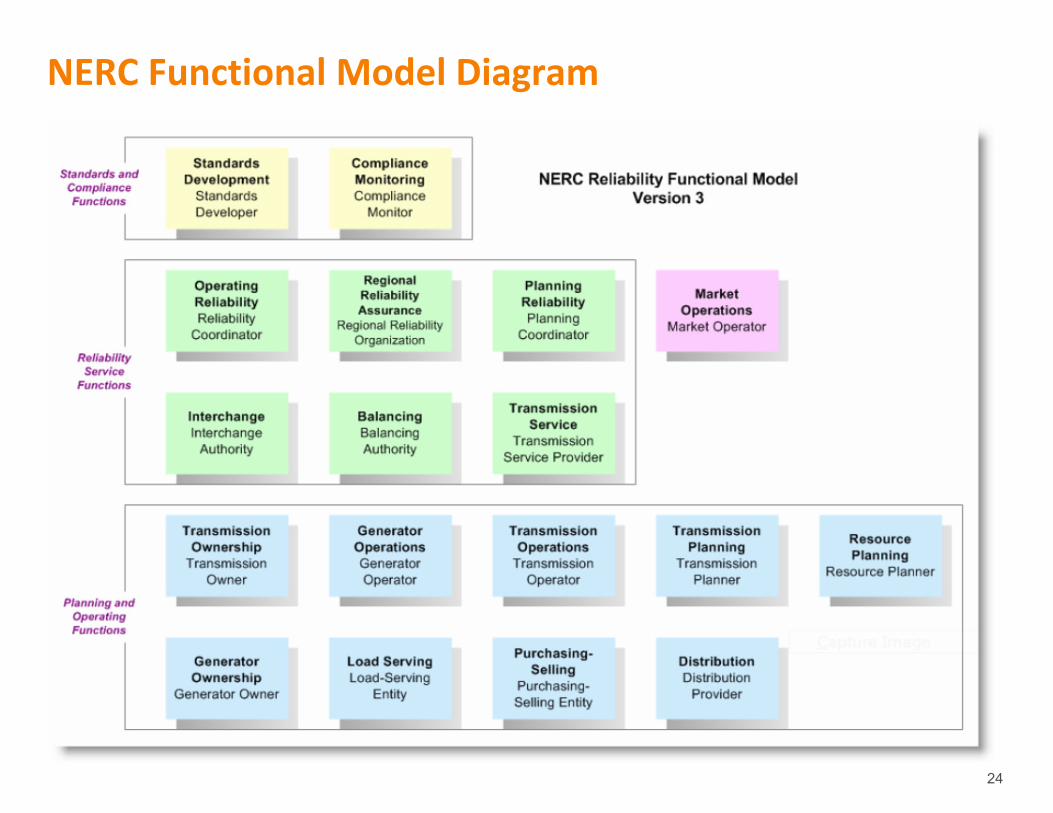
NERC Functional Model Diagram

![Transient Stability Analysis of VSC-HVDC Systems...- Control flexibility can bring better stability in power electronic based power systems Conclusions [1] P. Kundur, Power System](https://img.pdfslide.net/doc/110x75/5e844bdb6c7ae9575773d7e4/transient-stability-analysis-of-vsc-hvdc-systems-control-flexibility-can-bring.jpg)


![[Prabha Kundur] Power System Stability And Control.pdf](https://img.pdfslide.net/doc/110x75/563dbb68550346aa9aace5d3/prabha-kundur-power-system-stability-and-controlpdf.jpg)


![Retro tControl:LocalizationofControllerDesignand …tially distributed fashion. For example, in power systems control [Kundur, 1994], a system operator manages dis-tributed power plants](https://img.pdfslide.net/doc/110x75/5ecacbbe98ac0a61111418b9/retro-tcontrollocalizationofcontrollerdesignand-tially-distributed-fashion-for.jpg)