Embed Size (px)
Citation preview
Ecological Modelling 220 (2009) 2512–2524
Contents lists available at ScienceDirect
Ecological Modelling
journa l homepage: www.e lsev ier .com/ locate /eco lmodel
A concept model to estimate the potential distribution of the Asiatic citrus psyllid
(Diaphorina citri Kuwayama) in Australia under climate change—A means for
assessing biosecurity risk
J.P. Aurambout a,b,∗, K.J. Finlay b,c, J. Luck b,c, G.A.C. Beattie d
a Department of Primary Industries Victoria, 32 Lincoln Square North, PO Box 4166, Parkville, Victoria 3052, Australiab Cooperative Research Centre for National Plant Biosecurity, LPO Box 5012, Bruce, ACT 2617, Australiac Department of Primary Industries Victoria, 621 Burwood Highway, Knoxfield, Victoria 3684, Australiad Centre for Plant and Food Science, University of Western Sydney, Locked Bag 1797, Penrith South DC, NSW 1797, Australia
a r t i c l e i n f o
Article history:
Received 17 June 2008
Received in revised form 30 April 2009
Accepted 11 May 2009
Available online 17 June 2009
Keywords:
Dynamic modelling
Asiatic citrus psyllid
Diaphorina citri
Climate change
Citrus pest
Valencia orange (Citrus× aurantium L., syn.
Citrus sinensis (L.) Osbeck)
Citrus greening
Huanglongbing
STELLA
a b s t r a c t
Increasing global temperatures as a result of climate change are widely considered inevitable for Australia.
Despite this, the specific effects of climate change on Australian agriculture are little studied and the
effects on agricultural pests and diseases are virtually unknown. In this paper we consider the impact
of climate change on the Asiatic citrus psyllid (Diaphorina citri Kuwayama [Hemiptera: Psyllidae]); one
of two known vectors of huanglongbing (citrus greening); a debilitating disease which is caused in Asia
by a phloem-limited bacterium ‘Candidatus Liberibacter asiaticus’ (�-Proteobacteria). D. citri does not
occur in Australia, but if introduced would pose a major threat to the viability of the Australian citrus
industry and to native Citrus species. This paper presents an approach developed to understand how
climate change may influence the behaviour, distribution and breeding potential of D. citri. Here we
developed and describe an initial dynamic point model of D. citri biology in relation to its citrus host
and applied it to a scenario of increasing temperatures, as indicators of climate change, on a continental
scale. A comparison between model outputs for the three time frames considered (1990, 2030 and 2070)
confirms that increasing temperatures projected under climate change will affect the timing and duration
of new citrus growth (flush) necessary for psyllid development throughout Australia. Flushing will start
progressively earlier as the temperature increases and be of shorter duration. There will also be a gradual
southward expansion of shorter durations of the occurrence of flush. Increasing temperatures will impact
on D. citri both directly through alteration of its temperature dependant development cycle and indirectly
through the impact on the host flushing cycle. For the whole of Australia, a comparison between model
outputs for the three scenarios considered indicates the seasonality of D. citri development will change
to match changes in citrus flush initiation. Results indicate that the risk of establishment by D. citri is
projected to decrease under increasing temperatures, mainly due to shortened intervals when it can feed
on new leaf flushes of the host. However, the spatially heterogeneous results also suggest that regions
located on the southern coastline of Australia could become more suitable for D. citri than projected under
current temperatures. These results confirm the value of a linked host-pest approach as based on D. citri
climatic requirements alone the model would have accounted only for shorter development periods and
predicted an increased risk of potential distribution.
© 2009 Elsevier B.V. All rights reserved.
1. Introduction
The Asiatic citrus psyllid, Diaphorina citri Kuwayama
(Hemiptera: Psyllidae) is one of only two known vectors of
the debilitating citrus disease known as huanglongbing or citrus
∗ Corresponding author at: Department of Primary Industries Victoria, PO Box
4166, Parkville, Victoria 3052, Australia. Tel.: +61 3 8431 2431; fax: +61 3 9347 6056.
E-mail address: [email protected] (J.P. Aurambout).
greening (Aubert, 1987; da Graca, 1991; Halbert and Manjunath,
2004; Weinert et al., 2004). Huanglongbing has been identified
as one of the highest priority exotic pathogens of concern and
a major threat to the AUD$ 446 million per annum Australian
citrus industry (Dempsey et al., 2002; Johns, 2004; Australian
Citrus Growers, 2007). In regions closest to Australia (Asia and
New Guinea) the disease is caused by a phloem-limited bacterium
‘Candidatus Liberibacter asiaticus’ (�-Proteobacteria) (Jagouiex
et al., 1994). Infection leads to the production of small, lopsided,
unevenly coloured fruit that are bitter tasting and unmarketable.
0304-3800/$ – see front matter © 2009 Elsevier B.V. All rights reserved.
doi:10.1016/j.ecolmodel.2009.05.010
J.P. Aurambout et al. / Ecological Modelling 220 (2009) 2512–2524 2513
It also causes chlorosis, tip dieback and reduced foliage which
eventually leads to tree death (Barkley and Miles, 2006; Bové,
2006; Stokstad, 2006).
The disease does not occur in Australia (Davis et al., 2000;
Bellis et al., 2005) but occurs throughout Asia (Pakistan, India,
Bangladesh, Nepal, China [including Hong Kong and Taiwan] Japan,
the Philippines, Malaysia, Thailand, the Indonesian Archipelago,
Timor Leste) and New Guinea (da Graca, 1991; CAB International,
2002; Weinert et al., 2004; Davis et al., 2005).
The psyllid was recorded in Australia at Stapleton (13◦11′ S,
131◦01′ E), Northern Territory in 1915. The host was not reported
but was most probably a species or hybrid of Citrus. Natural
hosts of D. citri include species and varieties of Citrus (Rutaceae:
Aurantioideae) and some closely related species within the tribes
Aurantieae (=Citreae) and Clauseneae (Halbert and Manjunath,
2004). It has not been recorded since and is assumed to have
been eradicated by chance during the 1916–1922 eradication cam-
paign for citrus canker, Xanthomonas citri subsp. citri (ex Hasse
1915) (Pseudomonadales: Pseudomonadaceae), when all cultivated
citrus species and hybrids north of 19◦S were destroyed (see
Mertin, 1952; Hollis, 2004; Bellis et al., 2005). Re-introduction
and establishment of D. citri together with an incursion of huan-
glongbing would severely affect citrus production in Australia
if both the vector and the disease became widespread, as well
as harm susceptible plants grown in home gardens, citrus and
ornamental nurseries, and rare and endangered native species of
Citrus.
The highest risk pathway for the entry of the disease and/or
vector into Australia includes illegally imported citrus material car-
ried by travellers (Evans and Dempsey, 2000; Naumann, 2002).
Passive transport of psyllids by aircraft, unregulated boat traf-
fic across the Torres Strait separating Indonesia from Australia,
wind-borne infective vectors and agri-terrorism are other likely
pathways of introduction into Australia (Beattie and Barkley,
2009).
Furthermore, the Australian climate has been assessed as suit-
able for establishment and spread of the psyllid. Bioclimatic
modelling has shown that under historical temperatures, D. citri
could survive in more than 50% of Australia’s citrus growing regions
were it to become established (Beattie, 2002).
The disease is considered extremely difficult to control and
there is no evidence, other than fortuitously in the Northern Ter-
ritory, of successful eradication of D. citri (Johns, 2004). The two
known primary parasitoids of D. citri, the ectoparasitoid Tamarixia
radiata (Waterston) (Hymenoptera: Eulophidae) and the endopar-
asitoid Diaphorencyrtus aligarhensis (Shafee, Alam and Agarwal)
(Hymenoptera: Encyrtidae), do not occur in Australia. However,
native polyphagous and non-host specific predators may poten-
tially affect the vector although it is uncertain the extent to which
these would constrain its distribution.
Overlaying these factors is the unknown extent to which pests
and diseases will respond to a changing climate. Climate change
has been identified as likely to alter the risks associated with the
biosecurity of Australian agriculture (Aurambout et al., 2006) with
the regions affected and magnitude of changes determined by the
spatial heterogeneity of weather patterns over the Australian land-
scape. Our approach aspired to identify the potential response of a
pest to climate change through modelling, with the goal that the
results could be incorporated into plant biosecurity management
and contingency planning.
The purpose of this paper, therefore, is to describe the develop-
ment of an initial dynamic point model, which could be spatialised
over Australia. We aimed to determine the geographical extent,
intensity, timing and phenology of D. citri in association with its cit-
rus host using increasing temperatures as an indicator of projected
future climates. The outcome of this concept model is intended to
inform consideration of how useful such scenario-based analyses
could be for operational decision-making.
2. Background
2.1. Climate change in Australia
The accumulation of atmospheric greenhouse gases is con-
sidered the cause of global warming and the increase in the
average temperature of 0.7 ◦C over Australia during the last century
(Salinger, 2005). Global climate models (GCM) have been devel-
oped to identify, project and anticipate the possible changes in the
resulting climate and weather patterns.
The latest projected climate change trends for Australia have
been published by the Commonwealth Scientific and Indus-
trial Research Organisation (CSIRO and Australian Bureau of
Meteorology, 2007) and the Intergovernmental Panel on Climate
Change Fourth Assessment Report (IPCC, 2007). Annual average
temperature increases of approximately 1 ◦C (0.7–0.9 ◦C in coastal
areas and 1–1.2 ◦C inland) are projected by 2030 for a mid-range
(A1B) emission scenario (Nakicenovic and Swart, 2000). The effect
of warming is projected to be lower in winter than in other sea-
sons, and on the coasts as opposed to inland, with the exception
of north-west Western Australia. Best estimates across all emission
scenarios indicate that warming of at least 0.4 ◦C is expected over
all of Australia and up to 1.8 ◦C in some inland regions.
By 2050, warming over Australia is projected to range from 0.8
to 2.8 ◦C taking into account all the variation from low (B1) to high
(A1FI) emission scenarios (Nakicenovic and Swart, 2000) with best
estimates of temperature increases of 1.2–2.2 ◦C, respectively pro-
jected. As with 2030 estimates, less warming is expected in the
south and north-east of the country and more warming inland.
There are likely to be changes in daily temperature extremes
resulting in more hot days (>35 ◦C) over summer. Maximum tem-
peratures are projected to increase by more than 5% of the mean
over Western Australia, coastal areas and Tasmania. Fewer cold days
(<0 ◦C) are also projected, with an accompanying decrease in frost
frequency over the whole of Australia, particularly in the south over
spring and summer.
By 2030, annual precipitation is expected to remain stable in the
far north and decrease by 2–5% over most of southern and eastern
Australia, particularly in winter and spring. By 2070, precipitation
ranges are projected to be larger and more variable. The range of
annual precipitation change for low to high emission scenarios,
respectively, is projected to be from −20% or −30% up to +10% or
+20% in central, eastern and northern areas. In the south, the pro-
jected change varies between−30% and +5% with a best estimate of
−10%. Projected rainfall decreases in the south-west in winter and
spring could be as low as −30% or −40%.
Changes in rainfall patterns are projected to result in greater
frequency of unusual excesses or deficits. Extreme precipitation
events are more likely in the north, compared to the south, but are
nevertheless projected to be relatively widespread in summer and
autumn. Drought conditions are projected to increase over most
of Australia with a higher likelihood predicted for the south-west.
Average wind speed is considered likely to increase in most coastal
areas by 2.5–7.5% by 2030 and 10% over most of Australia by 2070,
with the exception of around 30◦S in winter and 40◦S in summer
where deceases to slight increases are expected in concert with a
southward contraction of westerlies.
Maps of future Australian climate can readily be accessed
for different climate change forcing scenarios, through
climate scenario generators such as Ozclim 2.01 beta
(http://www.cmar.csiro.au/ozclim/index.html), created by CSIRO’s
Atmospheric Research Group.
2514 J.P. Aurambout et al. / Ecological Modelling 220 (2009) 2512–2524
Table 1Female D. citri egg production rate as a function of temperature (Liu and Tsai, 2000).
Temperature (◦C) Total eggs laid per
life time
Total egg production
per 5 daysa
15 171 9.68
20 494 48.81
25 626 78.84
28 748 111.64
30 316 55.05
33 67 6.00
a Estimated by relating the D. citri lifetime fertility with D. citri adult survival rate
(Table 4).
2.2. Biology of the Asiatic citrus psyllid
The importance of D. citri is its ability to transmit huanglongbing,
one of the world’s most serious citrus diseases (Bové, 2006). It has
shown to be an effective vector of the disease (Capoor et al., 1967)
due, in part, to its short life cycle and high fecundity (Husain and
Nath, 1927).
Development times from egg to adult for the Asiatic citrus
psyllid, D. citri, have been recorded from field observations in
India at 15–47 days depending on time of year and host plant
(Husain and Nath, 1927; Chavan and Summanwar, 1993). Similar
developmental periods were observed under artificially controlled
temperature conditions on orange jasmine, Murraya paniculata (L.)
Jack (probably M. paniculata var. exotica), sensu Huang (Auran-
tioideae: Aurantieae): 14.1 days at 28 ◦C and 43.5 days at 18 ◦C(Liu and Tsai, 2000) and Rangpur lime (Citrus× limon (L.) Osbeck):
15.4 days at 28 ◦C and 43.5 days at 18 ◦C (Nava et al., 2007). Opti-
mal temperatures for population growth under artificial conditions
have been reported at 24–28 ◦C (Liu and Tsai, 2000; Fung and Chen,
2006).
Fecundity was also significantly affected by temperature
(Table 1) with the highest average number of eggs (748) laid at
28 ◦C and declining rapidly thereafter in artificial controlled tem-
perature trials (Liu and Tsai, 2000). In citrus orchards at Lyallpur
in the Punjab region of India, now Faisalabad in Pakistan, Husain
and Nath (1927) observed that numbers of eggs laid by individual
D. citri females on tender shoots enclosed in sleeve cages during
spring ranged from 407 to 807.
Eggs are only laid on fresh growth (referred to as flush), usu-
ally in the folds of half-opened leaves, axils of leaves, pushed in
between the buds and stem or petioles of leaves and auxillary buds.
They are also laid scattered about on the upper or lower surfaces
of the leaves and on tender stem. They are not laid on older tough
leaves or stems even in the absence of tender shoots. When too
many eggs have been laid at the bottom of a folded or half-opened
leaf, a few eggs may lie loose, simply glued on to the surface of
a leaf (Husain and Nath, 1927). Flush growth <6 mm in length is
preferred to longer flush lengths: numbers of eggs laid on a flush
decline rapidly as the length of flush increases, and when individ-
ual leaves attain lengths >10 mm, and flushes 50 mm (Lin et al.,
1973; Chen and Liao, 1982; Leong, 2006). The insect has five lar-
val instar stages, all of which are relatively sedentary and generally
only move in response to overcrowding (Husain and Nath, 1927).
D. citri nymphs and adults feed on the phloem of citrus and other
hosts in the Rutaceae sub-family Aurantioideae, particularly orange
jasmine. Feeding, particularly that associated with heavy popula-
tions of nymphs, can lead to the production of a copious wax-like
honeydew which can pre-dispose the tree to fungal pathogens such
as sooty mould (Husain and Nath, 1927).
Husain and Nath (1927) reported that eggs, nymphs and adults
occurred throughout the year in the Punjab. The density of D. citri
populations is dependant on temperature and the availability of
suitable growth flushes (Husain and Nath, 1927; Aubert, 1987), with
the psyllid having a high reproductive potential and rapid popula-
tion increase in favourable conditions (Aubert, 1987).
The number of generations varies according to conditions and
location. Nine to 16 generations per year have been reported in the
Punjab (Husain and Nath, 1927), between 6–11 in China (Yang et al.,
2006), 8–9 in Taiwan (Lin et al., 1973), and 9–10 in Florida (Mead,
1977).
Adult psyllids are not strong fliers and will leap short distances
when disturbed (Husain and Nath, 1927). They typically fly short
distances (3–5 m) from one tree to the other (Aubert and Xia, 1990)
and have been recorded to move over distances of 25–30 m when
disturbed (Gottwald et al., 1991) and between 0.5 and 1 km aided
by stratiform wind drift (Aubert and Xia, 1990).
Sakamaki (2005) speculated that migration of the psyllid in the
Okinawan Islands in southeast Japan is governed by seasonal winds.
He considered it possible for the psyllid to migrate 470 km north-
wards to the large island of Kyushu over sea by riding lower jet
airstreams (geostrophic movement) associated with summer mon-
soons. Gottwald et al. (2007) speculated that D. citri may have been
carried some 90–145 km by wind over non-citrus growing regions
in Florida. Although not conclusive, they considered that this long-
distance movement may have been related to air masses during
hurricanes or tropical storms. Halbert et al. (2008) considered the
distance traversed to be at least 67 km across the Florida Everglades.
Evidence for long distance dispersal of psyllids by air currents asso-
ciated with tropical cyclones was also observed in relation to the
introduction of the leucaena psyllid, Heteropsylla cubana Crawford
(Psyllidae), from the Western Pacific into Australia (Bray and Sands,
1987; Beattie and Barkley, 2009).
3. Methods
3.1. Principle of modelling approach
A variety of modelling techniques and tools have been used
in the literature to investigate the potential distribution of plants
and animals as a result of changes in climatic conditions or their
introduction outside of their native geographical range. Climate
mapping approaches, based on Hutchinson ecological niche the-
ory (Hutchinson, 1957) have been widely applied, particularly to
study the potential distribution of insects and pathogens (Baker et
al., 2000). A large variety of computer programs such as CLIMEX
(Sutherst and Maywald, 1985), BIOCLIM (Busby, 1991), HABITAT
(Walker and Cocks, 1991), DOMAIN (Carpenter et al., 1993) and
SPECIES (Pearson et al., 2002) are available. These programs match,
through various procedures, current climatic parameters to species
current distribution in order to determine its climatic envelope.
However, despite the demonstrated usefulness of climate map-
ping to determine species maximum limits of establishment (Baker
et al., 2000) this approach does not typically take into consideration
elements such as the timing of development of organisms, specific
life stages, or the size of populations, which can be important factors
to determine the threat presented by an organism to an ecosystem
or agricultural industry.
Climate mapping approaches have also been criticised for their
lack of consideration of species interactions, dispersal, availability
of food and synchrony with host (Davis et al., 1998).
Phenological models, incorporating multiple life stages and
detailed life history characteristics of both insects and plants have
also been widely used. However, as with climate mapping, many
phenological approaches have focused on modelling one organ-
ism at a time, assuming permanent food or host availability (Gray,
2004; Yonow et al., 2004; Trnka et al., 2007). The structure of
phenological models tend to be much more complex than that
of climate mapping models and their design requires availabil-
J.P. Aurambout et al. / Ecological Modelling 220 (2009) 2512–2524 2515
ity of species-specific data such as birth, development and death
rates. The inherent complexity in those models makes their under-
standing and modification by non-modellers very difficult. This is
especially the case for models developed in complex programming
languages such as Java used by Parry et al. (2006) and FORTRAN
or C++. The use of modular modelling software packages such as
DYMEX, used by Yonow et al. (2004) or STELLA, used by Costanza
and Voinov (2001) can help simplify model building and modifica-
tion and make them more easily understood.
The approach used to develop our model is similar to the one
presented in detail by BenDor et al. (2006) making use of the STELLA
modelling platform in combination with a spatial modelling envi-
ronment (SME). We modelled factors influencing D. citri population
variation and interactions with its host in relation to temperature,
using an insect-host linked model developed in STELLA 9.01 system
dynamic (Costanza and Voinov, 2001). Although it lacked biological
functions libraries such as are used in DYMEX, STELLA was preferred
for its capacity to create and present models using a mathematical
underlying framework through stock-flow feedback relationships.
Model communicability and accessibility was very important in
our approach as our model was designed so it could be used and
understood by decision makers.
SME (Maxwell and Costanza, 1997) was used to incorporate
the dynamics of our model into a spatial array of Australian cli-
matic maps. It allowed the creation of a matrix of spatially specific
dynamic D. citri-citrus host models. This approach, combining the
STELLA and SME modelling platforms is, to our knowledge, one
of the few to combine the capacity to associate phenology and
population dynamics with spatially explicit climatic data, while
representing the model dynamics and feedbacks in an easily com-
municable way.
3.2. Data preparation and model runs
Equations for the D. citri-citrus model were created in STELLA
9.01, exported in text format, and then imported and com-
piled into SME (for detailed methodology on how to develop
a model in SME using the equations from a model devel-
oped in STELLA, see “my first SME model” from the Integrated
Dynamic Environmental Assessment and Simulation workgroup at
http://www.uvm.edu/giee/IDEAS/sme/First Model.html). The SME
model obtained was then configured to expand the D. citri-citrus
host dynamics over a geographic information system (GIS) grid of
Australia.
The spatial climatic data used as input for the D. citri-citrus host
model were obtained from the software ‘Ozclim’, which provides
Australia-wide grid outputs for a range of future monthly climatic
variables (minimum temperature, mean temperature, maximum
temperature, point potential evaporation, precipitation and vapour
pressure) for a selected set of years and various global tempera-
ture change scenarios and climate change sensitivity patterns. The
minimum and maximum temperature data for each month, of each
year considered, was exported into the ArcInfo .asc format and then
edited to an SME readable format. The model was run on an IBM
eServer Linux Cluster1350 with 4 GB Memory and Dual 2.8 GHz
Intel Xeon Processors. The model outputs, produced in .asc format
were then geo-referenced and imported into ArcGIS 9.2 for analysis.
3.3. Model structure
Our approach was developed using the concept of the plant dis-
ease triangle (Stevens, 1960; Agrios, 2005) which indicates that
the successful development of a pest or pathogen requires the
interaction of host (in this case tender flush growth of Valencia
orange, Citrus× aurantium L. syn. Citrus sinensis (L.) Osbeck), pest or
pathogen (in this instance D. citri) and a favourable environment.
Estimation of the successful development of D. citri was determined
through a citrus flushing model linked with a D. citri population
model driven by temperature parameters and running on a daily
time step.
For the purpose of this model, we used temperature as the con-
trolling factor for development of D. citri. This model assumption is
consistent with reports that indicate that although relative humid-
ity and rainfall have an influence on D. citri development (Aubert,
1987), ambient temperatures are the most important environmen-
tal factor limiting its distribution (Yang et al., 2006). We assumed
that temperatures were also driving the frequency with which cit-
rus trees produce new leaf flush.
3.3.1. Daily temperature simulation model
Our climatic year started on 1 July and finished on 30 June in the
southern Hemisphere mid-winter. Daily temperatures were simu-
lated through the use of a random function taking values between
a minimum (Tmin) and maximum temperature (Tmax) specified for
each month.
The spatial data input for each monthly temperature range
was obtained from 50 km resolution climate data of the mini-
mum and maximum average monthly temperatures for the years
1990, 2030 and 2070. These data were created in Ozclim using
the Special Report on Emission Scenarios (SRES) mid-level emis-
sion scenario A2 (Nakicenovic and Swart, 2000) and the CSIRO
DARLAM 125 km climate change pattern converted into a SME
readable format using the method defined by the Integrated
Dynamic Environmental Assessment and Simulation workgroup
(http://www.uvm.edu/giee/IDEAS/sme/First Model.html).
Growing degree days (GDD), essentially physiological time,
influencing the development rate of D. citri and the new flush pro-
duction rate of the citrus host, were calculated using formula 1
below:
DHC =(∑1
t=0Random(Tmax, Tmin)× DT
)− Tth (1)
where DHC is daily heat contributions, DT is the model Delta Time
and Tth is the temperature threshold above which development
occurs.
3.3.2. Valencia orange (Citrus× aurantium) flush model
New shoot growth of most citrus occurs in clearly delimited
episodes (flushes) ranging from two flushes in cool climatic con-
ditions to three to five flushes in subtropical areas (Spiegel-Roy
and Goldschmidt, 1996). The spring flush is the largest and most
important producing both vegetative and reproductive shoots while
subsequent flush or flushes produce mostly vegetative growth
(Spiegel-Roy and Goldschmidt, 1996). In the “Mediterranean” cli-
mate of the major citrus growing regions of south-east Australia
three flushes generally occur per year; the main flush is in spring
followed by smaller flushes generally in the summer and autumn
(Hutton, 2004).
Availability of precise flushing cycle dates for citrus in Australia
are limited. Flushing dates used as the basis for development of
this model were taken from an extensive study of the water use
efficiency of Valencia orange trees grown at the Yanco Agricultural
Institute in New South Wales (34◦36′S, 146◦25′E), an inland irri-
gated citrus growing region of south-east Australia (Hutton, 2004).
Our model was developed around the assumption that the
accumulation of GDD governed the timing and growth of cit-
rus flush. The physiological age at which each bud break (flush
initiation) and end of elongation (hardening) occurred were
derived from the approximate dates measured by Hutton
(2004) by relating them with the mean 1970–2000 tem-
perature records for the closest weather station to Yanco
2516 J.P. Aurambout et al. / Ecological Modelling 220 (2009) 2512–2524
Table 2Growing degree day thresholds associated with the initiation and hardening of sweet
orange citrus flushes (simulation year starts 1st July).
Seasonal flush GDDa threshold to
initiate the growth
of fresh tissues (◦C)
GDD threshold to
initial tissue
hardening (◦C)
Spring flush 10.1 390.8
Summer flush 1042.8 1336.0
Autumn flush 1435.0 1671.5
a Growing degree days the sweet orange were accumulated on the basis of a 12.8 ◦Cdegree growing threshold (Catling, 1970).
with contemporary climate records (Narrandera Golf Club;
http://www.bom.gov.au/climate/averages/tables/cw 074221.shtml).
According to Hutton (2004) the main spring flush at Yanco starts
between mid and late August, and ends between late November and
early December. A second flush occurs in the summer, beginning
between late January to early February, and ending in late Febru-
ary, and a third flush occurs in autumn, starting in early March
and ending in early April. These dates were translated into Julian
days under the assumption that “early” corresponded to the period
from the 1st to the 10th of the month, “mid” from the 10th to the
20th and “late” from the 20th to the 30th of the month. Due to the
imprecision of dates the timing of each flushing cycle (initiation
and hardening) was recorded as a time bracket rather than a fixed
date therefore each flushing cycle was associated with an earliest
and latest possible date.
The estimation of the physiological age thresholds controlling
each flushing cycle (Table 2) were calculated through the use of a
STELLA model. This model, based on the daily temperature simula-
tion model described above (Section 3.3.1), calculated for each day
the accumulation of GDD since the start of the year, on the basis of
a 12.8 ◦C DHC temperature threshold (Catling, 1970).
The model was set to record accumulation of GDD obtained
for each earliest and latest possible date of the associated flush-
ing cycle. Due to our use of a stochastic temperature generation
model, the GDD accumulation for each date was different for each
model run. GDD threshold values triggering flush initiation and
tissue hardening were calculated using formula 2 below:
GDDthreshold =∑40
iteration=1
(∑earliest
day=1DHC+∑latest
day=1DHC
)/2
40
(2)
where iteration refers to the number of model iterations. Earli-
est and latest refer to the earliest or latest possible dates for each
flushing cycle. The calculations incorporated an average of 40 years
simulation.
Vegetative shoot growth patterns were studied in long-term
field trials at Yanco (Hutton, 2004). Measurements taken over two
growing seasons gave an average number of shoots per tree of 60.5,
16.5 and 8.8 for the spring, summer and autumn flushes, respec-
tively. Multiplied by the mean number of leaves per shoot (8.2)
this gives a total of 496 new flush points for the spring flush, 135
for the summer flush and 72 per autumn flush. A distinct flushing
sub-model was created for each flushing cycle occurring in spring,
summer and autumn.
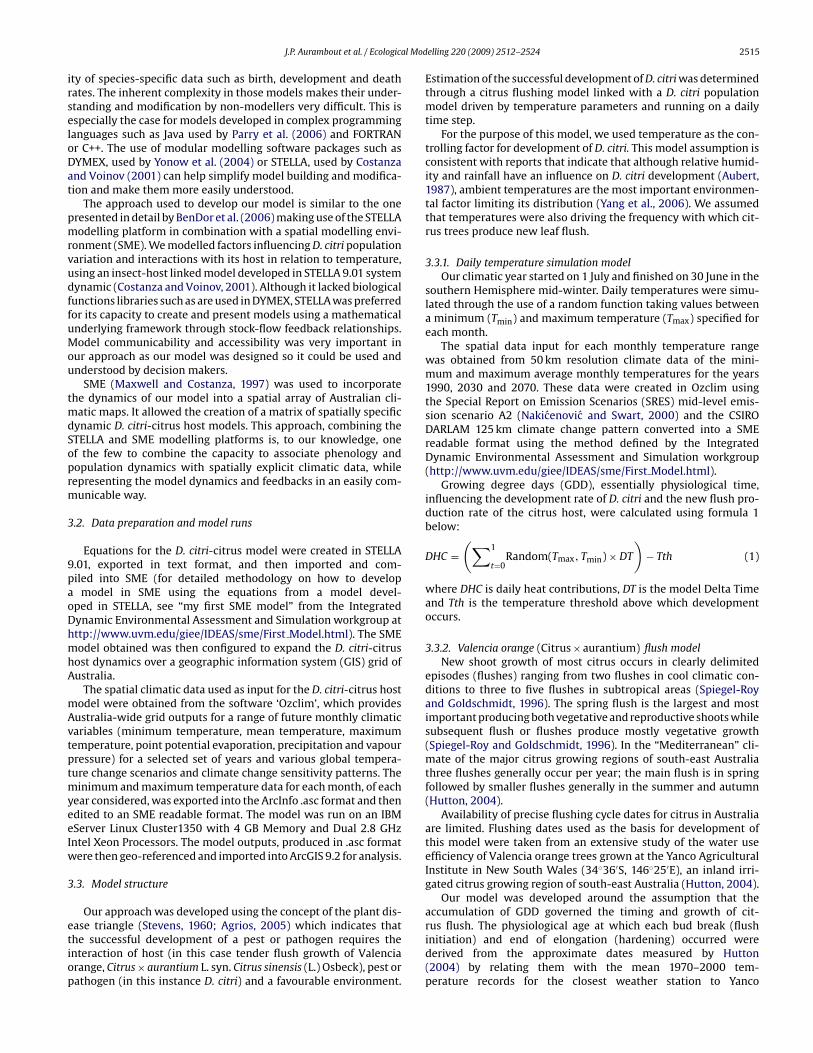
For the purpose of this model, citrus flushing was determined
to have three distinct non-overlapping stages: (1) buds, initi-
ated on the first day of each simulation year and controlling
the number of possible flushes, (2) fresh tissues on which D.
citri eggs are laid and larvae develop and (3) hardened tissues,
unsuitable for the development of D. citri larvae. Fresh tissues
emerge from buds once the accumulation of GDD reaches the
budding thermal threshold (Table 2). Similarly, fresh tissues grow
into hardened tissues once the accumulation of GDD reaches
the growth thermal threshold (Table 2). To avoid creating unre-
alistically long lasting flushes all remaining fresh tissues at the
end of the simulation year were set to 0. Fig. 1 illustrates the
translation of the citrus flushing cycle into a STELLA stock-flow
diagram.
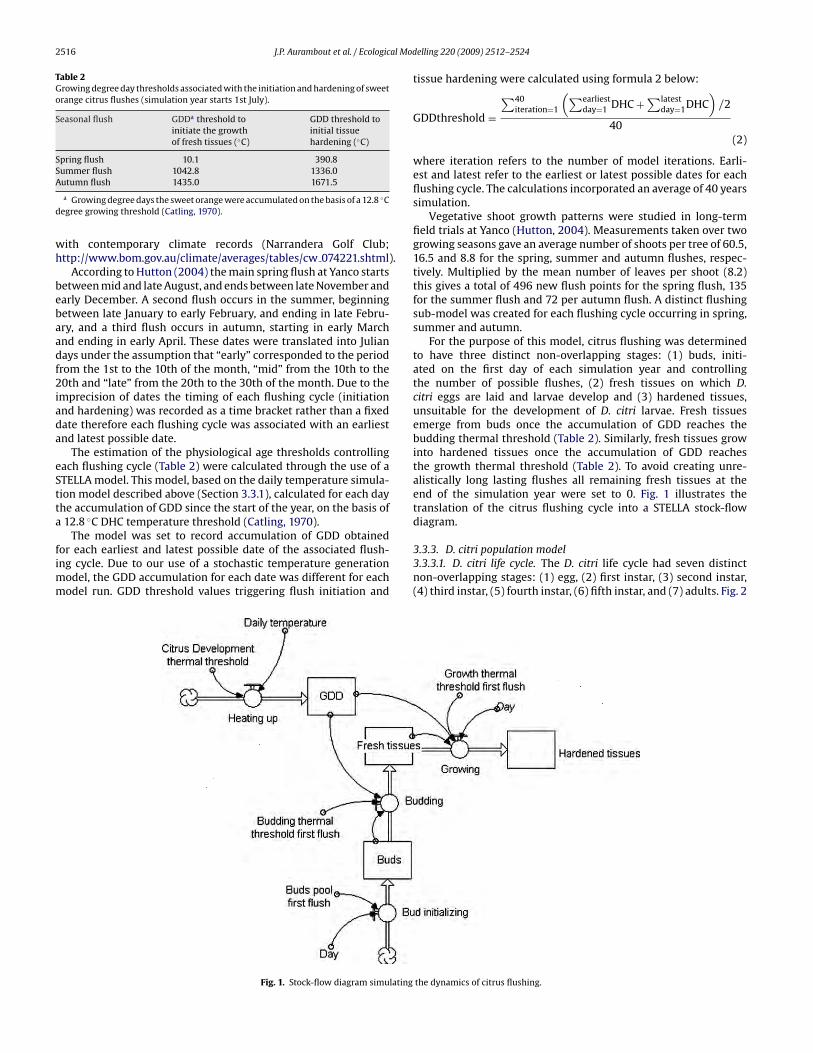
3.3.3. D. citri population model
3.3.3.1. D. citri life cycle. The D. citri life cycle had seven distinct
non-overlapping stages: (1) egg, (2) first instar, (3) second instar,
(4) third instar, (5) fourth instar, (6) fifth instar, and (7) adults. Fig. 2
Fig. 1. Stock-flow diagram simulating the dynamics of citrus flushing.
J.P. Aurambout et al. / Ecological Modelling 220 (2009) 2512–2524 2517
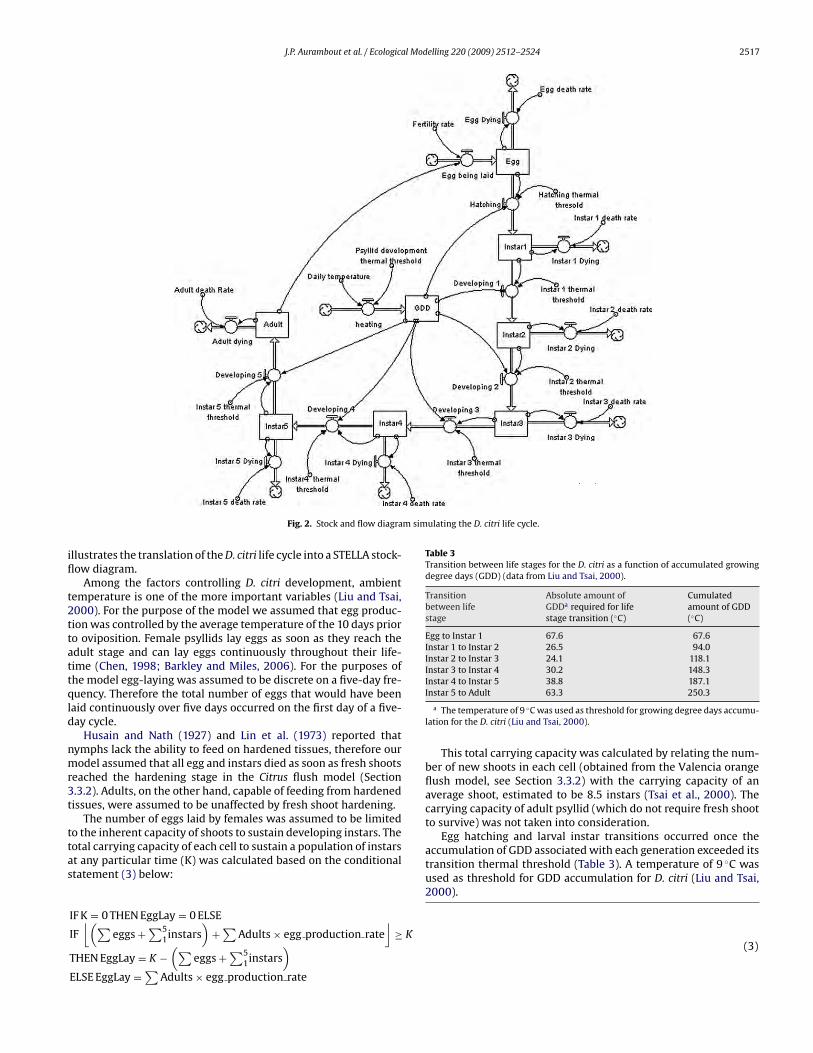
Fig. 2. Stock and flow diagram simulating the D. citri life cycle.
illustrates the translation of the D. citri life cycle into a STELLA stock-
flow diagram.
Among the factors controlling D. citri development, ambient
temperature is one of the more important variables (Liu and Tsai,
2000). For the purpose of the model we assumed that egg produc-
tion was controlled by the average temperature of the 10 days prior
to oviposition. Female psyllids lay eggs as soon as they reach the
adult stage and can lay eggs continuously throughout their life-
time (Chen, 1998; Barkley and Miles, 2006). For the purposes of
the model egg-laying was assumed to be discrete on a five-day fre-
quency. Therefore the total number of eggs that would have been
laid continuously over five days occurred on the first day of a five-
day cycle.
Husain and Nath (1927) and Lin et al. (1973) reported that
nymphs lack the ability to feed on hardened tissues, therefore our
model assumed that all egg and instars died as soon as fresh shoots
reached the hardening stage in the Citrus flush model (Section
3.3.2). Adults, on the other hand, capable of feeding from hardened
tissues, were assumed to be unaffected by fresh shoot hardening.
The number of eggs laid by females was assumed to be limited
to the inherent capacity of shoots to sustain developing instars. The
total carrying capacity of each cell to sustain a population of instars
at any particular time (K) was calculated based on the conditional
statement (3) below:
IF K = 0 THEN EggLay = 0 ELSE
IF
⌊(∑eggs+
∑5
1instars
)+
∑Adults× egg production rate
⌋≥ K
THEN EggLay = K −(∑
eggs+∑5
1instars
)ELSE EggLay =
∑Adults× egg production rate
(3)
Table 3Transition between life stages for the D. citri as a function of accumulated growing
degree days (GDD) (data from Liu and Tsai, 2000).
Transition
between life
stage
Absolute amount of
GDDa required for life
stage transition (◦C)
Cumulated
amount of GDD
(◦C)
Egg to Instar 1 67.6 67.6
Instar 1 to Instar 2 26.5 94.0
Instar 2 to Instar 3 24.1 118.1
Instar 3 to Instar 4 30.2 148.3
Instar 4 to Instar 5 38.8 187.1
Instar 5 to Adult 63.3 250.3
a The temperature of 9 ◦C was used as threshold for growing degree days accumu-
lation for the D. citri (Liu and Tsai, 2000).
This total carrying capacity was calculated by relating the num-
ber of new shoots in each cell (obtained from the Valencia orange
flush model, see Section 3.3.2) with the carrying capacity of an
average shoot, estimated to be 8.5 instars (Tsai et al., 2000). The
carrying capacity of adult psyllid (which do not require fresh shoot
to survive) was not taken into consideration.
Egg hatching and larval instar transitions occurred once the
accumulation of GDD associated with each generation exceeded its
transition thermal threshold (Table 3). A temperature of 9 ◦C was
used as threshold for GDD accumulation for D. citri (Liu and Tsai,
2000).
2518 J.P. Aurambout et al. / Ecological Modelling 220 (2009) 2512–2524
Table 4Death rate of immature stages (%) and adult longevity (days) from Liu and Tsai (2000).
Temp (◦C) Egg 1st instar 2nd instar 3rd instar 4th instar 5th instar Adult longevity
15 15.5 16.1 7.8 1.4 0.5 3.5 88.3
20 10.6 14.6 6.1 0.6 0.6 1.3 50.6
25 4.5 12.8 3.2 3.0 0.6 3.0 39.7
28 3.8 6.6 3.8 0.6 0.9 1.3 33.5
30 6.8 8.9 4.0 2.3 3.9 3.5 28.7
In the absence of natural enemies, death rates of eggs and larval
instars, and longevity of adults, are principally influenced by the 10-
day temperature averages defined in Table 4. The impact of extreme
temperature on D. citri mortality was also taken into account and
it was assumed that ambient temperatures exceeding the nominal
lethal thresholds, i.e.,−7.5 ◦C (Xie et al., 1998) and 48 ◦C led to 100%
death rates. The latter threshold is based on survival of D. citri during
summer in the Punjab (Husain and Nath, 1927; Atwal et al., 1970)
where the mean monthly maximum temperature for June is 40.5 ◦C(http://www.statpak.gov.pk/depts/fbs/publications/yearbook2007/
climate/3.3.pdf). Published weather records for this area indicate
average relative humidity recorded daily at 15:00 are <30% in May
and June, <40% in July and about 45% in August. Atwal et al. (1970)
reported that the maximum temperature was often greater than
40 ◦C for a period of about 7 weeks in 1967, and that mortalities
of 34% and 100%, and 58% and 100%, were recorded for nymphs
and adults kept at 45 ◦C for 2 and 4 h, respectively on potted
sweet-lime seedlings covered with muslin-topped glass chimneys
and housed in field cages. G.A.C. Beattie (pers. obs., July 2006)
observed high numbers of psyllid adults and eggs on trees in the
Malakand Valley in the North West Frontier Province of Pakistan,
where daily maximum temperatures at the time were 47–50 ◦C.
Beattie and Barkley (2009) hypothesised that survival of the psyllid
in such regions may be related to high saturation deficits and
evaporative cooling of leaves and psyllid nymphs and adults when
host plants are not water-stressed. Leaf temperatures under such
conditions may be several degrees below those that may occur
at lower ambient temperatures and higher relative humidities
(see Gates, 2003) where the upper lethal ambient temperatures
for psyllids nymphs and adults may be closer to 40 ◦C, perhaps
lower, and even close to 33 ◦C, at which, under artificial conditions,
Liu and Tsai (2000) reported that populations failed to develop.
Although evaporative cooling by psyllids has not been recorded,
there are records for other insects (Prange, 1996). The inherent
variation in the modelling of daily temperature assures that each
cohort of D. citri develops at a different rate from the previous or
next cohort, resulting in desynchronised overlapping generations.
Our model allows for the overlapping development of 16 distinct D.
citri cohorts. Each egg cohort laid triggers the successive initiation
of one of 16 D. citri life cycle sub-models and the recording of its
specific GDD accumulation. Once a cohort of D. citri reaches the
adult life stage, its population is transferred to a common adult
pool and its life cycle and GDD tracker sub-models are reset.
Although adult psyllids are mobile, their dispersal potential is
incompatible with the spatial resolution of our model which is
based on a 50 km grid cell. For the purpose of the model, it was
assumed that no D. citri could be exchanged between cells and that
each D. citri population lived in complete isolation from populations
in neighbouring cells.
3.4. Simulations
Three simulations were performed to estimate how increasing
temperatures will influence the interactions between D. citri and
Valencia orange and how this will affect the capacity of D. citri to
survive and distribute over Australia.
Simulation 1 was based on grids of the monthly temperature
records for the year 1990.
Simulation 2 was based on grids from the Ozclim monthly temper-
ature projections for the year 2030 (using SRES mid-level emission
scenario A2 and the CSIRO DARLAM 125 km climate change pat-
tern).
Simulation 3 was based on grids of the Ozclim monthly average
temperatures projections for the year 2070 (using the same climate
change scenario).
Each simulation was run for a period of 3 years using a daily
time step. We chose to run this model using a Delta time of 0.25
(quarter day) as it allowed us to (1) include some stochastic vari-
ability in the generation of daily temperature and (2) decrease the
effect of inherent delays associated with the order in which STELLA
calculates variables (particularly stock accumulation dependent on
conditional statements).
For the purpose of the model we assumed that orchards, com-
posed of 100 citrus trees, were placed at the centre of each climate
cell and that the distance between each tree was such that it
allowed free movement of D. citri within each orchard, but pre-
vented exchanges between orchards. A population of 100 adult D.
citri was introduced in each orchard on the first simulation day. This
approach is purposefully inconsiderate of the current distribution
of citrus orchards but accounts for native Citrus spp. (C. australis
(Mudie) Planch., C. australasica F. Muell., C. garrawayi F. M. Bailey, C.
glauca (Lindl.) Burkill, C. gracilis Mabb. and C. inodora F. M. Bailey),
citrus trees grown outside the current agricultural growing regions
as ornamentals or in home gardens, as well as for potential shifts
in citrus growing regions triggered by climate change.
The model was parameterised to generate, for each day of the
simulation, raster data (ascii files) of the following model variables:
(1) number of adult D. citri, (2) carrying capacity of the cell and
(3) number of successful D. citri cohorts. The obtained ascii files
were geo-referenced, converted into GRID format and processed in
ArcInfo 9.2 using a set of Arc Macro Language scripts (available from
the primary author) for (1) spring, summer and autumn flushes, (2)
first day of adult emergence and (3) number of days when spring,
summer and autumn flushes were present. Finally each grid was
imported into ArcGIS 9.2 for visualisation.
4. Results
4.1. Impact of temperature change on the citrus growing season
The frequency and duration with which citrus trees produce
flushes is affected by the temperature increase expected under
climate change conditions. Under 1970–2000 average climatic con-
ditions for the location of Narrandera, New South Wales, the first
flush starts on the 62nd day of simulation and lasts 94 days, the
second flush starts on day 213 and lasts 26 days and the third flush
starts on day 250 and lasts 27 days (Fig. 3). If the daily temperatures
for the same location are increased by the worst case scenario of
6 ◦C (Fig. 4), the first flush would start 58 days earlier and last 92
days (shortened by 2 days), the second flush would start 57 days
earlier and last 17 days (shortened by 9 days) and the third flush
J.P. Aurambout et al. / Ecological Modelling 220 (2009) 2512–2524 2519
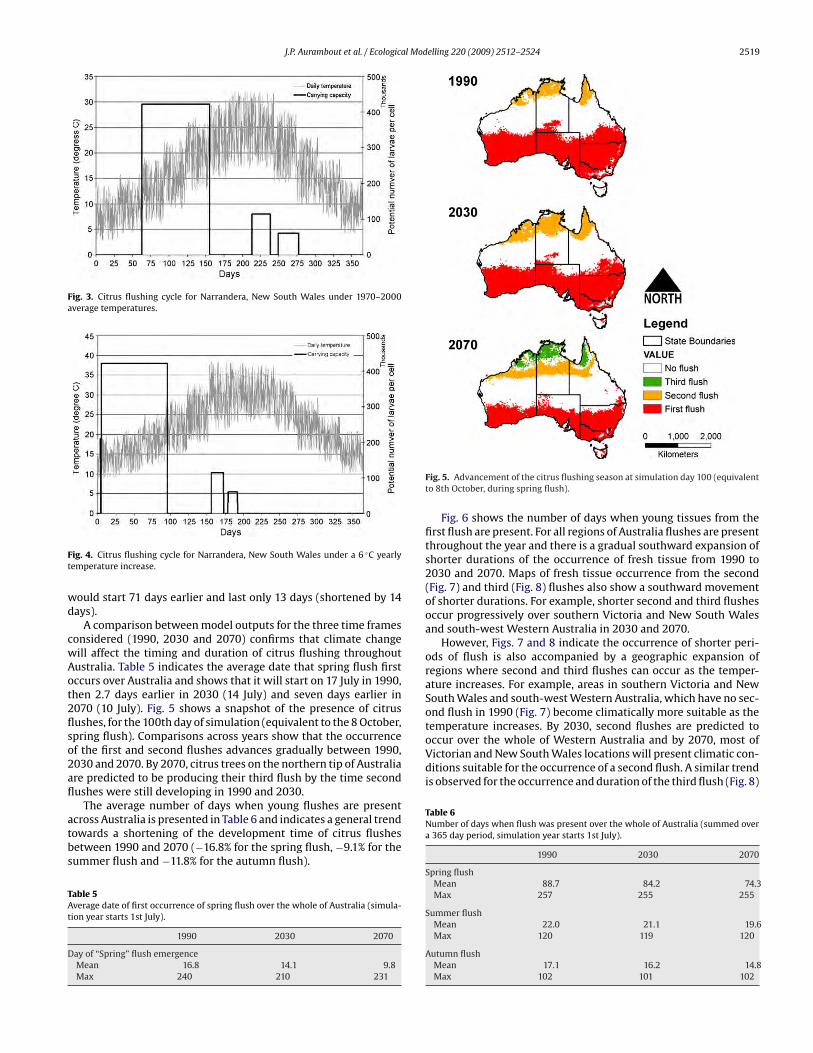
Fig. 3. Citrus flushing cycle for Narrandera, New South Wales under 1970–2000
average temperatures.
Fig. 4. Citrus flushing cycle for Narrandera, New South Wales under a 6 ◦C yearly
temperature increase.
would start 71 days earlier and last only 13 days (shortened by 14
days).
A comparison between model outputs for the three time frames
considered (1990, 2030 and 2070) confirms that climate change
will affect the timing and duration of citrus flushing throughout
Australia. Table 5 indicates the average date that spring flush first
occurs over Australia and shows that it will start on 17 July in 1990,
then 2.7 days earlier in 2030 (14 July) and seven days earlier in
2070 (10 July). Fig. 5 shows a snapshot of the presence of citrus
flushes, for the 100th day of simulation (equivalent to the 8 October,
spring flush). Comparisons across years show that the occurrence
of the first and second flushes advances gradually between 1990,
2030 and 2070. By 2070, citrus trees on the northern tip of Australia
are predicted to be producing their third flush by the time second
flushes were still developing in 1990 and 2030.
The average number of days when young flushes are present
across Australia is presented in Table 6 and indicates a general trend
towards a shortening of the development time of citrus flushes
between 1990 and 2070 (−16.8% for the spring flush, −9.1% for the
summer flush and −11.8% for the autumn flush).
Table 5Average date of first occurrence of spring flush over the whole of Australia (simula-
tion year starts 1st July).
1990 2030 2070
Day of “Spring” flush emergence
Mean 16.8 14.1 9.8
Max 240 210 231
Fig. 5. Advancement of the citrus flushing season at simulation day 100 (equivalent
to 8th October, during spring flush).
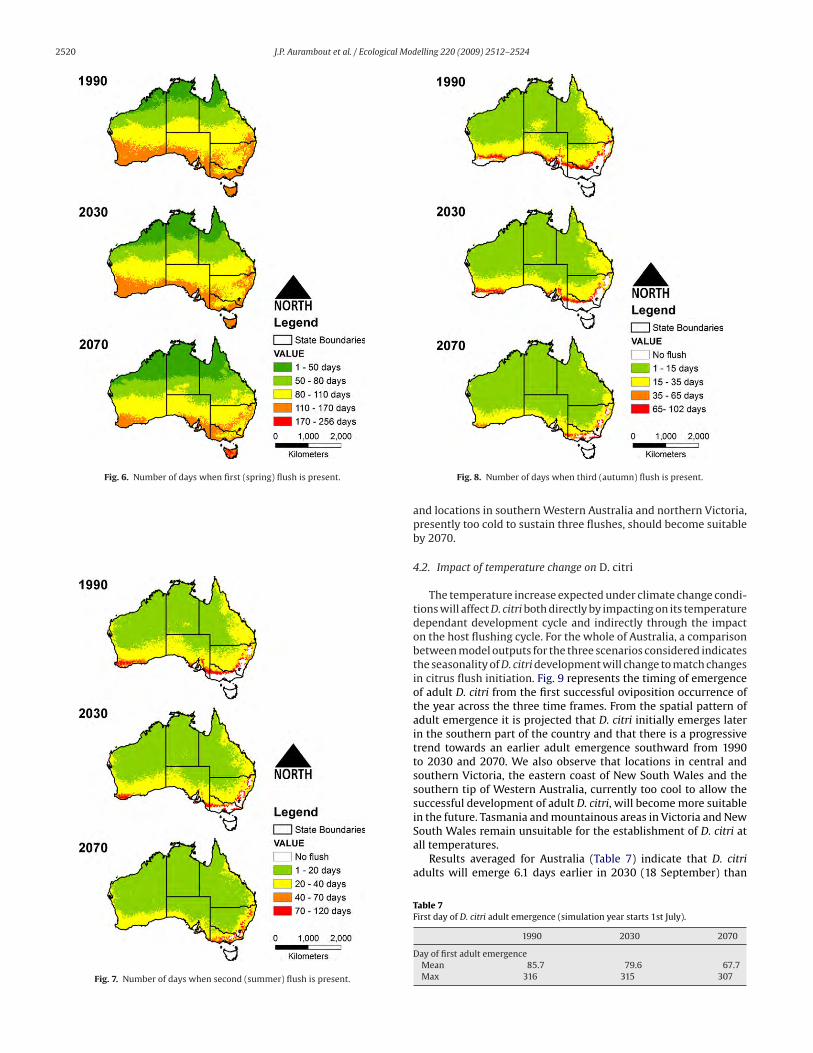
Fig. 6 shows the number of days when young tissues from the
first flush are present. For all regions of Australia flushes are present
throughout the year and there is a gradual southward expansion of
shorter durations of the occurrence of fresh tissue from 1990 to
2030 and 2070. Maps of fresh tissue occurrence from the second
(Fig. 7) and third (Fig. 8) flushes also show a southward movement
of shorter durations. For example, shorter second and third flushes
occur progressively over southern Victoria and New South Wales
and south-west Western Australia in 2030 and 2070.
However, Figs. 7 and 8 indicate the occurrence of shorter peri-
ods of flush is also accompanied by a geographic expansion of
regions where second and third flushes can occur as the temper-
ature increases. For example, areas in southern Victoria and New
South Wales and south-west Western Australia, which have no sec-
ond flush in 1990 (Fig. 7) become climatically more suitable as the
temperature increases. By 2030, second flushes are predicted to
occur over the whole of Western Australia and by 2070, most of
Victorian and New South Wales locations will present climatic con-
ditions suitable for the occurrence of a second flush. A similar trend
is observed for the occurrence and duration of the third flush (Fig. 8)
Table 6Number of days when flush was present over the whole of Australia (summed over
a 365 day period, simulation year starts 1st July).
1990 2030 2070
Spring flush
Mean 88.7 84.2 74.3
Max 257 255 255
Summer flush
Mean 22.0 21.1 19.6
Max 120 119 120
Autumn flush
Mean 17.1 16.2 14.8
Max 102 101 102
2520 J.P. Aurambout et al. / Ecological Modelling 220 (2009) 2512–2524
Fig. 6. Number of days when first (spring) flush is present.
Fig. 7. Number of days when second (summer) flush is present.
Fig. 8. Number of days when third (autumn) flush is present.
and locations in southern Western Australia and northern Victoria,
presently too cold to sustain three flushes, should become suitable
by 2070.
4.2. Impact of temperature change on D. citri
The temperature increase expected under climate change condi-
tions will affect D. citri both directly by impacting on its temperature
dependant development cycle and indirectly through the impact
on the host flushing cycle. For the whole of Australia, a comparison
between model outputs for the three scenarios considered indicates
the seasonality of D. citri development will change to match changes
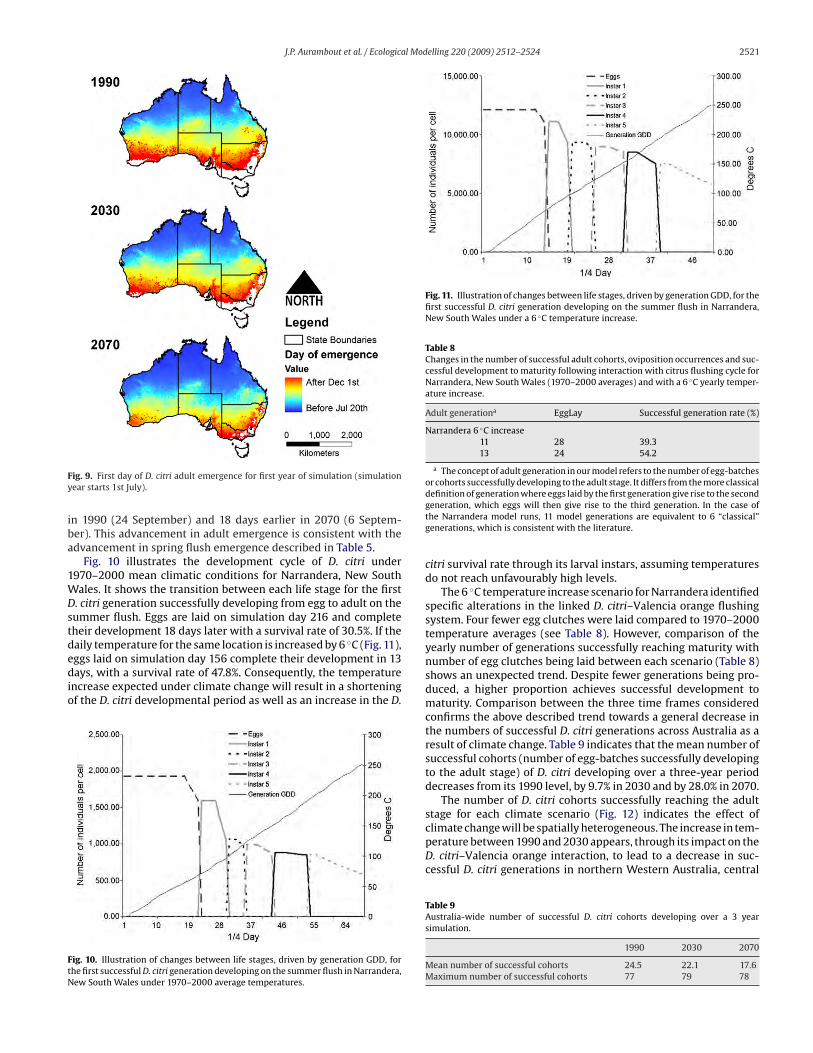
in citrus flush initiation. Fig. 9 represents the timing of emergence
of adult D. citri from the first successful oviposition occurrence of
the year across the three time frames. From the spatial pattern of
adult emergence it is projected that D. citri initially emerges later
in the southern part of the country and that there is a progressive
trend towards an earlier adult emergence southward from 1990
to 2030 and 2070. We also observe that locations in central and
southern Victoria, the eastern coast of New South Wales and the
southern tip of Western Australia, currently too cool to allow the
successful development of adult D. citri, will become more suitable
in the future. Tasmania and mountainous areas in Victoria and New
South Wales remain unsuitable for the establishment of D. citri at
all temperatures.
Results averaged for Australia (Table 7) indicate that D. citri
adults will emerge 6.1 days earlier in 2030 (18 September) than
Table 7First day of D. citri adult emergence (simulation year starts 1st July).
1990 2030 2070
Day of first adult emergence
Mean 85.7 79.6 67.7
Max 316 315 307
J.P. Aurambout et al. / Ecological Modelling 220 (2009) 2512–2524 2521
Fig. 9. First day of D. citri adult emergence for first year of simulation (simulation
year starts 1st July).
in 1990 (24 September) and 18 days earlier in 2070 (6 Septem-
ber). This advancement in adult emergence is consistent with the
advancement in spring flush emergence described in Table 5.
Fig. 10 illustrates the development cycle of D. citri under
1970–2000 mean climatic conditions for Narrandera, New South
Wales. It shows the transition between each life stage for the first
D. citri generation successfully developing from egg to adult on the
summer flush. Eggs are laid on simulation day 216 and complete
their development 18 days later with a survival rate of 30.5%. If the
daily temperature for the same location is increased by 6 ◦C (Fig. 11),
eggs laid on simulation day 156 complete their development in 13
days, with a survival rate of 47.8%. Consequently, the temperature
increase expected under climate change will result in a shortening
of the D. citri developmental period as well as an increase in the D.
Fig. 10. Illustration of changes between life stages, driven by generation GDD, for
the first successful D. citri generation developing on the summer flush in Narrandera,
New South Wales under 1970–2000 average temperatures.
Fig. 11. Illustration of changes between life stages, driven by generation GDD, for the
first successful D. citri generation developing on the summer flush in Narrandera,
New South Wales under a 6 ◦C temperature increase.
Table 8Changes in the number of successful adult cohorts, oviposition occurrences and suc-
cessful development to maturity following interaction with citrus flushing cycle for
Narrandera, New South Wales (1970–2000 averages) and with a 6 ◦C yearly temper-
ature increase.
Adult generationa EggLay Successful generation rate (%)
Narrandera 6 ◦C increase
11 28 39.3
13 24 54.2
a The concept of adult generation in our model refers to the number of egg-batches
or cohorts successfully developing to the adult stage. It differs from the more classical
definition of generation where eggs laid by the first generation give rise to the second
generation, which eggs will then give rise to the third generation. In the case of
the Narrandera model runs, 11 model generations are equivalent to 6 “classical”
generations, which is consistent with the literature.
citri survival rate through its larval instars, assuming temperatures
do not reach unfavourably high levels.
The 6 ◦C temperature increase scenario for Narrandera identified
specific alterations in the linked D. citri–Valencia orange flushing
system. Four fewer egg clutches were laid compared to 1970–2000
temperature averages (see Table 8). However, comparison of the
yearly number of generations successfully reaching maturity with
number of egg clutches being laid between each scenario (Table 8)
shows an unexpected trend. Despite fewer generations being pro-
duced, a higher proportion achieves successful development to
maturity. Comparison between the three time frames considered
confirms the above described trend towards a general decrease in
the numbers of successful D. citri generations across Australia as a
result of climate change. Table 9 indicates that the mean number of
successful cohorts (number of egg-batches successfully developing
to the adult stage) of D. citri developing over a three-year period
decreases from its 1990 level, by 9.7% in 2030 and by 28.0% in 2070.
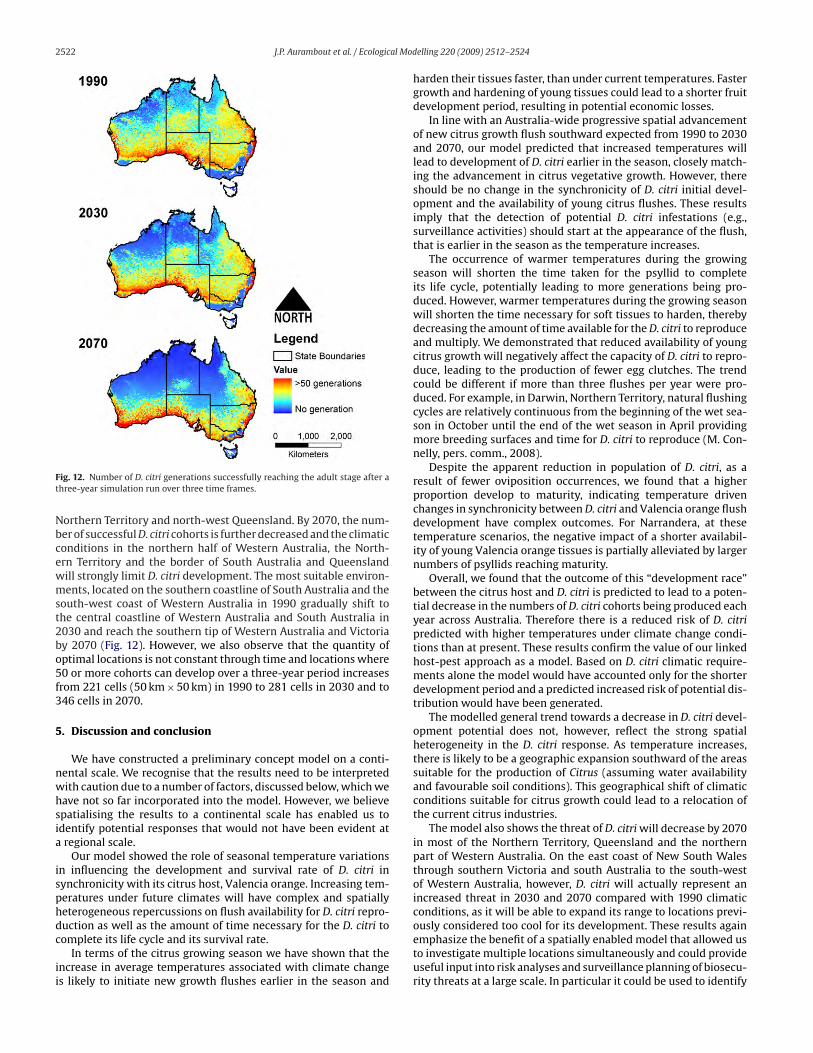
The number of D. citri cohorts successfully reaching the adult
stage for each climate scenario (Fig. 12) indicates the effect of
climate change will be spatially heterogeneous. The increase in tem-
perature between 1990 and 2030 appears, through its impact on the
D. citri–Valencia orange interaction, to lead to a decrease in suc-
cessful D. citri generations in northern Western Australia, central
Table 9Australia-wide number of successful D. citri cohorts developing over a 3 year
simulation.
1990 2030 2070
Mean number of successful cohorts 24.5 22.1 17.6
Maximum number of successful cohorts 77 79 78
2522 J.P. Aurambout et al. / Ecological Modelling 220 (2009) 2512–2524
Fig. 12. Number of D. citri generations successfully reaching the adult stage after a
three-year simulation run over three time frames.
Northern Territory and north-west Queensland. By 2070, the num-
ber of successful D. citri cohorts is further decreased and the climatic
conditions in the northern half of Western Australia, the North-
ern Territory and the border of South Australia and Queensland
will strongly limit D. citri development. The most suitable environ-
ments, located on the southern coastline of South Australia and the
south-west coast of Western Australia in 1990 gradually shift to
the central coastline of Western Australia and South Australia in
2030 and reach the southern tip of Western Australia and Victoria
by 2070 (Fig. 12). However, we also observe that the quantity of
optimal locations is not constant through time and locations where
50 or more cohorts can develop over a three-year period increases
from 221 cells (50 km×50 km) in 1990 to 281 cells in 2030 and to
346 cells in 2070.
5. Discussion and conclusion
We have constructed a preliminary concept model on a conti-
nental scale. We recognise that the results need to be interpreted
with caution due to a number of factors, discussed below, which we
have not so far incorporated into the model. However, we believe
spatialising the results to a continental scale has enabled us to
identify potential responses that would not have been evident at
a regional scale.
Our model showed the role of seasonal temperature variations
in influencing the development and survival rate of D. citri in
synchronicity with its citrus host, Valencia orange. Increasing tem-
peratures under future climates will have complex and spatially
heterogeneous repercussions on flush availability for D. citri repro-
duction as well as the amount of time necessary for the D. citri to
complete its life cycle and its survival rate.
In terms of the citrus growing season we have shown that the
increase in average temperatures associated with climate change
is likely to initiate new growth flushes earlier in the season and
harden their tissues faster, than under current temperatures. Faster
growth and hardening of young tissues could lead to a shorter fruit
development period, resulting in potential economic losses.
In line with an Australia-wide progressive spatial advancement
of new citrus growth flush southward expected from 1990 to 2030
and 2070, our model predicted that increased temperatures will
lead to development of D. citri earlier in the season, closely match-
ing the advancement in citrus vegetative growth. However, there
should be no change in the synchronicity of D. citri initial devel-
opment and the availability of young citrus flushes. These results
imply that the detection of potential D. citri infestations (e.g.,
surveillance activities) should start at the appearance of the flush,
that is earlier in the season as the temperature increases.
The occurrence of warmer temperatures during the growing
season will shorten the time taken for the psyllid to complete
its life cycle, potentially leading to more generations being pro-
duced. However, warmer temperatures during the growing season
will shorten the time necessary for soft tissues to harden, thereby
decreasing the amount of time available for the D. citri to reproduce
and multiply. We demonstrated that reduced availability of young
citrus growth will negatively affect the capacity of D. citri to repro-
duce, leading to the production of fewer egg clutches. The trend
could be different if more than three flushes per year were pro-
duced. For example, in Darwin, Northern Territory, natural flushing
cycles are relatively continuous from the beginning of the wet sea-
son in October until the end of the wet season in April providing
more breeding surfaces and time for D. citri to reproduce (M. Con-
nelly, pers. comm., 2008).
Despite the apparent reduction in population of D. citri, as a
result of fewer oviposition occurrences, we found that a higher
proportion develop to maturity, indicating temperature driven
changes in synchronicity between D. citri and Valencia orange flush
development have complex outcomes. For Narrandera, at these
temperature scenarios, the negative impact of a shorter availabil-
ity of young Valencia orange tissues is partially alleviated by larger
numbers of psyllids reaching maturity.
Overall, we found that the outcome of this “development race”
between the citrus host and D. citri is predicted to lead to a poten-
tial decrease in the numbers of D. citri cohorts being produced each
year across Australia. Therefore there is a reduced risk of D. citri
predicted with higher temperatures under climate change condi-
tions than at present. These results confirm the value of our linked
host-pest approach as a model. Based on D. citri climatic require-
ments alone the model would have accounted only for the shorter
development period and a predicted increased risk of potential dis-
tribution would have been generated.
The modelled general trend towards a decrease in D. citri devel-
opment potential does not, however, reflect the strong spatial
heterogeneity in the D. citri response. As temperature increases,
there is likely to be a geographic expansion southward of the areas
suitable for the production of Citrus (assuming water availability
and favourable soil conditions). This geographical shift of climatic
conditions suitable for citrus growth could lead to a relocation of
the current citrus industries.
The model also shows the threat of D. citri will decrease by 2070
in most of the Northern Territory, Queensland and the northern
part of Western Australia. On the east coast of New South Wales
through southern Victoria and south Australia to the south-west
of Western Australia, however, D. citri will actually represent an
increased threat in 2030 and 2070 compared with 1990 climatic
conditions, as it will be able to expand its range to locations previ-
ously considered too cool for its development. These results again
emphasize the benefit of a spatially enabled model that allowed us
to investigate multiple locations simultaneously and could provide
useful input into risk analyses and surveillance planning of biosecu-
rity threats at a large scale. In particular it could be used to identify
J.P. Aurambout et al. / Ecological Modelling 220 (2009) 2512–2524 2523
locations and critical periods when citrus may be most at risk of
infestations by D. citri and when pest management would be most
effective.
Interactions responsible for the success or failure of D. citri
development involve multiple components such as: abiotic factors
(ambient temperatures, relative humidity, precipitation, evap-
orative cooling); host specific factors (phenotype, genotype,
phytochemistry, and physiology) and vector interactions (preda-
tors, parasitoids). D. citri life cycle parameters are dynamically
linked together through complex interactions, as well as delayed
and stochastic processes. Given the simplified approach in this
model, using temperature as the only climate change parameter,
the results should be interpreted cautiously.
Multiple potential directions for future research are indicated.
Firstly, it should be possible to add more biological details to both
the insect population model and citrus flushing model to account
for spatial variation. Subsequent incarnations of the model need
to account for current and future temperature variations over the
Australian landscape. Other climatic factors such as rainfall and
humidity, which can severely affect both citrus flushing and D. citri
nymphal mortality (Yang, 1989), could be included as well as con-
sideration of the effect of elevated CO2 on citrus physiology and any
repercussions this may have for D. citri.
More information on the behaviour, growth and development
of the psyllid in Australian conditions and in the various Aus-
tralian bioregions would also strengthen the model, although there
is an inherent difficulty in studying a pest that is not endemic
and for which we rely heavily on overseas research. For exam-
ple, temperature threshold tolerances for D. citri are unknown in
Australia and debatable elsewhere. Lower and upper temperature
thermal thresholds of 10–30 ◦C, respectively were recorded in lab-
oratory studies (Liu and Tsai, 2000). We used the most extreme
lethal thresholds for D. citri recorded, i.e., −7.5 ◦C for cold tolerance
reported in China (Xie et al., 1998) and 48 ◦C for heat tolerance based
on reports (Husain and Nath, 1927; Atwal et al., 1970) and observed
in Pakistan (G.A.C. Beattie, pers. obs., 2006), but only temperature
trials under Australian conditions will elucidate local lethal thresh-
olds. The thermal threshold for egg development may differ from
the 9 ◦C used in this study which was derived from a controlled tem-
perature environment (Liu and Tsai, 2000). A Brazilian laboratory
study, for example, found the temperature thermal threshold for
the egg stages was 12 ◦C (Nava et al., 2007) and speculated that the
difference may be due to different populations of psyllids studied.
It may also be possible to account for physiological thresholds
of different citrus varieties including indigenous citrus which are
prevalent throughout the country (Beattie and Barkley, 2009). The
model should also have the capacity to account for the probable
spatial variation in flushing regimes such as continuous flushing
found in the Northern Territory citrus growing regions or amongst
the tropical and subtropical native Citrus spp. The incorporation
of D. citri movement and dispersal behaviour in combination with
high resolution data obtained from spatially and temporally down-
scaled climate change outputs could help simulate the expansion
of D. citri if an incursion occurred and provide valuable information
in the development of containment and eradication.
Further, additional modules could be developed to consider the
citrus greening infection cycle, the subsequent physiological effect
of the bacteria on the host and the economic impact on the citrus
industry.
Finally, the model could also be adapted to make use of land-
use maps of the current and future geographical location of citrus
orchards indicated under changing climate conditions in the future.
Recent advancement in simulation technology allows us to test
a wide variety of settings and data inputs to the model. A sensitivity
analysis of the model may estimate the uncertainties in the accu-
racy of its parameters. We believe this analysis, combined with the
use of multiple climate change scenarios, could help develop risk
probability maps associated with D. citri incursions in relation to
climate change factors. Combined with an economic model compar-
ing potential crop losses with the cost of eradication/containment
measures, this approach could provide a very powerful tool to help
decision makers prioritize biosecurity threats and adopt appropri-
ate responses.
A grid surface of model parameters, produced through this spa-
tial modelling approach, can be particularly valuable for analysing
and communicating model results to audiences. While this study
performed spatial data analysis only within the same simulations,
the same type of analysis could easily be applied across simula-
tions (by comparing 1990 model outputs with 2070 outputs for
example) or between different climate change scenarios or different
insect climate sensitivities. When imported into GIS software, the
data outputs could easily be converted into images files and com-
piled into temporal animations (not presented here) that proved
particularly valuable to communicate research outputs.
Overall, this dynamic point model, spatialised over the Aus-
tralian landscape, was useful as a means for understanding the
interactions between D. citri and its Valencia orange host and
their responses to increasing temperatures. Through the process
of assembling D. citri and host data and how they interact through
time, we can develop an understanding of the key parameters driv-
ing the success or failure of D. citri development. This knowledge
is useful to enable us to forecast risks, prepare for potential incur-
sions and aid in the prioritisation of biosecurity threats particularly
under a changing climate.
Acknowledgements
We would like to thank the Department of Primary Industries
Victoria for providing funding for this project, Mr. Victor Sposito
for initiating the project, Mr. Philip Moyle for his technical expertise
and help in setting up the SME as well as Alan Yen, Mali Malipatil
and Kim Lowell for commenting on earlier drafts.
References
Agrios, G.N., 2005. Plant Pathology, 5th ed. Elsevier Academic Press, London, 922 pp.Atwal, A.S., Chaudhary, J.P., Ramzan, M., 1970. Studies on the development and field
population of citrus psylla Diaphorina citri Kuwayama (Psyllidae: Homoptera). J.Res. 7, 333–338.
Aubert, B., 1987. Trioza erytreae Del Guercio and Diaphorina citri Kuwayana(Homoptera Psylloidea), the two vectors of citrus greening disease: biologicalaspects and possible control strategies. Fruits 42, 149–162.
Aubert, B., Xia, Y.H., 1990. Monitoring flight activity of Diaphorina citri on citrusand Murraya canopies. In: Aubert, B., Tontyaporn, S., Buangsuwon, D. (Eds.),Fourth International Asia Pacific Conference on Citrus Rehabilitation Chiang Mai,Thailand. FAO UNDP, Rome, pp. 181–187.
Aurambout, J.-P., Constable, F., Finlay, K.J., Luck, J., Sposito, V., 2006. The Impactsof Climate Change on Plant Biosecurity. Primary Industries Research Victoria,Melbourne, 42 pp.
Australian Citrus Growers, 2007. 59th Annual Report, Mildura. http://www.australiancitrusgrowers.com.au/gen pdfs/AnnualReport2007.pdf.
Baker, R.H.A., Sansford, C.E., Jarvis, C.H., Cannon, R.J.C., MacLeod, A., Walters, K.F.A.,2000. The role of climatic mapping in predicting the potential geographicaldistribution of non-indigenous pests under current and future climates. Agric.Ecosyst. Environ. 82, 57–71.
Barkley, B., Miles, P., 2006. Report on Huanglongbing. Greening International Work-shop, Ribeirao Preto, Sao Paulo State, Brazil.
Beattie, G.A.C., 2002. Huanglongbing and Asiatic citrus psyllid in Asia and Aus-tralasia: Overview, Research Objectives and Incursion Management. Backgroundpaper: Citrus Industry Biosecurity Planning Workshop. Department of Agricul-ture, Fisheries and Forestry Australia, Canberra, ACT, Telopea Park Inn, 25–26November, 24 pp.
Beattie, G.A.C., Barkley, P., 2009. Huanglongbing and its Vectors. A Pest Specific Con-tingency Plan for the Citrus and Nursery and Garden Industries (Version 2),February 2009. Horticulture Australia Ltd., Sydney.
Bellis, G., Hollis, D., Jacobson, S., 2005. Asian citrus psyllid, Diaphorina citri Kuwayama(Hemiptera: Psyllidae), and huanglongbing disease do not exist in the StapletonStation area of the Northern Territory of Australia. Aust. J. Entomol. 44, 68–70.
BenDor, T.K., Metcalf, S.S., Fontenot, L.E., Sangunett, B., Hannon, B., 2006. Modellingthe spread of the Emerald Ash Borer. Ecol. Model. 197, 221–236.
2524 J.P. Aurambout et al. / Ecological Modelling 220 (2009) 2512–2524
Bové, J.M., 2006. Huanglongbing: a destructive newly emerging, century-old diseaseof citrus. J. Plant Pathol. 88, 7–37.
Bray, R.A., Sands, D.P.A., 1987. Arrival of the leucaena psyllid in Australia: impact,dispersal and natural enemies. Leucaena Res. Rep. 7, 61–65.
Busby, J.R., 1991. BIOCLIM: a bioclimate analysis and prediction system. Plant Prot.Q. (Aust.) 6, 8–9.
CAB International, 2002. Crop Protection Compendium, Global Module, 4th ed. CABInternational, Wallingford, UK.
Capoor, S.P., Rao, D.G., Viswanath, S.M., 1967. Diaphorina citri Kuway, a vector of thegreening disease of citrus in India. Indian J. Agric. Sci. 37, 572–576.
Carpenter, G., Gillison, A.N., Winter, J., 1993. DOMAIN: a flexible modelling procedurefor mapping the potential distributions of plants and animals. Biodivers. Conserv.2, 667–680.
Catling, H.D., 1970. Distribution of the psyllid vectors of citrus greening disease, withnotes on the biology and bionomics of Diaphorina citri. FAO Plant Prot. Bull. 18,8–15.
Chavan, V.M., Summanwar, A.S., 1993. Population dynamics and aspects of thebiology of citrus psylla, Diaphorina citri Kuw., in Maharashtra. In: Moreno,P., da Graca, J.V., Timmer, L.W. (Eds.), Proceedings of the 12th Conference ofthe International Organisation of Citrus Virologists. New Delhi, India. Interna-tional Organisation of Citrus Virologists, University of California, Riverside, pp.286–290.
Chen, C., 1998. Ecology of the insect vectors of citrus systemic diseases and theircontrol in Taiwan. Food Fertil. Technol. Cent. Extension Bull. 459, 5 pp.
Chen, X., Liao, C., 1982. Studies on the biology of citrus psyllid, Diaphorina citriKuwayama, and its relationship with citrus huanglongbing. China Citrus 4, 4–17(in Chinese).
Costanza, R., Voinov, A., 2001. Modeling ecological and economic systems withSTELLA: part III. Ecol. Model. 143, 1–7.
CSIRO and Australian Bureau of Meteorology, 2007. Climate Change in Australia:Technical Report 2007. CSIRO, Canberra, 148 pp.
da Graca, J.V., 1991. Citrus greening disease. Annu. Rev. Phytopathol. 29, 109–136.Davis, A.J., Lawton, J.H., Shorrocks, B., Jenkinson, L.S., 1998. Individualistic species
responses invalidate simple physiological models of community dynamics underglobal environmental change. J. Anim. Ecol. 67, 600–612.
Davis, R.I., Jacobson, S.C., Rahamma, S., Gunua, T.G., 2000. Surveillance for citrushuanglongbing (greening) disease in New Guinea and north Queensland, Aus-tralas. Plant Pathol. 26, 226.
Davis, R.I., Gunua, T.G., Kame, M.F., Tenakanai, D., Ruabete, T.K., 2005. Spread of citrushuanglongbing (greening disease) following incursion into Papua New Guinea,Australas. Plant Pathol. 34, 517–524.
Dempsey, S., Evans, G., Szandala, E., 2002. A target list of high risk pathogens ofcitrus Department of Agriculture, Fisheries and Forestry, Office of the Chief PlantProtection Officer, Canberra.
Evans, G., Dempsey, S., 2000. A Target List of High Risk Pathogens of citrus Agriculture.Fisheries and Forestry Australia, Canberra, 25 pp.
Fung, Y.-C., Chen, C.-N., 2006. Effects of temperature and host plant on populationparameters of the citrus psyllid (Diaphorina citri Kuwayama). Formos. Entomol.26, 109–123.
Gates, D.M., 2003. Biophysical Ecology. Courier Dover Publications, New York.Gottwald, T.R., Aubert, B., Long, H.K., 1991. Spatial pattern analysis of citrus green-
ing in Shantou, China. In: R.F.L.a.P.W.T. R.H. Briansky (Ed.), 11th InternationalOrganisation of Citrus Virologists Conference, Riverside, California, pp. 421–427.
Gottwald, T.R., da Graca, J.V., Bassanezi, R.B., 2007. Citrus huanglongbing:The Pathogen and its impact Plant Health Progress, http://hdl.handle.net/10113/12085, p. 36.
Gray, D.R., 2004. The gypsy moth life stage model: landscape-wide estimates of gypsymoth establishment using a multi-generational phenology model. Ecol. Model.176, 155–171.
Halbert, S.E., Manjunath, K.L., 2004. Asian citrus psyllids (Sternorrhyncha: Psyllidae)and greening disease of citrus: a literature review and assessment of risk inFlorida. Fla. Entomol. 87, 330–353.
Halbert, S., Manjunath, K., Roka, F., Brodie, M., 2008. Huanglongbing (citrus green-ing). Florida Plant Protection Research Institute, Hà No. i, Vie. t Nam.
Hollis, D., 2004. Australasian Psylloidea: Jumping Plantlice and Lerp Insects, Aus-tralian Biological Resources Study. Department of the Environment and Heritage,Canberra, Australia.
Husain, M.F., Nath, D., 1927. The Citrus Psylla (Diaphorini citri, Kuw.) [Psyllidae:Homoptera], vol. 10. Memoirs of the Department of Agriculture in India, pp.5–27.
Hutchinson, G.E., 1957. Concluding remarks. In: Cold Spring Harbor Symposium onQuantitative Biology, 22, pp. 415–457.
Hutton, R.J., 2004. Effects of Cultural Management and Different Irrigation Regimeson Tree Growth, Production, Fruit Quality and Water Relations of Sweet Orange C.sinensis (L.) Osbeck. Ph.D. Department of Crop Sciences, The University of Sydney,Sydney, 271 pp.
IPCC, 2007. In: Pachauri, R.K., Reisinger, A. (Eds.), Climate Change 2007: Syn-thesis Report. IPCC Secretariat, Geneva, Switzerland, http://www.ipcc.ch/ipccreports/ar4-syr.htm.
Jagouiex, S., Bové, J.M., Garnier, M., 1994. The phloem-limited bacterium of greeningdisease of citrus is a member of the � subdivision of the Proteobacteria. Int. J.Syst. Bacteriol. 44, 379–386.
Johns, C., 2004. National Citrus Industry Biosecurity Plan Pest Risk Review Huang-longbing (Citrus Greening). Plant Health Australia, Canberra.
Leong, C.T.S., 2006. Spread of Huanglongbing, Population Dynamics and Control ofDiaphorina citri Kuwayama, the Asiatic citrus psyllid in Sarawak. Ph.D. Faculty ofResource Science and Technology, Universiti Malaysia Sarawak, Kota Samarahan,236 pp.
Lin, S.J., Ke, Y.F., Tao, C.C., 1973. Bionomics observation and interfrated control ofcitrus psylla, Diaphorina citri Kuwayama. J. Hortic. Soc. China 19, 234–242.
Liu, Y.H., Tsai, J.H., 2000. Effects of temperature and biology on life table parametersof the Asian citrus Psyllid, Diaphorina citri Kuwayama (Homoptera: Psyllidae).Ann. Appl. Biol. 137, 201–206.
Maxwell, T., Costanza, R., 1997. A language for modular spatio-temporal simulation.Ecol. Model. 103, 105–113.
Mead, F.W., 1977. The Asiatic citrus psyllid, Diaphorina citri Kuwayama (Homptera:Psyllidae). Entomology Circular No. 180, Florida Department Agriculture andConsumer Services, Division of Plant Industry, 4 pp.
Mertin, J.V., 1952. Plant quarantine in the Northern Territory. J. Aust. Inst. Agric. Sci.18, 27–32.
Nakicenovic, N., Swart, R., 2000. Special Report on Emissions Scenarios Cambridge,United Kingdom and New York, NY, USA.
Naumann, I.D., 2002. Exotic arthropod pests of concern to the Australian citrusindustry Office of the Chief Plant Protection Officer, Canberra, Australia.
Nava, D.E., Torres, M.L.G., Rodrigues, M.D.L., Bento, J.M.S., Parra, J.R.P., 2007. Biologyof Diaphorina citri (Hem., Psyllidae) on different hosts at different temperatures.J. Appl. Entomol. 131, 709–715.
Parry, H.R., Evans, A., Morgan, D., 2006. Aphid population response to agriculturallandscape change: a spatially explicit, individual-based model. Ecol. Model. 199,425–463.
Pearson, R.G., Dawson, T.P., Berry, M.P., 2002. SPECIES: a spatial evaluation of climateimpact on the envelope of species. Ecol. Model. 154, 289–300.
Prange, H.D., 1996. Evaporative cooling in insects. J. Insect Physiol. 42, 493–499.Sakamaki, Y., 2005. Possible migration of the Asian citrus psyllid, Diaphorina citri
Kuwayama (Homoptera: Psyllidae) between and within islands. OccasionalPapers of the Kagoshima University Research Center 42, 121–125.
Salinger, M.J., 2005. Climate variability and change: past, present and future—anoverview. Climatic Change 70, 9–29.
Spiegel-Roy, P., Goldschmidt, E.E., 1996. Biology of Citrus. Cambridge UniversityPress, Cambridge, 230 pp.
Stevens, R.B., 1960. Pathology, an advanced treatise. In: Horsfall, J.G., Dimond, A.E.(Eds.), Plant Pathology, an Advanced Treatise. Academic Press, New York, pp.357–429.
Stokstad, E., 2006. New disease endangers Florida’s already-suffering citrus tree.Science 312, 523–524.
Sutherst, R.W., Maywald, G.F., 1985. A computerised system for matching climatesin ecology. Agric. Ecosyst. Environ. 13, 281–299.
Trnka, M., Muska, F., Semeradova, D., Dubrovsky, M., Kocmankova, E., Zalud, Z., 2007.European corn borer life stage model: regional estimates of pest developmentand spatial distribution under present and future climate. Ecol. Model. 207,61–84.
Tsai, J.H., Wang, J.J., Liu, Y.H., 2000. Sampling of Diaphorina citri (Homoptera: Psylli-dae) on Orange Jessamine in southern Florida. Fla. Entomol. 83, 446–459.
Walker, P.A., Cocks, K.D., 1991. HABITAT: a procedure for modelling a disjoint envi-ronmental envelope for a plant and animal species. Global Ecol. Biogeogr. Lett.1, 108–118.
Weinert, M.P., Jacobson, S.C., Grimshaw, J.F., Bellis, G.A., Stephens, P.M., Gunua, T.G.,Kame, M.F., Davis, R.I., 2004. Detection of Huanglongbing (citrus greening dis-ease) in Timor-Leste (East Timor) and in Papua New Guinea, Australas. PlantPathol. 33, 135–136.
Xie, P.H., Su, C.A., Lin, Z.G., 1998. A study on the cold endurance of the Asian citruspsyllid in Zhejiang. In: Aubert, B., Ke, C., Gonzales, C. (Eds.), Proceedings of theSecond Asian/Pacific Regional Workshop on citrus greening, Lipa, Phillipines.UNDP-FAO, Rome, pp. 18–22.
Yang, Y., 1989. Effects of light, temperature and humidity on the development, repro-duction and survival of citrus psylla. Acta Phytophylacica Sin. 9, 254–328.
Yang, Y., Huang, M., Beattie, A., Xia, Y., Ouyang, G., Xiong, J., 2006. Distribution, biol-ogy, ecology and control of the psyllid Diaphorina citri Kuwayama, a major pestof citrus: a status report for China. Int. J. Pest Manage. 52, 343–352.
Yonow, T., Zalucki, M.P., Sutherst, R.W., Dominiak, B.C., Maywald, G.F., Maelzer, D.A.,Kriticos, D.J., 2004. Modelling the population dynamics of the Queenland fruitfly, Bactrocera (Dacus) tryoni: a cohort-based approach incorporating the effectsof weather. Ecol. Model. 173, 9–30.