Embed Size (px)
Citation preview
Gu
Ka
b
c
a
ARRA
KGUCLMS
1
a
CT
0d
Ecological Modelling 231 (2012) 113– 125
Contents lists available at SciVerse ScienceDirect
Ecological Modelling
jo ur n al homep ag e: www.elsev ier .com/ locate /eco lmodel
lobal sensitivity and uncertainty analysis of a dynamic agroecosystem modelnder different irrigation treatments
endall C. DeJongea,∗, James C. Ascough II b, Mehdi Ahmadia, Allan A. Andalesc, Mazdak Arabia
Department of Civil and Environmental Engineering, Colorado State University, Campus Delivery 1372, Fort Collins, CO 80523, USAUSDA-ARS, Agricultural Systems Research Unit, 2150 Centre Avenue, Building D, Suite 200, Fort Collins, CO 80526, USADepartment of Soil and Crop Sciences, Colorado State University, Campus Delivery 1170, Fort Collins, CO 80523-1170, USA
r t i c l e i n f o
rticle history:eceived 3 June 2011eceived in revised form 26 January 2012ccepted 30 January 2012
eywords:lobal sensitivity analysisncertainty analysisERES-Maizeimited irrigationorris sensitivity method
obol’ sensitivity method
a b s t r a c t
Savings in consumptive use through limited or deficit irrigation in agriculture has become an increas-ingly viable source of additional water for places with high population growth such as the Colorado FrontRange, USA. Crop models provide a mechanism to evaluate various management methods without per-forming costly and time-consuming experiments, e.g., field studies investigating irrigation schedulingand timing effects on crop growth. Few studies have focused on CERES-Maize crop model parameteriza-tion with respect to water-stressed conditions, and the model has previously been shown to overestimateevapotranspiration (ET) for limited irrigation treatments (stress during vegetative stage). It is thereforedesirable to quantify the effects of CERES-Maize input parameters on model output responses typicallyused for calibration and/or important in limited irrigation management, including vegetative growth,crop yield, and ET. A sensitivity analysis (SA) utilizing the Morris one-at-a-time screening and Sobol’variance-based methods was performed on CERES-Maize v4.5 input parameters affecting water balanceand crop growth including soil hydraulic properties, phenological growth properties, and radiation useefficiency. CERES-Maize output responses of interest for the SA included anthesis date, maturity date, leafnumber per stem, maximum leaf area index, yield, and cumulative ET. The SA study utilized five years ofmulti-replicate field management data (both full and limited irrigation treatments) for each combinationof random input parameters. Results comparing the Morris mean and the Sobol’ total sensitivity indexshowed very high correlation between the two, indicating that in this study the computationally cheaperMorris method could have been used as an effective indicator of input parameter sensitivity. For the fullirrigation treatment, CERES-Maize output responses were mostly sensitive to crop cultivar parameters.For the limited irrigation treatment, CERES-Maize leaf area index, yield, and ET output responses werehighly influenced by soil lower limit and drained upper limit input parameters, which define water hold-ing capacity. There was also a greater amount of interaction between input parameters for the limitedirrigation treatment than for full irrigation. An uncertainty analysis was also conducted using model out-
puts from the Sobol’ SA method. In some cases, cumulative ET had higher values for limited irrigationthan for full irrigation, further indicating the need to evaluate model processes governing ET under waterstress. A new methodology for systematic calibration of CERES-Maize, based on the Morris and Sobol’sensitivity indices for the two irrigation treatments, is proposed for future model evaluation as sensitiv-ity differences between treatments indicates that existing CERES-Maize calibration procedures (typicallybased on non-stressed crops) may need to be reconsidered in cases of water stress.. Introduction
Water availability issues, combined with population growthnd the uncertainty of climate change have created significant
∗ Corresponding author at: USDA-ARS, Water Management Research Unit, 2150entre Avenue, Building D, Suite 320, Fort Collins, CO 80526, USA.el.: +1 970 492 7417; fax: +1 970 492 7048.
E-mail address: [email protected] (K.C. DeJonge).
304-3800/$ – see front matter. Published by Elsevier B.V.oi:10.1016/j.ecolmodel.2012.01.024
Published by Elsevier B.V.
challenges for water resources scientists (Anderson-Wilk, 2008).English et al. (2002) argue that a fundamental paradigm shiftin agroecosystem irrigation management is inevitable as watersupplies become more limited, as farmers will manage irrigationto maximize net benefits instead of simply the biological objec-tive of maximizing yields. Limited water resources and increasing
pumping costs have recently caused farmers in Colorado, USA toconsider limited irrigation as an alternative to full irrigation prac-tices. Alternatively, farmers may consider either a reduction inplanted area or schedule irrigation events so that plants do not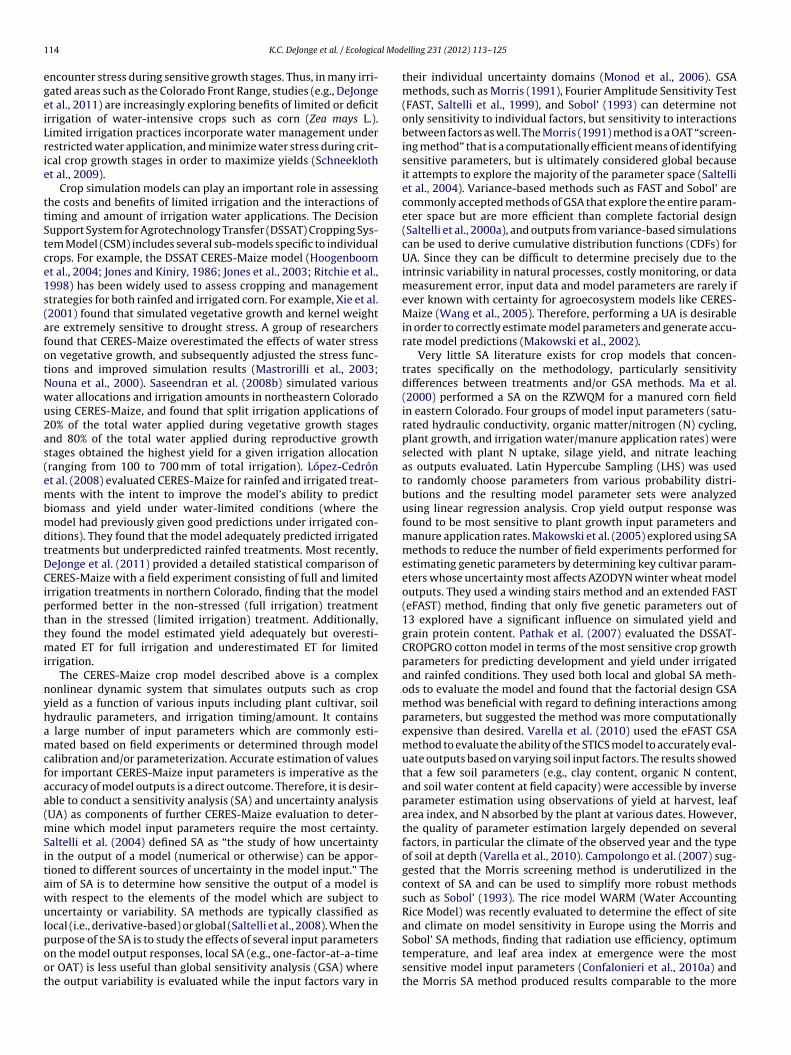
1 l Mod
egeiLrie
ttStce1s(afotNwu2as(embmdtDCipttmi
nyhamcfaa(mSitawulpoot
14 K.C. DeJonge et al. / Ecologica
ncounter stress during sensitive growth stages. Thus, in many irri-ated areas such as the Colorado Front Range, studies (e.g., DeJonget al., 2011) are increasingly exploring benefits of limited or deficitrrigation of water-intensive crops such as corn (Zea mays L.).imited irrigation practices incorporate water management underestricted water application, and minimize water stress during crit-cal crop growth stages in order to maximize yields (Schneeklotht al., 2009).
Crop simulation models can play an important role in assessinghe costs and benefits of limited irrigation and the interactions ofiming and amount of irrigation water applications. The Decisionupport System for Agrotechnology Transfer (DSSAT) Cropping Sys-em Model (CSM) includes several sub-models specific to individualrops. For example, the DSSAT CERES-Maize model (Hoogenboomt al., 2004; Jones and Kiniry, 1986; Jones et al., 2003; Ritchie et al.,998) has been widely used to assess cropping and managementtrategies for both rainfed and irrigated corn. For example, Xie et al.2001) found that simulated vegetative growth and kernel weightre extremely sensitive to drought stress. A group of researchersound that CERES-Maize overestimated the effects of water stressn vegetative growth, and subsequently adjusted the stress func-ions and improved simulation results (Mastrorilli et al., 2003;ouna et al., 2000). Saseendran et al. (2008b) simulated variousater allocations and irrigation amounts in northeastern Coloradosing CERES-Maize, and found that split irrigation applications of0% of the total water applied during vegetative growth stagesnd 80% of the total water applied during reproductive growthtages obtained the highest yield for a given irrigation allocationranging from 100 to 700 mm of total irrigation). López-Cedrónt al. (2008) evaluated CERES-Maize for rainfed and irrigated treat-ents with the intent to improve the model’s ability to predict
iomass and yield under water-limited conditions (where theodel had previously given good predictions under irrigated con-
itions). They found that the model adequately predicted irrigatedreatments but underpredicted rainfed treatments. Most recently,eJonge et al. (2011) provided a detailed statistical comparison ofERES-Maize with a field experiment consisting of full and limited
rrigation treatments in northern Colorado, finding that the modelerformed better in the non-stressed (full irrigation) treatmenthan in the stressed (limited irrigation) treatment. Additionally,hey found the model estimated yield adequately but overesti-
ated ET for full irrigation and underestimated ET for limitedrrigation.
The CERES-Maize crop model described above is a complexonlinear dynamic system that simulates outputs such as cropield as a function of various inputs including plant cultivar, soilydraulic parameters, and irrigation timing/amount. It contains
large number of input parameters which are commonly esti-ated based on field experiments or determined through model
alibration and/or parameterization. Accurate estimation of valuesor important CERES-Maize input parameters is imperative as theccuracy of model outputs is a direct outcome. Therefore, it is desir-ble to conduct a sensitivity analysis (SA) and uncertainty analysisUA) as components of further CERES-Maize evaluation to deter-
ine which model input parameters require the most certainty.altelli et al. (2004) defined SA as “the study of how uncertaintyn the output of a model (numerical or otherwise) can be appor-ioned to different sources of uncertainty in the model input.” Theim of SA is to determine how sensitive the output of a model isith respect to the elements of the model which are subject toncertainty or variability. SA methods are typically classified as
ocal (i.e., derivative-based) or global (Saltelli et al., 2008). When the
urpose of the SA is to study the effects of several input parametersn the model output responses, local SA (e.g., one-factor-at-a-timer OAT) is less useful than global sensitivity analysis (GSA) wherehe output variability is evaluated while the input factors vary inelling 231 (2012) 113– 125
their individual uncertainty domains (Monod et al., 2006). GSAmethods, such as Morris (1991), Fourier Amplitude Sensitivity Test(FAST, Saltelli et al., 1999), and Sobol’ (1993) can determine notonly sensitivity to individual factors, but sensitivity to interactionsbetween factors as well. The Morris (1991) method is a OAT “screen-ing method” that is a computationally efficient means of identifyingsensitive parameters, but is ultimately considered global becauseit attempts to explore the majority of the parameter space (Saltelliet al., 2004). Variance-based methods such as FAST and Sobol’ arecommonly accepted methods of GSA that explore the entire param-eter space but are more efficient than complete factorial design(Saltelli et al., 2000a), and outputs from variance-based simulationscan be used to derive cumulative distribution functions (CDFs) forUA. Since they can be difficult to determine precisely due to theintrinsic variability in natural processes, costly monitoring, or datameasurement error, input data and model parameters are rarely ifever known with certainty for agroecosystem models like CERES-Maize (Wang et al., 2005). Therefore, performing a UA is desirablein order to correctly estimate model parameters and generate accu-rate model predictions (Makowski et al., 2002).
Very little SA literature exists for crop models that concen-trates specifically on the methodology, particularly sensitivitydifferences between treatments and/or GSA methods. Ma et al.(2000) performed a SA on the RZWQM for a manured corn fieldin eastern Colorado. Four groups of model input parameters (satu-rated hydraulic conductivity, organic matter/nitrogen (N) cycling,plant growth, and irrigation water/manure application rates) wereselected with plant N uptake, silage yield, and nitrate leachingas outputs evaluated. Latin Hypercube Sampling (LHS) was usedto randomly choose parameters from various probability distri-butions and the resulting model parameter sets were analyzedusing linear regression analysis. Crop yield output response wasfound to be most sensitive to plant growth input parameters andmanure application rates. Makowski et al. (2005) explored using SAmethods to reduce the number of field experiments performed forestimating genetic parameters by determining key cultivar param-eters whose uncertainty most affects AZODYN winter wheat modeloutputs. They used a winding stairs method and an extended FAST(eFAST) method, finding that only five genetic parameters out of13 explored have a significant influence on simulated yield andgrain protein content. Pathak et al. (2007) evaluated the DSSAT-CROPGRO cotton model in terms of the most sensitive crop growthparameters for predicting development and yield under irrigatedand rainfed conditions. They used both local and global SA meth-ods to evaluate the model and found that the factorial design GSAmethod was beneficial with regard to defining interactions amongparameters, but suggested the method was more computationallyexpensive than desired. Varella et al. (2010) used the eFAST GSAmethod to evaluate the ability of the STICS model to accurately eval-uate outputs based on varying soil input factors. The results showedthat a few soil parameters (e.g., clay content, organic N content,and soil water content at field capacity) were accessible by inverseparameter estimation using observations of yield at harvest, leafarea index, and N absorbed by the plant at various dates. However,the quality of parameter estimation largely depended on severalfactors, in particular the climate of the observed year and the typeof soil at depth (Varella et al., 2010). Campolongo et al. (2007) sug-gested that the Morris screening method is underutilized in thecontext of SA and can be used to simplify more robust methodssuch as Sobol’ (1993). The rice model WARM (Water AccountingRice Model) was recently evaluated to determine the effect of siteand climate on model sensitivity in Europe using the Morris and
Sobol’ SA methods, finding that radiation use efficiency, optimumtemperature, and leaf area index at emergence were the mostsensitive model input parameters (Confalonieri et al., 2010a) andthe Morris SA method produced results comparable to the more
l Mod
c2cbeatf
CmfarnabmroagmsaaemtiicdNpi1
omo
TC
K.C. DeJonge et al. / Ecologica
omputationally expensive Sobol’ method (Confalonieri et al.,010b). These studies are included in a limited number of directomparisons between the Morris and Sobol’ or other variance-ased methods in recent literature (i.e., Chu-Agor et al., 2011; Foxt al., 2010; Munoz-Carpena et al., 2010, 2007). Assessment of thesepproaches in the context of this study should provide new insighto crop modelers in regard to computational expense and resultsor each approach.
Very few examples in the literature focus directly on SA forERES-Maize input parameters, especially in regard to irrigationanagement in semi-arid regions. St’astná and Zalud (1999) per-
ormed a local SA on the CERES-Maize and MACROS (Modules forn Annual CROp Simulation) models, adjusting wilting point, satu-ated soil water content, and field capacity from −6 to 6% of theirominal values to evaluate changes in yield and LAI. They found
linear dependence of LAI on all three parameters, and negligi-le influence on yield. Bert et al. (2007) studied the sensitivity ofaize yield predictions in Argentina to uncertainty in several soil-
elated parameters (e.g., soil N and water content at sowing, soilrganic matter content, and soil infiltration curve number) as wells solar radiation using a combination of mathematical (local) andraphical SA approaches. They found that CERES-Maize showedore sensitivity to solar radiation than for soil parameters, and that
ome parameters (e.g., soil curve number and soil water contentt sowing) exhibited non-linear responses. He (2008) performed
Morris SA on CERES-Maize cultivar and soil input parameters,valuating corn yield and N leaching output responses. It was deter-ined that thermal time from emergence to end of juvenile phase,
hermal time from silking to physiological maturity, phyllochronnterval, soil lower limit, soil drained upper limit, and soil fertil-ty factor model input parameters all have a strong influence onrop yield, and the soil lower limit, soil drained upper limit, soilrainage rate, and runoff curve number have a strong influence on
leaching. Although He (2008) evaluated sensitive soil and cultivararameters for the CERES-Maize model, the study was conducted
n Florida, USA with very sandy soils and high rainfall (average320 mm annual).
The above CERES-Maize SA studies do not quantify higher-rder interactions between variables, a likely issue in such a robustodel. Additionally, most studies in any context of SA explore
verall sensitivity of the model in general, without quantifying
able 1ERES-Maize sensitivity analysis input parameters and output responses.
Name Definition
Input parametersP1 Thermal time from emergence to end of juvenile
P2 Development delay factor
P5 Thermal time from silking to physiological maturity
G2 Maximum possible kernels per plant
G3 Kernel filling rate under optimum conditions
PHINT Phylochron interval
RUE Radiation use efficiency
SLPF Soil fertility factor
SLU1 Evaporation limit
SLDR Drainage rate
SLRO Runoff curve number
SLLL Soil lower limit, or wilting point
SDUL Drained upper limit, or field capacity
SSAT Saturation
SSKS Saturated hydraulic conductivity, macropore
SBDM Bulk density
Output responsesADAY Anthesis day
MDAY Maturity day after planting
LNS Total leaf number per stemLAIX Maximum leaf area indexYIELD Crop yield
ETC Cumulative evapotranspiration
elling 231 (2012) 113– 125 115
sensitivity differences between treatments as we would expect inthis case. Therefore, a detailed SA in regard to potential CERES-Maize input parameter sensitivity differences between irrigationtreatments would be extremely beneficial to modelers who wishto use the model in dryland, semi-arid, or other similar manage-ment regimes with limited water resources. Improved knowledgeof model sensitivity to various inputs will assist new users of themodel with calibration based on these parameters, similar to meth-ods described in Ma et al. (2011). Increased understanding in regardto CERES-Maize input parameter sensitivity and response to water-stressed treatments may also be valuable to users of the newRZWQM2, which has been coupled with the DSSAT plant growthmodules (Ma et al., 2007, 2006).
Similar to SA for CERES-Maize input parameters, very fewCERES-Maize UA studies exist in the literature. A notable excep-tion is the work of He et al. (2009, 2010). He et al. (2009) usedthe generalized likelihood uncertainty estimation (GLUE) methodto estimate CERES-Maize genotype and soil parameters for sweetcorn production in northern Florida. Genotype coefficients (P1, P5,and PHINT) and soil parameters (SLDR, SLRO, SDUL, SLLL, and SSAT)were generated using a multivariate normal distribution that pre-served the parameter correlations (Table 1). The GLUE procedureresulted in different prior and posterior distributions of selectedparameters (P1, P5, SLDR, SLRO, SLLL, and SDUL). In the posteriordistribution of estimated parameters, the uncertainties in param-eters were substantially reduced, with coefficient of variation (CV)values mostly lower than 10%. The average CV value of the parame-ters was reduced from 27.2% in the prior distribution to 4.6% in theposterior distribution. In addition, the GLUE procedure accuratelyestimated soil parameters (i.e., SLLL, SDUL, and SSAT) when com-pared to independent measurements made in the laboratory, withan average absolute relative error of about 8.5%. He et al. (2011)used the He et al. (2009) parameter sets (i.e., sets generated fromparameter distributions derived with the GLUE method) to sim-ulate dry matter yields under three N fertilizer levels (185, 247,and 309 kg N ha−1) and two irrigation levels (I1 and I2; I2 = 1.5 × I1,where I1 is the irrigation demand calculated based on a daily
soil water balance). Due to the uncertainties in soil and geneticparameters, the prediction standard deviation (SD) of simulateddry yields ranged from 655 kg ha−1 at I1 to 960 kg ha−1at I2, whilethe observation SD ranged from 220 to 463 kg ha−1 for measuredUnit Lower bound Upper bound
Degree-day 130 350Day 0 0.8Degree-day 600 950Kernel 450 950mg day−1 5.0 10.5Degree-day 35 75g MJ−1 2 5– 0.7 1.0cm 5 12day−1 0 1– 60 95mm3 mm−3 0.11 0.20mm3 mm−3 0.25 0.42mm3 mm−3 0.43 0.51cm h−1 0.3 2.0g cm−3 1.24 1.50
dayday
kg ha−1
mm
1 l Mod
dtvcfrtiysiitchtooiauwfimsctlutim
2
2
ief(ltngoVitatpotewbtwabwv
16 K.C. DeJonge et al. / Ecologica
ry yields. The uncertainties in simulated dry yield were higherhan the uncertainties of measured values due to relatively highariations in estimated genetic coefficients. He et al. (2011) con-luded that CERES-Maize model performance could be improvedurther if the variations in estimated genetic coefficients could beeduced. Previous attempts to simulate the difference in irriga-ion treatments with the CERES-Maize crop growth model havendicated that the model responds more accurately in regard toield, ET, and vegetative growth under full irrigation with no watertress, as compared to limited irrigation under water stress dur-ng the vegetative growth stage (DeJonge et al., 2011). Therefore,n this study focus is placed on evaluating model input proper-ies that should have a large effect on both water availability androp response to water under full and limited irrigation (e.g., soilydraulic and phenological growth properties). The overall objec-ives of this study were to determine and rank the global sensitivityf CERES-Maize v4.5 physiological timing, growth, yield, and ETutput responses to soil hydraulic and phenological growth modelnputs using both qualitative (Morris) and quantitative (Sobol’) SApproaches, and evaluate irrigation treatment differences in outputncertainty. Specifically, this study aimed to identify and quantify aell-defined group of sensitive CERES-Maize input parameters for
ull and limited irrigation treatments in regard to output responsesncluding anthesis date, maturity date, leaf number per stem,
aximum leaf area index, crop yield, and cumulative evapotran-piration. The Morris screening and Sobol’ SA methods were used toompare between the full and limited irrigation treatments, usinghe DeJonge et al. (2011) parameterized model setup as the base-ine. Additionally, model outputs from the Sobol’ SA method weresed to create CDFs for UA. It is hoped that the resulting SA will leado a justifiable increased focus on improved estimation of sensitivenput parameters for CERES-Maize, as well as guidance to potential
odel improvements under water-stressed conditions.
. Materials and methods
.1. Site and experiment description
In a prior study, the CERES-Maize crop growth model was cal-brated and validated based on a multi-replicate field researchxperiment near Fort Collins, CO (40◦39′19′′N, 104◦59′52′′W)rom 2006 to 2008; details can be found in DeJonge et al.2011). The soil at the study site is a Fort Collins Loam (fine-oamy, mixed, superactive, mesic Aridic Haplustalf). Two irrigationreatments of continuous corn (the dominant irrigated crop inortheast Colorado) were studied during the 2006 through 2010rowing seasons: full irrigation (ET requirement supplied through-ut the season) and limited irrigation (no irrigation before the12 reproductive stage unless necessary for emergence, then full
rrigation afterwards). In all years, less significant early irriga-ions were required by all treatments to encourage germinationnd avoid total loss of crop. There were four replications of eachreatment, arranged in a randomized complete block design. Eachlot consisted of 12 rows spaced 76 cm apart, with a row lengthf 26 m. All data were taken from the middle four rows, withhe outer eight rows serving as buffers to minimize boundaryffects from adjacent treatments. Both treatments were monitoredeekly for crop growth (total leaf number, LAI, crop height, and
iomass), crop development (phenology stages), soil water con-ent (SWC), ET by water balance, and final grain yield. Irrigationater was applied by a linear move sprinkler system, generally
t a weekly interval. Irrigation amounts were determinedy water balance using crop ET estimates from the onsiteeather station (station FTC03; 40◦39′09′′N, 105◦00′00′′W; ele-
ation 1557.5 m) within the Colorado Agricultural Meteorological
elling 231 (2012) 113– 125
Network (CoAgMet, http://ccc.atmos.colostate.edu/∼coagmet/).Daily precipitation, solar radiation, minimum and maximum tem-perature, vapor pressure (which was converted to dew pointtemperature), and wind run were continually recorded, and anymissing weather data were replaced by data from the Wellington,CO station (station WLT01; 40◦40′34′′N, 104◦59′49′′W; elevation1567.9 m) approximately two km to the north of the FTC03 station.
It was assumed that CERES-Maize sensitivity responses woulddiffer between the full and limited irrigation treatments. There-fore, for each input parameter set, the model was evaluated forboth treatments over the five years (2006–2010) management andweather data were fully available (for a total of ten runs per inputset). Additionally, simulated inputs (namely irrigation timing andamount) were set to exactly match field management. This wasdone to ensure that model output response sensitivity was a resultof parameter uncertainty and not necessarily varying irrigationschedule and amounts. In all years and treatments, adequate N wasapplied to avoid N stress.
2.2. CERES-Maize model description
Crop simulation models such as those found in the Decision Sup-port System for Agrotechnology Transfer (DSSAT v4.5) can play arole in assessing the costs and benefits of limited irrigation andthe interactions of timing and amount of irrigation water appli-cations (Hoogenboom et al., 2010; Jones et al., 2003). The DSSATCropping System Model (CSM) CERES-Maize is available as part ofthe DSSAT suite of crop models designed to estimate production,resource use, and risks associated with crop production practices(Jones and Kiniry, 1986; Ritchie et al., 1998). It has been widelyused to assess cropping and management strategies for corn (bothrainfed and irrigated) for well over two decades. CERES-Maize isa process-oriented corn growth model that simulates the follow-ing: biomass accumulation based on light interception; partitioningof accumulated biomass to leaves, stems, roots, and grain; envi-ronmental stresses; and crop growth and development includingphenological states, biomass production, and yield. Additionally,the CSM contains modules for soil water balance as well as soil Ntransformations and uptake, which are used for other crop mod-ules in addition to CERES-Maize. Required model inputs includesoil characteristics, daily weather, cultivar parameters, fertilizerapplications, irrigations, planting date, plant population, and othermanagement practices. To facilitate use of a minimum data set,the CSM uses a simple water balance algorithm following a lay-ered soil and a “tipping-bucket” approach (Ritchie, 1998). The USDAcurve number technique (USDA-SCS, 1972) is used to calculaterunoff and infiltration amounts resulting from rain and irrigation.The Priestley–Taylor (1972) and FAO-56 Penman-Monteith method(Allen, 1998) are available as options in DSSAT to calculate refer-ence ET; the latter was used in this study. This method requires dailysolar radiation, minimum and maximum temperature, daily aver-age dew point temperature, and wind speed; these inputs are usedin combination with energy balance and mass transfer to calculatereference ET, or potential ET. Instead of applying a crop coefficientto determine crop ET, CERES-Maize partitions the potential ET intopotential soil evaporation and potential plant transpiration, andactual soil evaporation and plant transpiration rates depend on thesoil water availability to meet the potential values (López-Cedrónet al., 2008). Water stress is generally determined as the compar-ison between potential transpiration (demand) and available rootwater or plant extractable soil water (supply) (Saseendran et al.,
2008a). In well-watered conditions, available root water exceedsdaily potential transpiration. As the soil dries, available root waterdecreases until it cannot meet transpiration demand, thus intro-ducing stress into the simulated crop.
l Mod
hIottlCoybfoptisfiige
2
itpp2i(tleisAvb(aeirtsttgnDstgpturabautfl
K.C. DeJonge et al. / Ecologica
Because it is relevant to the study, it is important to understandow yield and biomass production is determined in CERES-Maize.
n CERES-Maize, crop development rates are calculated based onlyn temperature and photoperiod (Ritchie et al., 1998). Biomass par-itioned to grain in CERES-Maize can be affected by daily minimumemperature (Singh, 1985). Four discrete functions of simulatedeaf-tip number are used for predicting plant canopy leaf area inERES-Maize (Jones and Kiniry, 1986). N uptake is simulated basedn the crop N demand and available N in the soil. In terms of cropield, number of grains per plant is a function of the potential num-er of kernels per plant and the average crop growth rate (g/plant)rom silking to the beginning of grain filling. The model assumesne ear of corn per plant, however if the number of kernels perlant is significantly smaller than the potential number of kernels,he model creates some barren plants. Ear growth rate (g/ear/day) isncreased by daily thermal time but can be decreased by water or Ntress. The effective grain filling period is based on the thermal timerom silking to maturity, and during this period leaf senescencencreases, whereas ears, stalks, and roots are the only active grow-ng tissues. Daily grain growth rate is a function of temperature,rains per plant, potential kernel growth rate, and soil moistureffect on growth (Ritchie et al., 1998).
.3. Input parameters and output responses
CERES-Maize input parameters were selected that are relevantn regard to their ability to affect crop growth timing and magni-ude, yield, and ET (Table 1). These mainly include crop cultivararameters typically used in model calibration and soil hydraulicarameters (i.e., DeJonge et al., 2011; Fraisse et al., 2001; He,008). Random values for each parameter were determined assum-
ng a uniform distribution between the lower and upper boundsTable 1). While sensitivity and uncertainty analyses often attempto define appropriate input distributions, these studies often uti-ize simplified distributions for most of the parameters. Monodt al. (2006) note that “the range of input values usually has morenfluence on the output than the distribution shapes” and othertudies echo this statement (i.e., Helton, 1993; Haan et al., 1998).lso, the use of uniform distributions characterizes a more conser-ative assumption since unimportant parameters, as determinedy the GSA, will show little influence regardless of distributionSaltelli et al., 2008). Maize cultivar parameters P1, P2, P5, G2, G3,nd PHINT (Table 1) were used as calibration parameters in DeJonget al. (2011). Many of these same parameters were previously usedn the He (2008) Morris SA study, but they were evaluated sepa-ately from soil hydraulic parameters because it was assumed thathese groups of parameters were independent. However, in thistudy all parameters are evaluated simultaneously as it is assumedhat interactions between soil hydraulic parameters are possible inhe context of water-stressed conditions. Additionally, some modelrowth components are based strictly on thermal time and haveo influence from stress, i.e., as indicated by total leaf count ineJonge et al. (2011) showing no decrease in simulated succes-
ive leaf tip appearances. It is therefore important to identify inhis context which cultivar parameters have no stress effects torowth and subsequent yield and ET. In addition to the cultivararameters, the ecotype parameter (i.e., a type of parameter meanto be specific to the species or subspecies at hand) for radiationse efficiency (RUE, g dry matter per MJ photosynthetically activeadiation, PAR) was evaluated for sensitivity. In DSSAT versions 4.0nd above, RUE is set to 4.2 g MJ−1 PAR (Hoogenboom et al., 2010),ut Lindquist et al. (2005) suggest maize simulation models such
s CERES-Maize that rely on RUE for biomass accumulation shouldse RUE of 3.8 g MJ−1 absorbed PAR for non-stressed crops. Addi-ionally, Stöckle et al. (2008) indicate that RUE has a dramatic dailyuctuation in response to weather variability. While CERES-Maizeelling 231 (2012) 113– 125 117
model developers do not recommend using RUE as a calibrationparameter (Ma et al., 2011; K. Boote, personal communication),there is some discrepancy as to what the baseline value shouldbe. Instead of adjusting RUE, Ma et al. (2011) suggest using the soilfertility factor (SLPF) to adjust the conversion rate from solar radi-ation to biomass, and this input was evaluated in addition to RUEas an input in this study. Cultivar and ecotype upper and lowerbounds were generally determined by the range of values used inprior studies as indicated by the DSSAT v4.5 software (Hoogenboomet al., 2010). CERES-Maize output responses (Table 1) were selectedbased on potential effects from water stress, and were statisti-cally evaluated in the DeJonge et al. (2011) study. Growth stagetiming outputs include anthesis day and maturity day after plant-ing (ADAY and MDAY, respectively), crop growth outputs includetotal leaf number per stem and maximum leaf area index (LNS andLAIX, respectively), and the most important evaluation outputs forlimited irrigation management: crop yield (YIELD) and cumulativeevapotranspiration (ETC).
The soil was assumed to be the same texture as used in DeJongeet al. (2011), determined as a Fort Collins loam (fine-loamy, mixed,superactive, mesic Aridic Haplustalf) by the NRCS Web Soil Survey(http://websoilsurvey.nrcs.usda.gov/app/WebSoilSurvey.aspx),with a typical profile of loam from 0 to 18 cm, loam or clay loamfrom 18 to 56 cm, and loam, silt loam, or fine sandy loam from56 to 152 cm. In order to test parameter uncertainty (and avoiderror from input uncertainty), the soil was assumed to exhibitproperties of a loam or clay loam throughout the profile (Table 1).To simplify analysis, the nine separate soil layers were determinedsimultaneously and assumed to be homogeneous throughout alllayers. From the soil surface, these layers are at depths of 0–5,5–15, 30–45, 45–60, 60–90, 90–120, 120–150, and 150–178 cm.Upper and lower bounds for soil lower limit (SLLL), soil drainedupper limit (SDUL), saturation (SSAT), and saturated hydraulicconductivity (SSKS) were taken from Schwab et al. (1993) as typicalvalues for loam or clay loam (Table 1). By limiting the analysisto loam and clay loam soil types, the upper and lower boundsapplied ensure that SLLL < SDUL < SSAT, as would be expectedmathematically. Upper and lower bounds for bulk density (SBDM)were found in the DSSAT input files for recommendations basedon soil classification (Hoogenboom et al., 2010).
2.4. Sensitivity and uncertainty analysis methods
In general, SA is the study of how the variation of the outputof a model can be apportioned to different sources of variationor input (Saltelli et al., 2000a). Sensitivity analyses are typicallyclassified as either local sensitivity analysis or global sensitivityanalysis (Saltelli et al., 2000a). Local SA examines the local responseof model output responses by varying input parameters one at atime while holding other parameters at fixed values. GSA charac-terizes methods that possess two basic properties (Saltelli et al.,2000a): (i) multiple parameters are varied simultaneously, and (ii)sensitivity is measured over the entire range of each input factor.When dealing with a nonlinear model and input factors that areaffected by uncertainties of varying magnitude, a GSA approachis the more robust option. Thus, more studies currently are usingGSA techniques instead of local SA. Most of the global SA methodsare variance-based, for example the global sensitivity index is pre-sented by the contribution of each input factor to the total varianceof the model output. Methods for GSA are typically decomposedinto four steps: (1) definition of the inputs and their distribution; (2)generation of a sample of input values; (3) evaluation of the model
output for each sample set of inputs; and (4) estimation of the effectof each input on the model output (Tong, 2010). To perform the laststep, two main approaches are used: a model approximation (e.g.,linear regression) or a direct decomposition of the output variance;
1 l Mod
tmGm
wircpabp(o2mobtcwieomcaafompe
disiaih2v
v
wfaxvYiii
S
S
aft
18 K.C. DeJonge et al. / Ecologica
he latter is typically considered more advantageous in nonlinearodels. The following paragraphs briefly describe two commonSA methods which are used in this study, the Morris screeningethod and the method of Sobol’.Morris (1991) proposed an experimental plan to determine
hich input factors have important effects on an output usingndividually randomized one-factor-at-a-time (OAT) designs, alsoeferred to as “elementary effects.” The method is well-suited forases with a large number of input factors and/or expensive com-utation, and is often considered a good compromise betweenccuracy and efficiency (Campolongo et al., 2007). The main ideaehind the Morris screening method is to discriminate, at low sam-le size, among effects which are (a) non-influential or negligible,b) linearly influential and additive, and (c) non-linearly influentialr influential by interactions with other factors (Campolongo et al.,007; Saltelli et al., 2004, 1999). For each input, two sensitivityeasures are computed: �*, which assesses the overall influence
f the factor on the output, and �, which estimates the ensem-le of the factor’s higher order effects, i.e. non-linear and/or dueo interactions with other factors (Campolongo et al., 2007). Whileonsidered a GSA method because it covers the entire space overhich the factors may vary, the experimental part of the method
s composed of individually randomized OAT experiments (Saltellit al., 2004). Morris suggests evaluating a graphical representationf � vs. �* to determine the most important factors. One of theain advantages of the Morris method is the low computational
ost, especially in comparison with other screening methods suchs fractional factorial designs. However, the sensitivity measuresre typically considered qualitative (i.e., ranking significant inputactors) but not necessarily quantitative in regard to the degreef significance. Quantitative methods, such as the variance-basedethod of Sobol’ discussed next, give precise calculations of out-
ut variance but are also more computationally expensive (Saltellit al., 2004).
The Sobol’ (1993) GSA method computes an ANOVA-basedecomposition of the output variance, where both main effects and
nteraction terms can be computed (Saltelli et al., 2000a). The Sobol’ensitivity index represents the fraction of the total variance thats due to any individual factor or combination of factors. Addition-lly, the method of Sobol’ is able to estimate the total sensitivityndex STi, defined as the sum of all effects (including first-order andigher-order) involving the input factor of interest (Saltelli et al.,000b). With k quantitative input factors, the decomposition of theariance var(Y) generalizes to:
ar(Y) =k∑
i=1
Di +∑
1≤i<j≤k
Dij + · · · + D1,2,...,k (1)
here D1 is the variability associated with the main effect of inputactor x1, D2 is the variability associated with the main effect of x2,nd D12 is the variability associated with the interaction between1 and x2, and so on. This technique is very similar to the analysis ofariance (ANOVA), except that var(Y) represents the variability of
ˆ in terms of the overall uncertainty of the input factors, includingrregular and non-linear effects (Monod et al., 2006). The sensitivityndices are derived from the above equation by dividing individualmportance measures by the total variability var(Y):
i = Di
var(Y)(2)
ij = Dij (3)
var(Y)nd so on, where Si is called the first order sensitivity index foractor xi, measuring the main effect of xi on the output [or the frac-ional contribution of xi to the variance of f(x)]. Sij is called the
elling 231 (2012) 113– 125
second-order sensitivity index which measures the interactioneffect of the two inputs xi and xj, without considering the sum of theindividual effects (Saltelli et al., 2000b). A useful property of thesesensitivity indices is that all of the possible first-order sensitivityindex terms sum to one:
k∑
i=1
Si +∑
1≤i<j≤k
Sij + · · · + S1,2,...,k = 1 (4)
The total sensitivity index (STi) can be defined as the sum of allthe sensitivity indices involving the factor in question. For example,in a three-factor model, the three total effect terms for STi are:
ST1 = S1 + S12 + S13 + S123ST2 = S2 + S12 + S23 + S123ST3 = S3 + S13 + S23 + S123
(5)
where each Si is simply the fraction of the variance of that value tothe total variance of the model, as previously defined. Although thesum of the individual effect terms will add to one, the sum of allthe STi values is typically larger than one because interactions arecounted multiple times.
GSA input samples were generated with SimLab (2010), andevaluation of CERES-Maize model input sets was automated withSimLab and MATLAB (Mathworks, 2010). The Morris SA was exe-cuted by sampling r = 10 elementary effects (i.e., individualizedcomparisons per factor) and k = 16 input factors for a total exper-iment cost (as suggested by Morris, 1990) of r(k + 1) = 170 modelinput sets. The Sobol’ SA was executed by using k = 11 input factorsafter eliminating five insensitive inputs from the Morris analy-sis, and a sample size of n(k + 2) model input sets (Saltelli, 2002;Campolongo and Saltelli, 1997), where n is defined having a rangeof 100 or higher (Saltelli, 1999). This study used n = 160 for a totalof 2080 input sets, consistent with other examples with simi-lar number of input parameters (Campolongo and Saltelli, 1997;Saltelli et al., 2000a), and verified as having results similar to over15,000 input sets. Each input set was run for both full and limitedirrigation treatments, using observed management data from fiveyears (2006–2010). CERES-Maize output response uncertainty wasassessed using statistics and CDFs created from the Sobol’ simula-tion outputs.
3. Results
3.1. Morris screening method
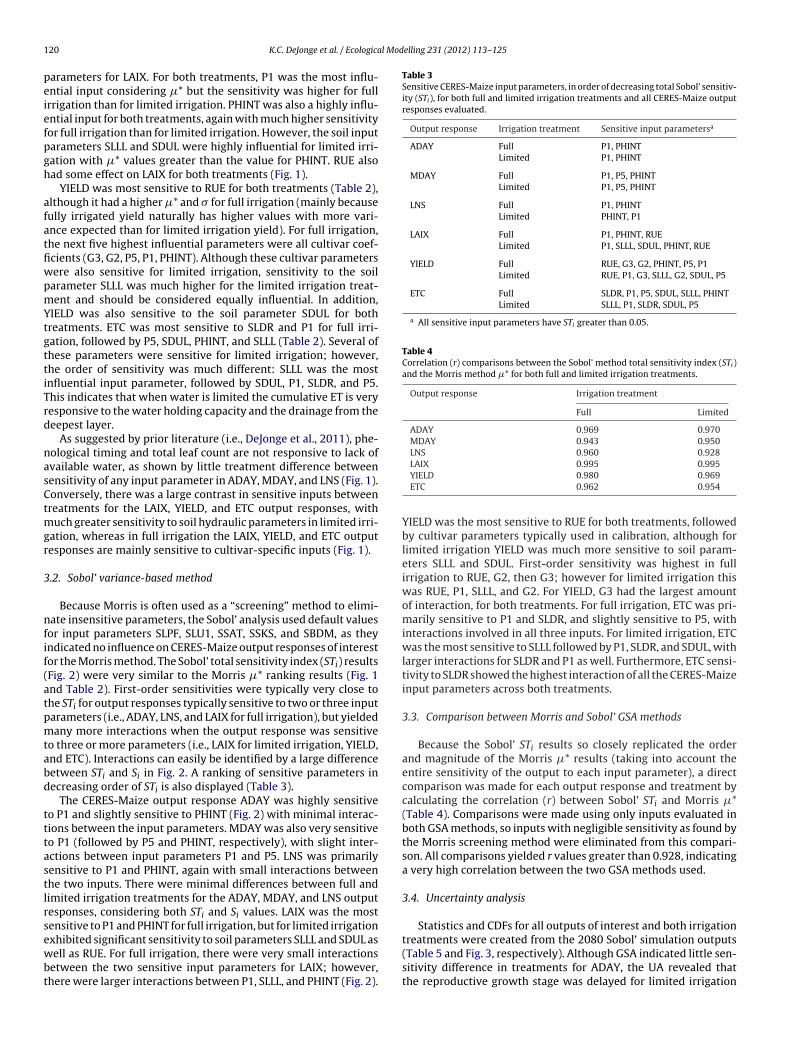
Results for the Morris SA are shown in both graphical (Fig. 1) andtabular (Table 2) form. Morris (1991) suggested that only factorswith relatively high values of �* and � are considered important. Asmentioned in the previous section, high values for �* indicate largeoverall sensitivity to the input parameter, whereas a high value for� indicates interaction or non-linear effects associated with theinput parameter. ADAY was most sensitive to P1, a trend that wastypical for every output response except YIELD and ETC (Table 2). Inorder of decreasing �* (i.e., decreasing sensitivity), PHINT was thenext highest, with slightly higher � than P1 indicating more inter-action. ADAY was less sensitive to P2 than PHINT, but � for theseinputs was nearly the same as P1. For these three input parame-ters, there was little difference between treatments (Fig. 1). Therewas minor sensitivity to the soil parameters SLLL and SDUL (dueto higher standard deviations) for the limited irrigation treatment,but very low �* values (indicating low overall influence). Anotherphenological timing output, MDAY was similar to ADAY in that it
was most sensitive to P1, with the full irrigation treatment having aslightly higher �* (Fig. 1). This trend is logical, as changes to ADAYwill naturally cause changes to MDAY, although their sensitivity toinputs was not identical because of thermal growth accumulations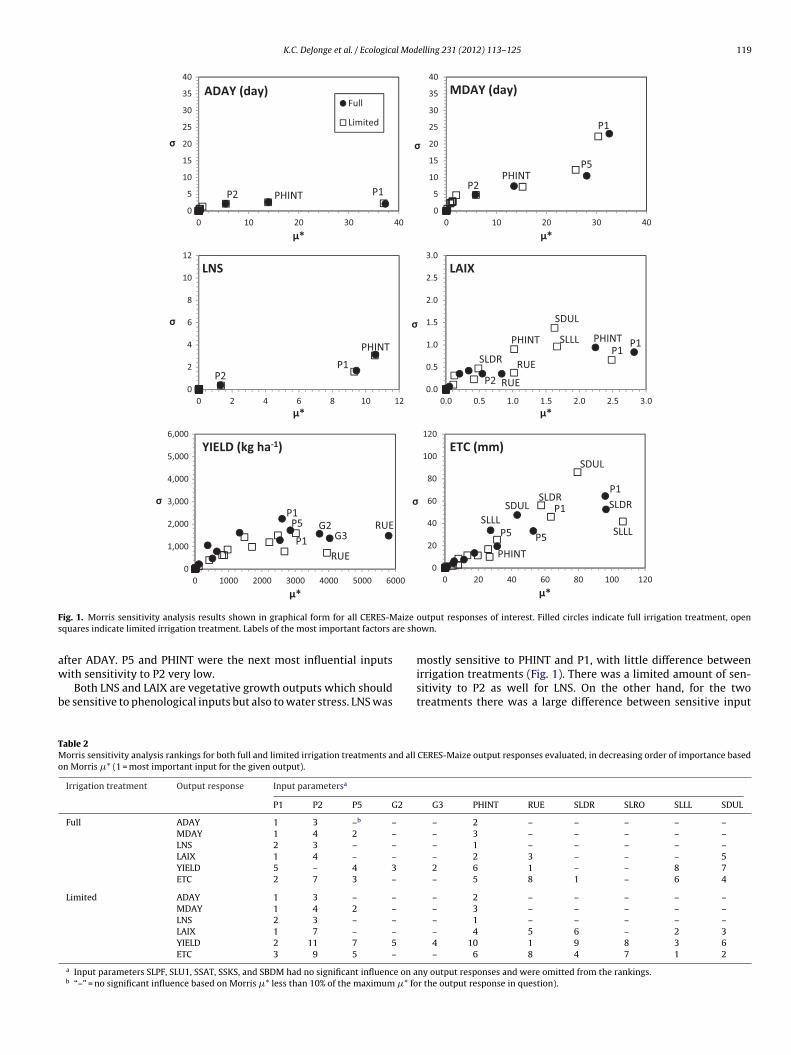
K.C. DeJonge et al. / Ecological Modelling 231 (2012) 113– 125 119
PHINTP2 P1
0
5
10
15
20
25
30
35
40
403020100
σ
μ*
ADAY (day)Full
Limited
PHINT
P1
P2
P5
0
5
10
15
20
25
30
35
40
403020100
σ
μ*
MDAY (day)
PHINT
P1P2
0
2
4
6
8
10
12
121086420
σ
μ*
LNS
PHINT
RUE
P1
P2
SDUL
PHINT
RUESLDR
SLLLP1
0.0
0.5
1.0
1.5
2.0
2.5
3.0
3.02.52.01.51.00.50.0
σ
μ*
LAIX
RUEP1P5 G2
G3
RUEP1
0
1,000
2,000
3,000
4,000
5,000
6,000
6000500040003000200010000
σ
μ*
YIELD (kg ha-1 )
SDUL
PHINT
SLDRSLLL
P1
P5
SDUL
SLDR
SLLL
P1
P5
0
20
40
60
80
100
120
120100806040200
σ
μ*
ETC (mm)
F aize
s re sh
aw
b
TMo
ig. 1. Morris sensitivity analysis results shown in graphical form for all CERES-Mquares indicate limited irrigation treatment. Labels of the most important factors a
fter ADAY. P5 and PHINT were the next most influential inputs
ith sensitivity to P2 very low.Both LNS and LAIX are vegetative growth outputs which shoulde sensitive to phenological inputs but also to water stress. LNS was
able 2orris sensitivity analysis rankings for both full and limited irrigation treatments and all
n Morris �* (1 = most important input for the given output).
Irrigation treatment Output response Input parametersa
P1 P2 P5 G2
Full ADAY 1 3 –b –
MDAY 1 4 2 –
LNS 2 3 – –
LAIX 1 4 – –
YIELD 5 – 4 3
ETC 2 7 3 –
Limited ADAY 1 3 – –
MDAY 1 4 2 –
LNS 2 3 – –
LAIX 1 7 – –
YIELD 2 11 7 5
ETC 3 9 5 –
a Input parameters SLPF, SLU1, SSAT, SSKS, and SBDM had no significant influence on ab “–” = no significant influence based on Morris �* less than 10% of the maximum �* fo
output responses of interest. Filled circles indicate full irrigation treatment, openown.
mostly sensitive to PHINT and P1, with little difference between
irrigation treatments (Fig. 1). There was a limited amount of sen-sitivity to P2 as well for LNS. On the other hand, for the twotreatments there was a large difference between sensitive inputCERES-Maize output responses evaluated, in decreasing order of importance based
G3 PHINT RUE SLDR SLRO SLLL SDUL
– 2 – – – – –– 3 – – – – –– 1 – – – – –– 2 3 – – – 52 6 1 – – 8 7– 5 8 1 – 6 4
– 2 – – – – –– 3 – – – – –– 1 – – – – –– 4 5 6 – 2 34 10 1 9 8 3 6– 6 8 4 7 1 2
ny output responses and were omitted from the rankings.r the output response in question).
1 l Modelling 231 (2012) 113– 125
peiefpgh
afatfiwpmYtgttiTrd
nasCtmgr
3
nfif(atpmtabd
tttastlrsewbt
Table 3Sensitive CERES-Maize input parameters, in order of decreasing total Sobol’ sensitiv-ity (STi), for both full and limited irrigation treatments and all CERES-Maize outputresponses evaluated.
Output response Irrigation treatment Sensitive input parametersa
ADAY Full P1, PHINTLimited P1, PHINT
MDAY Full P1, P5, PHINTLimited P1, P5, PHINT
LNS Full P1, PHINTLimited PHINT, P1
LAIX Full P1, PHINT, RUELimited P1, SLLL, SDUL, PHINT, RUE
YIELD Full RUE, G3, G2, PHINT, P5, P1Limited RUE, P1, G3, SLLL, G2, SDUL, P5
ETC Full SLDR, P1, P5, SDUL, SLLL, PHINTLimited SLLL, P1, SLDR, SDUL, P5
a All sensitive input parameters have STi greater than 0.05.
Table 4Correlation (r) comparisons between the Sobol’ method total sensitivity index (STi)and the Morris method �* for both full and limited irrigation treatments.
Output response Irrigation treatment
Full Limited
ADAY 0.969 0.970MDAY 0.943 0.950LNS 0.960 0.928
20 K.C. DeJonge et al. / Ecologica
arameters for LAIX. For both treatments, P1 was the most influ-ntial input considering �* but the sensitivity was higher for fullrrigation than for limited irrigation. PHINT was also a highly influ-ntial input for both treatments, again with much higher sensitivityor full irrigation than for limited irrigation. However, the soil inputarameters SLLL and SDUL were highly influential for limited irri-ation with �* values greater than the value for PHINT. RUE alsoad some effect on LAIX for both treatments (Fig. 1).
YIELD was most sensitive to RUE for both treatments (Table 2),lthough it had a higher �* and � for full irrigation (mainly becauseully irrigated yield naturally has higher values with more vari-nce expected than for limited irrigation yield). For full irrigation,he next five highest influential parameters were all cultivar coef-cients (G3, G2, P5, P1, PHINT). Although these cultivar parametersere also sensitive for limited irrigation, sensitivity to the soilarameter SLLL was much higher for the limited irrigation treat-ent and should be considered equally influential. In addition,
IELD was also sensitive to the soil parameter SDUL for bothreatments. ETC was most sensitive to SLDR and P1 for full irri-ation, followed by P5, SDUL, PHINT, and SLLL (Table 2). Several ofhese parameters were sensitive for limited irrigation; however,he order of sensitivity was much different: SLLL was the mostnfluential input parameter, followed by SDUL, P1, SLDR, and P5.his indicates that when water is limited the cumulative ET is veryesponsive to the water holding capacity and the drainage from theeepest layer.
As suggested by prior literature (i.e., DeJonge et al., 2011), phe-ological timing and total leaf count are not responsive to lack ofvailable water, as shown by little treatment difference betweenensitivity of any input parameter in ADAY, MDAY, and LNS (Fig. 1).onversely, there was a large contrast in sensitive inputs betweenreatments for the LAIX, YIELD, and ETC output responses, with
uch greater sensitivity to soil hydraulic parameters in limited irri-ation, whereas in full irrigation the LAIX, YIELD, and ETC outputesponses are mainly sensitive to cultivar-specific inputs (Fig. 1).
.2. Sobol’ variance-based method
Because Morris is often used as a “screening” method to elimi-ate insensitive parameters, the Sobol’ analysis used default values
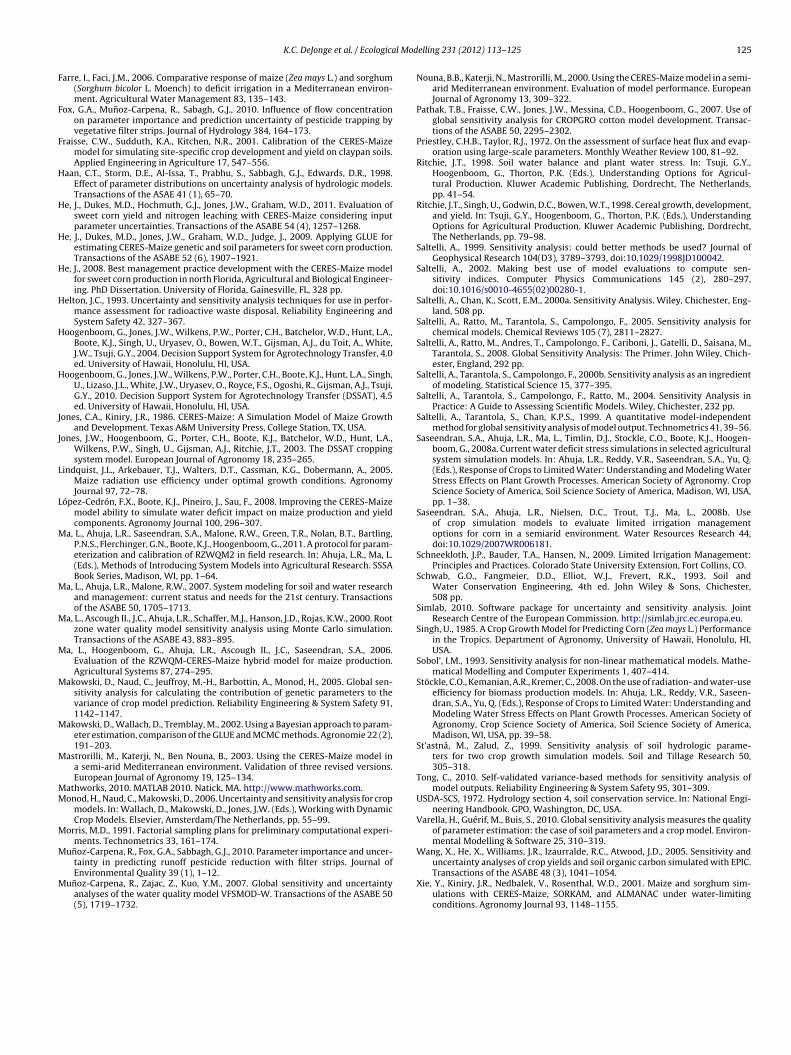
or input parameters SLPF, SLU1, SSAT, SSKS, and SBDM, as theyndicated no influence on CERES-Maize output responses of interestor the Morris method. The Sobol’ total sensitivity index (STi) resultsFig. 2) were very similar to the Morris �* ranking results (Fig. 1nd Table 2). First-order sensitivities were typically very close tohe STi for output responses typically sensitive to two or three inputarameters (i.e., ADAY, LNS, and LAIX for full irrigation), but yieldedany more interactions when the output response was sensitive
o three or more parameters (i.e., LAIX for limited irrigation, YIELD,nd ETC). Interactions can easily be identified by a large differenceetween STi and Si in Fig. 2. A ranking of sensitive parameters inecreasing order of STi is also displayed (Table 3).
The CERES-Maize output response ADAY was highly sensitiveo P1 and slightly sensitive to PHINT (Fig. 2) with minimal interac-ions between the input parameters. MDAY was also very sensitiveo P1 (followed by P5 and PHINT, respectively), with slight inter-ctions between input parameters P1 and P5. LNS was primarilyensitive to P1 and PHINT, again with small interactions betweenhe two inputs. There were minimal differences between full andimited irrigation treatments for the ADAY, MDAY, and LNS outputesponses, considering both STi and Si values. LAIX was the mostensitive to P1 and PHINT for full irrigation, but for limited irrigation
xhibited significant sensitivity to soil parameters SLLL and SDUL asell as RUE. For full irrigation, there were very small interactionsetween the two sensitive input parameters for LAIX; however,here were larger interactions between P1, SLLL, and PHINT (Fig. 2).
LAIX 0.995 0.995YIELD 0.980 0.969ETC 0.962 0.954
YIELD was the most sensitive to RUE for both treatments, followedby cultivar parameters typically used in calibration, although forlimited irrigation YIELD was much more sensitive to soil param-eters SLLL and SDUL. First-order sensitivity was highest in fullirrigation to RUE, G2, then G3; however for limited irrigation thiswas RUE, P1, SLLL, and G2. For YIELD, G3 had the largest amountof interaction, for both treatments. For full irrigation, ETC was pri-marily sensitive to P1 and SLDR, and slightly sensitive to P5, withinteractions involved in all three inputs. For limited irrigation, ETCwas the most sensitive to SLLL followed by P1, SLDR, and SDUL, withlarger interactions for SLDR and P1 as well. Furthermore, ETC sensi-tivity to SLDR showed the highest interaction of all the CERES-Maizeinput parameters across both treatments.
3.3. Comparison between Morris and Sobol’ GSA methods
Because the Sobol’ STi results so closely replicated the orderand magnitude of the Morris �* results (taking into account theentire sensitivity of the output to each input parameter), a directcomparison was made for each output response and treatment bycalculating the correlation (r) between Sobol’ STi and Morris �*(Table 4). Comparisons were made using only inputs evaluated inboth GSA methods, so inputs with negligible sensitivity as found bythe Morris screening method were eliminated from this compari-son. All comparisons yielded r values greater than 0.928, indicatinga very high correlation between the two GSA methods used.
3.4. Uncertainty analysis
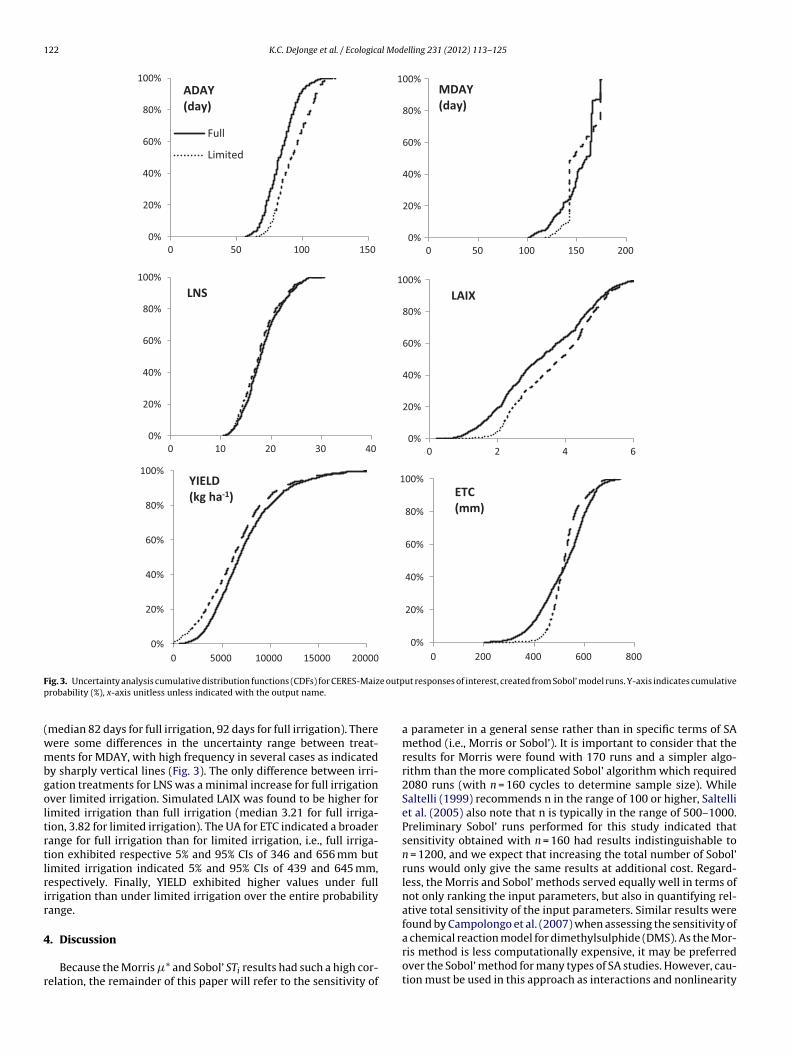
Statistics and CDFs for all outputs of interest and both irrigation
treatments were created from the 2080 Sobol’ simulation outputs(Table 5 and Fig. 3, respectively). Although GSA indicated little sen-sitivity difference in treatments for ADAY, the UA revealed thatthe reproductive growth stage was delayed for limited irrigation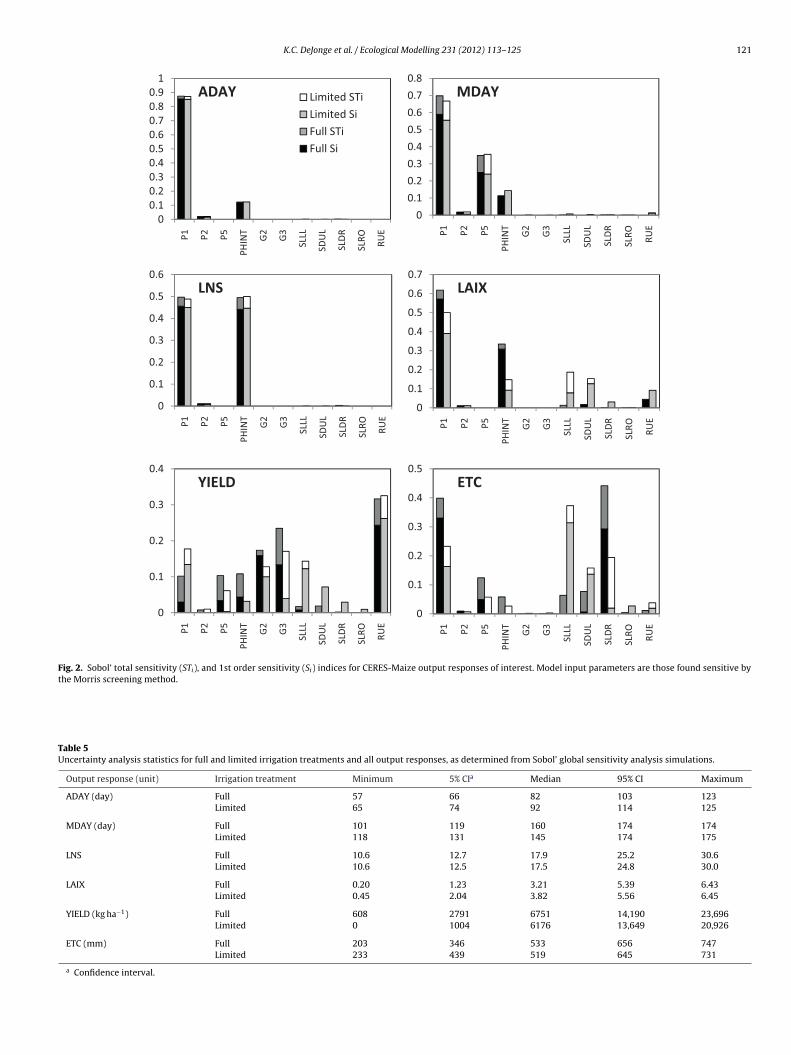
K.C. DeJonge et al. / Ecological Modelling 231 (2012) 113– 125 121
00.10.20.30.40.50.60.70.80.91
P1 P2 P5
PHINT
G2
G3
SLLL
SDUL
SLDR
SLRO RUE
ADAY Limited STiLimited SiFull STiFull Si
0
0.1
0.2
0.3
0.4
0.5
0.6
0.7
0.8
P1 P2 P5
PHINT
G2
G3
SLLL
SDUL
SLDR
SLRO RUE
MDAY
0
0.1
0.2
0.3
0.4
0.5
0.6
P1 P2 P5
PHINT
G2
G3
SLLL
SDUL
SLDR
SLRO RUE
LNS
0
0.1
0.2
0.3
0.4
0.5
0.6
0.7
P1 P2 P5
PHINT
G2
G3
SLLL
SDUL
SLDR
SLRO RUE
LAIX
0
0.1
0.2
0.3
0.4
P1 P2 P5
PHINT
G2
G3
SLLL
SDUL
SLDR
SLRO RUE
YIELD
0
0.1
0.2
0.3
0.4
0.5
P1 P2 P5
PHINT
G2
G3
SLLL
SDUL
SLDR
SLRO RUE
ETC
Fig. 2. Sobol’ total sensitivity (STi), and 1st order sensitivity (Si) indices for CERES-Maize output responses of interest. Model input parameters are those found sensitive bythe Morris screening method.
Table 5Uncertainty analysis statistics for full and limited irrigation treatments and all output responses, as determined from Sobol’ global sensitivity analysis simulations.
Output response (unit) Irrigation treatment Minimum 5% CIa Median 95% CI Maximum
ADAY (day) Full 57 66 82 103 123Limited 65 74 92 114 125
MDAY (day) Full 101 119 160 174 174Limited 118 131 145 174 175
LNS Full 10.6 12.7 17.9 25.2 30.6Limited 10.6 12.5 17.5 24.8 30.0
LAIX Full 0.20 1.23 3.21 5.39 6.43Limited 0.45 2.04 3.82 5.56 6.45
YIELD (kg ha−1) Full 608 2791 6751 14,190 23,696Limited 0 1004 6176 13,649 20,926
ETC (mm) Full 203 346 533 656 747Limited 233 439 519 645 731
a Confidence interval.
122 K.C. DeJonge et al. / Ecological Modelling 231 (2012) 113– 125
0%
20%
40%
60%
80%
100%
0 200 400 600 800
ETC (mm)
0%
20%
40%
60%
80%
100%
0 50 100 150
Full
Limited
ADAY(day)
0%
20%
40%
60%
80%
100%
0 50 100 150 200
MDAY(day)
0%
20%
40%
60%
80%
100%
0 2 4 6
LAIX
0%
20%
40%
60%
80%
100%
0 10 20 30 40
LNS
0%
20%
40%
60%
80%
100%
0 5000 10000 15000 20000
YIELD(kg ha-1)
F e outpp
(wmbgoltrtlrir
4
r
ig. 3. Uncertainty analysis cumulative distribution functions (CDFs) for CERES-Maizrobability (%), x-axis unitless unless indicated with the output name.
median 82 days for full irrigation, 92 days for full irrigation). Thereere some differences in the uncertainty range between treat-ents for MDAY, with high frequency in several cases as indicated
y sharply vertical lines (Fig. 3). The only difference between irri-ation treatments for LNS was a minimal increase for full irrigationver limited irrigation. Simulated LAIX was found to be higher forimited irrigation than full irrigation (median 3.21 for full irriga-ion, 3.82 for limited irrigation). The UA for ETC indicated a broaderange for full irrigation than for limited irrigation, i.e., full irriga-ion exhibited respective 5% and 95% CIs of 346 and 656 mm butimited irrigation indicated 5% and 95% CIs of 439 and 645 mm,espectively. Finally, YIELD exhibited higher values under fullrrigation than under limited irrigation over the entire probabilityange.
. Discussion
Because the Morris �* and Sobol’ STi results had such a high cor-elation, the remainder of this paper will refer to the sensitivity of
ut responses of interest, created from Sobol’ model runs. Y-axis indicates cumulative
a parameter in a general sense rather than in specific terms of SAmethod (i.e., Morris or Sobol’). It is important to consider that theresults for Morris were found with 170 runs and a simpler algo-rithm than the more complicated Sobol’ algorithm which required2080 runs (with n = 160 cycles to determine sample size). WhileSaltelli (1999) recommends n in the range of 100 or higher, Saltelliet al. (2005) also note that n is typically in the range of 500–1000.Preliminary Sobol’ runs performed for this study indicated thatsensitivity obtained with n = 160 had results indistinguishable ton = 1200, and we expect that increasing the total number of Sobol’runs would only give the same results at additional cost. Regard-less, the Morris and Sobol’ methods served equally well in terms ofnot only ranking the input parameters, but also in quantifying rel-ative total sensitivity of the input parameters. Similar results werefound by Campolongo et al. (2007) when assessing the sensitivity of
a chemical reaction model for dimethylsulphide (DMS). As the Mor-ris method is less computationally expensive, it may be preferredover the Sobol’ method for many types of SA studies. However, cau-tion must be used in this approach as interactions and nonlinearity
l Mod
a(auefilScysott(ie
naacadiAtiEiaoepiebtsi(ilotshioi
iiHwiuieccisisa
K.C. DeJonge et al. / Ecologica
re difficult to distinguish based on Morris screening results aloneSaltelli et al., 2000a). For example, in a previous study Campolongond Saltelli (1997) performed both Morris and Sobol’ analysessing the GMSK model to simulate the oceanic production of DMS,valuating 34 factors, and found that the Pearson correlation coef-cient (r) between the Morris and Sobol’ methods was 0.66, a much
ower value than consistently found in this study. Campolongo andaltelli (1997) go on to suggest a procedure matching accuracy andost that would include a Morris analysis followed by a Sobol’ anal-sis on a subset of selected inputs, just as was conducted in thistudy. However, simple linear correlations between the two meth-ds were very high in our case. Confalonieri et al. (2010b) usedhe rice model WARM to conduct SAs using the Morris method,hree regression-based methods, and two variance-based methodsE-FAST and Sobol’), finding that the simpler SA methods includ-ng Morris gave comparable results to the more computationallyxpensive Sobol’ method.
CERES-Maize output responses ADAY, MDAY, and LNS had nootable sensitivity difference between treatments, indicating thatnthesis and maturity timing (as well as successive leaf tip appear-nces) are generally insensitive to the effects of water stress. This isontradictory to some observed field responses, for example Farrend Faci (2006) observed delays in maize flowering and maturityue to water stress, and DeJonge et al. (2011) observed differences
n total leaf count for the same field experiment used in this study.brecht and Carberry (1993) observed delayed leaf tip emergence,
assel emergence, silking, and onset of grain filling due to vary-ng amounts of water stress. For the CERES-Maize LAIX, YIELD, andTC output responses, water holding capacity was an extremelymportant factor in regard to sensitivity under limited irrigation,s the sensitivity is highly dependent upon the water managementbjectives. For full irrigation, none of the model output responsesvaluated in this study exhibited significant sensitivity to the soilarameters SLLL or SDUL. However, under limited irrigation, these
nput parameters were very important in terms of total sensitivity,specially SLLL which was the most sensitive input parameter foroth LAIX and ETC (Table 3). This indicates that much more atten-ion is required in estimating SLLL and SDUL for limited irrigationimulations than for full irrigation simulations, especially SLLL ast is a main limiting factor for leaf area growth, crop yield, and ETFig. 2). Interactions are also important to consider, for examplen LAIX under limited irrigation SLLL has a large interaction (0.09),ikely with P1 and PHINT as no other inputs show a large amountf interaction (Fig. 2). SLDR was also an influential input in regardo ETC under limited irrigation, as increased drainage out of theoil profile limits the model’s ability to meet ET demand, and alsoad a large interaction with other parameters (0.17). Where these
nteractions exist, all parameters should be considered simultane-usly instead of one at a time, and this GSA study illustrates thismportance.
The UA results offer some interesting insight into the behav-or of the model (Table 5 and Fig. 3). There was little differencen sensitivity between irrigation treatments for ADAY and MDAY.owever, the UA showed a shift in ADAY for limited irrigation,hich may partially be due to delayed crop planting for some lim-
ted irrigation treatments, but more likely due to sensitivity to somenknown response not evaluated in this study. Responses also var-
ed between irrigation treatments for MDAY, with the CDFs crossingach other twice and both having strong vertical lines, indicatingrop maturity at the same date for many simulations. This trendan be explained as an interaction between the weather inputs, therrigation treatment, and model code that indicates maturity (or
imulation end) under specific conditions. LNS essentially exhib-ted the same uncertainty between irrigation treatments, with alight decrease in LNS under limited irrigation; these differencesre illustrated in Fig. 2 where a very small sensitivity to soil waterelling 231 (2012) 113– 125 123
parameters is seen for limited irrigation. For LAIX, there was avery broad range in uncertainty for both treatments, and inter-estingly the CDF and statistics for full irrigation indicated lowerLAIX values than under limited irrigation. Upon closer examina-tion of the results, in many cases LAIX was higher for full irrigationthan for limited irrigation as expected, but limited irrigation hadhigher LAIX values overall. This trend is likely due to increased par-titioning to leaf biomass when the crop is under water stress. It isalso important to consider that LAIX indicates the maximum LAIover the season and under stressed conditions the LAI will oftenspike and decrease quickly because of senescence. Future studiesmay consider using an average LAI during a specific developmentalstage; however, with differing treatments and input parametersthe growth stages obviously would be dynamic and difficult toglean from the outputs. As expected, YIELD was higher for fullirrigation than limited irrigation across the uncertainty range. The95% CI indicates predicted yields of 14,190 kg ha−1 under full irri-gation, numbers that are typically unrealistic under these climaticconditions. These high simulated yields may be due to unique com-binations of input parameters that maximize yield, for examplelarge values for input parameters RUE P2, G2, G3. At higher cumula-tive probabilities, ETC was higher for full irrigation than for limitedirrigation, as would be expected (i.e., the 95% CI predicts 656 mm forfull irrigation and 645 mm for limited irrigation). However, as ETCdecreases, the values were actually higher for limited irrigation (i.e.,the 5% CI predicts 346 mm for full irrigation and 439 mm for lim-ited irrigation). This trend supports the conclusion of DeJonge et al.(2011) that CERES-Maize tends to overpredict evapotranspirationwhile the crop is under water stress.
Ma et al. (2011) describe a systematic calibration of cultivarparameters for DSSAT models, in which they suggest calibratingthese inputs based on phenology first, followed by biomass, LAI, andyield. As this GSA study shows, the calibration method describedby Ma et al. (2011) may be appropriate in a study that observesno water stress. However, the difference in input sensitivity inregard to limited irrigation treatments found in this study pro-vides a unique opportunity to perform a systematic calibrationof datasets for water stressed conditions, such as those used inDeJonge et al. (2011), and could provide guidance for other DSSATmodelers to improve calibrations under limited water conditions.Such a calibration would be roughly based on the method describedby Ma et al. (2011) by calibrating or parameterizing individual out-put responses to observed values based on which influential inputscan be solved for the most easily. However, this new calibrationmethod would also acknowledge the strong influence that waterholding capacity has on outputs such as LAI and yield. In this study,no output response was overly sensitive to P2 so the recommendeddefault value for this parameter could likely be used. PHINT alsowas not an overly sensitive parameter in this study, but could beestimated based on observations of successive leaf tip appearancesand growing degree days. Once PHINT is known, P1 can then beestimated by matching ADAY for both treatments and LNS for fullirrigation only (as we know that limited irrigation, the model willnot correctly predict observed leaf number). With P1 and PHINTknown, only P5 is left to estimate to fit MDAY. At this point, LAIX(and leaf area index throughout the season, for that matter) shouldmatch closely for full irrigation. Soil hydraulic parameters SLLL andSDUL can then be estimated within acceptable levels for the knownsoil type, and should help closely match leaf area index for thelimited irrigation treatment. Ma et al. (2011) recommend usingSLPF to improve simulations, but this study found all relevantoutputs to be insensitive to changes in SLPF. While RUE has not
traditionally been documented in past studies as a calibrationparameter, this study suggests it could be evaluated within rea-sonable ranges. RUE can also be used to make smaller adjustmentsto LAIX, as it provides some sensitivity without interactions, and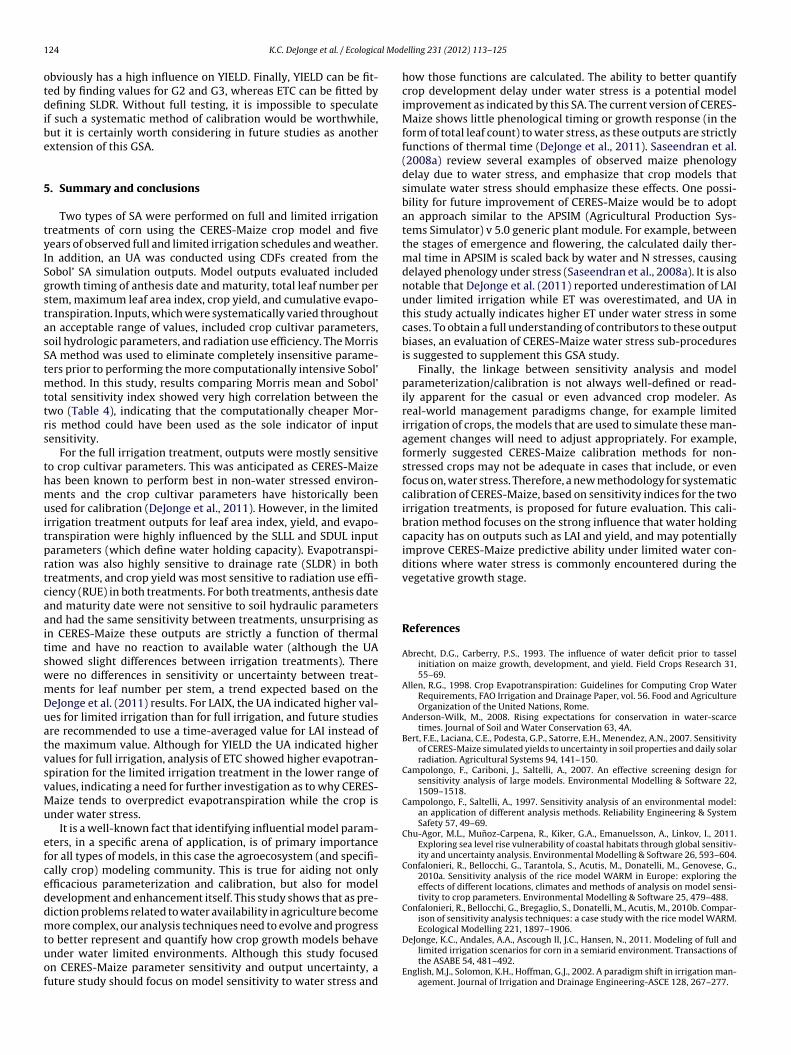
1 l Mod
otdibe
5
tyISgstasStmttrs
thmuitprtcaaitswmDuatvsvMu
efceddmtuof
24 K.C. DeJonge et al. / Ecologica
bviously has a high influence on YIELD. Finally, YIELD can be fit-ed by finding values for G2 and G3, whereas ETC can be fitted byefining SLDR. Without full testing, it is impossible to speculate
f such a systematic method of calibration would be worthwhile,ut it is certainly worth considering in future studies as anotherxtension of this GSA.
. Summary and conclusions
Two types of SA were performed on full and limited irrigationreatments of corn using the CERES-Maize crop model and fiveears of observed full and limited irrigation schedules and weather.n addition, an UA was conducted using CDFs created from theobol’ SA simulation outputs. Model outputs evaluated includedrowth timing of anthesis date and maturity, total leaf number pertem, maximum leaf area index, crop yield, and cumulative evapo-ranspiration. Inputs, which were systematically varied throughoutn acceptable range of values, included crop cultivar parameters,oil hydrologic parameters, and radiation use efficiency. The MorrisA method was used to eliminate completely insensitive parame-ers prior to performing the more computationally intensive Sobol’
ethod. In this study, results comparing Morris mean and Sobol’otal sensitivity index showed very high correlation between thewo (Table 4), indicating that the computationally cheaper Mor-is method could have been used as the sole indicator of inputensitivity.
For the full irrigation treatment, outputs were mostly sensitiveo crop cultivar parameters. This was anticipated as CERES-Maizeas been known to perform best in non-water stressed environ-ents and the crop cultivar parameters have historically been
sed for calibration (DeJonge et al., 2011). However, in the limitedrrigation treatment outputs for leaf area index, yield, and evapo-ranspiration were highly influenced by the SLLL and SDUL inputarameters (which define water holding capacity). Evapotranspi-ation was also highly sensitive to drainage rate (SLDR) in bothreatments, and crop yield was most sensitive to radiation use effi-iency (RUE) in both treatments. For both treatments, anthesis datend maturity date were not sensitive to soil hydraulic parametersnd had the same sensitivity between treatments, unsurprising asn CERES-Maize these outputs are strictly a function of thermalime and have no reaction to available water (although the UAhowed slight differences between irrigation treatments). Thereere no differences in sensitivity or uncertainty between treat-ents for leaf number per stem, a trend expected based on theeJonge et al. (2011) results. For LAIX, the UA indicated higher val-es for limited irrigation than for full irrigation, and future studiesre recommended to use a time-averaged value for LAI instead ofhe maximum value. Although for YIELD the UA indicated higheralues for full irrigation, analysis of ETC showed higher evapotran-piration for the limited irrigation treatment in the lower range ofalues, indicating a need for further investigation as to why CERES-aize tends to overpredict evapotranspiration while the crop is
nder water stress.It is a well-known fact that identifying influential model param-
ters, in a specific arena of application, is of primary importanceor all types of models, in this case the agroecosystem (and specifi-ally crop) modeling community. This is true for aiding not onlyfficacious parameterization and calibration, but also for modelevelopment and enhancement itself. This study shows that as pre-iction problems related to water availability in agriculture becomeore complex, our analysis techniques need to evolve and progress
o better represent and quantify how crop growth models behavender water limited environments. Although this study focusedn CERES-Maize parameter sensitivity and output uncertainty, auture study should focus on model sensitivity to water stress and
elling 231 (2012) 113– 125
how those functions are calculated. The ability to better quantifycrop development delay under water stress is a potential modelimprovement as indicated by this SA. The current version of CERES-Maize shows little phenological timing or growth response (in theform of total leaf count) to water stress, as these outputs are strictlyfunctions of thermal time (DeJonge et al., 2011). Saseendran et al.(2008a) review several examples of observed maize phenologydelay due to water stress, and emphasize that crop models thatsimulate water stress should emphasize these effects. One possi-bility for future improvement of CERES-Maize would be to adoptan approach similar to the APSIM (Agricultural Production Sys-tems Simulator) v 5.0 generic plant module. For example, betweenthe stages of emergence and flowering, the calculated daily ther-mal time in APSIM is scaled back by water and N stresses, causingdelayed phenology under stress (Saseendran et al., 2008a). It is alsonotable that DeJonge et al. (2011) reported underestimation of LAIunder limited irrigation while ET was overestimated, and UA inthis study actually indicates higher ET under water stress in somecases. To obtain a full understanding of contributors to these outputbiases, an evaluation of CERES-Maize water stress sub-proceduresis suggested to supplement this GSA study.
Finally, the linkage between sensitivity analysis and modelparameterization/calibration is not always well-defined or read-ily apparent for the casual or even advanced crop modeler. Asreal-world management paradigms change, for example limitedirrigation of crops, the models that are used to simulate these man-agement changes will need to adjust appropriately. For example,formerly suggested CERES-Maize calibration methods for non-stressed crops may not be adequate in cases that include, or evenfocus on, water stress. Therefore, a new methodology for systematiccalibration of CERES-Maize, based on sensitivity indices for the twoirrigation treatments, is proposed for future evaluation. This cali-bration method focuses on the strong influence that water holdingcapacity has on outputs such as LAI and yield, and may potentiallyimprove CERES-Maize predictive ability under limited water con-ditions where water stress is commonly encountered during thevegetative growth stage.
References
Abrecht, D.G., Carberry, P.S., 1993. The influence of water deficit prior to tasselinitiation on maize growth, development, and yield. Field Crops Research 31,55–69.
Allen, R.G., 1998. Crop Evapotranspiration: Guidelines for Computing Crop WaterRequirements, FAO Irrigation and Drainage Paper, vol. 56. Food and AgricultureOrganization of the United Nations, Rome.
Anderson-Wilk, M., 2008. Rising expectations for conservation in water-scarcetimes. Journal of Soil and Water Conservation 63, 4A.
Bert, F.E., Laciana, C.E., Podesta, G.P., Satorre, E.H., Menendez, A.N., 2007. Sensitivityof CERES-Maize simulated yields to uncertainty in soil properties and daily solarradiation. Agricultural Systems 94, 141–150.
Campolongo, F., Cariboni, J., Saltelli, A., 2007. An effective screening design forsensitivity analysis of large models. Environmental Modelling & Software 22,1509–1518.
Campolongo, F., Saltelli, A., 1997. Sensitivity analysis of an environmental model:an application of different analysis methods. Reliability Engineering & SystemSafety 57, 49–69.
Chu-Agor, M.L., Munoz-Carpena, R., Kiker, G.A., Emanuelsson, A., Linkov, I., 2011.Exploring sea level rise vulnerability of coastal habitats through global sensitiv-ity and uncertainty analysis. Environmental Modelling & Software 26, 593–604.
Confalonieri, R., Bellocchi, G., Tarantola, S., Acutis, M., Donatelli, M., Genovese, G.,2010a. Sensitivity analysis of the rice model WARM in Europe: exploring theeffects of different locations, climates and methods of analysis on model sensi-tivity to crop parameters. Environmental Modelling & Software 25, 479–488.
Confalonieri, R., Bellocchi, G., Bregaglio, S., Donatelli, M., Acutis, M., 2010b. Compar-ison of sensitivity analysis techniques: a case study with the rice model WARM.Ecological Modelling 221, 1897–1906.
DeJonge, K.C., Andales, A.A., Ascough II, J.C., Hansen, N., 2011. Modeling of full andlimited irrigation scenarios for corn in a semiarid environment. Transactions ofthe ASABE 54, 481–492.
English, M.J., Solomon, K.H., Hoffman, G.J., 2002. A paradigm shift in irrigation man-agement. Journal of Irrigation and Drainage Engineering-ASCE 128, 267–277.
l Mod
F
F
F
H
H
H
H
H
H
H
J
J
L
L
M
M
M
M
M
M
M
MM
M
M
M
K.C. DeJonge et al. / Ecologica
arre, I., Faci, J.M., 2006. Comparative response of maize (Zea mays L.) and sorghum(Sorghum bicolor L. Moench) to deficit irrigation in a Mediterranean environ-ment. Agricultural Water Management 83, 135–143.
ox, G.A., Munoz-Carpena, R., Sabagh, G.J., 2010. Influence of flow concentrationon parameter importance and prediction uncertainty of pesticide trapping byvegetative filter strips. Journal of Hydrology 384, 164–173.
raisse, C.W., Sudduth, K.A., Kitchen, N.R., 2001. Calibration of the CERES-Maizemodel for simulating site-specific crop development and yield on claypan soils.Applied Engineering in Agriculture 17, 547–556.
aan, C.T., Storm, D.E., Al-Issa, T., Prabhu, S., Sabbagh, G.J., Edwards, D.R., 1998.Effect of parameter distributions on uncertainty analysis of hydrologic models.Transactions of the ASAE 41 (1), 65–70.
e, J., Dukes, M.D., Hochmuth, G.J., Jones, J.W., Graham, W.D., 2011. Evaluation ofsweet corn yield and nitrogen leaching with CERES-Maize considering inputparameter uncertainties. Transactions of the ASABE 54 (4), 1257–1268.
e, J., Dukes, M.D., Jones, J.W., Graham, W.D., Judge, J., 2009. Applying GLUE forestimating CERES-Maize genetic and soil parameters for sweet corn production.Transactions of the ASABE 52 (6), 1907–1921.
e, J., 2008. Best management practice development with the CERES-Maize modelfor sweet corn production in north Florida, Agricultural and Biological Engineer-ing. PhD Dissertation. University of Florida, Gainesville, FL, 328 pp.
elton, J.C., 1993. Uncertainty and sensitivity analysis techniques for use in perfor-mance assessment for radioactive waste disposal. Reliability Engineering andSystem Safety 42, 327–367.
oogenboom, G., Jones, J.W., Wilkens, P.W., Porter, C.H., Batchelor, W.D., Hunt, L.A.,Boote, K.J., Singh, U., Uryasev, O., Bowen, W.T., Gijsman, A.J., du Toit, A., White,J.W., Tsuji, G.Y., 2004. Decision Support System for Agrotechnology Transfer, 4.0ed. University of Hawaii, Honolulu, HI, USA.
oogenboom, G., Jones, J.W., Wilkens, P.W., Porter, C.H., Boote, K.J., Hunt, L.A., Singh,U., Lizaso, J.L., White, J.W., Uryasev, O., Royce, F.S., Ogoshi, R., Gijsman, A.J., Tsuji,G.Y., 2010. Decision Support System for Agrotechnology Transfer (DSSAT), 4.5ed. University of Hawaii, Honolulu, HI, USA.
ones, C.A., Kiniry, J.R., 1986. CERES-Maize: A Simulation Model of Maize Growthand Development. Texas A&M University Press, College Station, TX, USA.
ones, J.W., Hoogenboom, G., Porter, C.H., Boote, K.J., Batchelor, W.D., Hunt, L.A.,Wilkens, P.W., Singh, U., Gijsman, A.J., Ritchie, J.T., 2003. The DSSAT croppingsystem model. European Journal of Agronomy 18, 235–265.
indquist, J.L., Arkebauer, T.J., Walters, D.T., Cassman, K.G., Dobermann, A., 2005.Maize radiation use efficiency under optimal growth conditions. AgronomyJournal 97, 72–78.
ópez-Cedrón, F.X., Boote, K.J., Pineiro, J., Sau, F., 2008. Improving the CERES-Maizemodel ability to simulate water deficit impact on maize production and yieldcomponents. Agronomy Journal 100, 296–307.
a, L., Ahuja, L.R., Saseendran, S.A., Malone, R.W., Green, T.R., Nolan, B.T., Bartling,P.N.S., Flerchinger, G.N., Boote, K.J., Hoogenboom, G., 2011. A protocol for param-eterization and calibration of RZWQM2 in field research. In: Ahuja, L.R., Ma, L.(Eds.), Methods of Introducing System Models into Agricultural Research. SSSABook Series, Madison, WI, pp. 1–64.
a, L., Ahuja, L.R., Malone, R.W., 2007. System modeling for soil and water researchand management: current status and needs for the 21st century. Transactionsof the ASABE 50, 1705–1713.
a, L., Ascough II., J.C., Ahuja, L.R., Schaffer, M.J., Hanson, J.D., Rojas, K.W., 2000. Rootzone water quality model sensitivity analysis using Monte Carlo simulation.Transactions of the ASABE 43, 883–895.
a, L., Hoogenboom, G., Ahuja, L.R., Ascough II., J.C., Saseendran, S.A., 2006.Evaluation of the RZWQM-CERES-Maize hybrid model for maize production.Agricultural Systems 87, 274–295.
akowski, D., Naud, C., Jeuffroy, M.-H., Barbottin, A., Monod, H., 2005. Global sen-sitivity analysis for calculating the contribution of genetic parameters to thevariance of crop model prediction. Reliability Engineering & System Safety 91,1142–1147.
akowski, D., Wallach, D., Tremblay, M., 2002. Using a Bayesian approach to param-eter estimation, comparison of the GLUE and MCMC methods. Agronomie 22 (2),191–203.
astrorilli, M., Katerji, N., Ben Nouna, B., 2003. Using the CERES-Maize model ina semi-arid Mediterranean environment. Validation of three revised versions.European Journal of Agronomy 19, 125–134.
athworks, 2010. MATLAB 2010. Natick, MA. http://www.mathworks.com.onod, H., Naud, C., Makowski, D., 2006. Uncertainty and sensitivity analysis for crop
models. In: Wallach, D., Makowski, D., Jones, J.W. (Eds.), Working with DynamicCrop Models. Elsevier, Amsterdam/The Netherlands, pp. 55–99.
orris, M.D., 1991. Factorial sampling plans for preliminary computational experi-ments. Technometrics 33, 161–174.
unoz-Carpena, R., Fox, G.A., Sabbagh, G.J., 2010. Parameter importance and uncer-
tainty in predicting runoff pesticide reduction with filter strips. Journal ofEnvironmental Quality 39 (1), 1–12.unoz-Carpena, R., Zajac, Z., Kuo, Y.M., 2007. Global sensitivity and uncertaintyanalyses of the water quality model VFSMOD-W. Transactions of the ASABE 50(5), 1719–1732.
elling 231 (2012) 113– 125 125
Nouna, B.B., Katerji, N., Mastrorilli, M., 2000. Using the CERES-Maize model in a semi-arid Mediterranean environment. Evaluation of model performance. EuropeanJournal of Agronomy 13, 309–322.
Pathak, T.B., Fraisse, C.W., Jones, J.W., Messina, C.D., Hoogenboom, G., 2007. Use ofglobal sensitivity analysis for CROPGRO cotton model development. Transac-tions of the ASABE 50, 2295–2302.
Priestley, C.H.B., Taylor, R.J., 1972. On the assessment of surface heat flux and evap-oration using large-scale parameters. Monthly Weather Review 100, 81–92.
Ritchie, J.T., 1998. Soil water balance and plant water stress. In: Tsuji, G.Y.,Hoogenboom, G., Thorton, P.K. (Eds.), Understanding Options for Agricul-tural Production. Kluwer Academic Publishing, Dordrecht, The Netherlands,pp. 41–54.
Ritchie, J.T., Singh, U., Godwin, D.C., Bowen, W.T., 1998. Cereal growth, development,and yield. In: Tsuji, G.Y., Hoogenboom, G., Thorton, P.K. (Eds.), UnderstandingOptions for Agricultural Production. Kluwer Academic Publishing, Dordrecht,The Netherlands, pp. 79–98.
Saltelli, A., 1999. Sensitivity analysis: could better methods be used? Journal ofGeophysical Research 104(D3), 3789–3793, doi:10.1029/1998JD100042.
Saltelli, A., 2002. Making best use of model evaluations to compute sen-sitivity indices. Computer Physics Communications 145 (2), 280–297,doi:10.1016/s0010-4655(02)00280-1.
Saltelli, A., Chan, K., Scott, E.M., 2000a. Sensitivity Analysis. Wiley, Chichester, Eng-land, 508 pp.
Saltelli, A., Ratto, M., Tarantola, S., Campolongo, F., 2005. Sensitivity analysis forchemical models. Chemical Reviews 105 (7), 2811–2827.
Saltelli, A., Ratto, M., Andres, T., Campolongo, F., Cariboni, J., Gatelli, D., Saisana, M.,Tarantola, S., 2008. Global Sensitivity Analysis: The Primer. John Wiley, Chich-ester, England, 292 pp.
Saltelli, A., Tarantola, S., Campolongo, F., 2000b. Sensitivity analysis as an ingredientof modeling. Statistical Science 15, 377–395.
Saltelli, A., Tarantola, S., Campolongo, F., Ratto, M., 2004. Sensitivity Analysis inPractice: A Guide to Assessing Scientific Models. Wiley, Chichester, 232 pp.
Saltelli, A., Tarantola, S., Chan, K.P.S., 1999. A quantitative model-independentmethod for global sensitivity analysis of model output. Technometrics 41, 39–56.
Saseendran, S.A., Ahuja, L.R., Ma, L., Timlin, D.J., Stockle, C.O., Boote, K.J., Hoogen-boom, G., 2008a. Current water deficit stress simulations in selected agriculturalsystem simulation models. In: Ahuja, L.R., Reddy, V.R., Saseendran, S.A., Yu, Q.(Eds.), Response of Crops to Limited Water: Understanding and Modeling WaterStress Effects on Plant Growth Processes. American Society of Agronomy. CropScience Society of America, Soil Science Society of America, Madison, WI, USA,pp. 1–38.
Saseendran, S.A., Ahuja, L.R., Nielsen, D.C., Trout, T.J., Ma, L., 2008b. Useof crop simulation models to evaluate limited irrigation managementoptions for corn in a semiarid environment. Water Resources Research 44,doi:10.1029/2007WR006181.
Schneekloth, J.P., Bauder, T.A., Hansen, N., 2009. Limited Irrigation Management:Principles and Practices. Colorado State University Extension, Fort Collins, CO.
Schwab, G.O., Fangmeier, D.D., Elliot, W.J., Frevert, R.K., 1993. Soil andWater Conservation Engineering, 4th ed. John Wiley & Sons, Chichester,508 pp.
Simlab, 2010. Software package for uncertainty and sensitivity analysis. JointResearch Centre of the European Commission. http://simlab.jrc.ec.europa.eu.
Singh, U., 1985. A Crop Growth Model for Predicting Corn (Zea mays L.) Performancein the Tropics. Department of Agronomy, University of Hawaii, Honolulu, HI,USA.
Sobol’, I.M., 1993. Sensitivity analysis for non-linear mathematical models. Mathe-matical Modelling and Computer Experiments 1, 407–414.
Stöckle, C.O., Kemanian, A.R., Kremer, C., 2008. On the use of radiation- and water-useefficiency for biomass production models. In: Ahuja, L.R., Reddy, V.R., Saseen-dran, S.A., Yu, Q. (Eds.), Response of Crops to Limited Water: Understanding andModeling Water Stress Effects on Plant Growth Processes. American Society ofAgronomy, Crop Science Society of America, Soil Science Society of America,Madison, WI, USA, pp. 39–58.
St’astná, M., Zalud, Z., 1999. Sensitivity analysis of soil hydrologic parame-ters for two crop growth simulation models. Soil and Tillage Research 50,305–318.
Tong, C., 2010. Self-validated variance-based methods for sensitivity analysis ofmodel outputs. Reliability Engineering & System Safety 95, 301–309.
USDA-SCS, 1972. Hydrology section 4, soil conservation service. In: National Engi-neering Handbook. GPO, Washington, DC, USA.
Varella, H., Guérif, M., Buis, S., 2010. Global sensitivity analysis measures the qualityof parameter estimation: the case of soil parameters and a crop model. Environ-mental Modelling & Software 25, 310–319.
Wang, X., He, X., Williams, J.R., Izaurralde, R.C., Atwood, J.D., 2005. Sensitivity and
uncertainty analyses of crop yields and soil organic carbon simulated with EPIC.Transactions of the ASABE 48 (3), 1041–1054.Xie, Y., Kiniry, J.R., Nedbalek, V., Rosenthal, W.D., 2001. Maize and sorghum sim-ulations with CERES-Maize, SORKAM, and ALMANAC under water-limitingconditions. Agronomy Journal 93, 1148–1155.