Embed Size (px)
Citation preview
Ecological Modelling 320 (2016) 29–43
Contents lists available at ScienceDirect
Ecological Modelling
journa l h om epa ge: www.elsev ier .com/ locate /eco lmodel
Review
Phytoplankton functional type modelling: Running before we canwalk? A critical evaluation of the current state of knowledge
Yuko Shimoda, George B. Arhonditsis ∗
Ecological Modelling Laboratory, Department of Physical & Environmental Sciences, University of Toronto, Toronto, Ontario, Canada M1C 1A4
a r t i c l e i n f o
Article history:Received 16 May 2015Received in revised form 23 August 2015Accepted 24 August 2015
Keywords:Mathematical modelsResource competitionPhytoplankton functional groupingEcological diversityCyanobacteria
a b s t r a c t
In the context of aquatic biogeochemical modelling, there is an increasing pressure to explicitly treatmultiple biogeochemical cycles and to increase the functional diversity of biotic communities. In thisstudy, we evaluate the capacity of 124 aquatic biogeochemical models to reproduce the dynamics ofphytoplankton functional groups. Our analysis reinforces earlier findings that aquatic ecosystem mod-ellers do not seem to consistently apply conventional methodological steps during the development oftheir models. Although there is an improvement relative to earlier critiques, significant portion of pub-lished studies did not properly assess model sensitivity to input vectors; aquatic ecosystem modellersare still reluctant to embrace optimization techniques during model calibration; and assess the abilityof their models to support predictions in the extrapolation domain. We also found significant variabilitywith respect to the mathematical representation of key physiological processes (e.g., growth strategies,nutrient kinetics, settling velocities) as well as group-specific characterizations typically considered inthe pertinent literature. Cyanobacteria blooms are a major concern for water industries as they repre-sent high risk for human health and economic costs for drinking water treatment, and thus one of theoutstanding challenges is to offer credible modelling tools that can serve as early warning systems toassist with the operational control of cyanobacteria blooms. Our study suggests that the derivation ofdistinct functional groups from fairly heterogeneous planktonic assemblages poses challenging problems.Because of the still poorly understood ecology, we do not have robust group-specific parameterizationsthat can support predictions in a wide array of spatiotemporal domains. In this context, we argue thatthe most prudent strategies are the gradual incorporation of complexity, where possible and relevant,along with an open dialogue on how we can mathematically depict the interconnections among differentphytoplankton subunits or even how we can frame the suitable data collection efforts.
© 2015 Elsevier B.V. All rights reserved.
Contents
1. Introduction . . . . . . . . . . . . . . . . . . . . . . . . . . . . . . . . . . . . . . . . . . . . . . . . . . . . . . . . . . . . . . . . . . . . . . . . . . . . . . . . . . . . . . . . . . . . . . . . . . . . . . . . . . . . . . . . . . . . . . . . . . . . . . . . . . . . . . . . . . . . . 302. Methods . . . . . . . . . . . . . . . . . . . . . . . . . . . . . . . . . . . . . . . . . . . . . . . . . . . . . . . . . . . . . . . . . . . . . . . . . . . . . . . . . . . . . . . . . . . . . . . . . . . . . . . . . . . . . . . . . . . . . . . . . . . . . . . . . . . . . . . . . . . . . . . . . 313. Results and discussion . . . . . . . . . . . . . . . . . . . . . . . . . . . . . . . . . . . . . . . . . . . . . . . . . . . . . . . . . . . . . . . . . . . . . . . . . . . . . . . . . . . . . . . . . . . . . . . . . . . . . . . . . . . . . . . . . . . . . . . . . . . . . . . . . . 32
3.1. How consistently do PFG modelling studies follow conventional methodological procedures? . . . . . . . . . . . . . . . . . . . . . . . . . . . . . . . . . . . . . . . . . . . . . . 323.2. How well do PFG models reproduce phytoplankton community dynamics? . . . . . . . . . . . . . . . . . . . . . . . . . . . . . . . . . . . . . . . . . . . . . . . . . . . . . . . . . . . . . . . . . . 343.3. What are the typical PFG conceptualizations that influence their parameter specification? . . . . . . . . . . . . . . . . . . . . . . . . . . . . . . . . . . . . . . . . . . . . . . . . . . 353.4. What are the differences between the characterization of “cyanobacteria-like” state variables relative to other algal
functional groups? . . . . . . . . . . . . . . . . . . . . . . . . . . . . . . . . . . . . . . . . . . . . . . . . . . . . . . . . . . . . . . . . . . . . . . . . . . . . . . . . . . . . . . . . . . . . . . . . . . . . . . . . . . . . . . . . . . . . . . . . . . . . . . 364. Concluding remarks and future perspectives . . . . . . . . . . . . . . . . . . . . . . . . . . . . . . . . . . . . . . . . . . . . . . . . . . . . . . . . . . . . . . . . . . . . . . . . . . . . . . . . . . . . . . . . . . . . . . . . . . . . . . . . . . 40
Acknowledgments . . . . . . . . . . . . . . . . . . . . . . . . . . . . . . . . . . . . . . . . . . . . . . . . . . . . . . . . . . . . . . . . . . . . . . . . . . . . . . . . . . . . . . . . . . . . . . . . . . . . . . . . . . . . . . . . . . . . . . . . . . . . . . . . . . . . . . 41Appendix A. Supplementary data . . . . . . . . . . . . . . . . . . . . . . . . . . . . . . . . . . . . . . . . . . . . . . . . . . . . . . . . . . . . . . . . . . . . . . . . . . . . . . . . . . . . . . . . . . . . . . . . . . . . . . . . . . . . . . . . . . . 41References . . . . . . . . . . . . . . . . . . . . . . . . . . . . . . . . . . . . . . . . . . . . . . . . . . . . . . . . . . . . . . . . . . . . . . . . . . . . . . . . . . . . . . . . . . . . . . . . . . . . . . . . . . . . . . . . . . . . . . . . . . . . . . . . . . . . . . . . . . . . . . 41
∗ Corresponding author. Tel.: +1 416 208 4858; fax: +1 416 287 7279.E-mail address: [email protected] (G.B. Arhonditsis).
http://dx.doi.org/10.1016/j.ecolmodel.2015.08.0290304-3800/© 2015 Elsevier B.V. All rights reserved.
30 Y. Shimoda, G.B. Arhonditsis / Ecological Modelling 320 (2016) 29–43
“. . .Inadequacies and dysfunctionalities in models are not compen-sated for by the collection and use of data describing only part of thestory. The devil is indeed in the details; nutrient-phytoplankton-zooplankton (NPZ) models get away with an awful lot by notexploring the details. If we are going to open Pandora’s box toexplore the details, then we had better be ready to handle thedemons that escape from it. . .”
Flynn, 2006, J. Plankton Res. 28, p. 875.
1. Introduction
It is more than 40 years ago, when Chen (1970) proposed ageneral set of differential equations for describing key physical,chemical, and biological processes of aquatic ecosystems with site-specific parameters, initial conditions, and forcing functions, whichwere then used to address water quality problems (Fulton et al.,2004; Friedrichs et al., 2006). The philosophy and basic set ofequations originally proposed remain the core of the current gen-eration of mechanistic aquatic biogeochemical models, althoughadvances in scientific understanding and improvements in meth-ods of numerical analysis have brought significant progress inregard to the accuracy and sophistication (Ward et al., 2013). Earlymodels were simple mathematical descriptions of aquatic systemsthat accounted for the interplay among nutrients, organic matterand aggregated biotic compartments, such as the generic “phy-toplankton” and “zooplankton” state variables (Anderson, 2005).At higher aggregation levels, plankton communities exhibit sat-isfactory predictability and are often proposed as a paradigm forshedding light on the spatiotemporal patterns of complex natu-ral systems (McCauley and Murdoch, 1987; Scheffer et al., 2003).Nonetheless, the aggregate plankton properties (total biomass, pro-ductivity) are also characterized by lower sensitivity to externalperturbations (episodic meteorological events, invasion of exoticspecies, excessive nutrient enrichment) and may be unreliableindicators of structural ecosystem shifts (Schindler, 1990; Frostet al., 1995). Further, in the context of water quality manage-ment, one of the central issues revolves around the elucidationof the mechanisms that shape the composition of phytoplanktonassemblages and the capacity to predict the occurrence of harm-ful algal blooms, such as toxin-producing cyanobacteria. Thus, itis not surprising that simple models are frequently perceived asinadequate (or even obsolete) management tools (Flynn, 2005,2006; Le Quere, 2006), and modellers increasingly opt for moresophisticated constructs designed to explicitly represent multiplebiogeochemical cycles, to accommodate the functional diversityof biotic communities, and to depict the interactions of planktoncommunities with the higher food web (Van Nes and Scheffer,2005).
Delineating the optimal resolution level for phytoplanktonmodelling studies poses significant challenges, and thus far oneof the most defensible strategies involves the concept of “func-tional grouping” relative to strategies that revolve around thespecification of size classes, modelling of individual species, orstipulation of goal functions (Jorgensen, 1999; Reynolds et al.,2002). Founded upon the classification of species on the basis oftheir general morphological, physiological, and ecological char-acteristics, the functional grouping offers an intuitively plausibleapproach that accounts for different patterns of adaptive spe-cialism, while accommodating the notion that external (seasonalforcing, resource availability) and internal (inter-specific com-petition, trophodynamics) factors may profoundly modulate theexpected signals of phytoplankton community (Reynolds et al.,2002). In the typical modelling practice, the characterization ofeach phytoplankton functional group (PFG) postulates differentdegrees of specialization for limiting resources (nutrients, light)and/or environmental conditions (temperature), while purporting
to reproduce inter-specific competitive interactions which – inreality – are characterized by an inconceivably wide array ofphysiological adaptations (mixotrophy, life stages) and sustainedcoexistence (Flynn, 2006; Thingstad et al., 2010). However, becauseof the poorly understood ecology, the literature debates to whatextent we have robust group-specific parameterizations that cansupport predictions in a variable range of spatiotemporal domains.Modellers often use pre-conceived functional groups with subjec-tive properties that are conveniently derived during the modelfitting exercise to observed data (Thingstad et al., 2010). Forexample, preliminary efforts to incorporate plankton functionaltypes into global biogeochemical models were based on spec-ulative parameterization and – not surprisingly – resulted inunreliable predictions (Anderson, 2005). Likewise, Zhao et al.(2008) showed that the reproduction of seasonal succession plank-ton patterns in freshwater ecosystems is fairly sensitive andonly occurs within a narrow window of the model parame-ter space. The latter study also pondered if it is “reasonableto expect single-valued data set-specific parameter estimates ofartificially defined biotic entities to be extrapolated over widergeographical regions?” Thus, recognizing that the functional groupmodelling does not necessarily guarantee improved predictabil-ity, it is advised that the gradual incorporation of complexity,where possible and relevant, is the most prudent strategy andany such model development should be tightly coupled withrigorous assessment of the underlying uncertainty (Arhonditsis,2010).
Given the importance of the topic, it is surprising the lack ofpublished work to quantify the ability of PFG models in accuratelyreproducing the aggregated and compositional phytoplanktonvariability. In this regard, the present study evaluates the capacityof 124 aquatic biogeochemical models to reproduce the dynamicsof phytoplankton functional groups across the range of tempo-ral and spatial scales typically utilized. Following the practicespresented in meta-analysis papers (Arhonditsis and Brett, 2004;Arhonditsis et al., 2006; Wellen et al., 2015), we first examine howconsistently do modellers follow conventional methodological pro-cedures, such as the quantification of goodness-of-fit, sensitivityanalysis, and model validation in its broadest sense (predictiveand structural confirmation, model transferability). We then eval-uate the capacity of PFG models to reproduce seasonal successionpatterns and structural shifts in phytoplankton communities indifferent geographical locations and environmental conditions.Along with the quantitative information, we also compile the mostcommonly used mathematical equations, parameter ranges andcalibration methods used to reproduce phytoplankton functionalgroups, with special emphasis on cyanobacteria as one of the majorthreats to freshwater ecosystem health and integrity. Our intentionis not to determine the most reliable way to refine the biotic reso-lution, but rather to assess the general performance of existing PFGmodels, to evaluate the methodological consistency during theirdevelopment, to delve into how autotrophic organisms have beenaggregated, and to pinpoint any major issues of model dysfunc-tionality. Our hypothesis is that the sizable number of modellingstudies, which successfully passed the scrutiny of the peer-reviewprocess along with the experience gained from addressing a widerange of management problems, can objectively reveal systematicbiases, methodological inconsistencies, and common misconcep-tions characterizing the field of PFG modelling. To the best of ourknowledge, this is the first attempt in the literature to present acomprehensive assessment of the current generation of PFG mod-els and examine the potential of improving the representation ofphytoplankton adaptive strategies for resource procurement. It isour hope that this study will contribute towards an effective link-age of the variability at the organismal level with ecosystem-scalepatterns.
Y. Shimoda, G.B. Arhonditsis / Ecological Modelling 320 (2016) 29–43 31
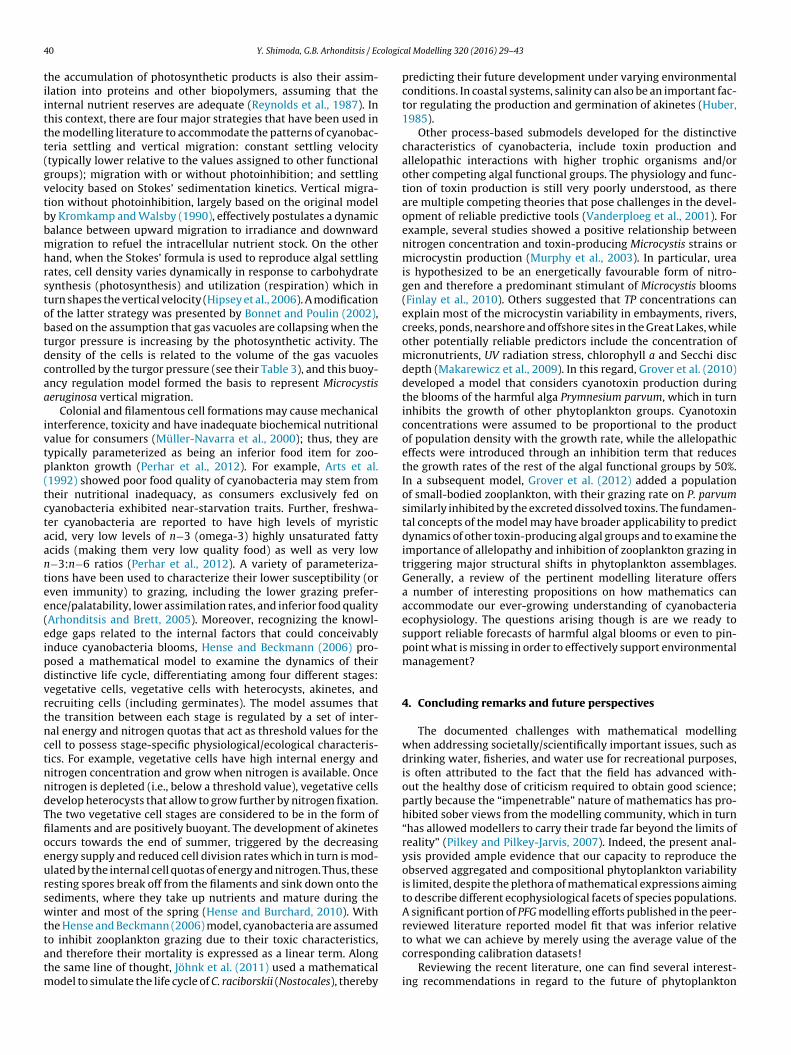
Fig. 1. Map of the locations modelled by the 124 studies included in our meta-analysis. Filled and non-filled circles represent freshwater and marine ecosystems.
2. Methods
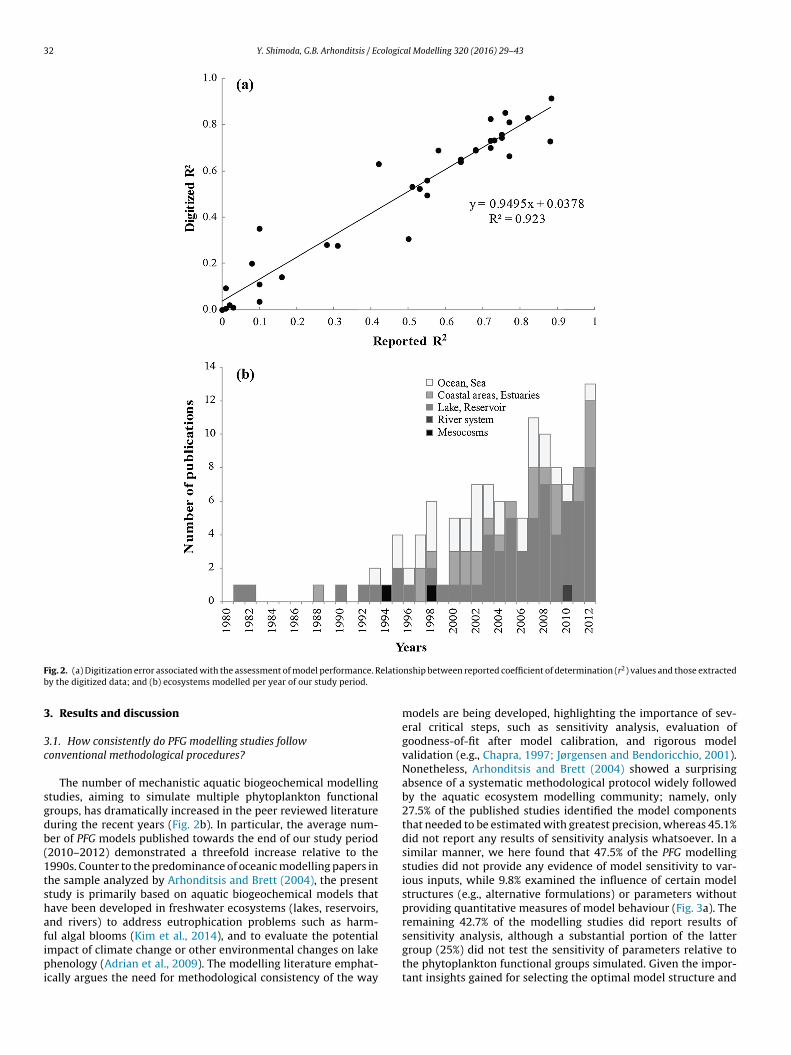
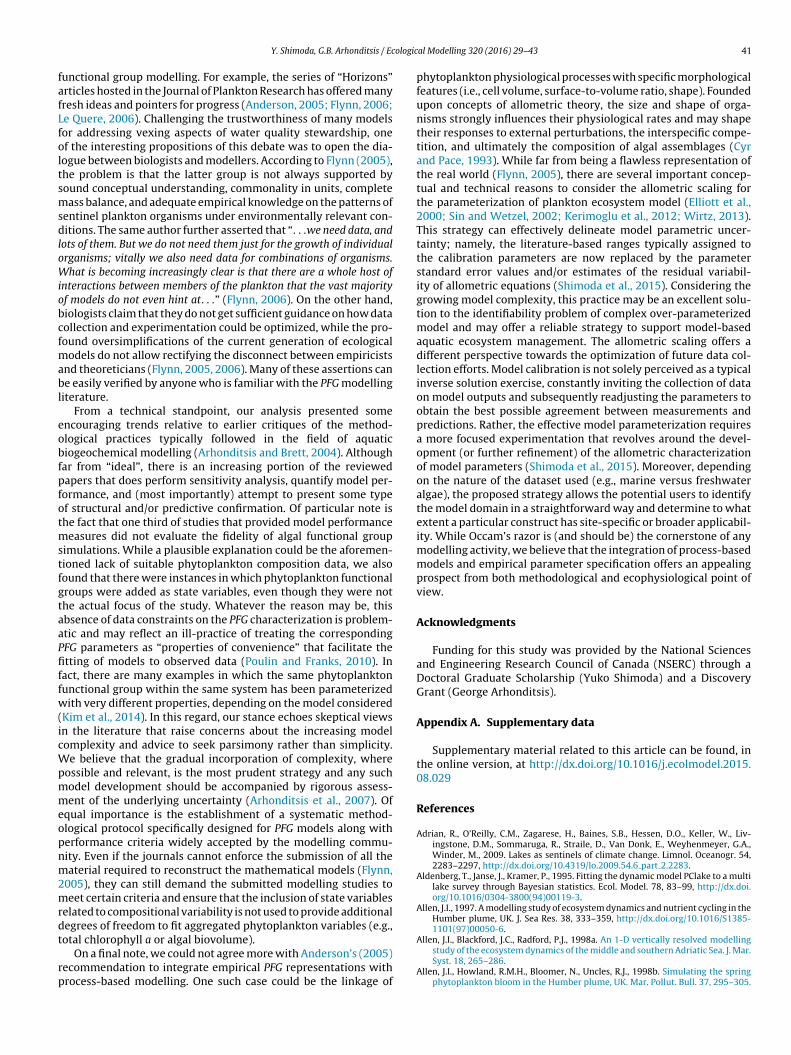
In this study, we reviewed aquatic biogeochemical mod-els that simulated multiple functional groups from 1980 to2012, with special emphasis placed on conceptualizations and/ormathematical representations typically followed when modellingcyanobacteria. The literature was searched using the electronicdatabases: “ISI Web of Science”, and “Scopus” using the fol-lowing keywords: “plankton functional group (PFG) or planktonfunctional type (PFT) model(l)-ing”, “phytoplankton model(l)-ing”,“cyanobacteria”, “biogeochemical model(l)-ing”, “lake ecosystemmodel(l)-ing”, “eutrophication model(l)-ing”. The criterion for astudy to be considered in our meta-analysis was the explicitconsideration of two or more phytoplankton groups within theoriginal or modified (e.g., through addition of sub-models, repa-rameterization, coupling with hydrodynamics) ecosystem model.In this endeavour, we eliminated theoretical and laboratory(culture batch) studies to evaluate model performance, as ourfocus was on model capacity to simulate phytoplankton groupdynamics in real world settings. The total number of stud-ies investigated was 124 with broad geographic representation,although the majority of the studied locations were in the north-ern hemisphere; especially in European freshwater and marineecosystems (Fig. 1; see also list of papers provided in Support-ing Information section). 114 of the selected papers providedsome type of information with respect to model performanceby comparing simulated against observed phytoplankton dynam-ics either visually or quantitatively. This also includes modelfit to aggregated phytoplankton variables, such as total phy-toplankton biomass and chlorophyll a. 62 studies out of 114selected studies provided only visual representation of modelperformance with time series, seasonal succession patterns, andspatial distribution of different functional algal groups. For thelatter group of modelling studies, we digitized the relevantgraphs to extract the original raw data and individually assessedtheir performance. We tested the magnitude of error that maystem from the digitizing processes by comparing the coeffi-cients of determination (r2) calculated from our digitized data
and the values originally reported from the published studies(Fig. 2a). We found that our extracted estimates matched closelythe reported model performance (r2 = 0.923; y = 0.945x + 0.038,n = 34).
As previously mentioned, there were four main questionsaddressed through our analysis: How consistently do PFG mod-elling studies follow conventional methodological proceduresduring the development phase? How well do these models repro-duce the dynamics of phytoplankton functional groups? Whatare the typical conceptualizations of different phytoplanktonfunctional groups that influence their parameter specification?What are the differences between the characterizations of“cyanobacteria-like” state variables relative to other algal func-tional groups? The first two questions were intended to drawparallels with a previous meta-analysis of mechanistic aquatic bio-geochemical models conducted by Arhonditsis and Brett (2004),which was based on 153 studies published in the peer reviewedliterature from 1990 to 2002. Given that our analysis cov-ers a longer period and comprises more recent papers, thepresent study indirectly offers an opportunity to evaluate ifthere is an improvement with respect to the methodologicalconsistency (sensitivity analysis, goodness-of-fit, and validation)over the past decade. To quantify model predictive capac-ity, we calculated three dimensionless fit statistics; namely,the relative error
(RE =
∑∣∣O − P∣∣/
∑O)
, modelling efficiency(MEF = 1 −
∑(O − P)2/
∑(O − O)
2)
, and coefficient of deter-
mination(
r2 =∑
[(O − O) × (P − P)]/∑
(O − O)2 ×
∑(P − P)
2)
,
where O refers to observations, P refers to model predictions, O(P) to the average of the observations (predictions). With the lat-ter two commonly used metrics, higher values suggest better fitand 1.0 is indicative of perfect fit. A MEF of 0 indicates a modelwhich predicts the observations as well as their correspondingaverage, while a negative MEF reflects a model which predicts morepoorly than the average of the observations. Also note that theMEF penalizes for bias, whereas the r2 does not penalize for linearbias.
32 Y. Shimoda, G.B. Arhonditsis / Ecological Modelling 320 (2016) 29–43
Fig. 2. (a) Digitization error associated with the assessment of model performance. Relationship between reported coefficient of determination (r2) values and those extractedby the digitized data; and (b) ecosystems modelled per year of our study period.
3. Results and discussion
3.1. How consistently do PFG modelling studies followconventional methodological procedures?
The number of mechanistic aquatic biogeochemical modellingstudies, aiming to simulate multiple phytoplankton functionalgroups, has dramatically increased in the peer reviewed literatureduring the recent years (Fig. 2b). In particular, the average num-ber of PFG models published towards the end of our study period(2010–2012) demonstrated a threefold increase relative to the1990s. Counter to the predominance of oceanic modelling papers inthe sample analyzed by Arhonditsis and Brett (2004), the presentstudy is primarily based on aquatic biogeochemical models thathave been developed in freshwater ecosystems (lakes, reservoirs,and rivers) to address eutrophication problems such as harm-ful algal blooms (Kim et al., 2014), and to evaluate the potentialimpact of climate change or other environmental changes on lakephenology (Adrian et al., 2009). The modelling literature emphat-ically argues the need for methodological consistency of the way
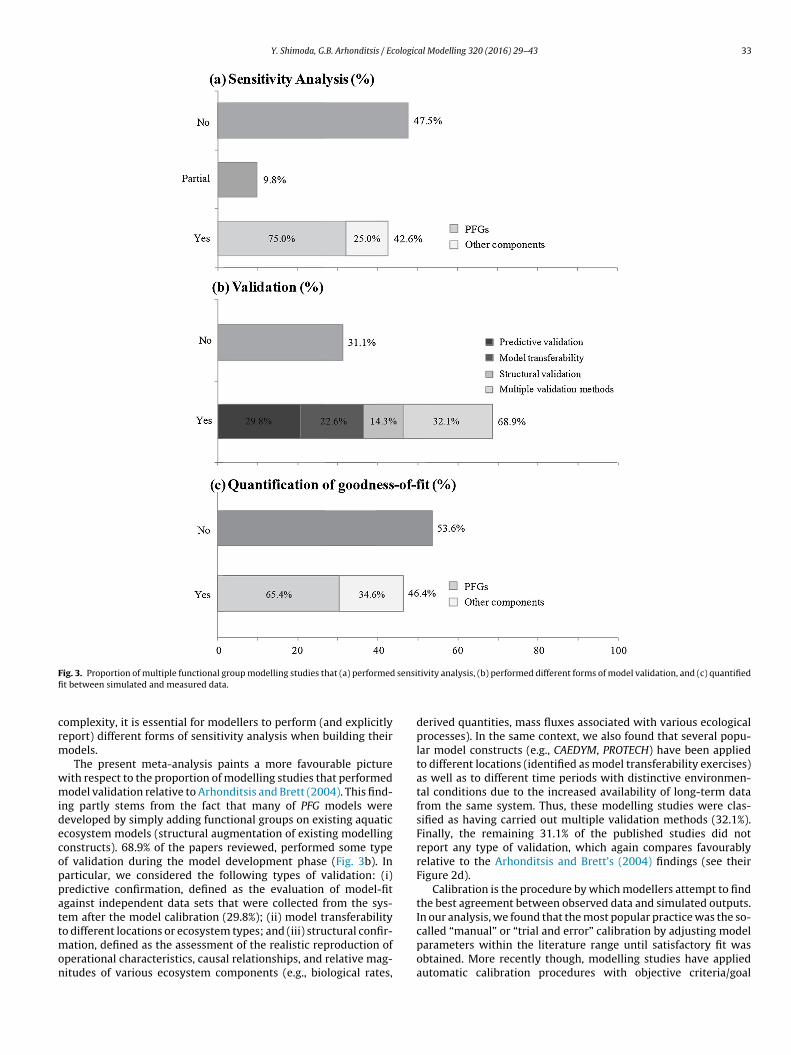
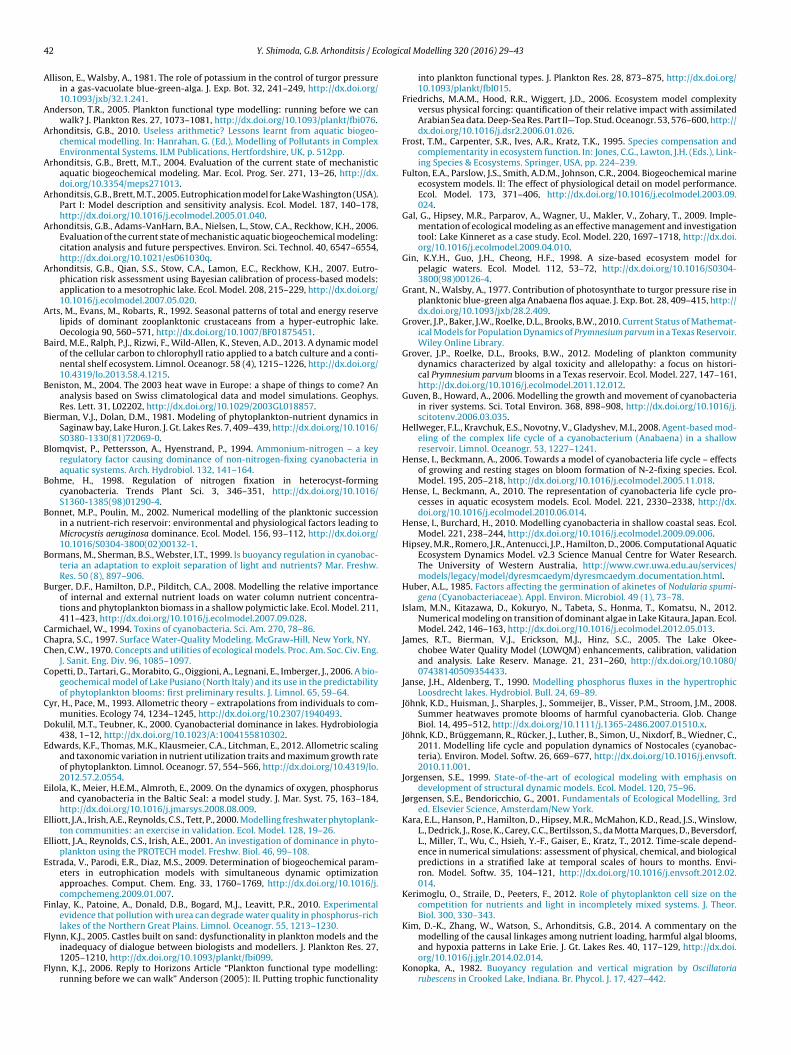
models are being developed, highlighting the importance of sev-eral critical steps, such as sensitivity analysis, evaluation ofgoodness-of-fit after model calibration, and rigorous modelvalidation (e.g., Chapra, 1997; Jørgensen and Bendoricchio, 2001).Nonetheless, Arhonditsis and Brett (2004) showed a surprisingabsence of a systematic methodological protocol widely followedby the aquatic ecosystem modelling community; namely, only27.5% of the published studies identified the model componentsthat needed to be estimated with greatest precision, whereas 45.1%did not report any results of sensitivity analysis whatsoever. In asimilar manner, we here found that 47.5% of the PFG modellingstudies did not provide any evidence of model sensitivity to var-ious inputs, while 9.8% examined the influence of certain modelstructures (e.g., alternative formulations) or parameters withoutproviding quantitative measures of model behaviour (Fig. 3a). Theremaining 42.7% of the modelling studies did report results ofsensitivity analysis, although a substantial portion of the lattergroup (25%) did not test the sensitivity of parameters relative tothe phytoplankton functional groups simulated. Given the impor-tant insights gained for selecting the optimal model structure and
Y. Shimoda, G.B. Arhonditsis / Ecological Modelling 320 (2016) 29–43 33
Fig. 3. Proportion of multiple functional group modelling studies that (a) performed sensitivity analysis, (b) performed different forms of model validation, and (c) quantifiedfit between simulated and measured data.
complexity, it is essential for modellers to perform (and explicitlyreport) different forms of sensitivity analysis when building theirmodels.
The present meta-analysis paints a more favourable picturewith respect to the proportion of modelling studies that performedmodel validation relative to Arhonditsis and Brett (2004). This find-ing partly stems from the fact that many of PFG models weredeveloped by simply adding functional groups on existing aquaticecosystem models (structural augmentation of existing modellingconstructs). 68.9% of the papers reviewed, performed some typeof validation during the model development phase (Fig. 3b). Inparticular, we considered the following types of validation: (i)predictive confirmation, defined as the evaluation of model-fitagainst independent data sets that were collected from the sys-tem after the model calibration (29.8%); (ii) model transferabilityto different locations or ecosystem types; and (iii) structural confir-mation, defined as the assessment of the realistic reproduction ofoperational characteristics, causal relationships, and relative mag-nitudes of various ecosystem components (e.g., biological rates,
derived quantities, mass fluxes associated with various ecologicalprocesses). In the same context, we also found that several popu-lar model constructs (e.g., CAEDYM, PROTECH) have been appliedto different locations (identified as model transferability exercises)as well as to different time periods with distinctive environmen-tal conditions due to the increased availability of long-term datafrom the same system. Thus, these modelling studies were clas-sified as having carried out multiple validation methods (32.1%).Finally, the remaining 31.1% of the published studies did notreport any type of validation, which again compares favourablyrelative to the Arhonditsis and Brett’s (2004) findings (see theirFigure 2d).
Calibration is the procedure by which modellers attempt to findthe best agreement between observed data and simulated outputs.In our analysis, we found that the most popular practice was the so-called “manual” or “trial and error” calibration by adjusting modelparameters within the literature range until satisfactory fit wasobtained. More recently though, modelling studies have appliedautomatic calibration procedures with objective criteria/goal
34 Y. Shimoda, G.B. Arhonditsis / Ecological Modelling 320 (2016) 29–43
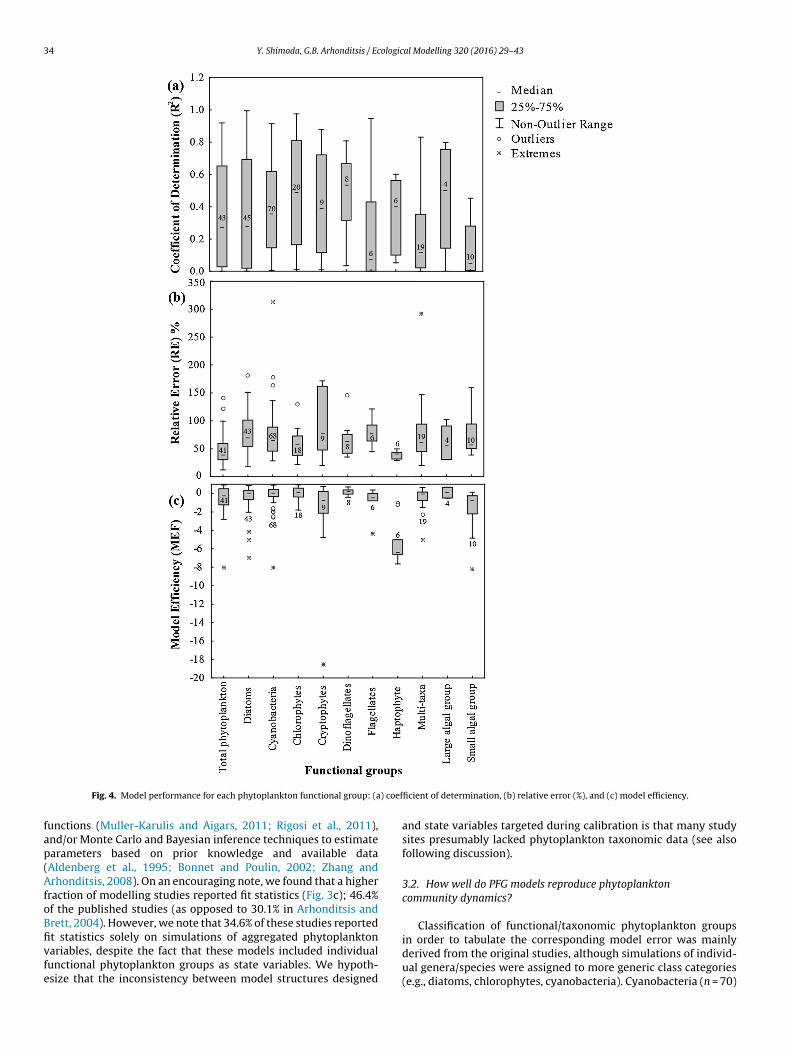
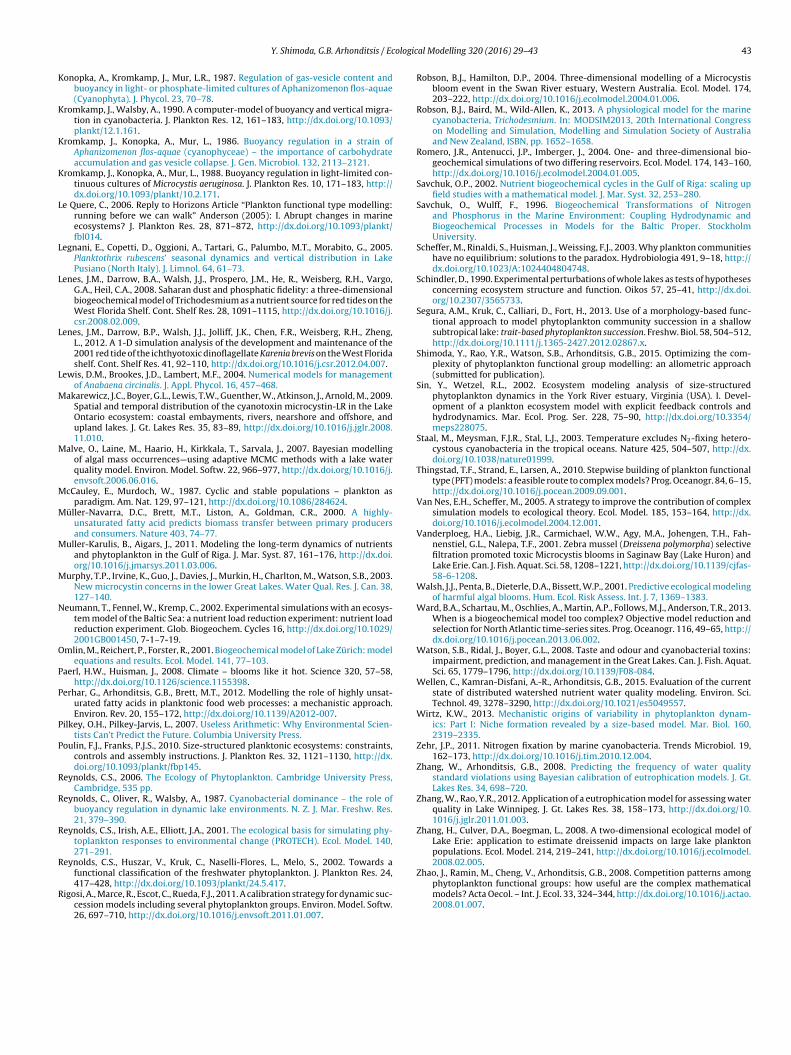
Fig. 4. Model performance for each phytoplankton functional group: (a) coefficient of determination, (b) relative error (%), and (c) model efficiency.
functions (Muller-Karulis and Aigars, 2011; Rigosi et al., 2011),and/or Monte Carlo and Bayesian inference techniques to estimateparameters based on prior knowledge and available data(Aldenberg et al., 1995; Bonnet and Poulin, 2002; Zhang andArhonditsis, 2008). On an encouraging note, we found that a higherfraction of modelling studies reported fit statistics (Fig. 3c); 46.4%of the published studies (as opposed to 30.1% in Arhonditsis andBrett, 2004). However, we note that 34.6% of these studies reportedfit statistics solely on simulations of aggregated phytoplanktonvariables, despite the fact that these models included individualfunctional phytoplankton groups as state variables. We hypoth-esize that the inconsistency between model structures designed
and state variables targeted during calibration is that many studysites presumably lacked phytoplankton taxonomic data (see alsofollowing discussion).
3.2. How well do PFG models reproduce phytoplanktoncommunity dynamics?
Classification of functional/taxonomic phytoplankton groupsin order to tabulate the corresponding model error was mainlyderived from the original studies, although simulations of individ-ual genera/species were assigned to more generic class categories(e.g., diatoms, chlorophytes, cyanobacteria). Cyanobacteria (n = 70)
Y. Shimoda, G.B. Arhonditsis / Ecological Modelling 320 (2016) 29–43 35
Table 1Maximum growth rates (day−1) assigned to phytoplankton functional groups.
Functionalgroups
Count Max Min Mean ± St.dev.
Cyanobacteria 67 4.60 0.02 0.93 ± 0.71Diatoms 72 4.64 0.09 1.70 ± 0.79Chlorophytes 30 3.60 0.54 1.43 ± 0.69Chrysophytes 3 4.50 0.05 1.70 ± 2.44Cryptophytes 8 1.48 0.70 1.06 ± 0.27Dinoflagellates 21 1.60 0.30 0.84 ± 0.51Other/combinedfunctionalgroups
64 5.60 0.20 2.06 ± 1.09
and diatoms (n = 45) are the most commonly modelled taxonomicgroups (Fig. 4). Generally, we were not able to identify phytoplank-ton functional groups with distinctly higher performance, onlyslightly better fit statistics with chlorophytes (median r2 = 0.49,RE = 59%, MEF = 0.16) and dinoflagellates (median r2 = 0.53, RE = 63%,MEF = 0.24). Simulations of aggregated phytoplankton had r2 val-ues ranging from 0.01 to 0.92 with median of 0.28, RE ranging from12% to 141% with median value of 39%, and MEF values varying from−8.02 to 0.92 with median of −0.20. Although not directly compara-ble, total phytoplankton was characterized by slightly lower r2 butalso somewhat lower RE value relative to the Arhonditsis and Brett’s(2004) findings (see their Table 1). Notably, moderate fit statisticswere found for diatoms (median r2 = 0.31, RE = 70%, MEF = 0.02) andcyanobacteria (median r2 = 0.36, RE = 65%, MEF = 0.06). The worstperformance among the phytoplankton functional groups simu-lated were recorded for cryptophytes (median r2 = 0.39, RE = 79%,MEF = −0.74), flagellates (median r2 = 0.07, RE = 78%, MEF = −0.45),
and haptophytes (median r2 = 0.39, RE = 41%, MEF = −6.36), whichmay reflect our limited knowledge of their ecophysiological param-eters compared to other well-studied functional groups. On a finalnote, a significant portion of the simulated cases had negative MEFvalues, suggesting that the predictive statements drawn from themodels fared worse than the average values of the observed data.Compared with the performance of models in other disciplines(e.g., distributed watershed water quality modelling, see Wellenet al., 2015) or even the fidelity of simulations of nutrient dynamics(Arhonditsis and Brett, 2004), the PFG models demonstrate inferiorability to reproduce phytoplankton patterns.
3.3. What are the typical PFG conceptualizations that influencetheir parameter specification?
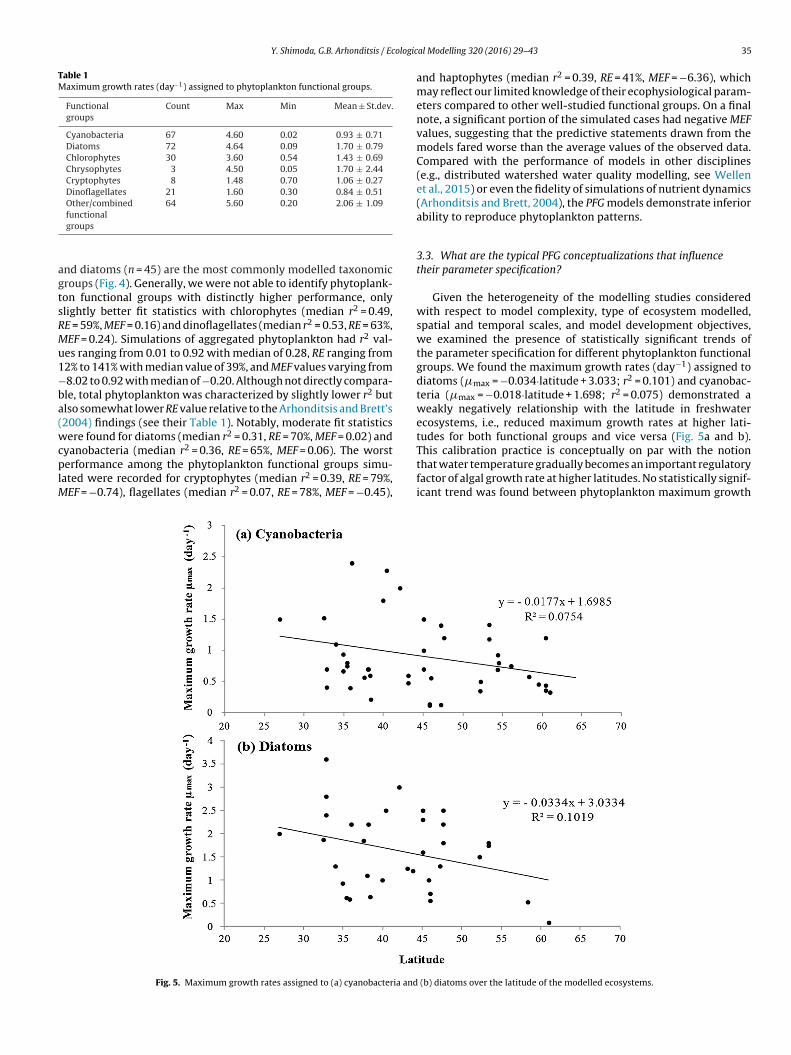
Given the heterogeneity of the modelling studies consideredwith respect to model complexity, type of ecosystem modelled,spatial and temporal scales, and model development objectives,we examined the presence of statistically significant trends ofthe parameter specification for different phytoplankton functionalgroups. We found the maximum growth rates (day−1) assigned todiatoms (�max = −0.034·latitude + 3.033; r2 = 0.101) and cyanobac-teria (�max = −0.018·latitude + 1.698; r2 = 0.075) demonstrated aweakly negatively relationship with the latitude in freshwaterecosystems, i.e., reduced maximum growth rates at higher lati-tudes for both functional groups and vice versa (Fig. 5a and b).This calibration practice is conceptually on par with the notionthat water temperature gradually becomes an important regulatoryfactor of algal growth rate at higher latitudes. No statistically signif-icant trend was found between phytoplankton maximum growth
Fig. 5. Maximum growth rates assigned to (a) cyanobacteria and (b) diatoms over the latitude of the modelled ecosystems.
36 Y. Shimoda, G.B. Arhonditsis / Ecological Modelling 320 (2016) 29–43
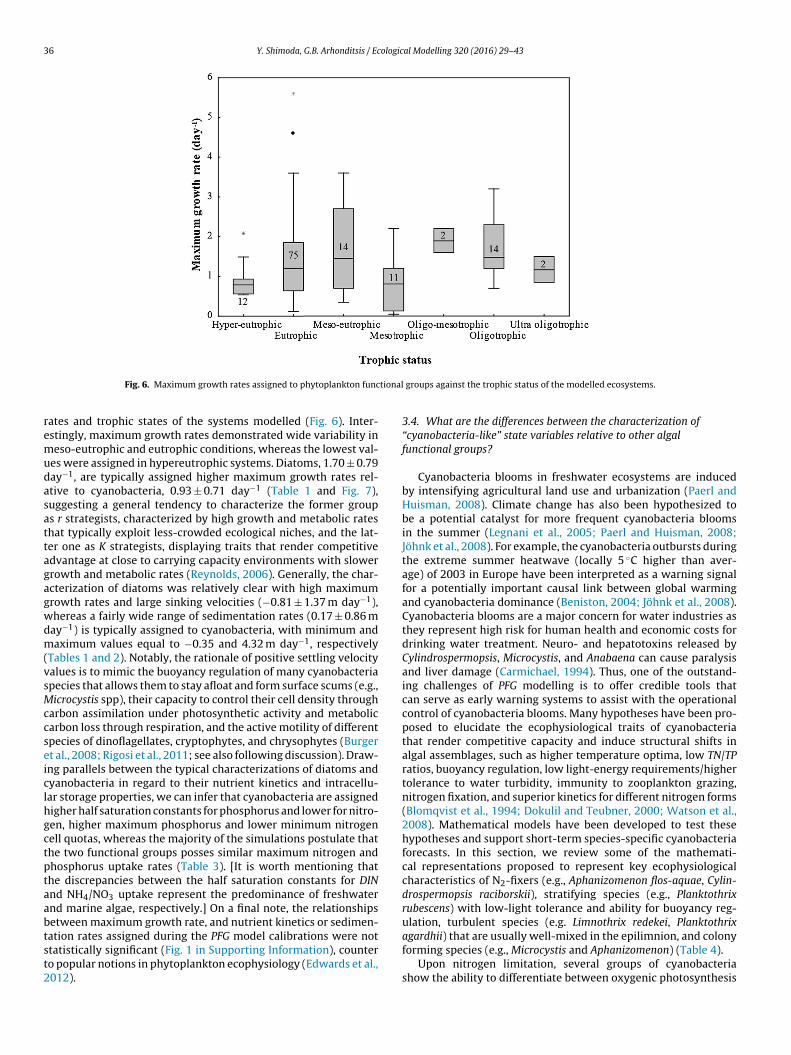
Fig. 6. Maximum growth rates assigned to phytoplankton functional groups against the trophic status of the modelled ecosystems.
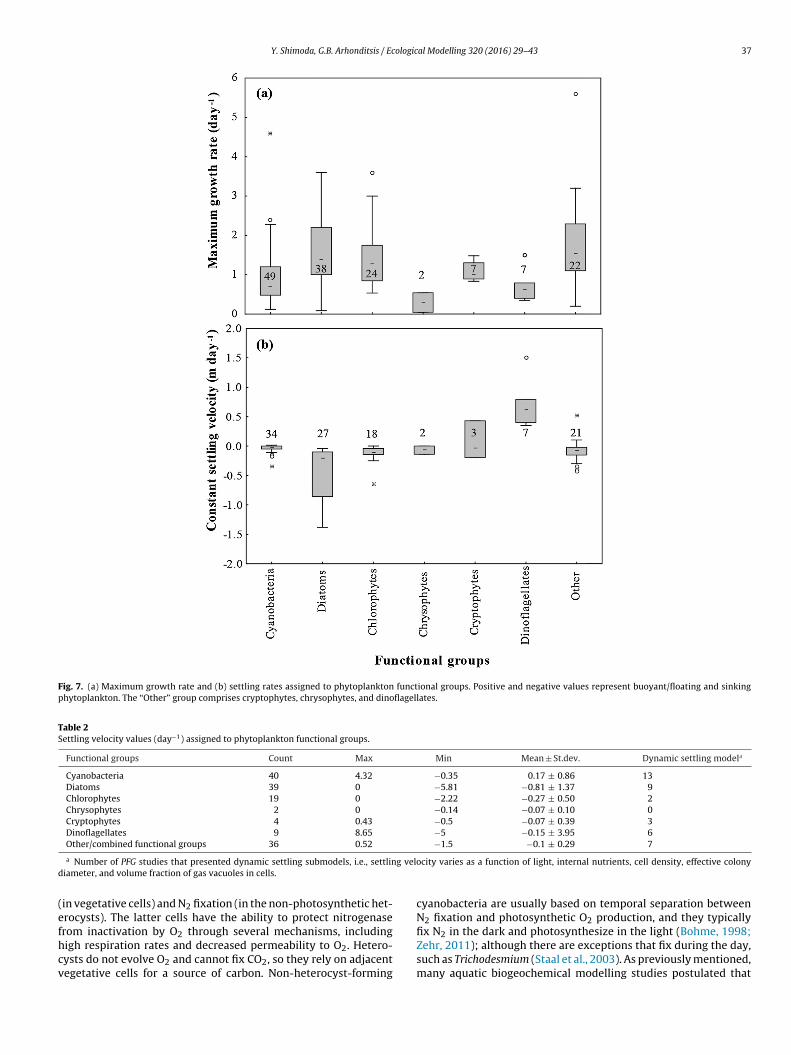
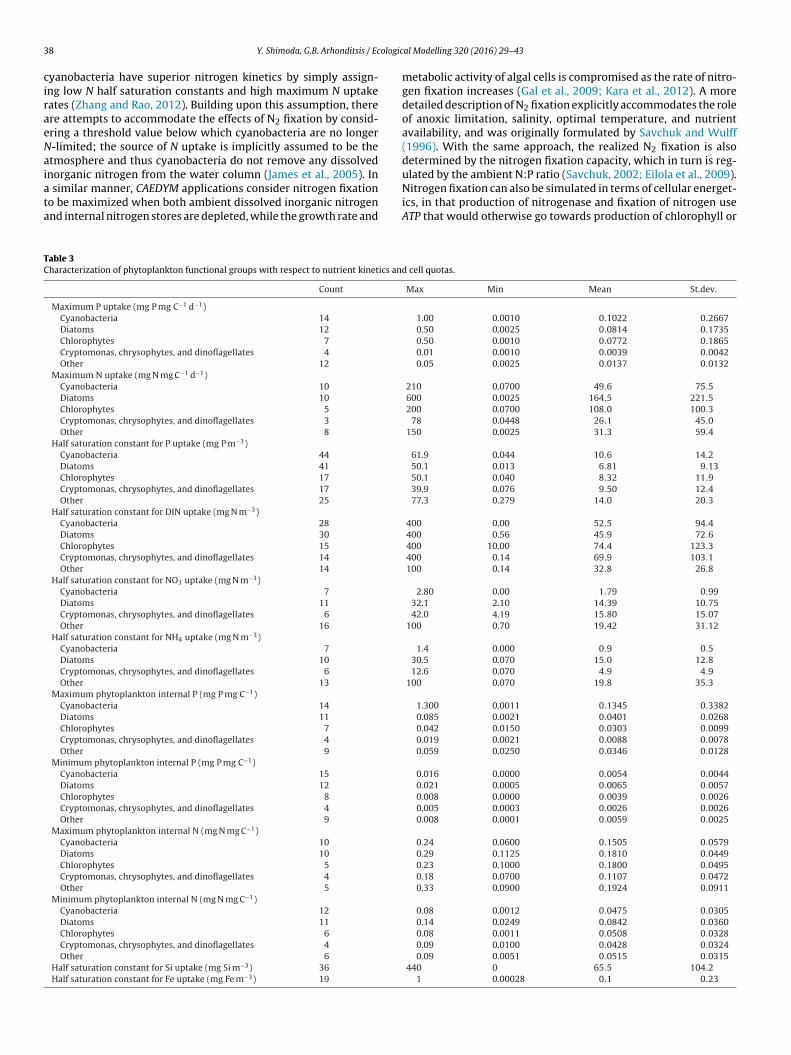
rates and trophic states of the systems modelled (Fig. 6). Inter-estingly, maximum growth rates demonstrated wide variability inmeso-eutrophic and eutrophic conditions, whereas the lowest val-ues were assigned in hypereutrophic systems. Diatoms, 1.70 ± 0.79day−1, are typically assigned higher maximum growth rates rel-ative to cyanobacteria, 0.93 ± 0.71 day−1 (Table 1 and Fig. 7),suggesting a general tendency to characterize the former groupas r strategists, characterized by high growth and metabolic ratesthat typically exploit less-crowded ecological niches, and the lat-ter one as K strategists, displaying traits that render competitiveadvantage at close to carrying capacity environments with slowergrowth and metabolic rates (Reynolds, 2006). Generally, the char-acterization of diatoms was relatively clear with high maximumgrowth rates and large sinking velocities (−0.81 ± 1.37 m day−1),whereas a fairly wide range of sedimentation rates (0.17 ± 0.86 mday−1) is typically assigned to cyanobacteria, with minimum andmaximum values equal to −0.35 and 4.32 m day−1, respectively(Tables 1 and 2). Notably, the rationale of positive settling velocityvalues is to mimic the buoyancy regulation of many cyanobacteriaspecies that allows them to stay afloat and form surface scums (e.g.,Microcystis spp), their capacity to control their cell density throughcarbon assimilation under photosynthetic activity and metaboliccarbon loss through respiration, and the active motility of differentspecies of dinoflagellates, cryptophytes, and chrysophytes (Burgeret al., 2008; Rigosi et al., 2011; see also following discussion). Draw-ing parallels between the typical characterizations of diatoms andcyanobacteria in regard to their nutrient kinetics and intracellu-lar storage properties, we can infer that cyanobacteria are assignedhigher half saturation constants for phosphorus and lower for nitro-gen, higher maximum phosphorus and lower minimum nitrogencell quotas, whereas the majority of the simulations postulate thatthe two functional groups posses similar maximum nitrogen andphosphorus uptake rates (Table 3). [It is worth mentioning thatthe discrepancies between the half saturation constants for DINand NH4/NO3 uptake represent the predominance of freshwaterand marine algae, respectively.] On a final note, the relationshipsbetween maximum growth rate, and nutrient kinetics or sedimen-tation rates assigned during the PFG model calibrations were notstatistically significant (Fig. 1 in Supporting Information), counterto popular notions in phytoplankton ecophysiology (Edwards et al.,2012).
3.4. What are the differences between the characterization of“cyanobacteria-like” state variables relative to other algalfunctional groups?
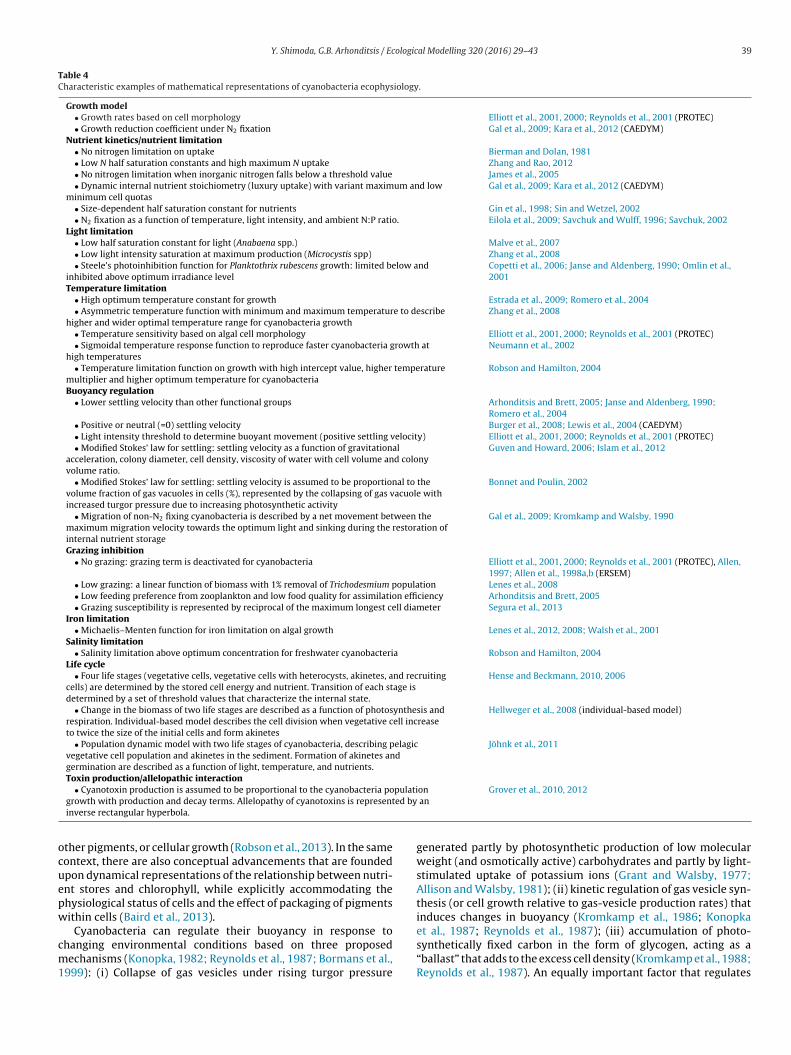
Cyanobacteria blooms in freshwater ecosystems are inducedby intensifying agricultural land use and urbanization (Paerl andHuisman, 2008). Climate change has also been hypothesized tobe a potential catalyst for more frequent cyanobacteria bloomsin the summer (Legnani et al., 2005; Paerl and Huisman, 2008;Jöhnk et al., 2008). For example, the cyanobacteria outbursts duringthe extreme summer heatwave (locally 5 ◦C higher than aver-age) of 2003 in Europe have been interpreted as a warning signalfor a potentially important causal link between global warmingand cyanobacteria dominance (Beniston, 2004; Jöhnk et al., 2008).Cyanobacteria blooms are a major concern for water industries asthey represent high risk for human health and economic costs fordrinking water treatment. Neuro- and hepatotoxins released byCylindrospermopsis, Microcystis, and Anabaena can cause paralysisand liver damage (Carmichael, 1994). Thus, one of the outstand-ing challenges of PFG modelling is to offer credible tools thatcan serve as early warning systems to assist with the operationalcontrol of cyanobacteria blooms. Many hypotheses have been pro-posed to elucidate the ecophysiological traits of cyanobacteriathat render competitive capacity and induce structural shifts inalgal assemblages, such as higher temperature optima, low TN/TPratios, buoyancy regulation, low light-energy requirements/highertolerance to water turbidity, immunity to zooplankton grazing,nitrogen fixation, and superior kinetics for different nitrogen forms(Blomqvist et al., 1994; Dokulil and Teubner, 2000; Watson et al.,2008). Mathematical models have been developed to test thesehypotheses and support short-term species-specific cyanobacteriaforecasts. In this section, we review some of the mathemati-cal representations proposed to represent key ecophysiologicalcharacteristics of N2-fixers (e.g., Aphanizomenon flos-aquae, Cylin-drospermopsis raciborskii), stratifying species (e.g., Planktothrixrubescens) with low-light tolerance and ability for buoyancy reg-ulation, turbulent species (e.g. Limnothrix redekei, Planktothrixagardhii) that are usually well-mixed in the epilimnion, and colonyforming species (e.g., Microcystis and Aphanizomenon) (Table 4).
Upon nitrogen limitation, several groups of cyanobacteriashow the ability to differentiate between oxygenic photosynthesis
Y. Shimoda, G.B. Arhonditsis / Ecological Modelling 320 (2016) 29–43 37
Fig. 7. (a) Maximum growth rate and (b) settling rates assigned to phytoplankton functional groups. Positive and negative values represent buoyant/floating and sinkingphytoplankton. The “Other” group comprises cryptophytes, chrysophytes, and dinoflagellates.
Table 2Settling velocity values (day−1) assigned to phytoplankton functional groups.
Functional groups Count Max Min Mean ± St.dev. Dynamic settling modela
Cyanobacteria 40 4.32 −0.35 0.17 ± 0.86 13Diatoms 39 0 −5.81 −0.81 ± 1.37 9Chlorophytes 19 0 −2.22 −0.27 ± 0.50 2Chrysophytes 2 0 −0.14 −0.07 ± 0.10 0Cryptophytes 4 0.43 −0.5 −0.07 ± 0.39 3Dinoflagellates 9 8.65 −5 −0.15 ± 3.95 6Other/combined functional groups 36 0.52 −1.5 −0.1 ± 0.29 7
a Number of PFG studies that presented dynamic settling submodels, i.e., settling velocity varies as a function of light, internal nutrients, cell density, effective colonydiameter, and volume fraction of gas vacuoles in cells.
(in vegetative cells) and N2 fixation (in the non-photosynthetic het-erocysts). The latter cells have the ability to protect nitrogenasefrom inactivation by O2 through several mechanisms, includinghigh respiration rates and decreased permeability to O2. Hetero-cysts do not evolve O2 and cannot fix CO2, so they rely on adjacentvegetative cells for a source of carbon. Non-heterocyst-forming
cyanobacteria are usually based on temporal separation betweenN2 fixation and photosynthetic O2 production, and they typicallyfix N2 in the dark and photosynthesize in the light (Bohme, 1998;Zehr, 2011); although there are exceptions that fix during the day,such as Trichodesmium (Staal et al., 2003). As previously mentioned,many aquatic biogeochemical modelling studies postulated that
38 Y. Shimoda, G.B. Arhonditsis / Ecological Modelling 320 (2016) 29–43
cyanobacteria have superior nitrogen kinetics by simply assign-ing low N half saturation constants and high maximum N uptakerates (Zhang and Rao, 2012). Building upon this assumption, thereare attempts to accommodate the effects of N2 fixation by consid-ering a threshold value below which cyanobacteria are no longerN-limited; the source of N uptake is implicitly assumed to be theatmosphere and thus cyanobacteria do not remove any dissolvedinorganic nitrogen from the water column (James et al., 2005). Ina similar manner, CAEDYM applications consider nitrogen fixationto be maximized when both ambient dissolved inorganic nitrogenand internal nitrogen stores are depleted, while the growth rate and
metabolic activity of algal cells is compromised as the rate of nitro-gen fixation increases (Gal et al., 2009; Kara et al., 2012). A moredetailed description of N2 fixation explicitly accommodates the roleof anoxic limitation, salinity, optimal temperature, and nutrientavailability, and was originally formulated by Savchuk and Wulff(1996). With the same approach, the realized N2 fixation is alsodetermined by the nitrogen fixation capacity, which in turn is reg-ulated by the ambient N:P ratio (Savchuk, 2002; Eilola et al., 2009).Nitrogen fixation can also be simulated in terms of cellular energet-ics, in that production of nitrogenase and fixation of nitrogen useATP that would otherwise go towards production of chlorophyll or
Table 3Characterization of phytoplankton functional groups with respect to nutrient kinetics and cell quotas.
Count Max Min Mean St.dev.
Maximum P uptake (mg P mg C−1 d−1)Cyanobacteria 14 1.00 0.0010 0.1022 0.2667Diatoms 12 0.50 0.0025 0.0814 0.1735Chlorophytes 7 0.50 0.0010 0.0772 0.1865Cryptomonas, chrysophytes, and dinoflagellates 4 0.01 0.0010 0.0039 0.0042Other 12 0.05 0.0025 0.0137 0.0132
Maximum N uptake (mg N mg C−1 d−1)Cyanobacteria 10 210 0.0700 49.6 75.5Diatoms 10 600 0.0025 164.5 221.5Chlorophytes 5 200 0.0700 108.0 100.3Cryptomonas, chrysophytes, and dinoflagellates 3 78 0.0448 26.1 45.0Other 8 150 0.0025 31.3 59.4
Half saturation constant for P uptake (mg P m−3)Cyanobacteria 44 61.9 0.044 10.6 14.2Diatoms 41 50.1 0.013 6.81 9.13Chlorophytes 17 50.1 0.040 8.32 11.9Cryptomonas, chrysophytes, and dinoflagellates 17 39.9 0.076 9.50 12.4Other 25 77.3 0.279 14.0 20.3
Half saturation constant for DIN uptake (mg N m−3)Cyanobacteria 28 400 0.00 52.5 94.4Diatoms 30 400 0.56 45.9 72.6Chlorophytes 15 400 10.00 74.4 123.3Cryptomonas, chrysophytes, and dinoflagellates 14 400 0.14 69.9 103.1Other 14 100 0.14 32.8 26.8
Half saturation constant for NO3 uptake (mg N m−3)Cyanobacteria 7 2.80 0.00 1.79 0.99Diatoms 11 32.1 2.10 14.39 10.75Cryptomonas, chrysophytes, and dinoflagellates 6 42.0 4.19 15.80 15.07Other 16 100 0.70 19.42 31.12
Half saturation constant for NH4 uptake (mg N m−3)Cyanobacteria 7 1.4 0.000 0.9 0.5Diatoms 10 30.5 0.070 15.0 12.8Cryptomonas, chrysophytes, and dinoflagellates 6 12.6 0.070 4.9 4.9Other 13 100 0.070 19.8 35.3
Maximum phytoplankton internal P (mg P mg C−1)Cyanobacteria 14 1.300 0.0011 0.1345 0.3382Diatoms 11 0.085 0.0021 0.0401 0.0268Chlorophytes 7 0.042 0.0150 0.0303 0.0099Cryptomonas, chrysophytes, and dinoflagellates 4 0.019 0.0021 0.0088 0.0078Other 9 0.059 0.0250 0.0346 0.0128
Minimum phytoplankton internal P (mg P mg C−1)Cyanobacteria 15 0.016 0.0000 0.0054 0.0044Diatoms 12 0.021 0.0005 0.0065 0.0057Chlorophytes 8 0.008 0.0000 0.0039 0.0026Cryptomonas, chrysophytes, and dinoflagellates 4 0.005 0.0003 0.0026 0.0026Other 9 0.008 0.0001 0.0059 0.0025
Maximum phytoplankton internal N (mg N mg C−1)Cyanobacteria 10 0.24 0.0600 0.1505 0.0579Diatoms 10 0.29 0.1125 0.1810 0.0449Chlorophytes 5 0.23 0.1000 0.1800 0.0495Cryptomonas, chrysophytes, and dinoflagellates 4 0.18 0.0700 0.1107 0.0472Other 5 0.33 0.0900 0.1924 0.0911
Minimum phytoplankton internal N (mg N mg C−1)Cyanobacteria 12 0.08 0.0012 0.0475 0.0305Diatoms 11 0.14 0.0249 0.0842 0.0360Chlorophytes 6 0.08 0.0011 0.0508 0.0328Cryptomonas, chrysophytes, and dinoflagellates 4 0.09 0.0100 0.0428 0.0324Other 6 0.09 0.0051 0.0515 0.0315
Half saturation constant for Si uptake (mg Si m−3) 36 440 0 65.5 104.2Half saturation constant for Fe uptake (mg Fe m−3) 19 1 0.00028 0.1 0.23
Y. Shimoda, G.B. Arhonditsis / Ecological Modelling 320 (2016) 29–43 39
Table 4Characteristic examples of mathematical representations of cyanobacteria ecophysiology.
Growth model• Growth rates based on cell morphology Elliott et al., 2001, 2000; Reynolds et al., 2001 (PROTEC)• Growth reduction coefficient under N2 fixation Gal et al., 2009; Kara et al., 2012 (CAEDYM)
Nutrient kinetics/nutrient limitation• No nitrogen limitation on uptake Bierman and Dolan, 1981• Low N half saturation constants and high maximum N uptake Zhang and Rao, 2012• No nitrogen limitation when inorganic nitrogen falls below a threshold value James et al., 2005• Dynamic internal nutrient stoichiometry (luxury uptake) with variant maximum and low
minimum cell quotasGal et al., 2009; Kara et al., 2012 (CAEDYM)
• Size-dependent half saturation constant for nutrients Gin et al., 1998; Sin and Wetzel, 2002• N2 fixation as a function of temperature, light intensity, and ambient N:P ratio. Eilola et al., 2009; Savchuk and Wulff, 1996; Savchuk, 2002
Light limitation• Low half saturation constant for light (Anabaena spp.) Malve et al., 2007• Low light intensity saturation at maximum production (Microcystis spp) Zhang et al., 2008• Steele’s photoinhibition function for Planktothrix rubescens growth: limited below and
inhibited above optimum irradiance levelCopetti et al., 2006; Janse and Aldenberg, 1990; Omlin et al.,2001
Temperature limitation• High optimum temperature constant for growth Estrada et al., 2009; Romero et al., 2004• Asymmetric temperature function with minimum and maximum temperature to describe
higher and wider optimal temperature range for cyanobacteria growthZhang et al., 2008
• Temperature sensitivity based on algal cell morphology Elliott et al., 2001, 2000; Reynolds et al., 2001 (PROTEC)• Sigmoidal temperature response function to reproduce faster cyanobacteria growth at
high temperaturesNeumann et al., 2002
• Temperature limitation function on growth with high intercept value, higher temperaturemultiplier and higher optimum temperature for cyanobacteria
Robson and Hamilton, 2004
Buoyancy regulation• Lower settling velocity than other functional groups Arhonditsis and Brett, 2005; Janse and Aldenberg, 1990;
Romero et al., 2004• Positive or neutral (=0) settling velocity Burger et al., 2008; Lewis et al., 2004 (CAEDYM)• Light intensity threshold to determine buoyant movement (positive settling velocity) Elliott et al., 2001, 2000; Reynolds et al., 2001 (PROTEC)• Modified Stokes’ law for settling: settling velocity as a function of gravitational
acceleration, colony diameter, cell density, viscosity of water with cell volume and colonyvolume ratio.
Guven and Howard, 2006; Islam et al., 2012
• Modified Stokes’ law for settling: settling velocity is assumed to be proportional to thevolume fraction of gas vacuoles in cells (%), represented by the collapsing of gas vacuole withincreased turgor pressure due to increasing photosynthetic activity
Bonnet and Poulin, 2002
• Migration of non-N2 fixing cyanobacteria is described by a net movement between themaximum migration velocity towards the optimum light and sinking during the restoration ofinternal nutrient storage
Gal et al., 2009; Kromkamp and Walsby, 1990
Grazing inhibition• No grazing: grazing term is deactivated for cyanobacteria Elliott et al., 2001, 2000; Reynolds et al., 2001 (PROTEC), Allen,
1997; Allen et al., 1998a,b (ERSEM)• Low grazing: a linear function of biomass with 1% removal of Trichodesmium population Lenes et al., 2008• Low feeding preference from zooplankton and low food quality for assimilation efficiency Arhonditsis and Brett, 2005• Grazing susceptibility is represented by reciprocal of the maximum longest cell diameter Segura et al., 2013
Iron limitation• Michaelis–Menten function for iron limitation on algal growth Lenes et al., 2012, 2008; Walsh et al., 2001
Salinity limitation• Salinity limitation above optimum concentration for freshwater cyanobacteria Robson and Hamilton, 2004
Life cycle• Four life stages (vegetative cells, vegetative cells with heterocysts, akinetes, and recruiting
cells) are determined by the stored cell energy and nutrient. Transition of each stage isdetermined by a set of threshold values that characterize the internal state.
Hense and Beckmann, 2010, 2006
• Change in the biomass of two life stages are described as a function of photosynthesis andrespiration. Individual-based model describes the cell division when vegetative cell increaseto twice the size of the initial cells and form akinetes
Hellweger et al., 2008 (individual-based model)
• Population dynamic model with two life stages of cyanobacteria, describing pelagicvegetative cell population and akinetes in the sediment. Formation of akinetes andgermination are described as a function of light, temperature, and nutrients.
Jöhnk et al., 2011
Toxin production/allelopathic interaction• Cyanotoxin production is assumed to be proportional to the cyanobacteria population
growth with production and decay terms. Allelopathy of cyanotoxins is represented by aninverse rectangular hyperbola.
Grover et al., 2010, 2012
other pigments, or cellular growth (Robson et al., 2013). In the samecontext, there are also conceptual advancements that are foundedupon dynamical representations of the relationship between nutri-ent stores and chlorophyll, while explicitly accommodating thephysiological status of cells and the effect of packaging of pigmentswithin cells (Baird et al., 2013).
Cyanobacteria can regulate their buoyancy in response tochanging environmental conditions based on three proposedmechanisms (Konopka, 1982; Reynolds et al., 1987; Bormans et al.,1999): (i) Collapse of gas vesicles under rising turgor pressure
generated partly by photosynthetic production of low molecularweight (and osmotically active) carbohydrates and partly by light-stimulated uptake of potassium ions (Grant and Walsby, 1977;Allison and Walsby, 1981); (ii) kinetic regulation of gas vesicle syn-thesis (or cell growth relative to gas-vesicle production rates) thatinduces changes in buoyancy (Kromkamp et al., 1986; Konopkaet al., 1987; Reynolds et al., 1987); (iii) accumulation of photo-synthetically fixed carbon in the form of glycogen, acting as a“ballast” that adds to the excess cell density (Kromkamp et al., 1988;Reynolds et al., 1987). An equally important factor that regulates
40 Y. Shimoda, G.B. Arhonditsis / Ecological Modelling 320 (2016) 29–43
the accumulation of photosynthetic products is also their assim-ilation into proteins and other biopolymers, assuming that theinternal nutrient reserves are adequate (Reynolds et al., 1987). Inthis context, there are four major strategies that have been used inthe modelling literature to accommodate the patterns of cyanobac-teria settling and vertical migration: constant settling velocity(typically lower relative to the values assigned to other functionalgroups); migration with or without photoinhibition; and settlingvelocity based on Stokes’ sedimentation kinetics. Vertical migra-tion without photoinhibition, largely based on the original modelby Kromkamp and Walsby (1990), effectively postulates a dynamicbalance between upward migration to irradiance and downwardmigration to refuel the intracellular nutrient stock. On the otherhand, when the Stokes’ formula is used to reproduce algal settlingrates, cell density varies dynamically in response to carbohydratesynthesis (photosynthesis) and utilization (respiration) which inturn shapes the vertical velocity (Hipsey et al., 2006). A modificationof the latter strategy was presented by Bonnet and Poulin (2002),based on the assumption that gas vacuoles are collapsing when theturgor pressure is increasing by the photosynthetic activity. Thedensity of the cells is related to the volume of the gas vacuolescontrolled by the turgor pressure (see their Table 3), and this buoy-ancy regulation model formed the basis to represent Microcystisaeruginosa vertical migration.
Colonial and filamentous cell formations may cause mechanicalinterference, toxicity and have inadequate biochemical nutritionalvalue for consumers (Müller-Navarra et al., 2000); thus, they aretypically parameterized as being an inferior food item for zoo-plankton growth (Perhar et al., 2012). For example, Arts et al.(1992) showed poor food quality of cyanobacteria may stem fromtheir nutritional inadequacy, as consumers exclusively fed oncyanobacteria exhibited near-starvation traits. Further, freshwa-ter cyanobacteria are reported to have high levels of myristicacid, very low levels of n−3 (omega-3) highly unsaturated fattyacids (making them very low quality food) as well as very lown−3:n−6 ratios (Perhar et al., 2012). A variety of parameteriza-tions have been used to characterize their lower susceptibility (oreven immunity) to grazing, including the lower grazing prefer-ence/palatability, lower assimilation rates, and inferior food quality(Arhonditsis and Brett, 2005). Moreover, recognizing the knowl-edge gaps related to the internal factors that could conceivablyinduce cyanobacteria blooms, Hense and Beckmann (2006) pro-posed a mathematical model to examine the dynamics of theirdistinctive life cycle, differentiating among four different stages:vegetative cells, vegetative cells with heterocysts, akinetes, andrecruiting cells (including germinates). The model assumes thatthe transition between each stage is regulated by a set of inter-nal energy and nitrogen quotas that act as threshold values for thecell to possess stage-specific physiological/ecological characteris-tics. For example, vegetative cells have high internal energy andnitrogen concentration and grow when nitrogen is available. Oncenitrogen is depleted (i.e., below a threshold value), vegetative cellsdevelop heterocysts that allow to grow further by nitrogen fixation.The two vegetative cell stages are considered to be in the form offilaments and are positively buoyant. The development of akinetesoccurs towards the end of summer, triggered by the decreasingenergy supply and reduced cell division rates which in turn is mod-ulated by the internal cell quotas of energy and nitrogen. Thus, theseresting spores break off from the filaments and sink down onto thesediments, where they take up nutrients and mature during thewinter and most of the spring (Hense and Burchard, 2010). Withthe Hense and Beckmann (2006) model, cyanobacteria are assumedto inhibit zooplankton grazing due to their toxic characteristics,and therefore their mortality is expressed as a linear term. Alongthe same line of thought, Jöhnk et al. (2011) used a mathematicalmodel to simulate the life cycle of C. raciborskii (Nostocales), thereby
predicting their future development under varying environmentalconditions. In coastal systems, salinity can also be an important fac-tor regulating the production and germination of akinetes (Huber,1985).
Other process-based submodels developed for the distinctivecharacteristics of cyanobacteria, include toxin production andallelopathic interactions with higher trophic organisms and/orother competing algal functional groups. The physiology and func-tion of toxin production is still very poorly understood, as thereare multiple competing theories that pose challenges in the devel-opment of reliable predictive tools (Vanderploeg et al., 2001). Forexample, several studies showed a positive relationship betweennitrogen concentration and toxin-producing Microcystis strains ormicrocystin production (Murphy et al., 2003). In particular, ureais hypothesized to be an energetically favourable form of nitro-gen and therefore a predominant stimulant of Microcystis blooms(Finlay et al., 2010). Others suggested that TP concentrations canexplain most of the microcystin variability in embayments, rivers,creeks, ponds, nearshore and offshore sites in the Great Lakes, whileother potentially reliable predictors include the concentration ofmicronutrients, UV radiation stress, chlorophyll a and Secchi discdepth (Makarewicz et al., 2009). In this regard, Grover et al. (2010)developed a model that considers cyanotoxin production duringthe blooms of the harmful alga Prymnesium parvum, which in turninhibits the growth of other phytoplankton groups. Cyanotoxinconcentrations were assumed to be proportional to the productof population density with the growth rate, while the allelopathiceffects were introduced through an inhibition term that reducesthe growth rates of the rest of the algal functional groups by 50%.In a subsequent model, Grover et al. (2012) added a populationof small-bodied zooplankton, with their grazing rate on P. parvumsimilarly inhibited by the excreted dissolved toxins. The fundamen-tal concepts of the model may have broader applicability to predictdynamics of other toxin-producing algal groups and to examine theimportance of allelopathy and inhibition of zooplankton grazing intriggering major structural shifts in phytoplankton assemblages.Generally, a review of the pertinent modelling literature offersa number of interesting propositions on how mathematics canaccommodate our ever-growing understanding of cyanobacteriaecophysiology. The questions arising though is are we ready tosupport reliable forecasts of harmful algal blooms or even to pin-point what is missing in order to effectively support environmentalmanagement?
4. Concluding remarks and future perspectives
The documented challenges with mathematical modellingwhen addressing societally/scientifically important issues, such asdrinking water, fisheries, and water use for recreational purposes,is often attributed to the fact that the field has advanced with-out the healthy dose of criticism required to obtain good science;partly because the “impenetrable” nature of mathematics has pro-hibited sober views from the modelling community, which in turn“has allowed modellers to carry their trade far beyond the limits ofreality” (Pilkey and Pilkey-Jarvis, 2007). Indeed, the present anal-ysis provided ample evidence that our capacity to reproduce theobserved aggregated and compositional phytoplankton variabilityis limited, despite the plethora of mathematical expressions aimingto describe different ecophysiological facets of species populations.A significant portion of PFG modelling efforts published in the peer-reviewed literature reported model fit that was inferior relativeto what we can achieve by merely using the average value of thecorresponding calibration datasets!
Reviewing the recent literature, one can find several interest-ing recommendations in regard to the future of phytoplankton
Y. Shimoda, G.B. Arhonditsis / Ecological Modelling 320 (2016) 29–43 41
functional group modelling. For example, the series of “Horizons”articles hosted in the Journal of Plankton Research has offered manyfresh ideas and pointers for progress (Anderson, 2005; Flynn, 2006;Le Quere, 2006). Challenging the trustworthiness of many modelsfor addressing vexing aspects of water quality stewardship, oneof the interesting propositions of this debate was to open the dia-logue between biologists and modellers. According to Flynn (2005),the problem is that the latter group is not always supported bysound conceptual understanding, commonality in units, completemass balance, and adequate empirical knowledge on the patterns ofsentinel plankton organisms under environmentally relevant con-ditions. The same author further asserted that “. . .we need data, andlots of them. But we do not need them just for the growth of individualorganisms; vitally we also need data for combinations of organisms.What is becoming increasingly clear is that there are a whole host ofinteractions between members of the plankton that the vast majorityof models do not even hint at. . .” (Flynn, 2006). On the other hand,biologists claim that they do not get sufficient guidance on how datacollection and experimentation could be optimized, while the pro-found oversimplifications of the current generation of ecologicalmodels do not allow rectifying the disconnect between empiricistsand theoreticians (Flynn, 2005, 2006). Many of these assertions canbe easily verified by anyone who is familiar with the PFG modellingliterature.
From a technical standpoint, our analysis presented someencouraging trends relative to earlier critiques of the method-ological practices typically followed in the field of aquaticbiogeochemical modelling (Arhonditsis and Brett, 2004). Althoughfar from “ideal”, there is an increasing portion of the reviewedpapers that does perform sensitivity analysis, quantify model per-formance, and (most importantly) attempt to present some typeof structural and/or predictive confirmation. Of particular note isthe fact that one third of studies that provided model performancemeasures did not evaluate the fidelity of algal functional groupsimulations. While a plausible explanation could be the aforemen-tioned lack of suitable phytoplankton composition data, we alsofound that there were instances in which phytoplankton functionalgroups were added as state variables, even though they were notthe actual focus of the study. Whatever the reason may be, thisabsence of data constraints on the PFG characterization is problem-atic and may reflect an ill-practice of treating the correspondingPFG parameters as “properties of convenience” that facilitate thefitting of models to observed data (Poulin and Franks, 2010). Infact, there are many examples in which the same phytoplanktonfunctional group within the same system has been parameterizedwith very different properties, depending on the model considered(Kim et al., 2014). In this regard, our stance echoes skeptical viewsin the literature that raise concerns about the increasing modelcomplexity and advice to seek parsimony rather than simplicity.We believe that the gradual incorporation of complexity, wherepossible and relevant, is the most prudent strategy and any suchmodel development should be accompanied by rigorous assess-ment of the underlying uncertainty (Arhonditsis et al., 2007). Ofequal importance is the establishment of a systematic method-ological protocol specifically designed for PFG models along withperformance criteria widely accepted by the modelling commu-nity. Even if the journals cannot enforce the submission of all thematerial required to reconstruct the mathematical models (Flynn,2005), they can still demand the submitted modelling studies tomeet certain criteria and ensure that the inclusion of state variablesrelated to compositional variability is not used to provide additionaldegrees of freedom to fit aggregated phytoplankton variables (e.g.,total chlorophyll a or algal biovolume).
On a final note, we could not agree more with Anderson’s (2005)recommendation to integrate empirical PFG representations withprocess-based modelling. One such case could be the linkage of
phytoplankton physiological processes with specific morphologicalfeatures (i.e., cell volume, surface-to-volume ratio, shape). Foundedupon concepts of allometric theory, the size and shape of orga-nisms strongly influences their physiological rates and may shapetheir responses to external perturbations, the interspecific compe-tition, and ultimately the composition of algal assemblages (Cyrand Pace, 1993). While far from being a flawless representation ofthe real world (Flynn, 2005), there are several important concep-tual and technical reasons to consider the allometric scaling forthe parameterization of plankton ecosystem model (Elliott et al.,2000; Sin and Wetzel, 2002; Kerimoglu et al., 2012; Wirtz, 2013).This strategy can effectively delineate model parametric uncer-tainty; namely, the literature-based ranges typically assigned tothe calibration parameters are now replaced by the parameterstandard error values and/or estimates of the residual variabil-ity of allometric equations (Shimoda et al., 2015). Considering thegrowing model complexity, this practice may be an excellent solu-tion to the identifiability problem of complex over-parameterizedmodel and may offer a reliable strategy to support model-basedaquatic ecosystem management. The allometric scaling offers adifferent perspective towards the optimization of future data col-lection efforts. Model calibration is not solely perceived as a typicalinverse solution exercise, constantly inviting the collection of dataon model outputs and subsequently readjusting the parameters toobtain the best possible agreement between measurements andpredictions. Rather, the effective model parameterization requiresa more focused experimentation that revolves around the devel-opment (or further refinement) of the allometric characterizationof model parameters (Shimoda et al., 2015). Moreover, dependingon the nature of the dataset used (e.g., marine versus freshwateralgae), the proposed strategy allows the potential users to identifythe model domain in a straightforward way and determine to whatextent a particular construct has site-specific or broader applicabil-ity. While Occam’s razor is (and should be) the cornerstone of anymodelling activity, we believe that the integration of process-basedmodels and empirical parameter specification offers an appealingprospect from both methodological and ecophysiological point ofview.
Acknowledgments
Funding for this study was provided by the National Sciencesand Engineering Research Council of Canada (NSERC) through aDoctoral Graduate Scholarship (Yuko Shimoda) and a DiscoveryGrant (George Arhonditsis).
Appendix A. Supplementary data
Supplementary material related to this article can be found, inthe online version, at http://dx.doi.org/10.1016/j.ecolmodel.2015.08.029
References
Adrian, R., O’Reilly, C.M., Zagarese, H., Baines, S.B., Hessen, D.O., Keller, W., Liv-ingstone, D.M., Sommaruga, R., Straile, D., Van Donk, E., Weyhenmeyer, G.A.,Winder, M., 2009. Lakes as sentinels of climate change. Limnol. Oceanogr. 54,2283–2297, http://dx.doi.org/10.4319/lo.2009.54.6 part 2.2283.
Aldenberg, T., Janse, J., Kramer, P., 1995. Fitting the dynamic model PClake to a multilake survey through Bayesian statistics. Ecol. Model. 78, 83–99, http://dx.doi.org/10.1016/0304-3800(94)00119-3.
Allen, J.I., 1997. A modelling study of ecosystem dynamics and nutrient cycling in theHumber plume, UK. J. Sea Res. 38, 333–359, http://dx.doi.org/10.1016/S1385-1101(97)00050-6.
Allen, J.I., Blackford, J.C., Radford, P.J., 1998a. An 1-D vertically resolved modellingstudy of the ecosystem dynamics of the middle and southern Adriatic Sea. J. Mar.Syst. 18, 265–286.
Allen, J.I., Howland, R.M.H., Bloomer, N., Uncles, R.J., 1998b. Simulating the springphytoplankton bloom in the Humber plume, UK. Mar. Pollut. Bull. 37, 295–305.
42 Y. Shimoda, G.B. Arhonditsis / Ecological Modelling 320 (2016) 29–43
Allison, E., Walsby, A., 1981. The role of potassium in the control of turgor pressurein a gas-vacuolate blue-green-alga. J. Exp. Bot. 32, 241–249, http://dx.doi.org/10.1093/jxb/32.1.241.
Anderson, T.R., 2005. Plankton functional type modelling: running before we canwalk? J. Plankton Res. 27, 1073–1081, http://dx.doi.org/10.1093/plankt/fbi076.
Arhonditsis, G.B., 2010. Useless arithmetic? Lessons learnt from aquatic biogeo-chemical modelling. In: Hanrahan, G. (Ed.), Modelling of Pollutants in ComplexEnvironmental Systems. ILM Publications, Hertfordshire, UK, p. 512pp.
Arhonditsis, G.B., Brett, M.T., 2004. Evaluation of the current state of mechanisticaquatic biogeochemical modeling. Mar. Ecol. Prog. Ser. 271, 13–26, http://dx.doi.org/10.3354/meps271013.
Arhonditsis, G.B., Brett, M.T., 2005. Eutrophication model for Lake Washington (USA).Part I: Model description and sensitivity analysis. Ecol. Model. 187, 140–178,http://dx.doi.org/10.1016/j.ecolmodel.2005.01.040.
Arhonditsis, G.B., Adams-VanHarn, B.A., Nielsen, L., Stow, C.A., Reckhow, K.H., 2006.Evaluation of the current state of mechanistic aquatic biogeochemical modeling:citation analysis and future perspectives. Environ. Sci. Technol. 40, 6547–6554,http://dx.doi.org/10.1021/es061030q.
Arhonditsis, G.B., Qian, S.S., Stow, C.A., Lamon, E.C., Reckhow, K.H., 2007. Eutro-phication risk assessment using Bayesian calibration of process-based models:application to a mesotrophic lake. Ecol. Model. 208, 215–229, http://dx.doi.org/10.1016/j.ecolmodel.2007.05.020.
Arts, M., Evans, M., Robarts, R., 1992. Seasonal patterns of total and energy reservelipids of dominant zooplanktonic crustaceans from a hyper-eutrophic lake.Oecologia 90, 560–571, http://dx.doi.org/10.1007/BF01875451.
Baird, M.E., Ralph, P.J., Rizwi, F., Wild-Allen, K., Steven, A.D., 2013. A dynamic modelof the cellular carbon to chlorophyll ratio applied to a batch culture and a conti-nental shelf ecosystem. Limnol. Oceanogr. 58 (4), 1215–1226, http://dx.doi.org/10.4319/lo.2013.58.4.1215.
Beniston, M., 2004. The 2003 heat wave in Europe: a shape of things to come? Ananalysis based on Swiss climatological data and model simulations. Geophys.Res. Lett. 31, L02202, http://dx.doi.org/10.1029/2003GL018857.
Bierman, V.J., Dolan, D.M., 1981. Modeling of phytoplankton-nutrient dynamics inSaginaw bay, Lake Huron. J. Gt. Lakes Res. 7, 409–439, http://dx.doi.org/10.1016/S0380-1330(81)72069-0.
Blomqvist, P., Pettersson, A., Hyenstrand, P., 1994. Ammonium-nitrogen – a keyregulatory factor causing dominance of non-nitrogen-fixing cyanobacteria inaquatic systems. Arch. Hydrobiol. 132, 141–164.
Bohme, H., 1998. Regulation of nitrogen fixation in heterocyst-formingcyanobacteria. Trends Plant Sci. 3, 346–351, http://dx.doi.org/10.1016/S1360-1385(98)01290-4.
Bonnet, M.P., Poulin, M., 2002. Numerical modelling of the planktonic successionin a nutrient-rich reservoir: environmental and physiological factors leading toMicrocystis aeruginosa dominance. Ecol. Model. 156, 93–112, http://dx.doi.org/10.1016/S0304-3800(02)00132-1.
Bormans, M., Sherman, B.S., Webster, I.T., 1999. Is buoyancy regulation in cyanobac-teria an adaptation to exploit separation of light and nutrients? Mar. Freshw.Res. 50 (8), 897–906.
Burger, D.F., Hamilton, D.P., Pilditch, C.A., 2008. Modelling the relative importanceof internal and external nutrient loads on water column nutrient concentra-tions and phytoplankton biomass in a shallow polymictic lake. Ecol. Model. 211,411–423, http://dx.doi.org/10.1016/j.ecolmodel.2007.09.028.
Carmichael, W., 1994. Toxins of cyanobacteria. Sci. Am. 270, 78–86.Chapra, S.C., 1997. Surface Water-Quality Modeling. McGraw-Hill, New York, NY.Chen, C.W., 1970. Concepts and utilities of ecological models. Proc. Am. Soc. Civ. Eng.
J. Sanit. Eng. Div. 96, 1085–1097.Copetti, D., Tartari, G., Morabito, G., Oiggioni, A., Legnani, E., Imberger, J., 2006. A bio-
geochemical model of Lake Pusiano (North Italy) and its use in the predictabilityof phytoplankton blooms: first preliminary results. J. Limnol. 65, 59–64.
Cyr, H., Pace, M., 1993. Allometric theory – extrapolations from individuals to com-munities. Ecology 74, 1234–1245, http://dx.doi.org/10.2307/1940493.
Dokulil, M.T., Teubner, K., 2000. Cyanobacterial dominance in lakes. Hydrobiologia438, 1–12, http://dx.doi.org/10.1023/A:1004155810302.
Edwards, K.F., Thomas, M.K., Klausmeier, C.A., Litchman, E., 2012. Allometric scalingand taxonomic variation in nutrient utilization traits and maximum growth rateof phytoplankton. Limnol. Oceanogr. 57, 554–566, http://dx.doi.org/10.4319/lo.2012.57.2.0554.
Eilola, K., Meier, H.E.M., Almroth, E., 2009. On the dynamics of oxygen, phosphorusand cyanobacteria in the Baltic Seal: a model study. J. Mar. Syst. 75, 163–184,http://dx.doi.org/10.1016/j.jmarsys.2008.08.009.
Elliott, J.A., Irish, A.E., Reynolds, C.S., Tett, P., 2000. Modelling freshwater phytoplank-ton communities: an exercise in validation. Ecol. Model. 128, 19–26.
Elliott, J.A., Reynolds, C.S., Irish, A.E., 2001. An investigation of dominance in phyto-plankton using the PROTECH model. Freshw. Biol. 46, 99–108.
Estrada, V., Parodi, E.R., Diaz, M.S., 2009. Determination of biogeochemical param-eters in eutrophication models with simultaneous dynamic optimizationapproaches. Comput. Chem. Eng. 33, 1760–1769, http://dx.doi.org/10.1016/j.compchemeng.2009.01.007.
Finlay, K., Patoine, A., Donald, D.B., Bogard, M.J., Leavitt, P.R., 2010. Experimentalevidence that pollution with urea can degrade water quality in phosphorus-richlakes of the Northern Great Plains. Limnol. Oceanogr. 55, 1213–1230.
Flynn, K.J., 2005. Castles built on sand: dysfunctionality in plankton models and theinadequacy of dialogue between biologists and modellers. J. Plankton Res. 27,1205–1210, http://dx.doi.org/10.1093/plankt/fbi099.
Flynn, K.J., 2006. Reply to Horizons Article “Plankton functional type modelling:running before we can walk” Anderson (2005): II. Putting trophic functionality
into plankton functional types. J. Plankton Res. 28, 873–875, http://dx.doi.org/10.1093/plankt/fbl015.
Friedrichs, M.A.M., Hood, R.R., Wiggert, J.D., 2006. Ecosystem model complexityversus physical forcing: quantification of their relative impact with assimilatedArabian Sea data. Deep-Sea Res. Part II—Top. Stud. Oceanogr. 53, 576–600, http://dx.doi.org/10.1016/j.dsr2.2006.01.026.
Frost, T.M., Carpenter, S.R., Ives, A.R., Kratz, T.K., 1995. Species compensation andcomplementarity in ecosystem function. In: Jones, C.G., Lawton, J.H. (Eds.), Link-ing Species & Ecosystems. Springer, USA, pp. 224–239.
Fulton, E.A., Parslow, J.S., Smith, A.D.M., Johnson, C.R., 2004. Biogeochemical marineecosystem models. II: The effect of physiological detail on model performance.Ecol. Model. 173, 371–406, http://dx.doi.org/10.1016/j.ecolmodel.2003.09.024.
Gal, G., Hipsey, M.R., Parparov, A., Wagner, U., Makler, V., Zohary, T., 2009. Imple-mentation of ecological modeling as an effective management and investigationtool: Lake Kinneret as a case study. Ecol. Model. 220, 1697–1718, http://dx.doi.org/10.1016/j.ecolmodel.2009.04.010.
Gin, K.Y.H., Guo, J.H., Cheong, H.F., 1998. A size-based ecosystem model forpelagic waters. Ecol. Model. 112, 53–72, http://dx.doi.org/10.1016/S0304-3800(98)00126-4.
Grant, N., Walsby, A., 1977. Contribution of photosynthate to turgor pressure rise inplanktonic blue-green alga Anabaena flos aquae. J. Exp. Bot. 28, 409–415, http://dx.doi.org/10.1093/jxb/28.2.409.
Grover, J.P., Baker, J.W., Roelke, D.L., Brooks, B.W., 2010. Current Status of Mathemat-ical Models for Population Dynamics of Prymnesium parvum in a Texas Reservoir.Wiley Online Library.
Grover, J.P., Roelke, D.L., Brooks, B.W., 2012. Modeling of plankton communitydynamics characterized by algal toxicity and allelopathy: a focus on histori-cal Prymnesium parvum blooms in a Texas reservoir. Ecol. Model. 227, 147–161,http://dx.doi.org/10.1016/j.ecolmodel.2011.12.012.
Guven, B., Howard, A., 2006. Modelling the growth and movement of cyanobacteriain river systems. Sci. Total Environ. 368, 898–908, http://dx.doi.org/10.1016/j.scitotenv.2006.03.035.
Hellweger, F.L., Kravchuk, E.S., Novotny, V., Gladyshev, M.I., 2008. Agent-based mod-eling of the complex life cycle of a cyanobacterium (Anabaena) in a shallowreservoir. Limnol. Oceanogr. 53, 1227–1241.
Hense, I., Beckmann, A., 2006. Towards a model of cyanobacteria life cycle – effectsof growing and resting stages on bloom formation of N-2-fixing species. Ecol.Model. 195, 205–218, http://dx.doi.org/10.1016/j.ecolmodel.2005.11.018.
Hense, I., Beckmann, A., 2010. The representation of cyanobacteria life cycle pro-cesses in aquatic ecosystem models. Ecol. Model. 221, 2330–2338, http://dx.doi.org/10.1016/j.ecolmodel.2010.06.014.
Hense, I., Burchard, H., 2010. Modelling cyanobacteria in shallow coastal seas. Ecol.Model. 221, 238–244, http://dx.doi.org/10.1016/j.ecolmodel.2009.09.006.
Hipsey, M.R., Romero, J.R., Antenucci, J.P., Hamilton, D., 2006. Computational AquaticEcosystem Dynamics Model. v2.3 Science Manual Centre for Water Research.The University of Western Australia, http://www.cwr.uwa.edu.au/services/models/legacy/model/dyresmcaedym/dyresmcaedym documentation.html.
Huber, A.L., 1985. Factors affecting the germination of akinetes of Nodularia spumi-gena (Cyanobacteriaceae). Appl. Environ. Microbiol. 49 (1), 73–78.
Islam, M.N., Kitazawa, D., Kokuryo, N., Tabeta, S., Honma, T., Komatsu, N., 2012.Numerical modeling on transition of dominant algae in Lake Kitaura, Japan. Ecol.Model. 242, 146–163, http://dx.doi.org/10.1016/j.ecolmodel.2012.05.013.
James, R.T., Bierman, V.J., Erickson, M.J., Hinz, S.C., 2005. The Lake Okee-chobee Water Quality Model (LOWQM) enhancements, calibration, validationand analysis. Lake Reserv. Manage. 21, 231–260, http://dx.doi.org/10.1080/07438140509354433.
Janse, J.H., Aldenberg, T., 1990. Modelling phosphorus fluxes in the hypertrophicLoosdrecht lakes. Hydrobiol. Bull. 24, 69–89.
Jöhnk, K.D., Huisman, J., Sharples, J., Sommeijer, B., Visser, P.M., Stroom, J.M., 2008.Summer heatwaves promote blooms of harmful cyanobacteria. Glob. ChangeBiol. 14, 495–512, http://dx.doi.org/10.1111/j.1365-2486.2007.01510.x.
Jöhnk, K.D., Brüggemann, R., Rücker, J., Luther, B., Simon, U., Nixdorf, B., Wiedner, C.,2011. Modelling life cycle and population dynamics of Nostocales (cyanobac-teria). Environ. Model. Softw. 26, 669–677, http://dx.doi.org/10.1016/j.envsoft.2010.11.001.
Jorgensen, S.E., 1999. State-of-the-art of ecological modeling with emphasis ondevelopment of structural dynamic models. Ecol. Model. 120, 75–96.
Jørgensen, S.E., Bendoricchio, G., 2001. Fundamentals of Ecological Modelling, 3rded. Elsevier Science, Amsterdam/New York.
Kara, E.L., Hanson, P., Hamilton, D., Hipsey, M.R., McMahon, K.D., Read, J.S., Winslow,L., Dedrick, J., Rose, K., Carey, C.C., Bertilsson, S., da Motta Marques, D., Beversdorf,L., Miller, T., Wu, C., Hsieh, Y.-F., Gaiser, E., Kratz, T., 2012. Time-scale depend-ence in numerical simulations: assessment of physical, chemical, and biologicalpredictions in a stratified lake at temporal scales of hours to months. Envi-ron. Model. Softw. 35, 104–121, http://dx.doi.org/10.1016/j.envsoft.2012.02.014.
Kerimoglu, O., Straile, D., Peeters, F., 2012. Role of phytoplankton cell size on thecompetition for nutrients and light in incompletely mixed systems. J. Theor.Biol. 300, 330–343.
Kim, D.-K., Zhang, W., Watson, S., Arhonditsis, G.B., 2014. A commentary on themodelling of the causal linkages among nutrient loading, harmful algal blooms,and hypoxia patterns in Lake Erie. J. Gt. Lakes Res. 40, 117–129, http://dx.doi.org/10.1016/j.jglr.2014.02.014.
Konopka, A., 1982. Buoyancy regulation and vertical migration by Oscillatoriarubescens in Crooked Lake, Indiana. Br. Phycol. J. 17, 427–442.
Y. Shimoda, G.B. Arhonditsis / Ecological Modelling 320 (2016) 29–43 43
Konopka, A., Kromkamp, J., Mur, L.R., 1987. Regulation of gas-vesicle content andbuoyancy in light- or phosphate-limited cultures of Aphanizomenon flos-aquae(Cyanophyta). J. Phycol. 23, 70–78.
Kromkamp, J., Walsby, A., 1990. A computer-model of buoyancy and vertical migra-tion in cyanobacteria. J. Plankton Res. 12, 161–183, http://dx.doi.org/10.1093/plankt/12.1.161.
Kromkamp, J., Konopka, A., Mur, L., 1986. Buoyancy regulation in a strain ofAphanizomenon flos-aquae (cyanophyceae) – the importance of carbohydrateaccumulation and gas vesicle collapse. J. Gen. Microbiol. 132, 2113–2121.
Kromkamp, J., Konopka, A., Mur, L., 1988. Buoyancy regulation in light-limited con-tinuous cultures of Microcystis aeruginosa. J. Plankton Res. 10, 171–183, http://dx.doi.org/10.1093/plankt/10.2.171.
Le Quere, C., 2006. Reply to Horizons Article “Plankton functional type modelling:running before we can walk” Anderson (2005): I. Abrupt changes in marineecosystems? J. Plankton Res. 28, 871–872, http://dx.doi.org/10.1093/plankt/fbl014.
Legnani, E., Copetti, D., Oggioni, A., Tartari, G., Palumbo, M.T., Morabito, G., 2005.Planktothrix rubescens’ seasonal dynamics and vertical distribution in LakePusiano (North Italy). J. Limnol. 64, 61–73.
Lenes, J.M., Darrow, B.A., Walsh, J.J., Prospero, J.M., He, R., Weisberg, R.H., Vargo,G.A., Heil, C.A., 2008. Saharan dust and phosphatic fidelity: a three-dimensionalbiogeochemical model of Trichodesmium as a nutrient source for red tides on theWest Florida Shelf. Cont. Shelf Res. 28, 1091–1115, http://dx.doi.org/10.1016/j.csr.2008.02.009.
Lenes, J.M., Darrow, B.P., Walsh, J.J., Jolliff, J.K., Chen, F.R., Weisberg, R.H., Zheng,L., 2012. A 1-D simulation analysis of the development and maintenance of the2001 red tide of the ichthyotoxic dinoflagellate Karenia brevis on the West Floridashelf. Cont. Shelf Res. 41, 92–110, http://dx.doi.org/10.1016/j.csr.2012.04.007.
Lewis, D.M., Brookes, J.D., Lambert, M.F., 2004. Numerical models for managementof Anabaena circinalis. J. Appl. Phycol. 16, 457–468.
Makarewicz, J.C., Boyer, G.L., Lewis, T.W., Guenther, W., Atkinson, J., Arnold, M., 2009.Spatial and temporal distribution of the cyanotoxin microcystin-LR in the LakeOntario ecosystem: coastal embayments, rivers, nearshore and offshore, andupland lakes. J. Gt. Lakes Res. 35, 83–89, http://dx.doi.org/10.1016/j.jglr.2008.11.010.
Malve, O., Laine, M., Haario, H., Kirkkala, T., Sarvala, J., 2007. Bayesian modellingof algal mass occurrences—using adaptive MCMC methods with a lake waterquality model. Environ. Model. Softw. 22, 966–977, http://dx.doi.org/10.1016/j.envsoft.2006.06.016.
McCauley, E., Murdoch, W., 1987. Cyclic and stable populations – plankton asparadigm. Am. Nat. 129, 97–121, http://dx.doi.org/10.1086/284624.
Müller-Navarra, D.C., Brett, M.T., Liston, A., Goldman, C.R., 2000. A highly-unsaturated fatty acid predicts biomass transfer between primary producersand consumers. Nature 403, 74–77.
Muller-Karulis, B., Aigars, J., 2011. Modeling the long-term dynamics of nutrientsand phytoplankton in the Gulf of Riga. J. Mar. Syst. 87, 161–176, http://dx.doi.org/10.1016/j.jmarsys.2011.03.006.
Murphy, T.P., Irvine, K., Guo, J., Davies, J., Murkin, H., Charlton, M., Watson, S.B., 2003.New microcystin concerns in the lower Great Lakes. Water Qual. Res. J. Can. 38,127–140.
Neumann, T., Fennel, W., Kremp, C., 2002. Experimental simulations with an ecosys-tem model of the Baltic Sea: a nutrient load reduction experiment: nutrient loadreduction experiment. Glob. Biogeochem. Cycles 16, http://dx.doi.org/10.1029/2001GB001450, 7-1–7-19.
Omlin, M., Reichert, P., Forster, R., 2001. Biogeochemical model of Lake Zürich: modelequations and results. Ecol. Model. 141, 77–103.
Paerl, H.W., Huisman, J., 2008. Climate – blooms like it hot. Science 320, 57–58,http://dx.doi.org/10.1126/science.1155398.
Perhar, G., Arhonditsis, G.B., Brett, M.T., 2012. Modelling the role of highly unsat-urated fatty acids in planktonic food web processes: a mechanistic approach.Environ. Rev. 20, 155–172, http://dx.doi.org/10.1139/A2012-007.
Pilkey, O.H., Pilkey-Jarvis, L., 2007. Useless Arithmetic: Why Environmental Scien-tists Can’t Predict the Future. Columbia University Press.
Poulin, F.J., Franks, P.J.S., 2010. Size-structured planktonic ecosystems: constraints,controls and assembly instructions. J. Plankton Res. 32, 1121–1130, http://dx.doi.org/10.1093/plankt/fbp145.
Reynolds, C.S., 2006. The Ecology of Phytoplankton. Cambridge University Press,Cambridge, 535 pp.
Reynolds, C., Oliver, R., Walsby, A., 1987. Cyanobacterial dominance – the role ofbuoyancy regulation in dynamic lake environments. N. Z. J. Mar. Freshw. Res.21, 379–390.
Reynolds, C.S., Irish, A.E., Elliott, J.A., 2001. The ecological basis for simulating phy-toplankton responses to environmental change (PROTECH). Ecol. Model. 140,271–291.
Reynolds, C.S., Huszar, V., Kruk, C., Naselli-Flores, L., Melo, S., 2002. Towards afunctional classification of the freshwater phytoplankton. J. Plankton Res. 24,417–428, http://dx.doi.org/10.1093/plankt/24.5.417.
Rigosi, A., Marce, R., Escot, C., Rueda, F.J., 2011. A calibration strategy for dynamic suc-cession models including several phytoplankton groups. Environ. Model. Softw.26, 697–710, http://dx.doi.org/10.1016/j.envsoft.2011.01.007.
Robson, B.J., Hamilton, D.P., 2004. Three-dimensional modelling of a Microcystisbloom event in the Swan River estuary, Western Australia. Ecol. Model. 174,203–222, http://dx.doi.org/10.1016/j.ecolmodel.2004.01.006.
Robson, B.J., Baird, M., Wild-Allen, K., 2013. A physiological model for the marinecyanobacteria, Trichodesmium. In: MODSIM2013, 20th International Congresson Modelling and Simulation, Modelling and Simulation Society of Australiaand New Zealand, ISBN, pp. 1652–1658.
Romero, J.R., Antenucci, J.P., Imberger, J., 2004. One- and three-dimensional bio-geochemical simulations of two differing reservoirs. Ecol. Model. 174, 143–160,http://dx.doi.org/10.1016/j.ecolmodel.2004.01.005.
Savchuk, O.P., 2002. Nutrient biogeochemical cycles in the Gulf of Riga: scaling upfield studies with a mathematical model. J. Mar. Syst. 32, 253–280.
Savchuk, O., Wulff, F., 1996. Biogeochemical Transformations of Nitrogenand Phosphorus in the Marine Environment: Coupling Hydrodynamic andBiogeochemical Processes in Models for the Baltic Proper. StockholmUniversity.
Scheffer, M., Rinaldi, S., Huisman, J., Weissing, F.J., 2003. Why plankton communitieshave no equilibrium: solutions to the paradox. Hydrobiologia 491, 9–18, http://dx.doi.org/10.1023/A:1024404804748.
Schindler, D., 1990. Experimental perturbations of whole lakes as tests of hypothesesconcerning ecosystem structure and function. Oikos 57, 25–41, http://dx.doi.org/10.2307/3565733.
Segura, A.M., Kruk, C., Calliari, D., Fort, H., 2013. Use of a morphology-based func-tional approach to model phytoplankton community succession in a shallowsubtropical lake: trait-based phytoplankton succession. Freshw. Biol. 58, 504–512,http://dx.doi.org/10.1111/j.1365-2427.2012.02867.x.
Shimoda, Y., Rao, Y.R., Watson, S.B., Arhonditsis, G.B., 2015. Optimizing the com-plexity of phytoplankton functional group modelling: an allometric approach(submitted for publication).
Sin, Y., Wetzel, R.L., 2002. Ecosystem modeling analysis of size-structuredphytoplankton dynamics in the York River estuary, Virginia (USA). I. Devel-opment of a plankton ecosystem model with explicit feedback controls andhydrodynamics. Mar. Ecol. Prog. Ser. 228, 75–90, http://dx.doi.org/10.3354/meps228075.
Staal, M., Meysman, F.J.R., Stal, L.J., 2003. Temperature excludes N2-fixing hetero-cystous cyanobacteria in the tropical oceans. Nature 425, 504–507, http://dx.doi.org/10.1038/nature01999.
Thingstad, T.F., Strand, E., Larsen, A., 2010. Stepwise building of plankton functionaltype (PFT) models: a feasible route to complex models? Prog. Oceanogr. 84, 6–15,http://dx.doi.org/10.1016/j.pocean.2009.09.001.
Van Nes, E.H., Scheffer, M., 2005. A strategy to improve the contribution of complexsimulation models to ecological theory. Ecol. Model. 185, 153–164, http://dx.doi.org/10.1016/j.ecolmodel.2004.12.001.
Vanderploeg, H.A., Liebig, J.R., Carmichael, W.W., Agy, M.A., Johengen, T.H., Fah-nenstiel, G.L., Nalepa, T.F., 2001. Zebra mussel (Dreissena polymorpha) selectivefiltration promoted toxic Microcystis blooms in Saginaw Bay (Lake Huron) andLake Erie. Can. J. Fish. Aquat. Sci. 58, 1208–1221, http://dx.doi.org/10.1139/cjfas-58-6-1208.
Walsh, J.J., Penta, B., Dieterle, D.A., Bissett, W.P., 2001. Predictive ecological modelingof harmful algal blooms. Hum. Ecol. Risk Assess. Int. J. 7, 1369–1383.
Ward, B.A., Schartau, M., Oschlies, A., Martin, A.P., Follows, M.J., Anderson, T.R., 2013.When is a biogeochemical model too complex? Objective model reduction andselection for North Atlantic time-series sites. Prog. Oceanogr. 116, 49–65, http://dx.doi.org/10.1016/j.pocean.2013.06.002.
Watson, S.B., Ridal, J., Boyer, G.L., 2008. Taste and odour and cyanobacterial toxins:impairment, prediction, and management in the Great Lakes. Can. J. Fish. Aquat.Sci. 65, 1779–1796, http://dx.doi.org/10.1139/F08-084.
Wellen, C., Kamran-Disfani, A.-R., Arhonditsis, G.B., 2015. Evaluation of the currentstate of distributed watershed nutrient water quality modeling. Environ. Sci.Technol. 49, 3278–3290, http://dx.doi.org/10.1021/es5049557.
Wirtz, K.W., 2013. Mechanistic origins of variability in phytoplankton dynam-ics: Part I: Niche formation revealed by a size-based model. Mar. Biol. 160,2319–2335.
Zehr, J.P., 2011. Nitrogen fixation by marine cyanobacteria. Trends Microbiol. 19,162–173, http://dx.doi.org/10.1016/j.tim.2010.12.004.
Zhang, W., Arhonditsis, G.B., 2008. Predicting the frequency of water qualitystandard violations using Bayesian calibration of eutrophication models. J. Gt.Lakes Res. 34, 698–720.
Zhang, W., Rao, Y.R., 2012. Application of a eutrophication model for assessing waterquality in Lake Winnipeg. J. Gt. Lakes Res. 38, 158–173, http://dx.doi.org/10.1016/j.jglr.2011.01.003.
Zhang, H., Culver, D.A., Boegman, L., 2008. A two-dimensional ecological model ofLake Erie: application to estimate dreissenid impacts on large lake planktonpopulations. Ecol. Model. 214, 219–241, http://dx.doi.org/10.1016/j.ecolmodel.2008.02.005.
Zhao, J., Ramin, M., Cheng, V., Arhonditsis, G.B., 2008. Competition patterns amongphytoplankton functional groups: how useful are the complex mathematicalmodels? Acta Oecol. – Int. J. Ecol. 33, 324–344, http://dx.doi.org/10.1016/j.actao.2008.01.007.
PHYTOPLANKTON FUNCTIONAL TYPE MODELLING: RUNNING BEFORE WE
CAN WALK? A CRITICAL EVALUATION OF THE CURRENT STATE OF
KNOWLEDGE
SUPPORTING INFORMATION
Yuko Shimoda and George B. Arhonditsis*
Department of Physical & Environmental Sciences, University of Toronto,
Toronto, Ontario, Canada, M1C 1A4
* Corresponding author
E-mail: [email protected], Tel.: +1 416 208 4858; Fax: +1 416 287 7279
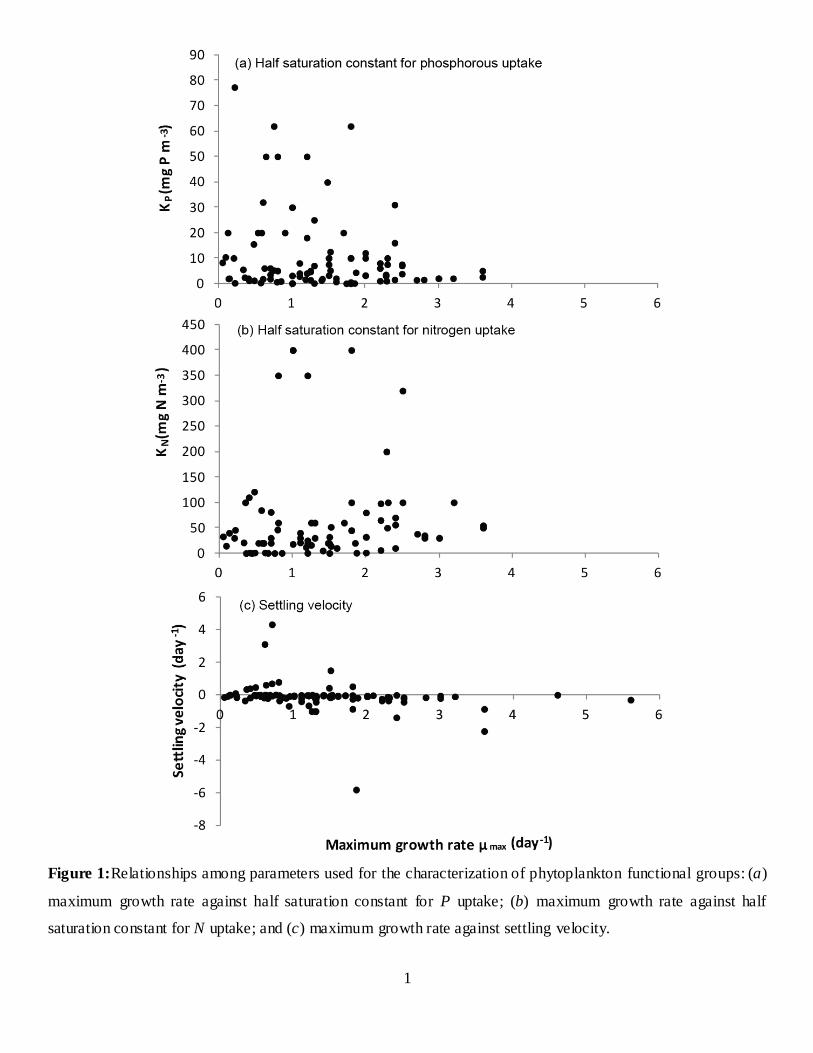
1
Figure 1:Relationships among parameters used for the characterization of phytoplankton functional groups: (a)
maximum growth rate against half saturation constant for P uptake; (b) maximum growth rate against half
saturation constant for N uptake; and (c) maximum growth rate against settling velocity.
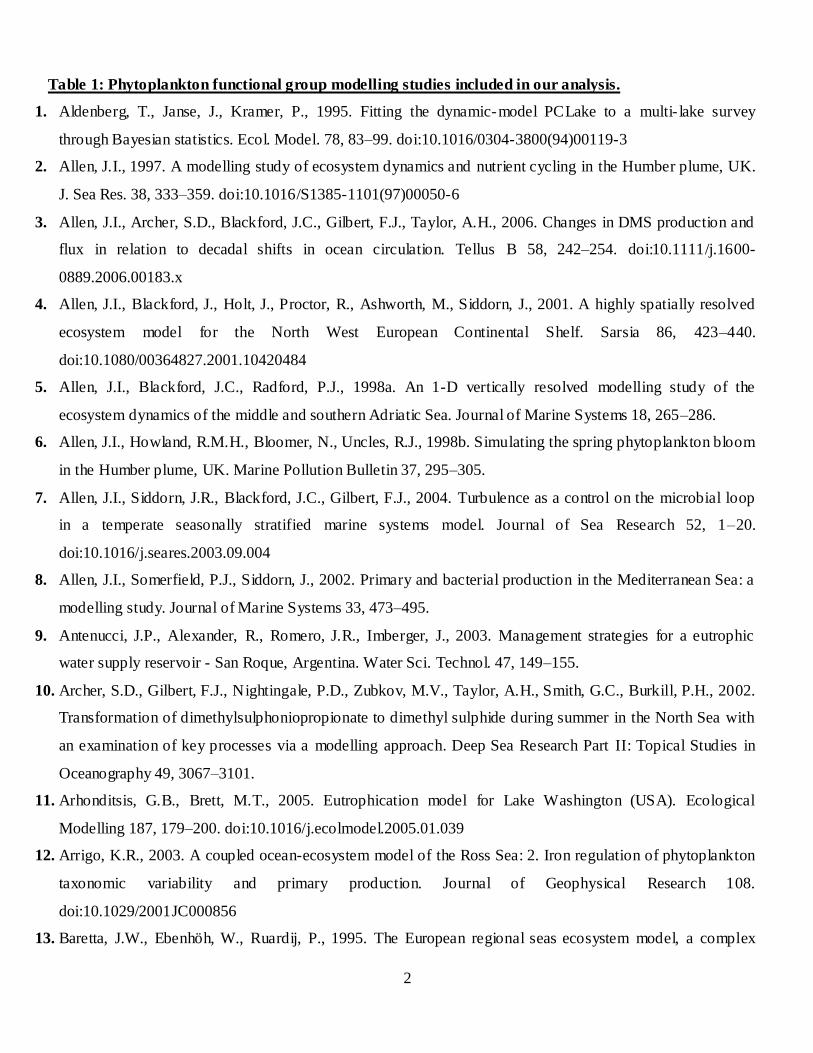
2
Table 1: Phytoplankton functional group modelling studies included in our analysis.
1. Aldenberg, T., Janse, J., Kramer, P., 1995. Fitting the dynamic-model PCLake to a multi- lake survey
through Bayesian statistics. Ecol. Model. 78, 83–99. doi:10.1016/0304-3800(94)00119-3
2. Allen, J.I., 1997. A modelling study of ecosystem dynamics and nutrient cycling in the Humber plume, UK.
J. Sea Res. 38, 333–359. doi:10.1016/S1385-1101(97)00050-6
3. Allen, J.I., Archer, S.D., Blackford, J.C., Gilbert, F.J., Taylor, A.H., 2006. Changes in DMS production and
flux in relation to decadal shifts in ocean circulation. Tellus B 58, 242–254. doi:10.1111/j.1600-
0889.2006.00183.x
4. Allen, J.I., Blackford, J., Holt, J., Proctor, R., Ashworth, M., Siddorn, J., 2001. A highly spatially resolved
ecosystem model for the North West European Continental Shelf. Sarsia 86, 423–440.
doi:10.1080/00364827.2001.10420484
5. Allen, J.I., Blackford, J.C., Radford, P.J., 1998a. An 1-D vertically resolved modelling study of the
ecosystem dynamics of the middle and southern Adriatic Sea. Journal of Marine Systems 18, 265–286.
6. Allen, J.I., Howland, R.M.H., Bloomer, N., Uncles, R.J., 1998b. Simulating the spring phytoplankton bloom
in the Humber plume, UK. Marine Pollution Bulletin 37, 295–305.
7. Allen, J.I., Siddorn, J.R., Blackford, J.C., Gilbert, F.J., 2004. Turbulence as a control on the microbial loop
in a temperate seasonally stratified marine systems model. Journal of Sea Research 52, 1–20.
doi:10.1016/j.seares.2003.09.004
8. Allen, J.I., Somerfield, P.J., Siddorn, J., 2002. Primary and bacterial production in the Mediterranean Sea: a
modelling study. Journal of Marine Systems 33, 473–495.
9. Antenucci, J.P., Alexander, R., Romero, J.R., Imberger, J., 2003. Management strategies for a eutrophic
water supply reservoir - San Roque, Argentina. Water Sci. Technol. 47, 149–155.
10. Archer, S.D., Gilbert, F.J., Nightingale, P.D., Zubkov, M.V., Taylor, A.H., Smith, G.C., Burkill, P.H., 2002.
Transformation of dimethylsulphoniopropionate to dimethyl sulphide during summer in the North Sea with
an examination of key processes via a modelling approach. Deep Sea Research Part II: Topical Studies in
Oceanography 49, 3067–3101.
11. Arhonditsis, G.B., Brett, M.T., 2005. Eutrophication model for Lake Washington (USA). Ecological
Modelling 187, 179–200. doi:10.1016/j.ecolmodel.2005.01.039
12. Arrigo, K.R., 2003. A coupled ocean-ecosystem model of the Ross Sea: 2. Iron regulation of phytoplankton
taxonomic variability and primary production. Journal of Geophysical Research 108.
doi:10.1029/2001JC000856
13. Baretta, J.W., Ebenhöh, W., Ruardij, P., 1995. The European regional seas ecosystem model, a complex
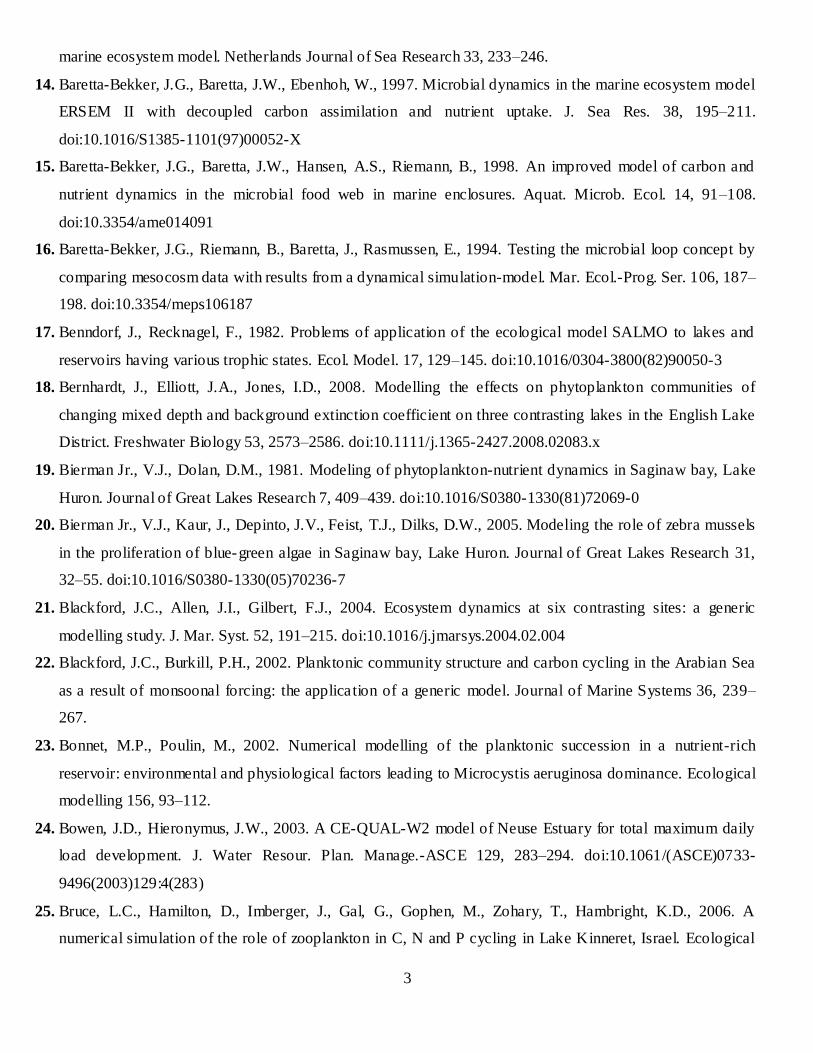
3
marine ecosystem model. Netherlands Journal of Sea Research 33, 233–246.
14. Baretta-Bekker, J.G., Baretta, J.W., Ebenhoh, W., 1997. Microbial dynamics in the marine ecosystem model
ERSEM II with decoupled carbon assimilation and nutrient uptake. J. Sea Res. 38, 195–211.
doi:10.1016/S1385-1101(97)00052-X
15. Baretta-Bekker, J.G., Baretta, J.W., Hansen, A.S., Riemann, B., 1998. An improved model of carbon and
nutrient dynamics in the microbial food web in marine enclosures. Aquat. Microb. Ecol. 14, 91–108.
doi:10.3354/ame014091
16. Baretta-Bekker, J.G., Riemann, B., Baretta, J., Rasmussen, E., 1994. Testing the microbial loop concept by
comparing mesocosm data with results from a dynamical simulation-model. Mar. Ecol.-Prog. Ser. 106, 187–
198. doi:10.3354/meps106187
17. Benndorf, J., Recknagel, F., 1982. Problems of application of the ecological model SALMO to lakes and
reservoirs having various trophic states. Ecol. Model. 17, 129–145. doi:10.1016/0304-3800(82)90050-3
18. Bernhardt, J., Elliott, J.A., Jones, I.D., 2008. Modelling the effects on phytoplankton communities of
changing mixed depth and background extinction coefficient on three contrasting lakes in the English Lake
District. Freshwater Biology 53, 2573–2586. doi:10.1111/j.1365-2427.2008.02083.x
19. Bierman Jr., V.J., Dolan, D.M., 1981. Modeling of phytoplankton-nutrient dynamics in Saginaw bay, Lake
Huron. Journal of Great Lakes Research 7, 409–439. doi:10.1016/S0380-1330(81)72069-0
20. Bierman Jr., V.J., Kaur, J., Depinto, J.V., Feist, T.J., Dilks, D.W., 2005. Modeling the role of zebra mussels
in the proliferation of blue-green algae in Saginaw bay, Lake Huron. Journal of Great Lakes Research 31,
32–55. doi:10.1016/S0380-1330(05)70236-7
21. Blackford, J.C., Allen, J.I., Gilbert, F.J., 2004. Ecosystem dynamics at six contrasting sites: a generic
modelling study. J. Mar. Syst. 52, 191–215. doi:10.1016/j.jmarsys.2004.02.004
22. Blackford, J.C., Burkill, P.H., 2002. Planktonic community structure and carbon cycling in the Arabian Sea
as a result of monsoonal forcing: the application of a generic model. Journal of Marine Systems 36, 239–
267.
23. Bonnet, M.P., Poulin, M., 2002. Numerical modelling of the planktonic succession in a nutrient-rich
reservoir: environmental and physiological factors leading to Microcystis aeruginosa dominance. Ecological
modelling 156, 93–112.
24. Bowen, J.D., Hieronymus, J.W., 2003. A CE-QUAL-W2 model of Neuse Estuary for total maximum daily
load development. J. Water Resour. Plan. Manage.-ASCE 129, 283–294. doi:10.1061/(ASCE)0733-
9496(2003)129:4(283)
25. Bruce, L.C., Hamilton, D., Imberger, J., Gal, G., Gophen, M., Zohary, T., Hambright, K.D., 2006. A
numerical simulation of the role of zooplankton in C, N and P cycling in Lake Kinneret, Israel. Ecological
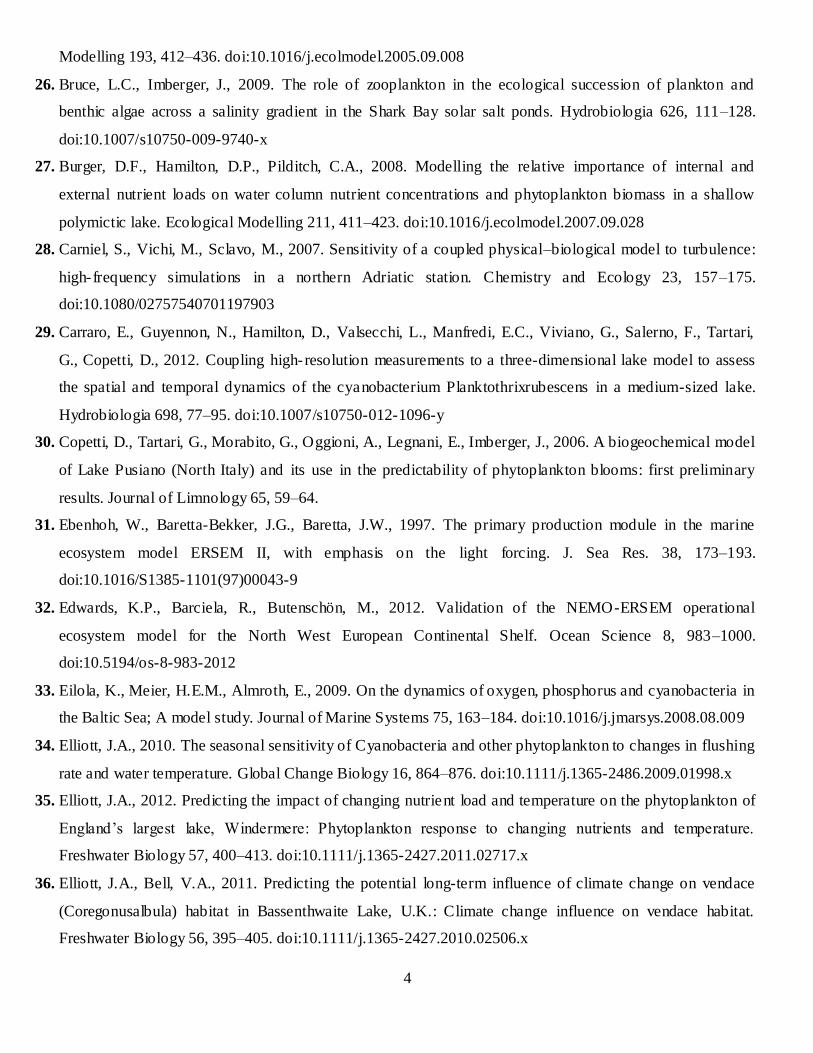
4
Modelling 193, 412–436. doi:10.1016/j.ecolmodel.2005.09.008
26. Bruce, L.C., Imberger, J., 2009. The role of zooplankton in the ecological succession of plankton and
benthic algae across a salinity gradient in the Shark Bay solar salt ponds. Hydrobiologia 626, 111–128.
doi:10.1007/s10750-009-9740-x
27. Burger, D.F., Hamilton, D.P., Pilditch, C.A., 2008. Modelling the relative importance of internal and
external nutrient loads on water column nutrient concentrations and phytoplankton biomass in a shallow
polymictic lake. Ecological Modelling 211, 411–423. doi:10.1016/j.ecolmodel.2007.09.028
28. Carniel, S., Vichi, M., Sclavo, M., 2007. Sensitivity of a coupled physical–biological model to turbulence:
high-frequency simulations in a northern Adriatic station. Chemistry and Ecology 23, 157–175.
doi:10.1080/02757540701197903
29. Carraro, E., Guyennon, N., Hamilton, D., Valsecchi, L., Manfredi, E.C., Viviano, G., Salerno, F., Tartari,
G., Copetti, D., 2012. Coupling high-resolution measurements to a three-dimensional lake model to assess
the spatial and temporal dynamics of the cyanobacterium Planktothrixrubescens in a medium-sized lake.
Hydrobiologia 698, 77–95. doi:10.1007/s10750-012-1096-y
30. Copetti, D., Tartari, G., Morabito, G., Oggioni, A., Legnani, E., Imberger, J., 2006. A biogeochemical model
of Lake Pusiano (North Italy) and its use in the predictability of phytoplankton blooms: first preliminary
results. Journal of Limnology 65, 59–64.
31. Ebenhoh, W., Baretta-Bekker, J.G., Baretta, J.W., 1997. The primary production module in the marine
ecosystem model ERSEM II, with emphasis on the light forcing. J. Sea Res. 38, 173–193.
doi:10.1016/S1385-1101(97)00043-9
32. Edwards, K.P., Barciela, R., Butenschön, M., 2012. Validation of the NEMO-ERSEM operational
ecosystem model for the North West European Continental Shelf. Ocean Science 8, 983–1000.
doi:10.5194/os-8-983-2012
33. Eilola, K., Meier, H.E.M., Almroth, E., 2009. On the dynamics of oxygen, phosphorus and cyanobacteria in
the Baltic Sea; A model study. Journal of Marine Systems 75, 163–184. doi:10.1016/j.jmarsys.2008.08.009
34. Elliott, J.A., 2010. The seasonal sensitivity of Cyanobacteria and other phytoplankton to changes in flushing
rate and water temperature. Global Change Biology 16, 864–876. doi:10.1111/j.1365-2486.2009.01998.x
35. Elliott, J.A., 2012. Predicting the impact of changing nutrient load and temperature on the phytoplankton of
England’s largest lake, Windermere: Phytoplankton response to changing nutrients and temperature.
Freshwater Biology 57, 400–413. doi:10.1111/j.1365-2427.2011.02717.x
36. Elliott, J.A., Bell, V.A., 2011. Predicting the potential long-term influence of climate change on vendace
(Coregonusalbula) habitat in Bassenthwaite Lake, U.K.: Climate change influence on vendace habitat.
Freshwater Biology 56, 395–405. doi:10.1111/j.1365-2427.2010.02506.x
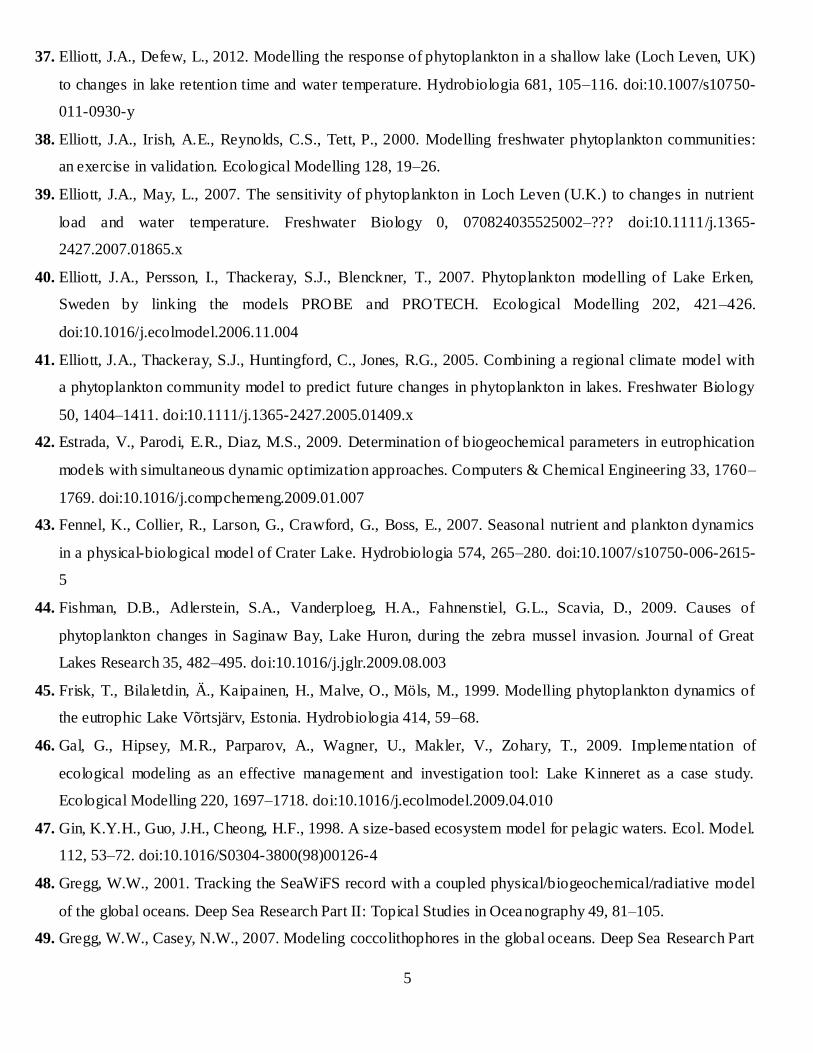
5
37. Elliott, J.A., Defew, L., 2012. Modelling the response of phytoplankton in a shallow lake (Loch Leven, UK)
to changes in lake retention time and water temperature. Hydrobiologia 681, 105–116. doi:10.1007/s10750-
011-0930-y
38. Elliott, J.A., Irish, A.E., Reynolds, C.S., Tett, P., 2000. Modelling freshwater phytoplankton communities:
an exercise in validation. Ecological Modelling 128, 19–26.
39. Elliott, J.A., May, L., 2007. The sensitivity of phytoplankton in Loch Leven (U.K.) to changes in nutrient
load and water temperature. Freshwater Biology 0, 070824035525002–??? doi:10.1111/j.1365-
2427.2007.01865.x
40. Elliott, J.A., Persson, I., Thackeray, S.J., Blenckner, T., 2007. Phytoplankton modelling of Lake Erken,
Sweden by linking the models PROBE and PROTECH. Ecological Modelling 202, 421–426.
doi:10.1016/j.ecolmodel.2006.11.004
41. Elliott, J.A., Thackeray, S.J., Huntingford, C., Jones, R.G., 2005. Combining a regional climate model with
a phytoplankton community model to predict future changes in phytoplankton in lakes. Freshwater Biology
50, 1404–1411. doi:10.1111/j.1365-2427.2005.01409.x
42. Estrada, V., Parodi, E.R., Diaz, M.S., 2009. Determination of biogeochemical parameters in eutrophication
models with simultaneous dynamic optimization approaches. Computers & Chemical Engineering 33, 1760–
1769. doi:10.1016/j.compchemeng.2009.01.007
43. Fennel, K., Collier, R., Larson, G., Crawford, G., Boss, E., 2007. Seasonal nutrient and plankton dynamics
in a physical-biological model of Crater Lake. Hydrobiologia 574, 265–280. doi:10.1007/s10750-006-2615-
5
44. Fishman, D.B., Adlerstein, S.A., Vanderploeg, H.A., Fahnenstiel, G.L., Scavia, D., 2009. Causes of
phytoplankton changes in Saginaw Bay, Lake Huron, during the zebra mussel invasion. Journal of Great
Lakes Research 35, 482–495. doi:10.1016/j.jglr.2009.08.003
45. Frisk, T., Bilaletdin, Ä., Kaipainen, H., Malve, O., Möls, M., 1999. Modelling phytoplankton dynamics of
the eutrophic Lake Võrtsjärv, Estonia. Hydrobiologia 414, 59–68.
46. Gal, G., Hipsey, M.R., Parparov, A., Wagner, U., Makler, V., Zohary, T., 2009. Implementation of
ecological modeling as an effective management and investigation tool: Lake Kinneret as a case study.
Ecological Modelling 220, 1697–1718. doi:10.1016/j.ecolmodel.2009.04.010
47. Gin, K.Y.H., Guo, J.H., Cheong, H.F., 1998. A size-based ecosystem model for pelagic waters. Ecol. Model.
112, 53–72. doi:10.1016/S0304-3800(98)00126-4
48. Gregg, W.W., 2001. Tracking the SeaWiFS record with a coupled physical/biogeochemical/radiative model
of the global oceans. Deep Sea Research Part II: Topical Studies in Oceanography 49, 81–105.
49. Gregg, W.W., Casey, N.W., 2007. Modeling coccolithophores in the global oceans. Deep Sea Research Part
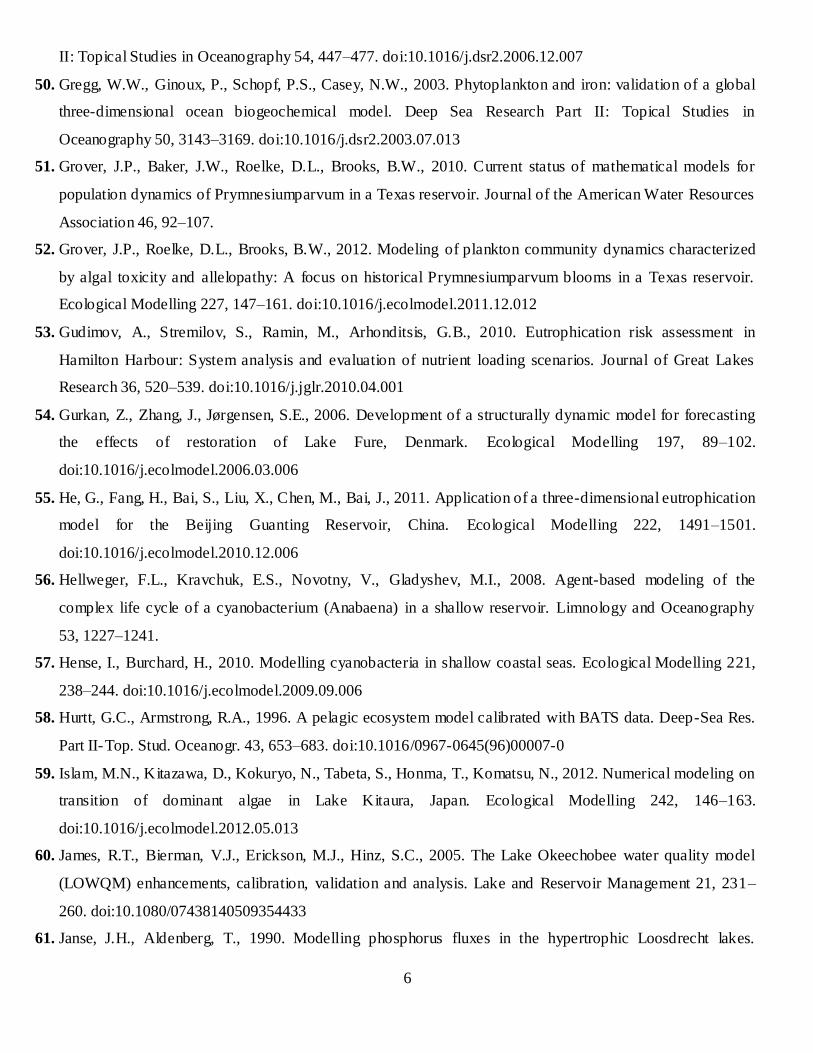
6
II: Topical Studies in Oceanography 54, 447–477. doi:10.1016/j.dsr2.2006.12.007
50. Gregg, W.W., Ginoux, P., Schopf, P.S., Casey, N.W., 2003. Phytoplankton and iron: validation of a global
three-dimensional ocean biogeochemical model. Deep Sea Research Part II: Topical Studies in
Oceanography 50, 3143–3169. doi:10.1016/j.dsr2.2003.07.013
51. Grover, J.P., Baker, J.W., Roelke, D.L., Brooks, B.W., 2010. Current status of mathematical models for
population dynamics of Prymnesiumparvum in a Texas reservoir. Journal of the American Water Resources
Association 46, 92–107.
52. Grover, J.P., Roelke, D.L., Brooks, B.W., 2012. Modeling of plankton community dynamics characterized
by algal toxicity and allelopathy: A focus on historical Prymnesiumparvum blooms in a Texas reservoir.
Ecological Modelling 227, 147–161. doi:10.1016/j.ecolmodel.2011.12.012
53. Gudimov, A., Stremilov, S., Ramin, M., Arhonditsis, G.B., 2010. Eutrophication risk assessment in
Hamilton Harbour: System analysis and evaluation of nutrient loading scenarios. Journal of Great Lakes
Research 36, 520–539. doi:10.1016/j.jglr.2010.04.001
54. Gurkan, Z., Zhang, J., Jørgensen, S.E., 2006. Development of a structurally dynamic model for forecasting
the effects of restoration of Lake Fure, Denmark. Ecological Modelling 197, 89–102.
doi:10.1016/j.ecolmodel.2006.03.006
55. He, G., Fang, H., Bai, S., Liu, X., Chen, M., Bai, J., 2011. Application of a three-dimensional eutrophication
model for the Beijing Guanting Reservoir, China. Ecological Modelling 222, 1491–1501.
doi:10.1016/j.ecolmodel.2010.12.006
56. Hellweger, F.L., Kravchuk, E.S., Novotny, V., Gladyshev, M.I., 2008. Agent-based modeling of the
complex life cycle of a cyanobacterium (Anabaena) in a shallow reservoir. Limnology and Oceanography
53, 1227–1241.
57. Hense, I., Burchard, H., 2010. Modelling cyanobacteria in shallow coastal seas. Ecological Modelling 221,
238–244. doi:10.1016/j.ecolmodel.2009.09.006
58. Hurtt, G.C., Armstrong, R.A., 1996. A pelagic ecosystem model calibrated with BATS data. Deep-Sea Res.
Part II-Top. Stud. Oceanogr. 43, 653–683. doi:10.1016/0967-0645(96)00007-0
59. Islam, M.N., Kitazawa, D., Kokuryo, N., Tabeta, S., Honma, T., Komatsu, N., 2012. Numerical modeling on
transition of dominant algae in Lake Kitaura, Japan. Ecological Modelling 242, 146–163.
doi:10.1016/j.ecolmodel.2012.05.013
60. James, R.T., Bierman, V.J., Erickson, M.J., Hinz, S.C., 2005. The Lake Okeechobee water quality model
(LOWQM) enhancements, calibration, validation and analysis. Lake and Reservoir Management 21, 231–
260. doi:10.1080/07438140509354433
61. Janse, J.H., Aldenberg, T., 1990. Modelling phosphorus fluxes in the hypertrophic Loosdrecht lakes.
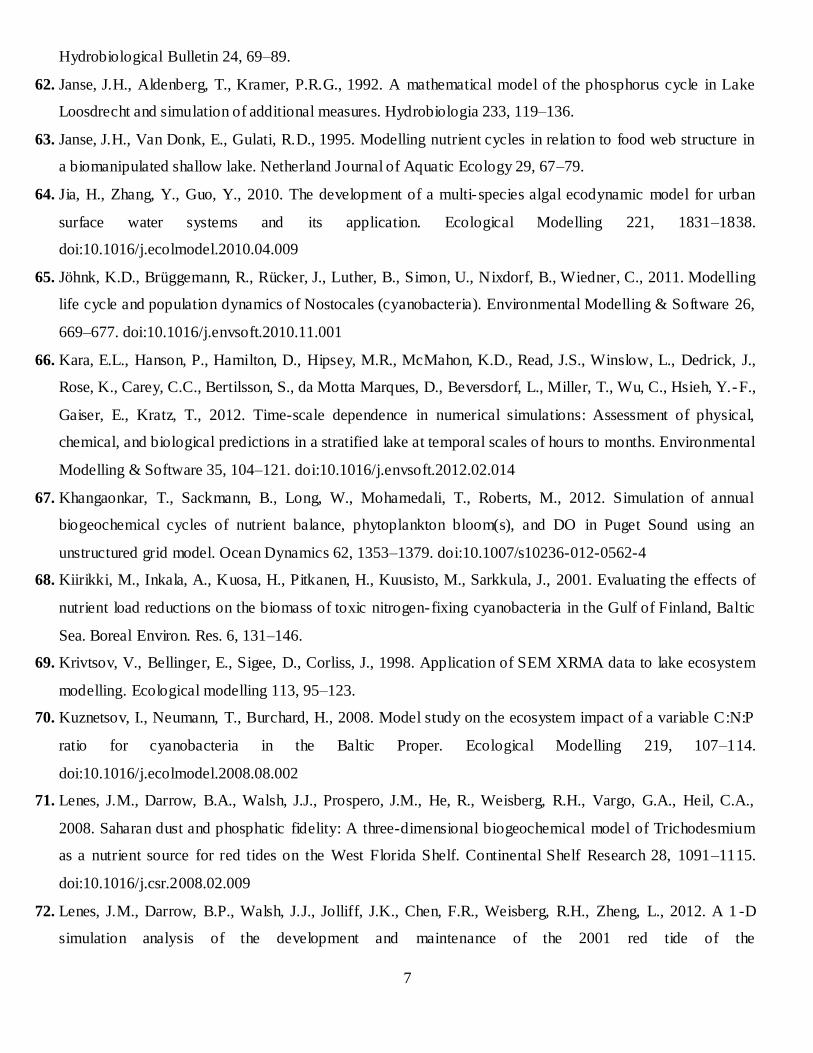
7
Hydrobiological Bulletin 24, 69–89.
62. Janse, J.H., Aldenberg, T., Kramer, P.R.G., 1992. A mathematical model of the phosphorus cycle in Lake
Loosdrecht and simulation of additional measures. Hydrobiologia 233, 119–136.
63. Janse, J.H., Van Donk, E., Gulati, R.D., 1995. Modelling nutrient cycles in relation to food web structure in
a biomanipulated shallow lake. Netherland Journal of Aquatic Ecology 29, 67–79.
64. Jia, H., Zhang, Y., Guo, Y., 2010. The development of a multi-species algal ecodynamic model for urban
surface water systems and its application. Ecological Modelling 221, 1831–1838.
doi:10.1016/j.ecolmodel.2010.04.009
65. Jöhnk, K.D., Brüggemann, R., Rücker, J., Luther, B., Simon, U., Nixdorf, B., Wiedner, C., 2011. Modelling
life cycle and population dynamics of Nostocales (cyanobacteria). Environmental Modelling & Software 26,
669–677. doi:10.1016/j.envsoft.2010.11.001
66. Kara, E.L., Hanson, P., Hamilton, D., Hipsey, M.R., McMahon, K.D., Read, J.S., Winslow, L., Dedrick, J.,
Rose, K., Carey, C.C., Bertilsson, S., da Motta Marques, D., Beversdorf, L., Miller, T., Wu, C., Hsieh, Y.-F.,
Gaiser, E., Kratz, T., 2012. Time-scale dependence in numerical simulations: Assessment of physical,
chemical, and biological predictions in a stratified lake at temporal scales of hours to months. Environmental
Modelling & Software 35, 104–121. doi:10.1016/j.envsoft.2012.02.014
67. Khangaonkar, T., Sackmann, B., Long, W., Mohamedali, T., Roberts, M., 2012. Simulation of annual
biogeochemical cycles of nutrient balance, phytoplankton bloom(s), and DO in Puget Sound using an
unstructured grid model. Ocean Dynamics 62, 1353–1379. doi:10.1007/s10236-012-0562-4
68. Kiirikki, M., Inkala, A., Kuosa, H., Pitkanen, H., Kuusisto, M., Sarkkula, J., 2001. Evaluating the effects of
nutrient load reductions on the biomass of toxic nitrogen-fixing cyanobacteria in the Gulf of Finland, Baltic
Sea. Boreal Environ. Res. 6, 131–146.
69. Krivtsov, V., Bellinger, E., Sigee, D., Corliss, J., 1998. Application of SEM XRMA data to lake ecosystem
modelling. Ecological modelling 113, 95–123.
70. Kuznetsov, I., Neumann, T., Burchard, H., 2008. Model study on the ecosystem impact of a variable C:N:P
ratio for cyanobacteria in the Baltic Proper. Ecological Modelling 219, 107–114.
doi:10.1016/j.ecolmodel.2008.08.002
71. Lenes, J.M., Darrow, B.A., Walsh, J.J., Prospero, J.M., He, R., Weisberg, R.H., Vargo, G.A., Heil, C.A.,
2008. Saharan dust and phosphatic fidelity: A three-dimensional biogeochemical model of Trichodesmium
as a nutrient source for red tides on the West Florida Shelf. Continental Shelf Research 28, 1091–1115.
doi:10.1016/j.csr.2008.02.009
72. Lenes, J.M., Darrow, B.P., Walsh, J.J., Jolliff, J.K., Chen, F.R., Weisberg, R.H., Zheng, L., 2012. A 1 -D
simulation analysis of the development and maintenance of the 2001 red tide of the
8
ichthyotoxicdinoflagellate Karenia brevis on the West Florida shelf. Continental Shelf Research 41, 92–110.
doi:10.1016/j.csr.2012.04.007
73. Lewis, D.M., Brookes, J.D., Lambert, M.F., 2004. Numerical models for management of Anabaena
circinalis. Journal of applied phycology 16, 457–468.
74. Lewis, D.M., Elliott, J.A., Brookes, J.D., Irish, A.E., Lambert, M.F., Reynolds, C.S., 2003. Modelling the
effects of artificial mixing and copper sulphate dosing on phytoplankton in an Australian reservoir. Lakes &
Reservoirs: Research & Management 8, 31–40.
75. Lewis, K., Allen, J.I., 2009. Validation of a hydrodynamic-ecosystem model simulation with time-series
data collected in the western English Channel. Journal of Marine Systems 77, 296–311.
doi:10.1016/j.jmarsys.2007.12.013
76. Lung, W., Paerl, H., 1988. Modeling blue green algal blooms in the lower Neuse River. Water Res. 22, 895–
905. doi:10.1016/0043-1354(88)90027-9
77. Maar, M., Møller, E.F., Larsen, J., Madsen, K.S., Wan, Z., She, J., Jonasson, L., Neumann, T., 2011.
Ecosystem modelling across a salinity gradient from the North Sea to the Baltic Sea. Ecological Modelling
222, 1696–1711. doi:10.1016/j.ecolmodel.2011.03.006
78. Malve, O., Laine, M., Haario, H., Kirkkala, T., Sarvala, J., 2007. Bayesian modelling of algal mass
occurrences—using adaptive MCMC methods with a lake water quality model. Environmental Modelling &
Software 22, 966–977. doi:10.1016/j.envsoft.2006.06.016
79. Markensten, H., Pierson, D.C., 2007. Weather driven influences on phytoplankton succession in a shallow
lake during contrasting years: Application of PROTBAS. Ecological Modelling 207, 128–136.
doi:10.1016/j.ecolmodel.2007.04.023
80. Mateus, M., Vaz, N., Neves, R., 2012. A process-oriented model of pelagic biogeochemistry for marine
systems. Part II: Application to a mesotidal estuary. Journal of Marine Systems 94, S90–S101.
doi:10.1016/j.jmarsys.2011.11.009
81. Menesguen, A., Hoch, T., 1997. Modelling the biogeochemical cycles of elements limiting primary
production in the English channel .1. Role of thermohaline stratification. Mar. Ecol.-Prog. Ser. 146, 173–
188. doi:10.3354/meps146173
82. Mieleitner, J., Reichert, P., 2008. Modelling functional groups of phytoplankton in three lakes of different
trophic state. Ecological Modelling 211, 279–291. doi:10.1016/j.ecolmodel.2007.09.010
83. Moreno-Ostos, E., Elliott, A., Cruz-Pizarro, L., Escot, C., Basanta, A., George, D.G., 2007. Using a
numerical model (PROTECH) to examine the impact of water transfers on phytoplankton dynamics in a
Mediterranean reservoir. Limnetica 26, 1–11.
84. Müller-Karulis, B., Aigars, J., 2011. Modeling the long-term dynamics of nutrients and phytoplankton in the
9
Gulf of Riga. Journal of Marine Systems 87, 161–176. doi:10.1016/j.jmarsys.2011.03.006
85. Murray, A.G., Parslow, J.S., 1999. Modelling of nutrient impacts in Port Phillip Bay-a semi-enclosed
marine Australian ecosystem. Marine and Freshwater Research, 50(6), 597-612. 10.1071/MF98087 1323-
1650/99/060597
86. Neumann, T., 2000. Towards a 3D-ecosystem model of the Baltic Sea. Journal of Marine Systems 25, 405–
419.
87. Norton, L., Elliott, J.A., Maberly, S.C., May, L., 2012. Using models to bridge the gap between land use and
algal blooms: An example from the Loweswater catchment, UK. Environmental Modelling & Software 36,
64–75. doi:10.1016/j.envsoft.2011.07.011
88. Omlin, M., Reichert, P., Forster, R., 2001. Biogeochemical model of Lake Zürich: model equations and
results. Ecological modelling 141, 77–103.
89. Özkundakci, D., Hamilton, D., Trolle, D., 2011. Modelling the response of a highly eutrophic lake to
reductions in external and internal nutrient loading. New Zealand Journal of Marine and Freshwater
Research 45, 165–185. doi:10.1080/00288330.2010.548072
90. Pers, B.C., 2005. Modeling the response of eutrophication control measures in a Swedish lake. Ambio 34,
552–558. doi:10.1639/0044-7447(2005)034[0552:MTROEC]2.0.CO;2
91. Pers, B.C., Persson, I., 2003. Simulation of a biogeochemica l model in different lakes. Nord. Hydrol. 34,
543–558.
92. Petihakis, G., Triantafyllou, G., Tsiaras, K., Korres, G., Pollani, A., Hoteit, I., 2009. Eastern Mediterranean
biogeochemical flux model–Simulations of the pelagic ecosystem. Ocean Science 5, 29–46.
93. Polimene, L., Pinardi, N., Zavatarelli, M., Colella, S., 2007. The Adriatic Sea ecosystem seasonal cycle:
Validation of a three-dimensional numerical model. Journal of Geophysical Research 112.
doi:10.1029/2005JC003260
94. Prokopkin, I.G., Mooij, W.M., Janse, J.H., Degermendzhy, A.G., 2010. A general one-dimensional vertical
ecosystem model of Lake Shira (Russia, Khakasia): description, parametrization and analysis. Aquatic
Ecology 44, 585–618. doi:10.1007/s10452-010-9326-8
95. Rigosi, A., Marcé, R., Escot, C., Rueda, F.J., 2011. A calibration strategy for dynamic succession models
including several phytoplankton groups. Environmental Modelling & Software 26, 697–710.
doi:10.1016/j.envsoft.2011.01.007
96. Rinke, K., Yeates, P., Rothhaupt, K.-O., 2010. A simulation study of the feedback of phytoplankton on
thermal structure via light extinction. Freshwater Biology. doi:10.1111/j.1365-2427.2010.02401.x
97. Robson, B.J., Hamilton, D.P., 2004. Three-dimensional modelling of a Microcystis bloom event in the Swan
River estuary, Western Australia. Ecological Modelling 174, 203–222. doi:10.1016/j.ecolmodel.2004.01.006
10
98. Roelke, D.L., 2000. Copepod food-quality threshold as a mechanism influencing phytoplankton succession
and accumulation of biomass, and secondary productivity: a modeling study with management implications.
Ecological Modelling 134, 245–274.
99. Romero, J.R., Antenucci, J.P., Imberger, J., 2004. One- and three-dimensional biogeochemical simulations
of two differing reservoirs. Ecological Modelling 174, 143–160. doi:10.1016/j.ecolmodel.2004.01.005
100. Salihoglu, B., Garçon, V., Oschlies, A., Lomas, M.W., 2008. Influence of nutrient utilization and
remineralization stoichiometry on phytoplankton species and carbon export: A modeling study at BATS.
Deep Sea Research Part I: Oceanographic Research Papers 55, 73–107. doi:10.1016/j.dsr.2007.09.010
101. Salihoglu, B., Hofmann, E.E., 2007. Simulations of phytoplankton species and carbon production in the
equatorial Pacific Ocean 1. Model configuration and ecosystem dynamics. Journal of Marine Research 65,
219–273.
102. Salomonsen, J., Jensen, J.J., 1996. Use of a lake model to examine exergy response to changes in
phytoplankton growth parameters and species composition. Ecol. Model. 87, 41–49. doi:10.1016/0304-
3800(94)00203-7
103. Savchuk, O.P., 2002. Nutrient biogeochemical cycles in the Gulf of Riga: scaling up field studies with a
mathematical model. Journal of Marine Systems 32, 253–280.
104. Siddorn, J.R., Allen, J.I., Blackford, J.C., Gilbert, F.J., Holt, J.T., Holt, M.W., Osborne, J.P., Proctor, R.,
Mills, D.K., 2007. Modelling the hydrodynamics and ecosystem of the North-West European continental
shelf for operational oceanography. Journal of Marine Systems 65, 417–429.
doi:10.1016/j.jmarsys.2006.01.018
105. Sin, Y., Wetzel, R.L., 2002. Ecosystem modeling analysis of size-structured phytoplankton dynamics in the
York River estuary, Virginia (USA). I. Development of a plankton ecosystem model with explicit feedback
controls and hydrodynamics. Mar. Ecol.-Prog. Ser. 228, 75–90. doi:10.3354/meps228075
106. Spillman, C.M., Hamilton, D.P., Hipsey, M.R., Imberger, J., 2008. A spatially resolved model of seasonal
variations in phytoplankton and clam (Tapes philippinarum) biomass in Barbamarco Lagoon, Italy.
Estuarine, Coastal and Shelf Science 79, 187–203. doi:10.1016/j.ecss.2008.03.020
107. Taylor, A.H., Harbour, D.S., Harris, R.P., Burkill, P.H., Edwards, E.S., 1993. Seasonal succession in the
pelagic ecosystem of the North Atlantic and the utilization of nitrogen. Journal of Plankton Research 15,
875–891.
108. Tian, R.C., Vezina, A.F., Legendre, L., Ingram, R.G., Klein, B., Packard, T., Roy, S., Savenkoff, C.,
Silverberg, N., Therriault, J.C., Tremblay, J.E., 2000. Effects of pelagic food-web interactions and nutrient
remineralization on the biogeochemical cycling of carbon: a modeling approach. Deep-Sea Res. Part II-Top.
Stud. Oceanogr. 47, 637–662. doi:10.1016/S0967-0645(99)00121-6
11
109. Tomczak, M.T., Niiranen, S., Hjerne, O., Blenckner, T., 2012. Ecosystem flow dynamics in the Baltic
Proper—Using a multi- trophic dataset as a basis for food–web modelling. Ecological Modelling 230, 123–
147. doi:10.1016/j.ecolmodel.2011.12.014
110. Trolle, D., Hamilton, D.P., Pilditch, C.A., Duggan, I.C., Jeppesen, E., 2011. Predicting the effects of climate
change on trophic status of three morphologically varying lakes: Implications for lake restoration and
management. Environmental Modelling & Software 26, 354–370. doi:10.1016/j.envsoft.2010.08.009
111. Trolle, D., Jørgensen, T.B., Jeppesen, E., 2008. Predicting the effects of reduced external nitrogen loading
on the nitrogen dynamics and ecological state of deep Lake Ravn, Denmark, using the DYRESM–
CAEDYM model. Limnologica - Ecology and Management of Inland Waters 38, 220–232.
doi:10.1016/j.limno.2008.05.009
112. Varela, R.A., Cruzado, A., Tintore, J., Garda Ladona, E., 1992. Modelling the deep-chlorophyll maximum: a
coupled physical-biological approach. Journal of Marine Research 50, 441–463.
113. Varis, O., 1993. Cyanobacteria dynamics in a restored Finnish lake: a long term simulation study.
Hydrobiologia 268, 129–145.
114. Vichi, M., Masina, S., Navarra, A., 2007. A generalized model of pelagic biogeochemistry for the global
ocean ecosystem. Part II: Numerical simulations. Journal of Marine Systems 64, 110–134.
doi:10.1016/j.jmarsys.2006.03.014
115. Vichi, M., Zavatarelli, M., Pinardi, N., 1998. Seasonal modulation of microbially mediated carbon fluxes in
the northern Adriatic Sea - a model study. Fish Oceanogr. 7, 182–190. doi:10.1046/j.1365-
2419.1998.00082.x
116. Walsh, J.J., Dieterle, D.A., Lenes, J., 2001a. A numerical analysis of carbon dynamics of the Southern
Ocean phytoplankton community: the roles of light and grazing in effecting both sequestration of
atmospheric CO 2 and food availability to larval krill. Deep Sea Research Part I: Oceanographic Research
Papers 48, 1–48.
117. Walsh, J.J., Penta, B., Dieterle, D.A., Bissett, W.P., 2001b. Predictive ecological modeling of harmful algal
blooms. Human and Ecological Risk Assessment: An International Journal 7, 1369–1383.
118. Wild-Allen, K., Herzfeld, M., Thompson, P. A., Rosebrock, U., Parslow, J., Volkman, J.K., 2010. Applied
coastal biogeochemical modelling to quantify the environmental impact of fish farm nutrients and inform
managers. Journal of Marine Systems, 81(1), 134-147. doi:10.1016/j.jmarsys.2009.12.013
119. Wirtz, K.W., Wiltshire, K., 2005. Long-term shifts in marine ecosystem functioning detected by inverse
modeling of the Helgoland Roads time-series. Journal of Marine Systems 56, 262–282.
doi:10.1016/j.jmarsys.2004.11.002
120. Zavatarelli, M., Baretta, J.W., Baretta-Bekker, J.G., Pinardi, N., 2000. The dynamics of the Adriatic Sea
12
ecosystem.: An idealized model study. Deep Sea Research Part I: Oceanographic Research Papers 47, 937–
970.
121. Zhang, H., Culver, D.A., Boegman, L., 2008. A two-dimensional ecological model of Lake Erie:
Application to estimate dreissenid impacts on large lake plankton populations. Ecological Modelling 214,
219–241. doi:10.1016/j.ecolmodel.2008.02.005
122. Zhang, J., Jørgensen, S.E., Mahler, H., 2004. Examination of structurally dynamic eutrophication model.
Ecological Modelling 173, 313–333. doi:10.1016/j.ecolmodel.2003.09.021
123. Zhang, J., Jørgensen, S.E., Tan, C.O., Beklioglu, M., 2003. A structurally dynamic modelling—Lake
Mogan, Turkey as a case study. Ecological Modelling 164, 103–120. doi:10.1016/S0304-3800(03)00051-6
124. Zhang, W., Rao, Y.R., 2012. Application of a eutrophication model for assessing water quality in Lake
Winnipeg. Journal of Great Lakes Research 38, 158–173. doi:10.1016/j.jglr.2011.01.003