Embed Size (px)
Citation preview
United States Department of Agriculture
DE
PAR TMENT OF AGRICULTU
RE
Forest Service
Pacific Northwest Research Station
General Technical Report PNW-GTR-959
August 2017
Economic Sensitivity and Risk Analysis for Small-Scale Wood Pellet Systems—an Example From Southeast AlaskaDavid L. Nicholls
In accordance with Federal civil rights law and U.S. Department of Agriculture (USDA) civil rights regulations and policies, the USDA, its Agencies, offices, and employees, and institutions participating in or administering USDA programs are prohibited from discriminating based on race, color, national origin, religion, sex, gender identity (including gender expression), sexual orientation, disability, age, marital status, family/parental status, income derived from a public assistance program, political beliefs, or reprisal or retaliation for prior civil rights activity, in any program or activity conducted or funded by USDA (not all bases apply to all programs). Remedies and complaint filing deadlines vary by program or incident.
Persons with disabilities who require alternative means of communication for program information (e.g., Braille, large print, audiotape, American Sign Language, etc.) should contact the responsible Agency or USDA’s TARGET Center at (202) 720-2600 (voice and TTY) or contact USDA through the Federal Relay Service at (800) 877-8339. Additionally, program information may be made available in languages other than English.
To file a program discrimination complaint, complete the USDA Program Discrimination Complaint Form, AD-3027, found online at http://www.ascr.usda.gov/complaint_filing_cust.html and at any USDA office or write a letter addressed to USDA and provide in the letter all of the information requested in the form. To request a copy of the complaint form, call (866) 632-9992. Submit your completed form or letter to USDA by: (1) mail: U.S. Department of Agriculture, Office of the Assistant Secretary for Civil Rights, 1400 Independence Avenue, SW, Washington, D.C. 20250-9410; (2) fax: (202) 690-7442; or (3) email: [email protected].
USDA is an equal opportunity provider, employer, and lender.
AuthorDavid L. Nicholls is a forest products technologist, Alaska Wood Utilization Research and Development Center, 901-C Halibut Point Rd., Sitka, AK 99835.
Cover photos: A wood pellet burner (left) and wood pellet storage silo and ware-house at the Tlingit and Haida Regional Housing Authority in Juneau, Alaska. Photos by David Nicholls
AbstractNicholls, David L. 2017. Economic sensitivity and risk analysis for small-scale
wood pellet systems—an example from southeast Alaska. Gen. Tech. Rep. PNW-GTR-959. Portland, OR: U.S. Department of Agriculture, Forest Service, Pacific Northwest Research Station. 19 p.
This research models a wood pellet heating system at the Tlingit-Haida Regional Housing Authority in Juneau, Alaska, used to provide thermal energy to a 929-m2 warehouse, as an alternative to a heating system that burns more costly fossil fuels. Research objectives were to evaluate project economics of the pellet system and to conduct cost:benefit analysis on key variables (initial capital cost, fuel oil cost, and wood pellet cost). Economic results of interest included net present value, payback, internal rate of return, and cost:benefit ratio. Monte Carlo simulations were con-ducted using RETScreen software with the parameters of heating oil cost, wood pellet cost, fuel price escalation, and heating load. Cost:benefit analysis was con-ducted for capital cost versus wood fuel cost and also versus alternative fuel cost. This research found that economic performance was favorable over a wide range of normal operating conditions, even when paying a relatively high price for wood fuel. A pellet production facility in southeast Alaska could lead to lower wood fuel costs and even more favorable regional economics.
Keywords: Wood energy, pellets, Monte Carlo simulation, risk analysis, carbon emissions, net present value, internal rate of return.

Contents 1 Introduction 1 Alaska Context and Research Needs 2 Community-Scale Wood Heating 3 Literature Review 3 Combined Heat and Power 3 Techno-Economic Evaluations 4 Optimization and Risk Analysis for Thermal Bioenergy Systems 5 Modelling Small-Scale Thermal Bioenergy Systems 8 Research Objectives 8 Methods 8 Sensitivity Analysis 10 Monte Carlo Simulations 10 Results 14 Discussion and Conclusions 15 English Equivalents 16 Literature Cited
1
Economic Sensitivity and Risk Analysis for Small-Scale Wood Pellet Systems—an Example From Southeast Alaska
IntroductionAlaska Context and Research NeedsOver the past decade, wood energy use in Alaska has grown dramatically. Con-fronted by high fuel costs, many communities in rural Alaska have committed to a path of renewable energy. Since 2000, there have been more than 25 new wood energy installations in Alaska, in such locations as schools, government buildings, and other facilities. Several of these wood energy systems are pellet systems, the subject of this research. Efforts are underway to develop a pellet infrastructure in southeast Alaska, capable of producing and distributing wood pellets regionally. The Tlingit-Haida Regional Housing Authority (THRHA), based in Juneau, Alaska, is one of several organizations that has recently established wood pellet burners for thermal applications. Their system provides space heating to a 929-m2 warehouse plus domestic hot water. This research models the economic performance of this system under several likely scenarios, filling a need to provide information for small-scale wood pellet thermal systems in Alaska.
Numerous studies have considered wood energy modeling, including the energy and thermodynamic modeling of pellet systems (Carlon et al. 2015, Roy et al. 2013, Verma et al. 2013), agricultural or mixed pellet types (Nunes et al. 2014, Verma et al. 2012), and numerical modeling of pellet boilers (Chaney et al. 2012, Porteiro et al. 2009). Other work (Maraver et al. 2013, Moreton and Rowley 2012, Sartor et al. 2014) has investigated gasification or combined heat and power (CHP) at various scales. Perhaps the most widely researched area for small bioenergy systems has been techno-economic evaluations (Arena et al. 2010, Chau et al. 2009, Huang et al. 2013, Patel et al. 2011, Pirraglia et al. 2010), although optimization of biomass transportation and supply chains have also been evaluated (Mobini et al. 2013).
Previous research has covered many important aspects of bioenergy use. However, current research complements prior work by filling important knowl-edge gaps regarding risk analysis and economic feasibility of small-scale wood energy systems. A second theme of this paper is the use of wood energy in rural, northern climates. Over the past decade, tremendous growth has occurred in wood thermal systems, owing in part to the high cost of heating fuels. Although small in size, rural wood energy systems are collectively important as their adoption becomes more widespread. Thus, there is a strong need for research to document the economic performance of small-scale pellet systems under a range of operating conditions, a primary goal of the current research. This research is expected to have broader implications for rural wood energy systems, not only in Alaska, but in northern regions internationally.
2
GENERAL TECHNICAL REPORT PNW-GTR-959
Community-Scale Wood HeatingThe THRHA, established in 1973 and headquartered in Juneau, Alaska, serves close to 29,000 tribal members throughout southeast Alaska (CCTHITA 2014). Its programs include funding for home ownership, rentals, house repairs, weatheriza-tion service, assistance for elders, and youth programs (THRHA 2014). Through its wood energy systems in southeast Alaska, THRHA is empowering the com-munities it serves to use local resources sustainably, and to create new employment opportunities. Many of these communities have fewer than 1,000 residents and require small decentralized heating systems. Typically, either a single building (such as a school) is heated, or several buildings are connected by hot water piping to a single wood burner. Often, these community-scale systems are owned by a municipality, school, government agency, or Native organization.
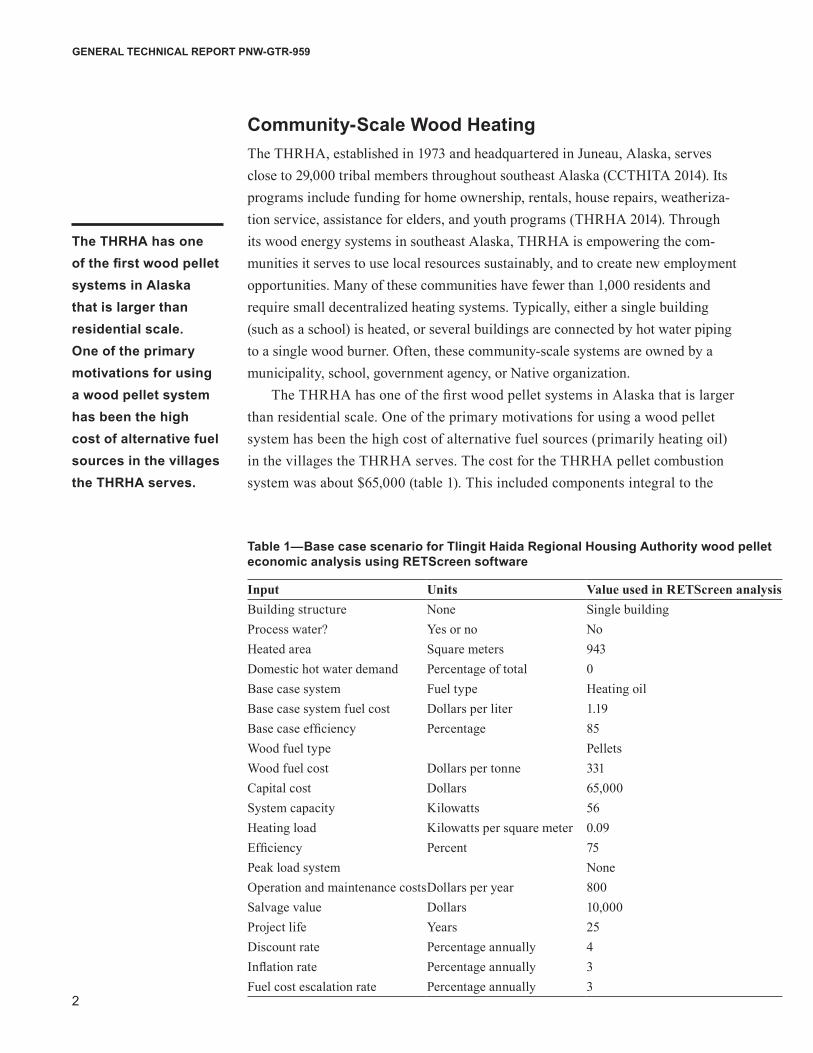
The THRHA has one of the first wood pellet systems in Alaska that is larger than residential scale. One of the primary motivations for using a wood pellet system has been the high cost of alternative fuel sources (primarily heating oil) in the villages the THRHA serves. The cost for the THRHA pellet combustion system was about $65,000 (table 1). This included components integral to the
burner, including combustion chamber, exhaust stack, augers, fans, and a small “day storage” bin for wood pellets. However, when the control system, distribu-tion system, outdoor pellet silo, and other accessories are considered, the total system cost was closer to $215,000. This combined system is typical of the design, scale, and seasonal heating variations of other wood pellet systems used in rural settings.
Economic simulation of biomass energy systems has been an extensive area of research. However, many of these studies have addressed larger scale systems, including municipal and industrial electric power generators, and large district heating loops sometimes serving entire cities. By contrast, relatively little research has been conducted on community-scale thermal systems heated with wood pellets. The current study is motivated by this information gap and will help inform wood energy development in Alaska as well as similar environments, including rural energy projects in northern latitudes internationally.
Literature ReviewCombined Heat and PowerHuang et al. (2013) considered small-scale biomass-fueled CHP applications, which they modeled as Organic Rankine systems and also as biomass gasification systems. System size for all simulations was 150 kilowatts of electrical energy (kWe). They found that breakeven electricity prices for the Organic Rankine systems ranged from £40 to £50 per megawatt-hour (MWh) (about $59 to $74 per MWh); considerably lower than the biomass gasification systems (with electricity prices ranging from £87 and £97 per MWh [$109 to $121 per MWh] ). Maraver et al. (2013) also evaluated small-scale biomass CHP systems. They considered lesser used technologies such as Stirling engines and Organic-Rankine systems.
Techno-Economic EvaluationsMoreton and Rowley (2012) conducted multiparametric techno-economic analyses for biomass energy systems for horticultural glasshouses at scales up to 5 MW. Combined heat and power applications were found to offer significant promise in the United Kingdom, especially when financial support mechanisms such as sales tariffs and capital support were available. Patel et al. (2011) per-formed techno-economic analysis of biomass energy systems at different scales. They evaluated three types of biomass fuels and seven system variables. A key finding of this work was that both forestry residue fuels and rapeseed oil fuels led to conditions where generating efficiency, capital costs, and operating costs were the most significant variables. Of the three biomass fuels evaluated, rape-seed oil had the highest internal rate of return (IRR) (25 percent) followed by
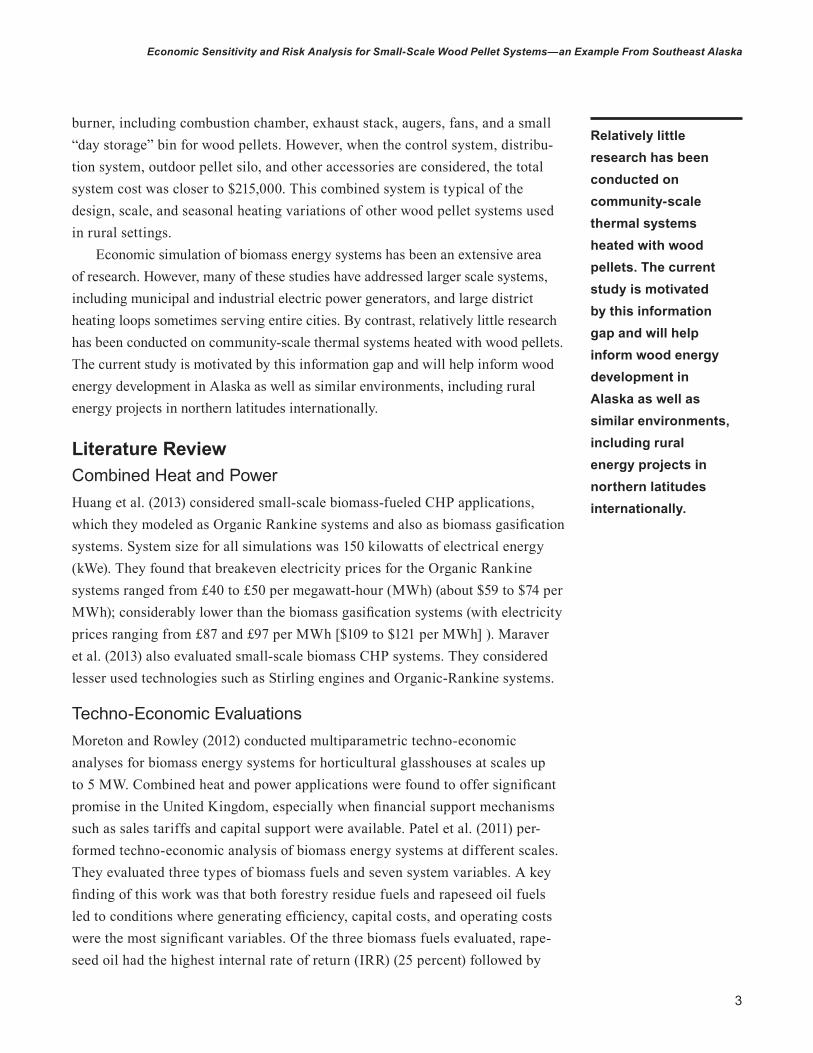
Table 1—Base case scenario for Tlingit Haida Regional Housing Authority wood pellet economic analysis using RETScreen software
Input Units Value used in RETScreen analysisBuilding structure None Single buildingProcess water? Yes or no NoHeated area Square meters 943Domestic hot water demand Percentage of total 0Base case system Fuel type Heating oilBase case system fuel cost Dollars per liter 1.19Base case efficiency Percentage 85Wood fuel type PelletsWood fuel cost Dollars per tonne 331Capital cost Dollars 65,000System capacity Kilowatts 56Heating load Kilowatts per square meter 0.09Efficiency Percent 75Peak load system NoneOperation and maintenance costsDollars per year 800Salvage value Dollars 10,000Project life Years 25Discount rate Percentage annually 4Inflation rate Percentage annually 3Fuel cost escalation rate Percentage annually 3
The THRHA has one of the first wood pellet systems in Alaska that is larger than residential scale. One of the primary motivations for using a wood pellet system has been the high cost of alternative fuel sources in the villages the THRHA serves.
3
Economic Sensitivity and Risk Analysis for Small-Scale Wood Pellet Systems—an Example From Southeast Alaska
burner, including combustion chamber, exhaust stack, augers, fans, and a small “day storage” bin for wood pellets. However, when the control system, distribu-tion system, outdoor pellet silo, and other accessories are considered, the total system cost was closer to $215,000. This combined system is typical of the design, scale, and seasonal heating variations of other wood pellet systems used in rural settings.
Economic simulation of biomass energy systems has been an extensive area of research. However, many of these studies have addressed larger scale systems, including municipal and industrial electric power generators, and large district heating loops sometimes serving entire cities. By contrast, relatively little research has been conducted on community-scale thermal systems heated with wood pellets. The current study is motivated by this information gap and will help inform wood energy development in Alaska as well as similar environments, including rural energy projects in northern latitudes internationally.
Literature ReviewCombined Heat and PowerHuang et al. (2013) considered small-scale biomass-fueled CHP applications, which they modeled as Organic Rankine systems and also as biomass gasification systems. System size for all simulations was 150 kilowatts of electrical energy (kWe). They found that breakeven electricity prices for the Organic Rankine systems ranged from £40 to £50 per megawatt-hour (MWh) (about $59 to $74 per MWh); considerably lower than the biomass gasification systems (with electricity prices ranging from £87 and £97 per MWh [$109 to $121 per MWh] ). Maraver et al. (2013) also evaluated small-scale biomass CHP systems. They considered lesser used technologies such as Stirling engines and Organic-Rankine systems.
Techno-Economic EvaluationsMoreton and Rowley (2012) conducted multiparametric techno-economic analyses for biomass energy systems for horticultural glasshouses at scales up to 5 MW. Combined heat and power applications were found to offer significant promise in the United Kingdom, especially when financial support mechanisms such as sales tariffs and capital support were available. Patel et al. (2011) per-formed techno-economic analysis of biomass energy systems at different scales. They evaluated three types of biomass fuels and seven system variables. A key finding of this work was that both forestry residue fuels and rapeseed oil fuels led to conditions where generating efficiency, capital costs, and operating costs were the most significant variables. Of the three biomass fuels evaluated, rape-seed oil had the highest internal rate of return (IRR) (25 percent) followed by
Table 1—Base case scenario for Tlingit Haida Regional Housing Authority wood pellet economic analysis using RETScreen software
Input Units Value used in RETScreen analysisBuilding structure None Single buildingProcess water? Yes or no NoHeated area Square meters 943Domestic hot water demand Percentage of total 0Base case system Fuel type Heating oilBase case system fuel cost Dollars per liter 1.19Base case efficiency Percentage 85Wood fuel type PelletsWood fuel cost Dollars per tonne 331Capital cost Dollars 65,000System capacity Kilowatts 56Heating load Kilowatts per square meter 0.09Efficiency Percent 75Peak load system NoneOperation and maintenance costsDollars per year 800Salvage value Dollars 10,000Project life Years 25Discount rate Percentage annually 4Inflation rate Percentage annually 3Fuel cost escalation rate Percentage annually 3
Relatively little research has been conducted on community-scale thermal systems heated with wood pellets. The current study is motivated by this information gap and will help inform wood energy development in Alaska as well as similar environments, including rural energy projects in northern latitudes internationally.
4
GENERAL TECHNICAL REPORT PNW-GTR-959
forestry residues (17 percent) and solid recovered fuel (10 percent). Upadhyay et al. (2012) analyzed the economic feasibility of biomass gasification for commu-nity-scale applications in Ontario, Canada. Major variables evaluated included costs of harvesting, biomass delivery and storage, plant construction, operation and maintenance, and labor. Plant size and location were identified as important factors influencing the cost of electricity produced.
Wood and Rowley (2011) considered the techno-economic feasibility of a number of biomass CHP systems for community housing. Six systems were ana-lyzed using actual demand data, along with technical performance and cost data, on the various biomass CHP systems. The best economic performance of these CHP systems occurred for high-load factors when both the electricity and the heat that were sold onsite were maximized.
Arena et al. (2010) considered gasification-based, biomass-to-energy cogenera-tors in the 100- to 600-kWe range. The techno-economic performances of a gas engine and an externally fired gas turbine were evaluated. This study found that the internal combustion engine offered higher reliability and higher IRR across this range of electrical output. Mobini et al. (2013) simulated wood pellet supply chains, from raw materials to consumers, for existing supply chains in British Columbia, Canada. Cost estimates were provided for procurement, distribution, production, and transportation of pellets. Cost reduction opportunities for strategic use of bark in drying and pelletizing were key findings of this research.
Optimization and Risk Analysis for Thermal Bioenergy SystemsIqbal et al. (2014) reviewed 11 optimization algorithms and tools for renewable energy systems; they found increased use for optimizing diverse renewable energy sources, including hydropower, geothermal, biomass, and grid-connected energy. Nonetheless, significant barriers remain for renewable energy project development, including high initial costs, high transaction costs, and performance and technical risks (Arnold and Yildiz 2015). Monte Carlo simulation is an approach to risk man-agement that can give considerable advantages to ordinary net present value (NPV) methods or sensitivity analysis. A Monte Carlo simulation uses random numbers to select samples of input variables, then carries out large numbers of simulations to generate output values. Probability density functions are created from these output values. Frequently, Monte Carlo simulations are used to quantify the probability that a capital investment project will achieve a certain threshold value for financial metrics such as NPV or IRR (Platon and Constantinescu (2014).
5
Economic Sensitivity and Risk Analysis for Small-Scale Wood Pellet Systems—an Example From Southeast Alaska
Mirkhani and Saboohi (2012) applied stochastic energy supply models to dis-tributed power systems, comparing these results to those of a deterministic model. They found that fuel price (in this case natural gas) was an important variable, as was the price volatility and drift in fuel prices. Da Silva Pereira et al. (2014) used the Monte Carlo simulation to model risk analysis of power generation with renew-able energy. Although they modelled small-scale photovoltaic solar systems, they noted that their methods could be easily adapted to systems having larger installed capacity or other types of renewable energy, including hybrid systems.
An important aspect of wood energy system financial performance is ensuring a steady fuel supply, and this could be particularly important in Alaska and similar regions where smaller scales of operation could result in disruptions in supply. Rauch (2010) used stochastic simulations of forest fuel-sourcing models under risk. He found that supply chain risks could be reduced by adopting procurement practices that included wood storage in addition to long- and short-term supply contracts. When these practices were implemented, fuel costs could be reduced by 1 to 3 percent. Goh et al. (2014) evaluated renewable energy project management risks in Malaysia. Using a dynamic modelling approach, they found that the most significant risk factors were government policies, energy demand, geographical location, and fund management. Michelez et al. (2011) evaluated risk quantification and management for renewable energy projects. They relied on a risk mapping technique, evaluating economic, social, technological, and political factors. Here, the probability of occurrence for risk factors was plotted against the expected impact of each. Strauss (2012) conducted a risk analysis for a wood pellet manufacturing project. Four primary risk factors were identified: wood cost, future increases in pellet prices, the initial pellet price, and plant capacity utilization. This analysis assumed that heating oil costs would not only outpace inflation, but also outpace price increase on wood pellets.
Clearly, analysis is an important element of renewable energy project develop-ment, including modeling financial performance. By modelling wood energy systems under a range of possible scenarios, planners will be better prepared for future changes in key conditions such as wood fuel prices and capital costs for new systems.
Modelling Small-Scale Thermal Bioenergy SystemsSmall-scale bioenergy systems have been modelled for many potential applications, ranging from residential use to the community-power scale. The following four themes review the status of current research and the key challenges addressed: com-putational fluid dynamics (CFB) and numerical modelling, CHP, techno-economic evaluations, and combustion models.
6
GENERAL TECHNICAL REPORT PNW-GTR-959
Computational fluid dynamics and numerical modelling—Computational fluid dynamics modelling can be used to great benefit on a wide range of wood energy system sizes, wood fuel types, and technologies. Chaney et al. (2012) used CFD to model small-scale fixed-bed biomass pellet boilers. Adjustable parameters included the ratio of airflow split between the primary and secondary supplies; and the orientation, height, direction, and number of the secondary inlets. Findings of this research will be used to optimize a 50-kW boiler with respect to these parameters. Porteiro et al. (2009) conducted CFD on small-scale commercial pellet boilers. A key finding of their research was that high emission levels can result from the interaction of wood particles in the bed and the poor mixing of the gases in the furnace, often a problem in small-scale systems. Persson et al. (2009) developed mathematical models for wood pellet boilers and stoves, calculating energy balances and carbon monoxide emissions in a laboratory setting. Improved modelling of the dynamic response for boilers was recommended for future work.
Combustion models—Nunes et al. (2014) reviewed various combustion models for biomass pellets. They considered both pellets and briquettes from mixed biomass sources, including transportation and storage issues. Both fixed-bed and fluidized-bed systems were considered. A key finding was that mixed pellet products could gain importance for bioenergy applications in Portugal. Roy et al. (2013) also studied combustion and emission results from small-scale (up to 32 kW capacity) prototype pellet furnaces. They considered four biomass pellets (one grass pellet and three wood pellets), evaluating five combustion gases as well as ash. A key finding of this work was that grass pellets can successfully be combusted while having similar performance and emissions to wood pellets. Verma et al. (2012) conducted test burns of wood pellets under a range of operating conditions. They compared three wood pellet boiler tech-nologies at two different loads. System size ranged from 15 to 32 kW and included top, bottom, and horizontal fuel feeds. They found wide variation in emissions. Carbon emissions varied by a factor of about 17, and nitrogen oxide emissions varied by a factor of 1.7 under different fuel loads. Combustion efficiency also varied but was more sensitive to fuel feed locations. Carlon et al. (2015) simulated residential wood fuel use under steady-state and dynamic conditions. One 6-kW boiler and one 12-kW boiler were modelled. Parameters were modelled by load cycle testing, and included heat transfer rates to water, water temperature profiles inside the boilers, and water temperature profiles at the boiler outlets. This study found better agree-ment with experimental data during stationary operation rather than during dynamic operation. However, for both operational regimes, the fuel consumption was pre-dicted within a 10-percent deviation from the experimental values.
7
Economic Sensitivity and Risk Analysis for Small-Scale Wood Pellet Systems—an Example From Southeast Alaska
Wood energy applications in rural communities—Since 2000, several dozen new commercial-scale wood energy systems have been installed in Alaska at schools, wood products facilities, federal buildings, libraries, senior centers, and other community buildings. This growth has been facilitated in part by numerous feasibility studies evaluating the economic, environmental, and social importance of community-scale wood energy. State grants have also been an integral part of construction funding. Based upon these successes, Alaska is now entering a “second generation” of wood energy progress. It is hoped that the proj-ects that once required subsidies will soon be able to stand on their own economic merits, attracting financing from private sources.
In many ways, Alaska’s wood energy development path has emulated that in other regions of the world, driven largely by rural, community-scale applications. A diverse mix of fuel types has been used—including cordwood, chips, and pellets—with each fuel finding niche applications in the state, often driven by economics and community resources. Other northern locations have experienced similar wood energy growth. In the Northwest Territories of Canada, the city of Yellowknife has made a strong commitment to wood pellet use. Between 2008 and 2010, at least 11 pellet burners were installed, displacing more than 2.1 million L of heating oil (McCloy and Associates 2009).
Other rural locations in the continental United States are worth noting. Two successful school energy programs have been prototypes for Alaska’s wood energy success. The Fuels for Schools program started in Montana and now includes more than 19 wood energy systems in the Western United States (Atkins 2011). Preced-ing this, a similar program in Vermont established numerous school systems. A common success factor for all of these regions has been tailoring energy systems to local wood resources, labor markets, and energy demands. For example, in Vermont, this was often hardwood chips from local sawmills; in Montana, small-diameter hazard fuels; and in Alaska, cordwood resources near rural communities.
In Europe, wood energy development has been fairly advanced for several decades. For example, the city of Gussing, Austria, derives much of its energy from renewable sources (Guevara-Stone 2013). The city’s transition to renewable energy started with an initiative for all public buildings to stop using fossil fuels. Within 15 years, the renewable energy sector employed close to 1,000 people in Gussing, with both heat and power generated from a range of biomass sources, including sawdust, corn, and cooking oil. Not only are all local needs met, but surplus energy is sold to the national grid. Similar progress has been experienced in Sweden, where district heating systems powered by wood have become common, motivated by a carbon tax on fossil fuels. And in the United Kingdom there is a trend toward decentralizing renewable energy projects in favor of greater community ownership (Walker 2008). Factors such as
8
GENERAL TECHNICAL REPORT PNW-GTR-959
pressure to reduce carbon emissions and potentially unreliable sources of energy could be drivers for greater local involvement. Similarly, in Canada, more planning decisions are being made at the community level, and smaller rural communities show greater interest in pursuing multiple sources of renewable energy (St. Denis and Parker 2009).
The path of wood energy development in Alaska closely follows those in other parts of the world. Spurred by demands for low-cost energy alternatives in remote communities, thermal wood energy systems have become an avenue for greater economic stability, increased employment, and higher levels of local control. Often, policy measures have served as a catalyst for wood energy use, whether as a tax (such as Sweden’s fossil fuel tax), subsidy (such as Alaska’s renewable energy fund), or local initiative (such as Gussing’s public building ordinance). In many ways, renewable energy development in remote rural communities, where economic and operating conditions can be challenging, can serve as examples for broader imple-mentation elsewhere. In this way, rural energy use can serve as “proving grounds” for other locations. The wood pellet system evaluated in this report follows this model and could become a blueprint for greater regional use of wood energy, particularly among Alaska Native organizations.
Research ObjectivesThe primary objective of this research is to model the operating and economic condi-tions of a small, industrial-scale wood pellet burner in Juneau, Alaska. This research uses risk analysis to simulate several possible scenarios and evaluate economic indicators of interest (including NPV, IRR, and project payback period) that could benefit this facility as well as other possible facilities planned by the parent organiza-tion. A secondary objective is to provide context for the broader use of wood pellets for thermal applications in southeast Alaska and other high-latitude locations.
MethodsSensitivity AnalysisThis research evaluated the project economics for the THRHA wood pellet system that was established in 2014. All comparisons were made versus a base case of heating oil. Economic performance was evaluated initially for base case condi-tions, heating with wood pellets under a “business as usual” scenario (table 1). The NPV, IRR, payback period, and cost:benefit ratio were modelled for each scenario. The NPV is defined as the sum of initial investment (a negative value) and the present value of all future cashflows (a positive value) at a particular discount rate. For typical wood energy systems, the cashflow includes the initial investment, annual operating costs, annual debt payment (assuming some financing), inflation,
The path of wood energy development in Alaska closely follows those in other parts of the world. Spurred by demands for low-cost energy alternatives in remote communities, thermal wood energy systems have become an avenue for greater economic stability, increased employment, and higher levels of local control.
9
Economic Sensitivity and Risk Analysis for Small-Scale Wood Pellet Systems—an Example From Southeast Alaska
depreciable capital cost, and taxes. However, for the THRHA system, no debt payment is included because financing was not involved.
The RETScreen program was used for all financial analyses, including the inputs specified in table 1. RETScreen is a Microsoft Excel®1 add-in used interna-tionally to model several types of renewable energy technologies, including biomass energy (NRC ES 2015). A standard RETScreen project consists of a five-step analysis: energy model, cost analysis, greenhouse gas-emissions analysis, financial summary, and risk and sensitivity analysis. The RETScreen program can be used to evaluate the energy production, life cycle costs, and greenhouse gas emissions reduction for different biomass energy projects. It can be used for central grid connected systems, isolated grid, or stand-alone electrical generation projects, as well as thermal systems (the focus of the current study). Climatic data for modelling thermal loads were provided through RETScreen’s worldwide database of ground-based weather stations (using data for Juneau, Alaska).
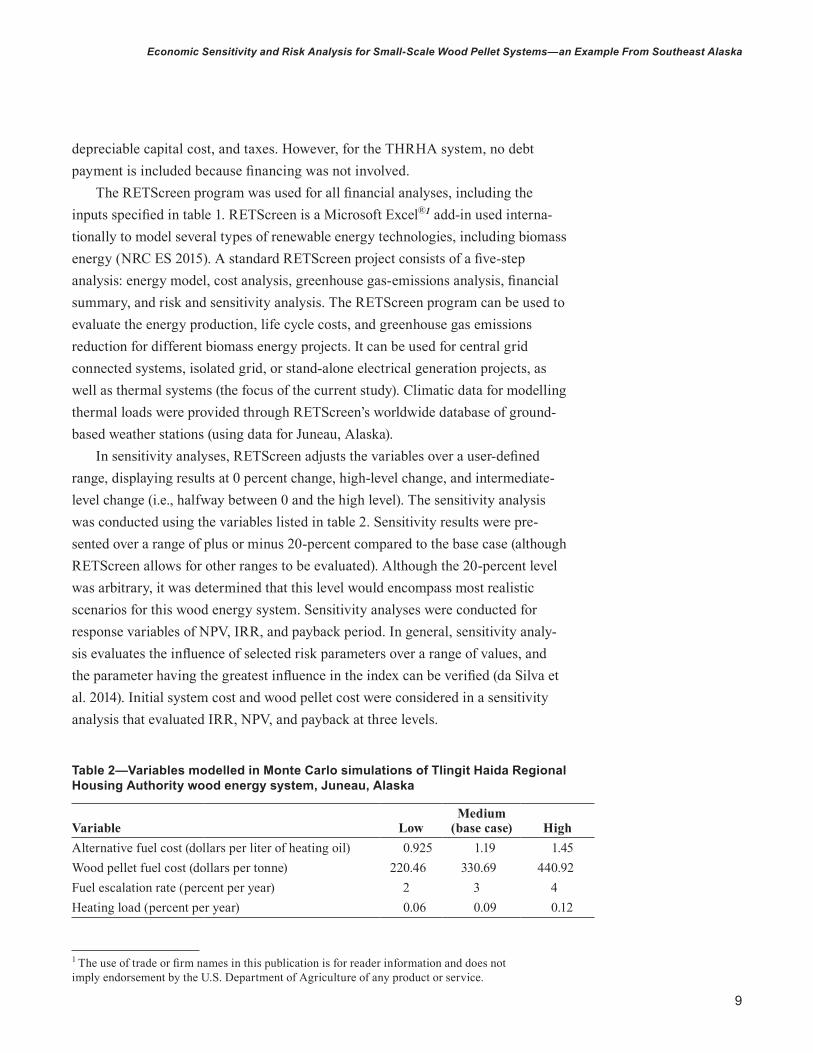
In sensitivity analyses, RETScreen adjusts the variables over a user-defined range, displaying results at 0 percent change, high-level change, and intermediate-level change (i.e., halfway between 0 and the high level). The sensitivity analysis was conducted using the variables listed in table 2. Sensitivity results were pre-sented over a range of plus or minus 20-percent compared to the base case (although RETScreen allows for other ranges to be evaluated). Although the 20-percent level was arbitrary, it was determined that this level would encompass most realistic scenarios for this wood energy system. Sensitivity analyses were conducted for response variables of NPV, IRR, and payback period. In general, sensitivity analy-sis evaluates the influence of selected risk parameters over a range of values, and the parameter having the greatest influence in the index can be verified (da Silva et al. 2014). Initial system cost and wood pellet cost were considered in a sensitivity analysis that evaluated IRR, NPV, and payback at three levels.
1 The use of trade or firm names in this publication is for reader information and does not imply endorsement by the U.S. Department of Agriculture of any product or service.
Table 2—Variables modelled in Monte Carlo simulations of Tlingit Haida Regional Housing Authority wood energy system, Juneau, Alaska
Variable LowMedium
(base case) HighAlternative fuel cost (dollars per liter of heating oil) 0.925 1.19 1.45Wood pellet fuel cost (dollars per tonne) 220.46 330.69 440.92Fuel escalation rate (percent per year) 2 3 4Heating load (percent per year) 0.06 0.09 0.12
10
GENERAL TECHNICAL REPORT PNW-GTR-959
Monte Carlo SimulationsMonte Carlo simulations were conducted to account for uncertainty in future operating conditions. Simulations were created for NPV, IRR, payback period, and cost:benefit ratio based on financial indicator values generated from randomly selected sets of input parameters, within a predetermined user-defined range. In the RETScreen simulations, the input parameters related to the base case operating parameters that were modelled for a single financial result. The simulation itself consisted of (1) generating 500 random values for each input parameter, using a normal distribution; and (2) multiplying each random value by a user-specified variability. Both the number of simulations and the distribution of input values were fixed by the RETScreen software, although it is recognized that a more robust analysis would allow for different levels of these parameters.
Because the set of random numbers was fixed, exactly the same results were obtained whenever the same input parameters were specified. In the current study, a level of risk of 5 percent was specified. Thus the minimum level of confidence was the 2.5 percentile of the 500 values generated by the Monte Carlo simulation (i.e., the 13th ranked value). The maximum level corresponded to the 487th ranked value for each simulation of 500 values. For the THARHA wood pellet simulations, parameters were varied between a “high” level and a “low” level (table 2). These included alternative fuel cost (heating oil), wood pellet cost, fuel cost escalation, and heating load. It was determined that these levels of parameters would accu-rately reflect conditions encountered under normal operating conditions.
For each simulation, all parameters were held constant except for the variable of interest, which was varied to either the high or low level. Median and 95-percent confidence intervals were calculated for each simulation. This process was repeated for NPV, IRR, and payback period. Initial system cost was also modelled versus alternative fuel cost over this same range. Financial metrics, including NPV, IRR, and simple payback, were reported for each pair of values.
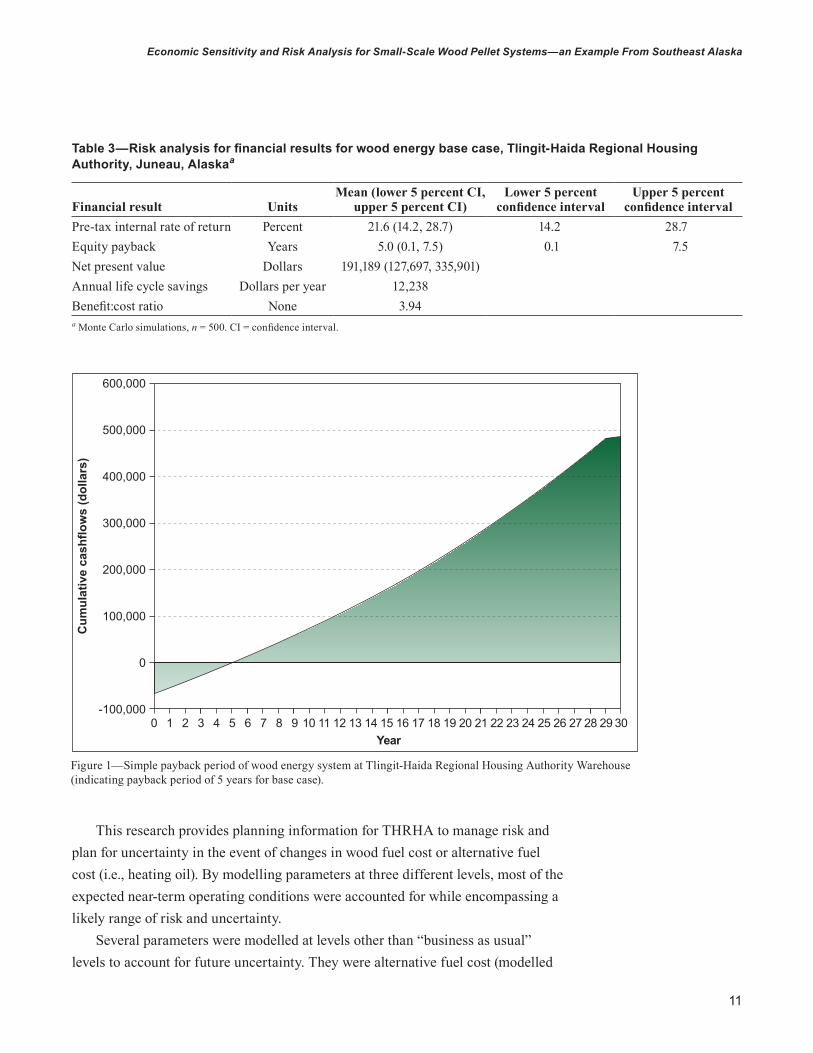
ResultsThe THRHA’s flagship wood pellet energy system in Juneau, Alaska, is already providing tangible benefits after just its first year in operation. The base case results (i.e., actual operating conditions over the past year) indicate a strong economic return, with median IRR of 21.6 percent, median equity payback period of 5.0 years, and median NPV of $191,189 (table 3) (fig. 1). However, future changes in market conditions, such as varying market costs of wood pellets or heating oil, could further influence project economics. Indeed, over the past year (2016), heating oil prices dropped to levels below those used in this research.
Table 3—Risk analysis for financial results for wood energy base case, Tlingit-Haida Regional Housing Authority, Juneau, Alaskaa
Financial result UnitsMean (lower 5 percent CI,
upper 5 percent CI)Lower 5 percent
confidence intervalUpper 5 percent
confidence intervalPre-tax internal rate of return Percent 21.6 (14.2, 28.7) 14.2 28.7Equity payback Years 5.0 (0.1, 7.5) 0.1 7.5Net present value Dollars 191,189 (127,697, 335,901)Annual life cycle savings Dollars per year 12,238Benefit:cost ratio None 3.94a Monte Carlo simulations, n = 500. CI = confidence interval.
600,000
500,000
400,000
300,000
200,000
100,000
0
-100,000
Cum
ulat
ive
cash
flow
s (d
olla
rs)
0 1 2 3 4 5 6 7 8 9 10 11 12 13 14 15 16 17 18 19 20 21 22 23 24 25 26 27 28 29 30Year
The THRHA’s flagship wood pellet energy system in Juneau, Alaska, is already providing tangible benefits after just its first year in operation.
11
Economic Sensitivity and Risk Analysis for Small-Scale Wood Pellet Systems—an Example From Southeast Alaska
Monte Carlo SimulationsMonte Carlo simulations were conducted to account for uncertainty in future operating conditions. Simulations were created for NPV, IRR, payback period, and cost:benefit ratio based on financial indicator values generated from randomly selected sets of input parameters, within a predetermined user-defined range. In the RETScreen simulations, the input parameters related to the base case operating parameters that were modelled for a single financial result. The simulation itself consisted of (1) generating 500 random values for each input parameter, using a normal distribution; and (2) multiplying each random value by a user-specified variability. Both the number of simulations and the distribution of input values were fixed by the RETScreen software, although it is recognized that a more robust analysis would allow for different levels of these parameters.
Because the set of random numbers was fixed, exactly the same results were obtained whenever the same input parameters were specified. In the current study, a level of risk of 5 percent was specified. Thus the minimum level of confidence was the 2.5 percentile of the 500 values generated by the Monte Carlo simulation (i.e., the 13th ranked value). The maximum level corresponded to the 487th ranked value for each simulation of 500 values. For the THARHA wood pellet simulations, parameters were varied between a “high” level and a “low” level (table 2). These included alternative fuel cost (heating oil), wood pellet cost, fuel cost escalation, and heating load. It was determined that these levels of parameters would accu-rately reflect conditions encountered under normal operating conditions.
For each simulation, all parameters were held constant except for the variable of interest, which was varied to either the high or low level. Median and 95-percent confidence intervals were calculated for each simulation. This process was repeated for NPV, IRR, and payback period. Initial system cost was also modelled versus alternative fuel cost over this same range. Financial metrics, including NPV, IRR, and simple payback, were reported for each pair of values.
ResultsThe THRHA’s flagship wood pellet energy system in Juneau, Alaska, is already providing tangible benefits after just its first year in operation. The base case results (i.e., actual operating conditions over the past year) indicate a strong economic return, with median IRR of 21.6 percent, median equity payback period of 5.0 years, and median NPV of $191,189 (table 3) (fig. 1). However, future changes in market conditions, such as varying market costs of wood pellets or heating oil, could further influence project economics. Indeed, over the past year (2016), heating oil prices dropped to levels below those used in this research.
Table 3—Risk analysis for financial results for wood energy base case, Tlingit-Haida Regional Housing Authority, Juneau, Alaskaa
Financial result UnitsMean (lower 5 percent CI,
upper 5 percent CI)Lower 5 percent
confidence intervalUpper 5 percent
confidence intervalPre-tax internal rate of return Percent 21.6 (14.2, 28.7) 14.2 28.7Equity payback Years 5.0 (0.1, 7.5) 0.1 7.5Net present value Dollars 191,189 (127,697, 335,901)Annual life cycle savings Dollars per year 12,238Benefit:cost ratio None 3.94a Monte Carlo simulations, n = 500. CI = confidence interval.
600,000
500,000
400,000
300,000
200,000
100,000
0
-100,000
Cum
ulat
ive
cash
flow
s (d
olla
rs)
0 1 2 3 4 5 6 7 8 9 10 11 12 13 14 15 16 17 18 19 20 21 22 23 24 25 26 27 28 29 30Year
This research provides planning information for THRHA to manage risk and plan for uncertainty in the event of changes in wood fuel cost or alternative fuel cost (i.e., heating oil). By modelling parameters at three different levels, most of the expected near-term operating conditions were accounted for while encompassing a likely range of risk and uncertainty.
Several parameters were modelled at levels other than “business as usual” levels to account for future uncertainty. They were alternative fuel cost (modelled
Figure 1—Simple payback period of wood energy system at Tlingit-Haida Regional Housing Authority Warehouse (indicating payback period of 5 years for base case).
12
GENERAL TECHNICAL REPORT PNW-GTR-959
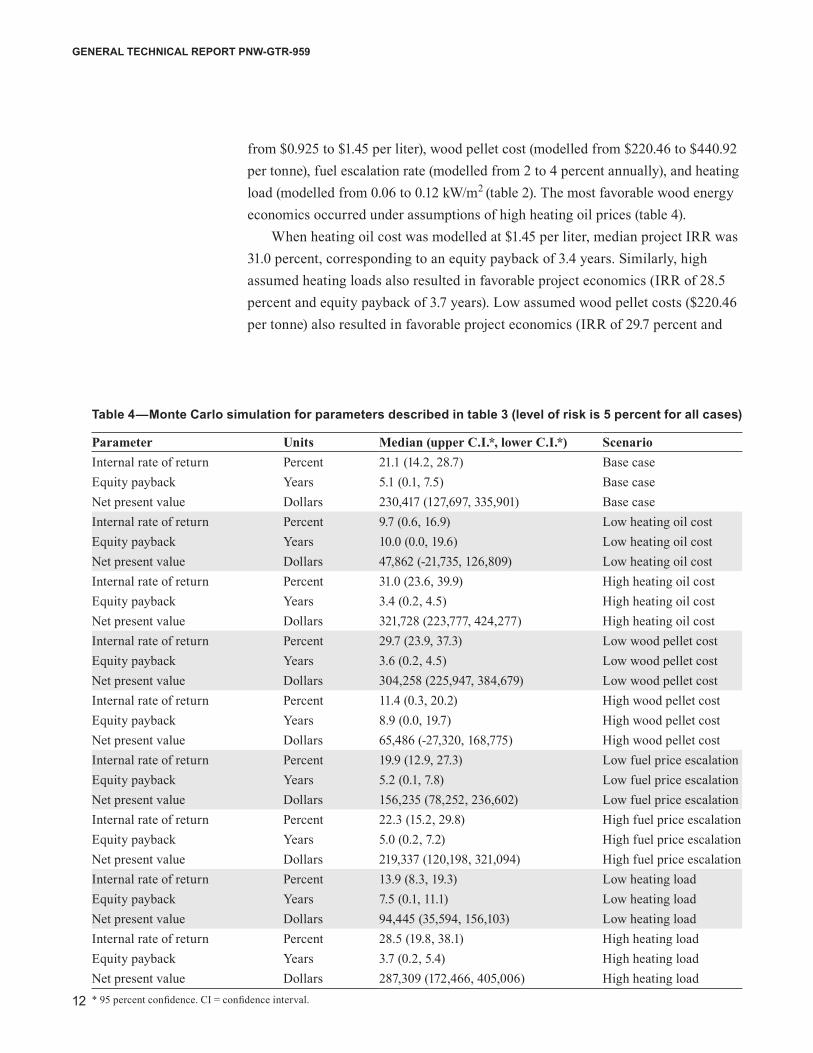
from $0.925 to $1.45 per liter), wood pellet cost (modelled from $220.46 to $440.92 per tonne), fuel escalation rate (modelled from 2 to 4 percent annually), and heating load (modelled from 0.06 to 0.12 kW/m2 (table 2). The most favorable wood energy economics occurred under assumptions of high heating oil prices (table 4).
When heating oil cost was modelled at $1.45 per liter, median project IRR was 31.0 percent, corresponding to an equity payback of 3.4 years. Similarly, high assumed heating loads also resulted in favorable project economics (IRR of 28.5 percent and equity payback of 3.7 years). Low assumed wood pellet costs ($220.46 per tonne) also resulted in favorable project economics (IRR of 29.7 percent and
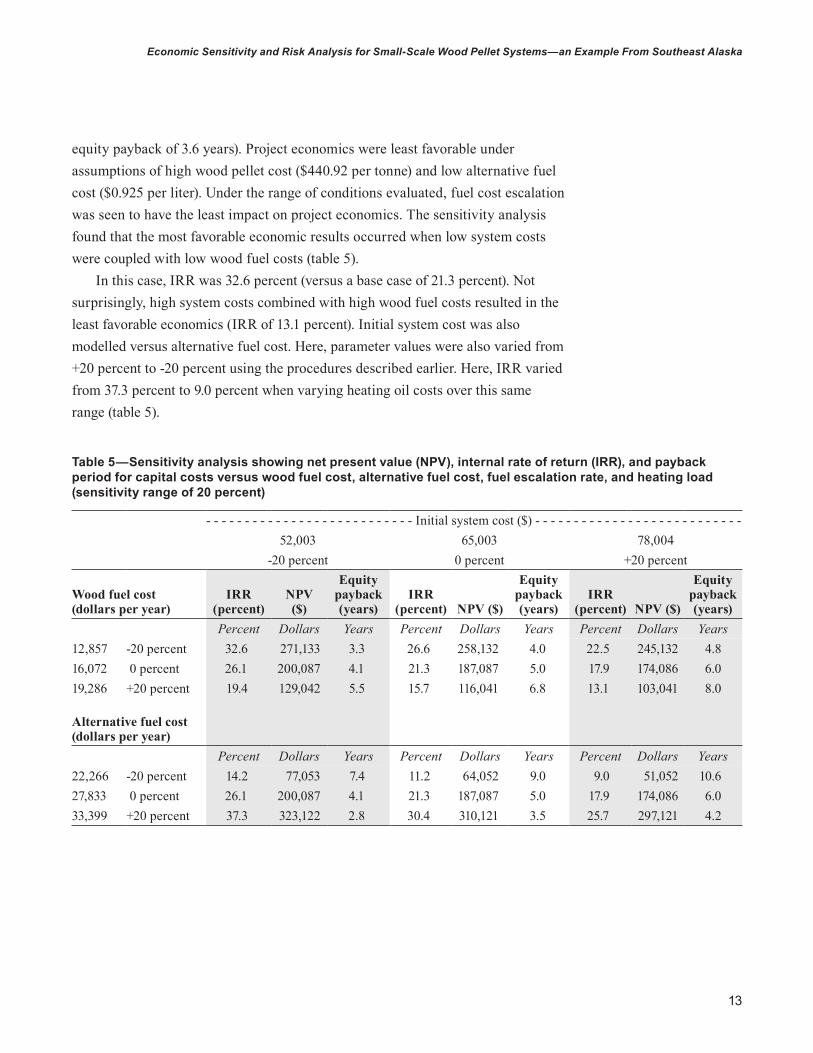
equity payback of 3.6 years). Project economics were least favorable under assumptions of high wood pellet cost ($440.92 per tonne) and low alternative fuel cost ($0.925 per liter). Under the range of conditions evaluated, fuel cost escalation was seen to have the least impact on project economics. The sensitivity analysis found that the most favorable economic results occurred when low system costs were coupled with low wood fuel costs (table 5).
In this case, IRR was 32.6 percent (versus a base case of 21.3 percent). Not surprisingly, high system costs combined with high wood fuel costs resulted in the least favorable economics (IRR of 13.1 percent). Initial system cost was also modelled versus alternative fuel cost. Here, parameter values were also varied from +20 percent to -20 percent using the procedures described earlier. Here, IRR varied from 37.3 percent to 9.0 percent when varying heating oil costs over this same range (table 5). Table 4—Monte Carlo simulation for parameters described in table 3 (level of risk is 5 percent for all cases)
Parameter Units Median (upper C.I.*, lower C.I.*) ScenarioInternal rate of return Percent 21.1 (14.2, 28.7) Base caseEquity payback Years 5.1 (0.1, 7.5) Base caseNet present value Dollars 230,417 (127,697, 335,901) Base caseInternal rate of return Percent 9.7 (0.6, 16.9) Low heating oil cost Equity payback Years 10.0 (0.0, 19.6) Low heating oil costNet present value Dollars 47,862 (-21,735, 126,809) Low heating oil costInternal rate of return Percent 31.0 (23.6, 39.9) High heating oil costEquity payback Years 3.4 (0.2, 4.5) High heating oil costNet present value Dollars 321,728 (223,777, 424,277) High heating oil costInternal rate of return Percent 29.7 (23.9, 37.3) Low wood pellet cost Equity payback Years 3.6 (0.2, 4.5) Low wood pellet costNet present value Dollars 304,258 (225,947, 384,679) Low wood pellet costInternal rate of return Percent 11.4 (0.3, 20.2) High wood pellet cost Equity payback Years 8.9 (0.0, 19.7) High wood pellet costNet present value Dollars 65,486 (-27,320, 168,775) High wood pellet costInternal rate of return Percent 19.9 (12.9, 27.3) Low fuel price escalation Equity payback Years 5.2 (0.1, 7.8) Low fuel price escalationNet present value Dollars 156,235 (78,252, 236,602) Low fuel price escalationInternal rate of return Percent 22.3 (15.2, 29.8) High fuel price escalationEquity payback Years 5.0 (0.2, 7.2) High fuel price escalationNet present value Dollars 219,337 (120,198, 321,094) High fuel price escalationInternal rate of return Percent 13.9 (8.3, 19.3) Low heating load Equity payback Years 7.5 (0.1, 11.1) Low heating loadNet present value Dollars 94,445 (35,594, 156,103) Low heating loadInternal rate of return Percent 28.5 (19.8, 38.1) High heating load Equity payback Years 3.7 (0.2, 5.4) High heating loadNet present value Dollars 287,309 (172,466, 405,006) High heating load* 95 percent confidence. CI = confidence interval.
Table 5—Sensitivity analysis showing net present value (NPV), internal rate of return (IRR), and payback period for capital costs versus wood fuel cost, alternative fuel cost, fuel escalation rate, and heating load (sensitivity range of 20 percent)
- - - - - - - - - - - - - - - - - - - - - - - - - - - Initial system cost ($) - - - - - - - - - - - - - - - - - - - - - - - - - - - 52,003 65,003 78,004
-20 percent 0 percent +20 percent
Wood fuel cost (dollars per year)
IRR (percent)
NPV ($)
Equity payback (years)
IRR (percent) NPV ($)
Equity payback (years)
IRR (percent) NPV ($)
Equity payback (years)
Percent Dollars Years Percent Dollars Years Percent Dollars Years12,857 -20 percent 32.6 271,133 3.3 26.6 258,132 4.0 22.5 245,132 4.816,072 0 percent 26.1 200,087 4.1 21.3 187,087 5.0 17.9 174,086 6.019,286 +20 percent 19.4 129,042 5.5 15.7 116,041 6.8 13.1 103,041 8.0
Alternative fuel cost (dollars per year)
Percent Dollars Years Percent Dollars Years Percent Dollars Years22,266 -20 percent 14.2 77,053 7.4 11.2 64,052 9.0 9.0 51,052 10.627,833 0 percent 26.1 200,087 4.1 21.3 187,087 5.0 17.9 174,086 6.033,399 +20 percent 37.3 323,122 2.8 30.4 310,121 3.5 25.7 297,121 4.2
13
Economic Sensitivity and Risk Analysis for Small-Scale Wood Pellet Systems—an Example From Southeast Alaska
equity payback of 3.6 years). Project economics were least favorable under assumptions of high wood pellet cost ($440.92 per tonne) and low alternative fuel cost ($0.925 per liter). Under the range of conditions evaluated, fuel cost escalation was seen to have the least impact on project economics. The sensitivity analysis found that the most favorable economic results occurred when low system costs were coupled with low wood fuel costs (table 5).
In this case, IRR was 32.6 percent (versus a base case of 21.3 percent). Not surprisingly, high system costs combined with high wood fuel costs resulted in the least favorable economics (IRR of 13.1 percent). Initial system cost was also modelled versus alternative fuel cost. Here, parameter values were also varied from +20 percent to -20 percent using the procedures described earlier. Here, IRR varied from 37.3 percent to 9.0 percent when varying heating oil costs over this same range (table 5). Table 4—Monte Carlo simulation for parameters described in table 3 (level of risk is 5 percent for all cases)
Parameter Units Median (upper C.I.*, lower C.I.*) ScenarioInternal rate of return Percent 21.1 (14.2, 28.7) Base caseEquity payback Years 5.1 (0.1, 7.5) Base caseNet present value Dollars 230,417 (127,697, 335,901) Base caseInternal rate of return Percent 9.7 (0.6, 16.9) Low heating oil cost Equity payback Years 10.0 (0.0, 19.6) Low heating oil costNet present value Dollars 47,862 (-21,735, 126,809) Low heating oil costInternal rate of return Percent 31.0 (23.6, 39.9) High heating oil costEquity payback Years 3.4 (0.2, 4.5) High heating oil costNet present value Dollars 321,728 (223,777, 424,277) High heating oil costInternal rate of return Percent 29.7 (23.9, 37.3) Low wood pellet cost Equity payback Years 3.6 (0.2, 4.5) Low wood pellet costNet present value Dollars 304,258 (225,947, 384,679) Low wood pellet costInternal rate of return Percent 11.4 (0.3, 20.2) High wood pellet cost Equity payback Years 8.9 (0.0, 19.7) High wood pellet costNet present value Dollars 65,486 (-27,320, 168,775) High wood pellet costInternal rate of return Percent 19.9 (12.9, 27.3) Low fuel price escalation Equity payback Years 5.2 (0.1, 7.8) Low fuel price escalationNet present value Dollars 156,235 (78,252, 236,602) Low fuel price escalationInternal rate of return Percent 22.3 (15.2, 29.8) High fuel price escalationEquity payback Years 5.0 (0.2, 7.2) High fuel price escalationNet present value Dollars 219,337 (120,198, 321,094) High fuel price escalationInternal rate of return Percent 13.9 (8.3, 19.3) Low heating load Equity payback Years 7.5 (0.1, 11.1) Low heating loadNet present value Dollars 94,445 (35,594, 156,103) Low heating loadInternal rate of return Percent 28.5 (19.8, 38.1) High heating load Equity payback Years 3.7 (0.2, 5.4) High heating loadNet present value Dollars 287,309 (172,466, 405,006) High heating load* 95 percent confidence. CI = confidence interval.
Table 5—Sensitivity analysis showing net present value (NPV), internal rate of return (IRR), and payback period for capital costs versus wood fuel cost, alternative fuel cost, fuel escalation rate, and heating load (sensitivity range of 20 percent)
- - - - - - - - - - - - - - - - - - - - - - - - - - - Initial system cost ($) - - - - - - - - - - - - - - - - - - - - - - - - - - - 52,003 65,003 78,004
-20 percent 0 percent +20 percent
Wood fuel cost (dollars per year)
IRR (percent)
NPV ($)
Equity payback (years)
IRR (percent) NPV ($)
Equity payback (years)
IRR (percent) NPV ($)
Equity payback (years)
Percent Dollars Years Percent Dollars Years Percent Dollars Years12,857 -20 percent 32.6 271,133 3.3 26.6 258,132 4.0 22.5 245,132 4.816,072 0 percent 26.1 200,087 4.1 21.3 187,087 5.0 17.9 174,086 6.019,286 +20 percent 19.4 129,042 5.5 15.7 116,041 6.8 13.1 103,041 8.0
Alternative fuel cost (dollars per year)
Percent Dollars Years Percent Dollars Years Percent Dollars Years22,266 -20 percent 14.2 77,053 7.4 11.2 64,052 9.0 9.0 51,052 10.627,833 0 percent 26.1 200,087 4.1 21.3 187,087 5.0 17.9 174,086 6.033,399 +20 percent 37.3 323,122 2.8 30.4 310,121 3.5 25.7 297,121 4.2
14
GENERAL TECHNICAL REPORT PNW-GTR-959
Discussion and ConclusionsWood pellet heating has been considered for heating a 929-m2 warehouse in Juneau, Alaska. This system provides a good example of small-scale thermal applications in temperate climates and is part of an effort to establish wood pellet infrastructure in remote areas. The successful operation of this system could catalyze develop-ment of similar systems owned by the THRHA in southeast Alaska. As with many remote communities, a lack of infrastructure, including limited road access, means that wood pellets must be transported long distances (in this case, approximately 1290 km by water) to reach local markets. However, a strategic goal for wood energy development here could be to establish a wood pellet plant in southeast Alaska, supplying wood fuel from local resources. Doing so would reduce transpor-tation distances and associated costs, considerably.
Despite these barriers, this research has demonstrated favorable project economics when wood pellet use was simulated under a wide range of expected operating conditions. Project economics were generally strong for IRR, NPV, payback, and cost:benefit ratio. However, if commercial wood pellet production were to become established locally in southeast Alaska, and pellets were to become less expensive, project economics would become even more favorable. A limitation of this research was that the Monte Carlo simulation was limited to 500 trials, and specific distributions could not be indicated (other than the normal distribution). However, both of these were due to limitations of the software program being used (RETScreen), and it is believed that the parameters and economic results obtained in this study are realistic for many similarly scaled wood pellet thermal systems.
This research underscores the importance of local energy production, local resource use, and new employment as a strategic goal for rural communities in Alaska. This is particularly important for Alaska Native organizations, many of which rely on local resources for subsistence purposes, including energy generation. As of early 2017, the THRHA has wood energy projects either completed or under development in three other communities in southeast Alaska.
This research has demonstrated favorable project economics when wood pellet use was simulated under a wide range of expected operating conditions. Project economics were generally strong for IRR, NPV, payback, and cost:benefit ratio.
15
Economic Sensitivity and Risk Analysis for Small-Scale Wood Pellet Systems—an Example From Southeast Alaska
This research found several items of practical significance for communi-ties pursuing wood energy projects similar to the one studied here. Economic performance was favorable over the range of normal operating conditions, even when paying a relatively high price for wood fuel. However, when wood fuel cost increased by even 33 percent (i.e., to $440.92 per tonne versus the base case of $330.69 per tonne), project IRR dropped considerably. Thus, wood pellet users in southeast Alaska will need to pursue options to reduce delivered fuel costs, chief among them could be the establishment of local pellet production facilities. Initial capital costs and fuel costs were also found to influence project economics over a wide range. This is important because in many cases, wood energy systems are installed as part of more extensive, yet related, construction projects. Thus, accurately accounting for the initial wood energy capital cost will be integral to a rigorous economic analysis.
Establishing a local wood pellet production facility in southeast Alaska, and the potential for lower cost wood fuel, should bode well for the project economics of this wood energy system and others. These results and findings could be relevant to pellet systems being installed in other locations in southeast Alaska, such as Haines. Similar wood pellet systems may soon be operating in many other regions in Alaska and elsewhere, where project feasibility and design studies are being conducted. This research should help inform these efforts, especially in rural com-munities that are just starting to embark on wood energy projects.
English EquivalentsWhen you know: Multiply by: To get:Kilometers (km) 0.621 MilesSquare meters (m2) 10.76 Square feetLiters (L) 0.265 GallonsTonnes 1.102 Tons
Thus, wood pellet users in southeast Alaska will need to pursue options to reduce delivered fuel costs, chief among them could be the establishment of local pellet production facilities.
16
GENERAL TECHNICAL REPORT PNW-GTR-959
Literature CitedArena, U.; Di Gregorio, F.; Santonastasi, M. 2010. A techno-economic
comparison between two design configurations for a small-scale, biomass-to-energy gasification based system. Chemical Engineering Journal. 162: 580–590.
Arnold, U.; Yildiz, O. 2015. Economic risk analysis of decentralized renewable energy infrastructures—Monte Carlo Simulation approach. Renewable Energy. 77: 227–239.
Atkins, D. 2011. Fuels for schools and beyond small-scale woody biomass lessons learned. http://www.akenergyauthority.org/Content/Programs/AEEE/Biomass/Documents/PDF/AWEC_Agenda_Linkstopresentations.pdf. (20 April 2017).
Carlon, E.; Verma, V.K.; Schwarz, M.; Golicza, L.; Prada, A.; Baratieri, M.; Haslinger, W.; Schmidl, C. 2015. Experimental validation of a thermodynamic boiler model under steady state and dynamic conditions. Applied Energy. 138: 505–516.
Central Council of the Tlingit and Haida Indian Tribes of Alaska [CCTHITA]. 2014. http://www.ccthita.org/. (20 April 2017).
Chaney, J.; Liu, H.; Li, J. 2012. An overview of CFD modelling of small-scale fixed-bed biomass pellet boilers with preliminary results from a simplified approach. Energy Conversion and Management. 63: 149–156.
Chau, J.; Sowlati, T.; Sokhansanj, S.; Preto, F.; Melin, S.; Bi, X. 2009. Techno-economic analysis of wood biomass boilers for the greenhouse industry. Applied Energy. 86: 364–371.
Da Silva Pereira, E.J.; Pinho, J.T.; Galhardo, M.A.B.; Macêdo, W.N. 2014. Methodology of risk analysis by Monte Carlo Method applied to power generation with renewable energy. Renewable Energy. 69: 347–355.
Guevara-Stone, L. 2013. Güssing, Austria powered entirely by renewable energy. https://cleantechnica.com/2013/10/16/renewable-energy-powered-austrian-town-gussing/. (20 April 2017).
Goh, H.H.; Lee, S.W.; Chua, Q.S.; Goh, K.C.; Kok, B.C.; Teo, K.T.K. 2014. Renewable energy project: project management, challenges and risk. Renewable and Sustainable Energy Reviews. 38: 917–932.
17
Economic Sensitivity and Risk Analysis for Small-Scale Wood Pellet Systems—an Example From Southeast Alaska
Huang, Y.; McIlveen-Wright, D.; Rezvani, S.; Huang, M.J.; Wang, Y.D.; Roskilly, A.P.; Hewitt, N.J. 2013. Comparative techno-economic analysis of biomass fuelled combined heat and power for commercial buildings. Applied Energy. 112: 518–525.
Iqbal, M.; Azam, M.; Naeem, M.; Khwaja, A.S.; Anpalagan, A. 2014. Optimization classification, algorithms and tools for renewable energy: a review. Renewable and Sustainable Energy Reviews. 39: 640–654.
Maraver, D.; Sin, A.; Royo, J.; Sebastián, F. 2013. Assessment of CCHP systems based on biomass combustion for small-scale applications through a review of the technology and analysis of energy efficiency parameters. Applied Energy. 102: 1303–1313.
McCloy and Associates. 2009. NWT wood pellet pre-feasibility analysis. FPInnovations—Forintek Division. 25 p. http://www.grrb.nt.ca/pdf/forestry/NWT%20Wood%20Pellet%20Public%20Report%20Jan%2014%202010.pdf. (20 April 2017).
Michelez, J.; Rossi, N.; Blazquez, R.; Martin, J.M.; Mera, E.; Christensen, D.; Peineke, C.; Graf, K.; Lyon, D.; Stevens, G. 2011. Risk quantification and risk management in renewable energy projects. IEA report-Renewable Energy Technology Deployment. 150 p. http://iea-retd.org/wp-content/uploads/2011/11/RISK-IEA-RETD-2011-6.pdf. (6 January 2017).
Mirkhani, S.; Saboohi, Y. 2012. Stochastic modeling of the energy supply system with uncertain fuel price—a case of emerging technologies for distributed power generation. Applied Energy. 93: 668–674.
Mobini, M.; Sowlati, T.; Sokhansanj, S. 2013. A simulation model for the design and analysis of wood pellet supply chains. Applied Energy. 111: 1239–1249.
Moreton, O.R.; Rowley, P.N. 2012. The feasibility of biomass CHP as an energy and CO2 source for commercial glasshouses. Applied Energy. 96: 339–346.
Nunes, L.J.R.; Matias, J.C.O.; Catalao, J.P.S. 2014. Mixed biomass pellets for thermal energy production: a review of combustion models. Applied Energy. 127: 135–140.
Patel, C.; Lettieri, P.; Simons, S.J.R.; Germanà, A. 2011. Techno-economic performance analysis of energy production from biomass at different scales in the UK context. Chemical Engineering Journal. 171: 986–996.
18
GENERAL TECHNICAL REPORT PNW-GTR-959
Persson, T.; Fiedler, F.; Nordlander, S.; Bales, C.; Paavilanen, J. 2009. Validation of a dynamic model for wood pellet boilers and stoves. Applied Energy. 86(5): 645–656.
Pirraglia, A.; Gonzalez, R.; Saloni, D. 2010. Techno-economical analysis of wood pellets production for US manufacturers. BioResources. 5(4): 2374–2390.
Platon, V.; Constantinescu, A. 2014. Monte Carlo method in risk analysis for investment projects. Procedia Economics and Finance. 15: 393–400.
Porteiro, J.; Collazo, J.; Patino, D.; Granada, E.; Gonzalez, J.C.M.; Miguez, J.L. 2009. Numerical modeling of a biomass pellet domestic boiler. Energy & Fuels. 23: 1067–1075.
Rauch, P. 2010. Stochastic simulation of forest fuel sourcing models under risk. Scandinavian Journal of Forest Research. 25: 574–584.
RETScreen Natural Resources Canada [NRC ES]. 2015. Clean Energy Project Analysis, RETScreen® Engineering & Cases Textbook. Energy Sector. 456 p. https://www.scribd.com/document/298060252/Retscreen-Textbook. (20 April 2017).
Roy, M.; Dutta, A.; Corscadden, K. 2013. An experimental study of combustion and emissions of biomass pellets in a prototype pellet furnace. Applied Energy. 108: 298–307.
Sartor, K.; Quoilin, S.; Dewallef, P. 2014. Simulation and optimization of a CHP biomass plant and district heating network. Applied Energy. 130: 474–483.
St. Denis, G.; Parker, P. 2009. Community energy planning in Canada: the role of renewable energy. Renewable and Sustainable Energy Reviews. 13: 2088–2095.
Strauss, W. 2012. An overview of a risk analysis for a wood pellet manufacturing project. 19 p. http://futuremetrics.info/wp-content/uploads/2013/07/FutureMetrics-Pellet-Plant-Risk-Analysis.pdf. (20 April 2017).
Tlingit-Haida Regional Housing Authority [THRHA[. 2014. Tlingit-Haida Regional Housing Authority. http://regionalhousingauthority.org/. (6 January 2017).
Upadhyay, P.T.; Shahi, C.; Leitch, M.; Pulkki, R. 2012. Economic feasibility of biomass gasification for power generation in three selected communities of northwestern Ontario, Canada. Energy Policy. 44: 235–244.
Verma, V.K.; Bram, S.; Delattin, F.; De Ruyck, J. 2013. Real life performance of domestic pellet boiler technologies as a function of operational loads: a case study of Belgium. Applied Energy. 101: 357–362.
19
Economic Sensitivity and Risk Analysis for Small-Scale Wood Pellet Systems—an Example From Southeast Alaska
Verma, V.K.; Bram, S.; Delattin, F.; Laha, P.; Vandendael, I.; Hubin, A.; DeRuyck, J. 2012. Agro-pellets for domestic heating boilers: standard laboratory and real life performance. Applied Energy. 90(1): 17–23.
Walker, G. 2008. What are the barriers and incentives for community-owned means of energy production and use? Energy Policy. 36: 4401–4405.
Wood, S.R.; Rowley, P.N. 2011. A techno-economic analysis of small-scale, biomass-fuelled combined heat and power for community housing. Biomass and Bioenergy. 35: 3849–3858.


Pacific Northwest Research Station
Website http://www.fs.fed.us/pnw/Telephone (503) 808–2592Publication requests (503) 808–2138FAX (503) 808–2130E-mail [email protected] address Publications Distribution Pacific Northwest Research Station P.O. Box 3890 Portland, OR 97208–3890
U.S. Department of Agriculture Pacific Northwest Research Station 1220 SW 3rd Ave., Suite 1400 P.O. Box 3890 Portland, OR 97208–3890
Official Business Penalty for Private Use, $300