Embed Size (px)
Citation preview
1
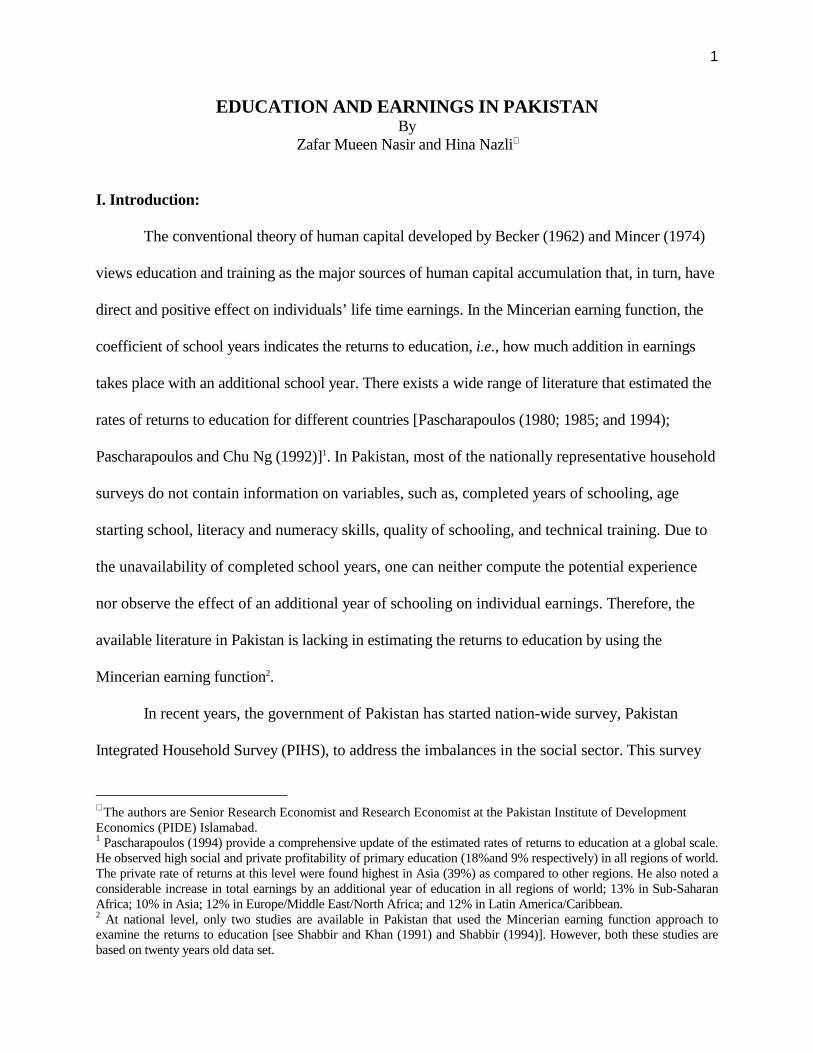
EDUCATION AND EARNINGS IN PAKISTAN By
Zafar Mueen Nasir and Hina Nazli∗
I. Introduction:
The conventional theory of human capital developed by Becker (1962) and Mincer (1974)
views education and training as the major sources of human capital accumulation that, in turn, have
direct and positive effect on individuals’ life time earnings. In the Mincerian earning function, the
coefficient of school years indicates the returns to education, i.e., how much addition in earnings
takes place with an additional school year. There exists a wide range of literature that estimated the
rates of returns to education for different countries [Pascharapoulos (1980; 1985; and 1994);
Pascharapoulos and Chu Ng (1992)]1. In Pakistan, most of the nationally representative household
surveys do not contain information on variables, such as, completed years of schooling, age
starting school, literacy and numeracy skills, quality of schooling, and technical training. Due to
the unavailability of completed school years, one can neither compute the potential experience
nor observe the effect of an additional year of schooling on individual earnings. Therefore, the
available literature in Pakistan is lacking in estimating the returns to education by using the
Mincerian earning function2.
In recent years, the government of Pakistan has started nation-wide survey, Pakistan
Integrated Household Survey (PIHS), to address the imbalances in the social sector. This survey
∗ The authors are Senior Research Economist and Research Economist at the Pakistan Institute of Development Economics (PIDE) Islamabad. 1 Pascharapoulos (1994) provide a comprehensive update of the estimated rates of returns to education at a global scale. He observed high social and private profitability of primary education (18%and 9% respectively) in all regions of world. The private rate of returns at this level were found highest in Asia (39%) as compared to other regions. He also noted a considerable increase in total earnings by an additional year of education in all regions of world; 13% in Sub-Saharan Africa; 10% in Asia; 12% in Europe/Middle East/North Africa; and 12% in Latin America/Caribbean. 2 At national level, only two studies are available in Pakistan that used the Mincerian earning function approach to examine the returns to education [see Shabbir and Khan (1991) and Shabbir (1994)]. However, both these studies are based on twenty years old data set.
2
provides rich information on the above mentioned variables that were missing in the earlier
household surveys. This study uses the data of PIHS to examine the returns to education by using
Mincerian earning function and thus aims to fill the vacuum that, due to the lack of appropriate
data, exists in the literature on returns to education in Pakistan. In this paper we will first estimate
the earning function with continuous school years with the assumption of uniform rate of returns for
all school years. It is argued that different school years impart different skills therefore we extend
our analysis to examine the addition in earning associated with extra years of schooling at different
levels of education, i.e., how much increase in earnings takes place with an extra year of schooling
at different levels, such as, primary, middle, matric, intermediate, bachelors and masters. By doing
so we overcome the problem that exists in the available literature in Pakistan. To our knowledge no
study has yet adopted this method to examine the returns to education in Pakistan3. The impact of
technical training and school quality on the earnings of fixed salaried and wage earners will be
examined in this study.
Based on the available data in Pakistan, most of the studies, for example, Haque (1977),
Hamdani (1977), Guisinger et al (1984), Khan and Irfan (1985), Ahmad, et al (1991); and Ashraf
and Ashraf (1993a, 1993b, and 1996) estimated the earning functions by defining the dummy
variables for different levels of education4. These studies observe low rates of returns at different
levels of education as compared to other developing countries. However, a positive association
between levels of education and earnings and an inverse relationship between the degree of
income inequality and educational attainment has been noted. In order to examine the inter-
3 Most of the studies on returns to education in Pakistan used dummy variables for different levels of education where the rates of returns at different levels of education are computed by the estimated coefficients. 4 In Pakistan, the data on education in most of the nationally representative household surveys have been reported in discrete form that denotes the completion of different levels of education, such as, ‘primary but incomplete middle’, ‘middle and incomplete matric’, and so on.
3
provincial differentials in returns to education, Shabbir and Khan (1991) estimated the Mincerian
earning function by using a nationally representative sample, drawn from the of Population,
Labour Force and Migration Survey (1979) for the literate wage earners and salaried males.
Later Shabbir (1994) estimated the earning function on the extended sample of the same data set.
These studies found 7 to 8 percent increase in earnings with an additional year of schooling.
Although the results are consistent with those of comparable LDCs but may not reflect
the recent developments in Pakistan’s economy as these studies are based on the data set which are
20 years old now. Since 1979, the economy of Pakistan has passed through various changes,
especially after the inception of the Structural Adjustment Programme in late 1980s. For example,
the literacy rate has increased from 26 percent to 45 percent and enrolment at primary level has
increased by 67 percent. Public and household expenditures on education have also increased
[Economic Survey (1998-99)]. Moreover, due to the fiscal constraints, the employment
opportunities in the public sector have started shrinking and the economy is moving towards more
openness with stronger role of private sector in recent years. In this scenario, it becomes imperative
to re-test the role of human capital as both private and public sectors are moving towards more
efficiency and productivity.
This study is important from three standpoints. First, in order to estimate the effect of
education on earnings, the most recent and nationally representative household survey data is used
which provides detailed information on the variables that were missing in previous surveys. Second,
it uses the splines of education in the earning function to examine the additional earnings associated
with extra school years at different levels. Third, this study investigates the role of some important
factors such as, technical training, school quality, and literacy and numeracy skills on earnings for
the first time.
4
The rest of the paper is organised as follows: section 2 presents an overview of the education
sector. Section 3 outlines the model for empirical estimation and describes data. Section 4 reports
the results. Conclusions and policy Implications are presented in the last Section.
II. The Education Sector in Pakistan: An Overview:
Education plays an important role in human capital formation. It raises the productivity
and efficiency of individuals and thus produces skilled manpower that is capable of leading the
economy towards the path of sustainable economic development. Like many other developing
countries, the situation of the education sector in Pakistan is not very encouraging. The low
enrolment rates at the primary level, wide disparities between regions and gender, lack of trained
teachers, deficiency of proper teaching materials and poor physical infrastructure of schools
indicate the poor performance of this sector. The overall literacy rate for 1997-98 was estimated
at 40 percent; 51 percent for males and 28 percent for females; 60 percent in urban areas and 30
percent in rural areas. These rates are still among the lowest in the world. Due to various
measures in recent years, the enrolment rates have increased considerably. However, the high
drop-out rate could not be controlled at primary level. Moreover, under-utilisation of the existing
educational infrastructure can be seen through low student-institution ratio, (almost 18 students
per class per institution) low teacher-institution ratio (2 teachers per institution) and high student-
teacher ratio (46 students per teacher).
The extremely low levels of public investment are the major cause of the poor
performance of Pakistan’s education sector. Public expenditure on education remained less than
2 percent of GNP before 1984-85. In recent years it has increased to 2.2 percent. In addition, the
allocation of government funds is skewed towards higher education so that the benefits of public
subsidy on education are largely reaped by the upper income class. Many of the highly educated
5
go abroad either for higher education or in search of better job opportunities. Most of them do
not return and cause a large public loss. After mid-1980s, each government announced special
programs for the improvement of the education sector. However, due to the political instability,
none of these programs could achieve their targets. The Social Action Program was launched in
early 1990s to address the imbalances in the social sector. This program aims to enhance
education; to improve school environment by providing trained teachers, teaching aids and
quality text books; and to reduce gender and regional disparities. The Phase-I of SAP (1993-96)
has been completed and Phase-II is in progress. The gains from the Phase-I are still debatable
because the rise in enrolment ratio has not been confirmed by the independent sources.
Irrespective of this outcome, government has started work on Phase-II of SAP. In this Phase,
government is paying special attention to promote technical and vocational education, expanding
higher education in public as well as in the private sector, enhancing computer literacy,
promoting scientific education, and improving curriculum for schools and teachers training
institutions in addition to promoting primary and secondary education.
Due to low levels of educational attainment and lack of technical and vocational
education, Pakistan’s labour market is dominated by less educated and unskilled manpower. A
considerable rise in the number of educational institutions and enrolment after 1980s is not yet
reflected in Pakistan’s labour market. This might be due to the fact that most of the bachelor’s
and master’s degree programmes emphasise only on academic education without developing
specific skills. The sluggish demand for the graduates of these programs in the job markets leads
to unemployment among the educated and the job market remains dominated by the less
educated. In this scenario, it becomes important to explore the role of education for the economic
benefit of individuals.
6
III. Theoretical Model and Estimation Methodology:
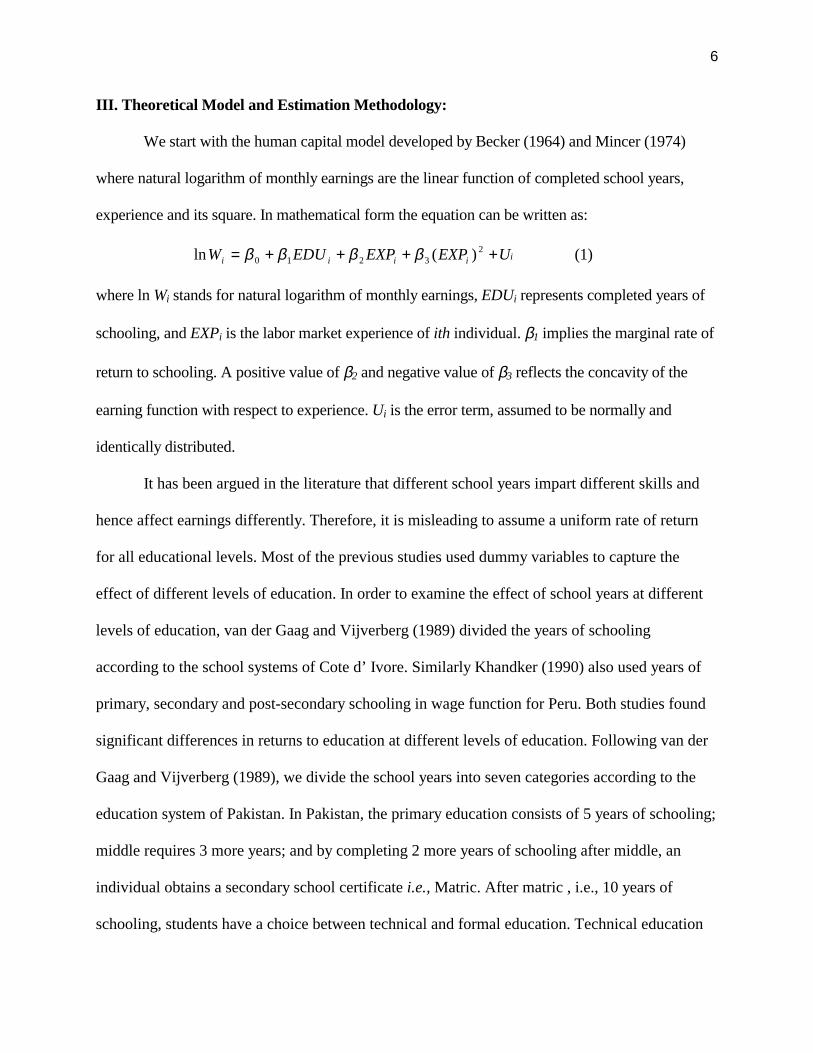
We start with the human capital model developed by Becker (1964) and Mincer (1974)
where natural logarithm of monthly earnings are the linear function of completed school years,
experience and its square. In mathematical form the equation can be written as:
iiiii UEXPEXPEDUW ++++= 23210 )(ln ββββ (1)
where ln Wi stands for natural logarithm of monthly earnings, EDUi represents completed years of
schooling, and EXPi is the labor market experience of ith individual. β1 implies the marginal rate of
return to schooling. A positive value of β2 and negative value of β3 reflects the concavity of the
earning function with respect to experience. Ui is the error term, assumed to be normally and
identically distributed.
It has been argued in the literature that different school years impart different skills and
hence affect earnings differently. Therefore, it is misleading to assume a uniform rate of return
for all educational levels. Most of the previous studies used dummy variables to capture the
effect of different levels of education. In order to examine the effect of school years at different
levels of education, van der Gaag and Vijverberg (1989) divided the years of schooling
according to the school systems of Cote d’ Ivore. Similarly Khandker (1990) also used years of
primary, secondary and post-secondary schooling in wage function for Peru. Both studies found
significant differences in returns to education at different levels of education. Following van der
Gaag and Vijverberg (1989), we divide the school years into seven categories according to the
education system of Pakistan. In Pakistan, the primary education consists of 5 years of schooling;
middle requires 3 more years; and by completing 2 more years of schooling after middle, an
individual obtains a secondary school certificate i.e., Matric. After matric , i.e., 10 years of
schooling, students have a choice between technical and formal education. Technical education
7
can be obtained from technical institutions which award diploma after 3 years of education while
the certificate of intermediate can be obtained after two years of formal education. After the
completion of intermediate certificate, students can enter either in the professional colleges for
four years or in non-professional bachelors degree program for two years in a college. Those
who choose non-professional degree can pursue their studies in a university for masters for two
more years. At this stage the graduates of professional and non-professional colleges complete
16 years of education. They can now proceed to the M.Phil. or Ph.D. degrees. In order to
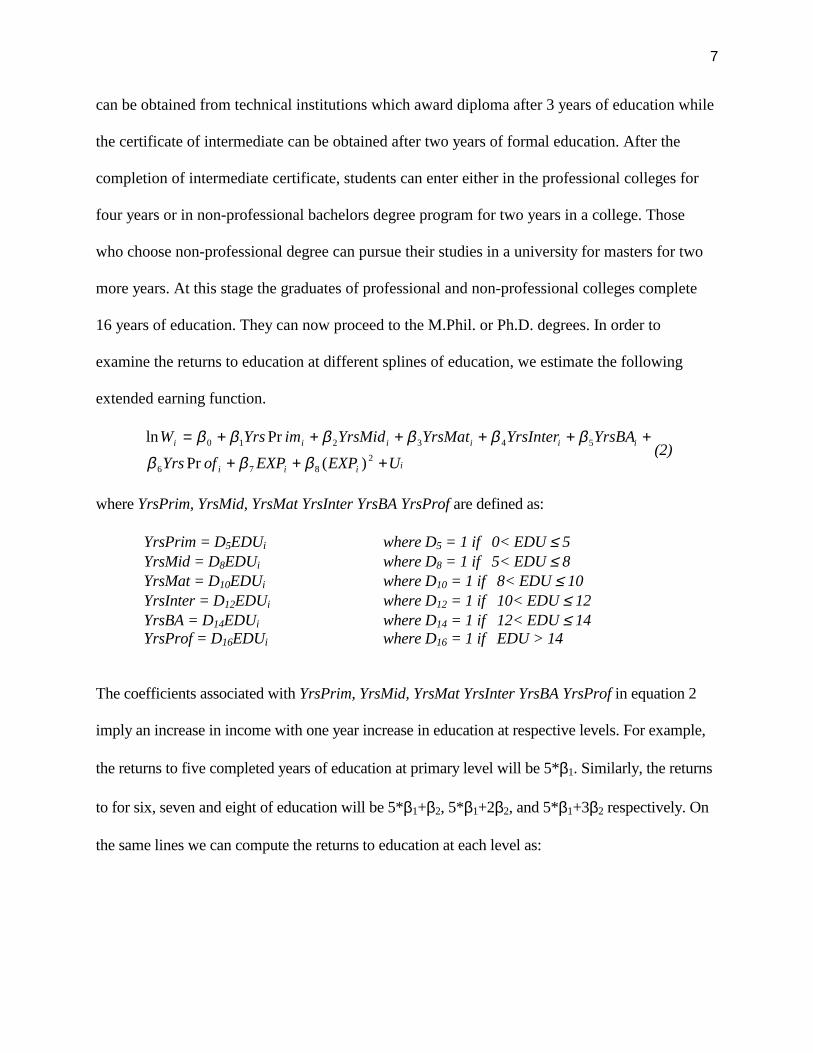
examine the returns to education at different splines of education, we estimate the following
extended earning function.
iiii
iiiiii
UEXPEXPofYrsYrsBAYrsInterYrsMatYrsMidimYrsW
+++
++++++=2
876
543210
)(Pr
Prln
βββββββββ
(2)
where YrsPrim, YrsMid, YrsMat YrsInter YrsBA YrsProf are defined as:
YrsPrim = D5EDUi where D5 = 1 if 0< EDU ≤ 5 YrsMid = D8EDUi where D8 = 1 if 5< EDU ≤ 8 YrsMat = D10EDUi where D10 = 1 if 8< EDU ≤ 10 YrsInter = D12EDUi where D12 = 1 if 10< EDU ≤ 12 YrsBA = D14EDUi where D14 = 1 if 12< EDU ≤ 14 YrsProf = D16EDUi where D16 = 1 if EDU > 14
The coefficients associated with YrsPrim, YrsMid, YrsMat YrsInter YrsBA YrsProf in equation 2
imply an increase in income with one year increase in education at respective levels. For example,
the returns to five completed years of education at primary level will be 5*β1. Similarly, the returns
to for six, seven and eight of education will be 5*β1+β2, 5*β1+2β2, and 5*β1+3β2 respectively. On
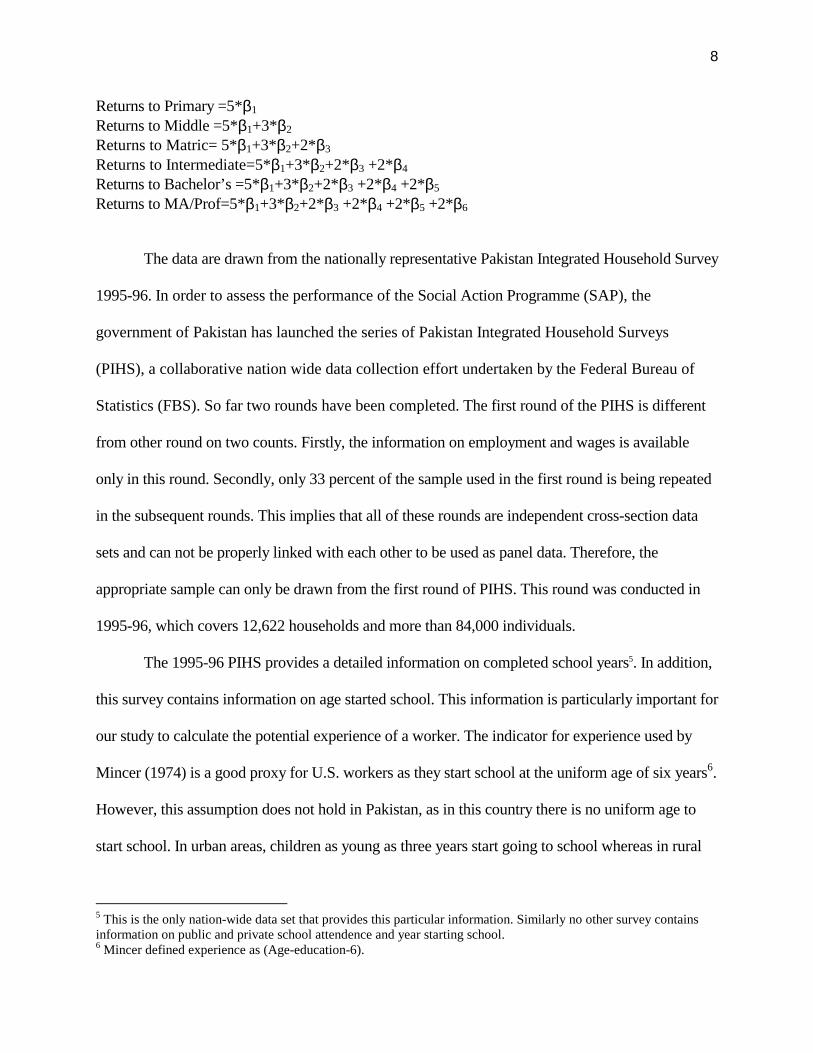
the same lines we can compute the returns to education at each level as:
8
Returns to Primary =5*β1 Returns to Middle =5*β1+3*β2 Returns to Matric= 5*β1+3*β2+2*β3 Returns to Intermediate=5*β1+3*β2+2*β3 +2*β4 Returns to Bachelor’s =5*β1+3*β2+2*β3 +2*β4 +2*β5 Returns to MA/Prof=5*β1+3*β2+2*β3 +2*β4 +2*β5 +2*β6
The data are drawn from the nationally representative Pakistan Integrated Household Survey
1995-96. In order to assess the performance of the Social Action Programme (SAP), the
government of Pakistan has launched the series of Pakistan Integrated Household Surveys
(PIHS), a collaborative nation wide data collection effort undertaken by the Federal Bureau of
Statistics (FBS). So far two rounds have been completed. The first round of the PIHS is different
from other round on two counts. Firstly, the information on employment and wages is available
only in this round. Secondly, only 33 percent of the sample used in the first round is being repeated
in the subsequent rounds. This implies that all of these rounds are independent cross-section data
sets and can not be properly linked with each other to be used as panel data. Therefore, the
appropriate sample can only be drawn from the first round of PIHS. This round was conducted in
1995-96, which covers 12,622 households and more than 84,000 individuals.
The 1995-96 PIHS provides a detailed information on completed school years5. In addition,
this survey contains information on age started school. This information is particularly important for
our study to calculate the potential experience of a worker. The indicator for experience used by
Mincer (1974) is a good proxy for U.S. workers as they start school at the uniform age of six years6.
However, this assumption does not hold in Pakistan, as in this country there is no uniform age to
start school. In urban areas, children as young as three years start going to school whereas in rural
5 This is the only nation-wide data set that provides this particular information. Similarly no other survey contains information on public and private school attendence and year starting school. 6 Mincer defined experience as (Age-education-6).
9
areas the school starting age is higher.7 This information enables us to construct potential experience
as (age-schools years-age starting school). Although experience is still a proxy for actual experience
but it is relatively better measure than age and the Mincer type potential experience.
In addition to education and experience, various other factors, such as quality of
schooling, technical training and quality of schooling have significant impact on earning8. It has
been argued that because of the market-oriented approach adopted by the private schools, the
graduates of these schools earn more as compared to the graduates of public schools9. According to
Sabot (1992), Behrman, Ross, Sabot and Tropp (1994), Alderman, Behrman, Ross and Sabot
(1996a), Alderman, Behrman, Ross and Sabot (1996b), and Behrman, Khan, Ross and Sabot
(1997), the quality of education has positive, significant and substantial impact on cognitive
achievements and hence on post school productivity, measured by earnings. These studies
observed higher earnings of the graduates of high quality school than those who attended a low
quality school. A recent study by Nasir (1999) found considerably higher earnings for the private
school graduates. These schools, however, charge higher fees. “Estimates of average annual
expenditure per pupil in both government and private schools indicates that the total cost of primary
level in rural areas is Rs. 437 (Rs 355 for government schools and Rs. 1252 for private schools),
compared with Rs. 2038 in urban areas (Rs. 1315 for government and Rs. 3478 for private schools).
This means that the cost of primary schooling is almost three times that of public schools in urban
7 The issue of age starting school has been highlighted by Ashraf and Ashraf (1993) and because of the non-availability of this information, they used age as proxy for experience. 8 See Summers and Wolf (1977); Rizzuto and Wachtel (1980); Behrman and Birdsall (1983); Booissiere, Knight and Sabot (1985); Knight and Sabot (1990);Behrman, Ross, Sabot, and Tropp (1994); Behrman, Khan, Ross and Sabot (1997). 9 Various studies found the effectiveness of private schools to acquire cognitive skills [Colemen, Hoffer and Kilgore (1982); and Jimenez, Lockheed, Luna and Paqueo (1989)]. For Pakistan, Sabot (1992), Behrman, Ross, Sabot and Tropp (1994), Alderman, Behrman, Ross and Sabot (1996a), Alderman, Behrman, Ross and Sabot (1996b), and Behrman, Khan, Ross and Sabot (1997) found a significant variation in the cognitive skills among children with same number of school years. These studies conclude that some of the differences are due to the family characteristics while some are due to the quality of schooling.
10
areas and nearly four times in rural areas. The differences in cost of schooling also reflect the degree
of quality differentials in public and private schools, and between urban and rural schools. A
relatively better provision of school facilities and quality of education in private schools is causing a
continuous rise in school enrolment in urban areas” [Mehmood (1999) page 20]. The PIHS provides
information on the type of school attended10. On the basis of this information we can identify
workers according to the school they attended and therefore examine the effect of type of school on
individual earnings. In order to capture the quality of education an individual received, a dummy
variable is included in the model that takes the value ‘1’ if individual is a graduate of private schools
and ‘0’ otherwise.
The effect of post-school training on earning has been found positive and substantial in
many developing countries [see Jimenez and Kugler (1987); van der Gaag and Vijverberg (1989);
Khandker (1990); and Nasir (1999)]. The PIHS contains information on years of technical training.
This information helps us to examine the effect of technical training received on individual
earnings. We use completed years of technical training as independent variable in the earning
function.
The existence of vast gender gap in human capital accumulation is evidenced by various
studies in Pakistan11. The PIHS reports vast gender disparities in literacy and enrolment rates.
The literacy rate among females is half than that of males’ literacy rate for whole Pakistan. This
difference has increased to three-folds for rural areas. The gender difference is however smaller
for the gross enrolment rate at primary level. For the higher levels of education, this difference
10 The coefficient of private school may also capture the effect of socio-economic background of workers. The data, however, does not contain such information, therefore we are unable to separate the effect of parental characteristics from the effect of private schools in worker’s earnings. 11 Sabot (1992); and Alderman, Behrman, Ross and Sabot (1996b); Sawada (1997); Shabbir (1993); and Ashraf and Ashraf (1993a, 1993b, and 1996)
11
shows an increasing trend. Similarly vast gender gap has been observed in returns to education
where males earn more than the female workers [Ashraf and Ashraf (1993a, 1993b and 1996)
and Nasir (1999)]. In order to capture the effect of gender, a dummy variable is introduced in the
model that takes the value ‘1’ for males and ‘0’ otherwise.
The regional imbalances in the provision of limited available social services are more
pronounced in Pakistan. Rural areas are not only underdeveloped in terms of physical
infrastructure but also neglected in gaining basic amenities. Haq (1997) calculated the
disaggregated human development index for Pakistan and its provinces. He noted that nearly 56
percent of population is deprived of basic amenities of life in Pakistan; 58 percent in rural areas
and 48 percent in urban areas. According to the 1995-96 PIHS, the literacy rate in urban areas is
57 percent and in rural areas it is 31 percent. The gross enrolment rate was noted 92 percent in
urban areas and 68 percent in rural areas. Because of these differences low returns to education
are observed in rural areas [Shabbir (1993 and 1994) and Nasir (1999)]. To capture the effect of
regional differences, a dummy variable is used that takes the value ‘1’ if individual lives in urban
areas and zero otherwise.
The four provinces of Pakistan exhibit different characteristics in terms of economic as well
as social and cultural values. Significant provincial differentials in rates of returns to education
have been noted that reflect not only the differences in market opportunities but also indicate
uneven expansion of social services across provinces [Khan and Irfan (1985); Shabbir and Khan
(1991); Shabbir (1993); Shabbir (1994); and Haq (1997)]. The effects of these differences are
captured through the use of dummy variables for each province in the earning function, Sindh being
the excluded category.
12
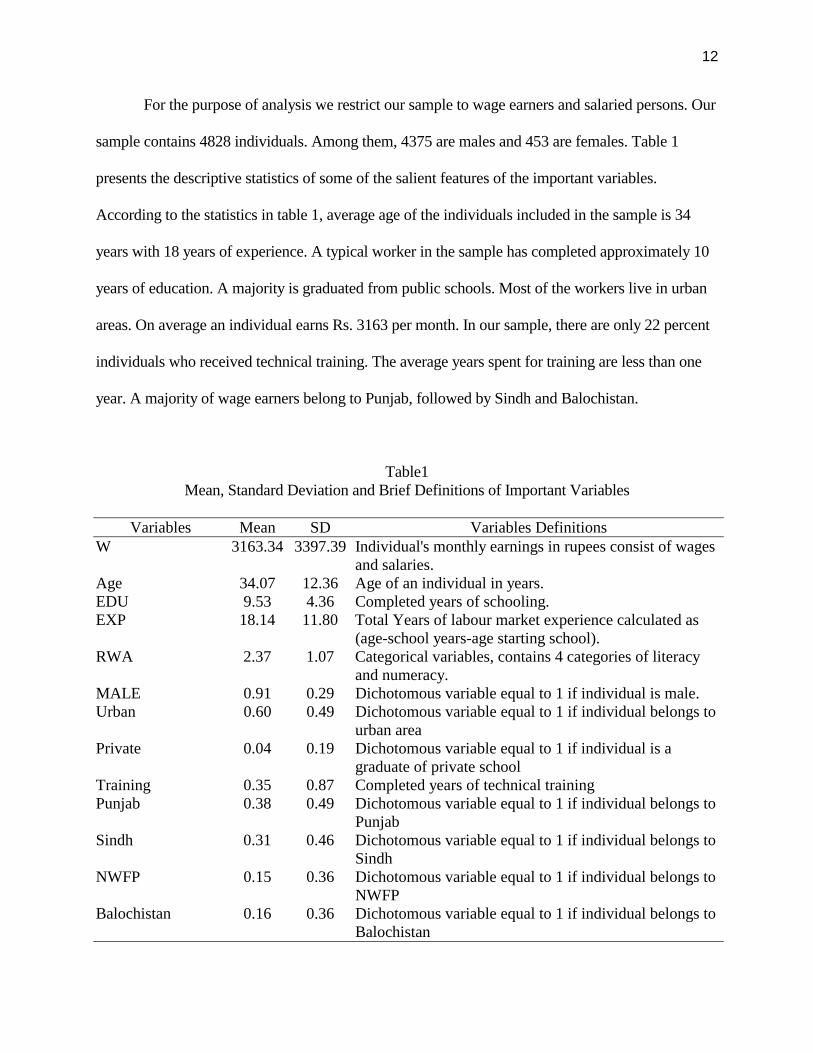
For the purpose of analysis we restrict our sample to wage earners and salaried persons. Our
sample contains 4828 individuals. Among them, 4375 are males and 453 are females. Table 1
presents the descriptive statistics of some of the salient features of the important variables.
According to the statistics in table 1, average age of the individuals included in the sample is 34
years with 18 years of experience. A typical worker in the sample has completed approximately 10
years of education. A majority is graduated from public schools. Most of the workers live in urban
areas. On average an individual earns Rs. 3163 per month. In our sample, there are only 22 percent
individuals who received technical training. The average years spent for training are less than one
year. A majority of wage earners belong to Punjab, followed by Sindh and Balochistan.
Table1 Mean, Standard Deviation and Brief Definitions of Important Variables
Variables Mean SD Variables Definitions
W 3163.34 3397.39 Individual's monthly earnings in rupees consist of wages and salaries.
Age 34.07 12.36 Age of an individual in years. EDU 9.53 4.36 Completed years of schooling. EXP 18.14 11.80 Total Years of labour market experience calculated as
(age-school years-age starting school). RWA 2.37 1.07 Categorical variables, contains 4 categories of literacy
and numeracy. MALE 0.91 0.29 Dichotomous variable equal to 1 if individual is male. Urban 0.60 0.49 Dichotomous variable equal to 1 if individual belongs to
urban area Private 0.04 0.19 Dichotomous variable equal to 1 if individual is a
graduate of private school Training 0.35 0.87 Completed years of technical training Punjab 0.38 0.49 Dichotomous variable equal to 1 if individual belongs to
Punjab Sindh 0.31 0.46 Dichotomous variable equal to 1 if individual belongs to
Sindh NWFP 0.15 0.36 Dichotomous variable equal to 1 if individual belongs to
NWFP Balochistan 0.16 0.36 Dichotomous variable equal to 1 if individual belongs to
Balochistan
13
IV. Empirical Results
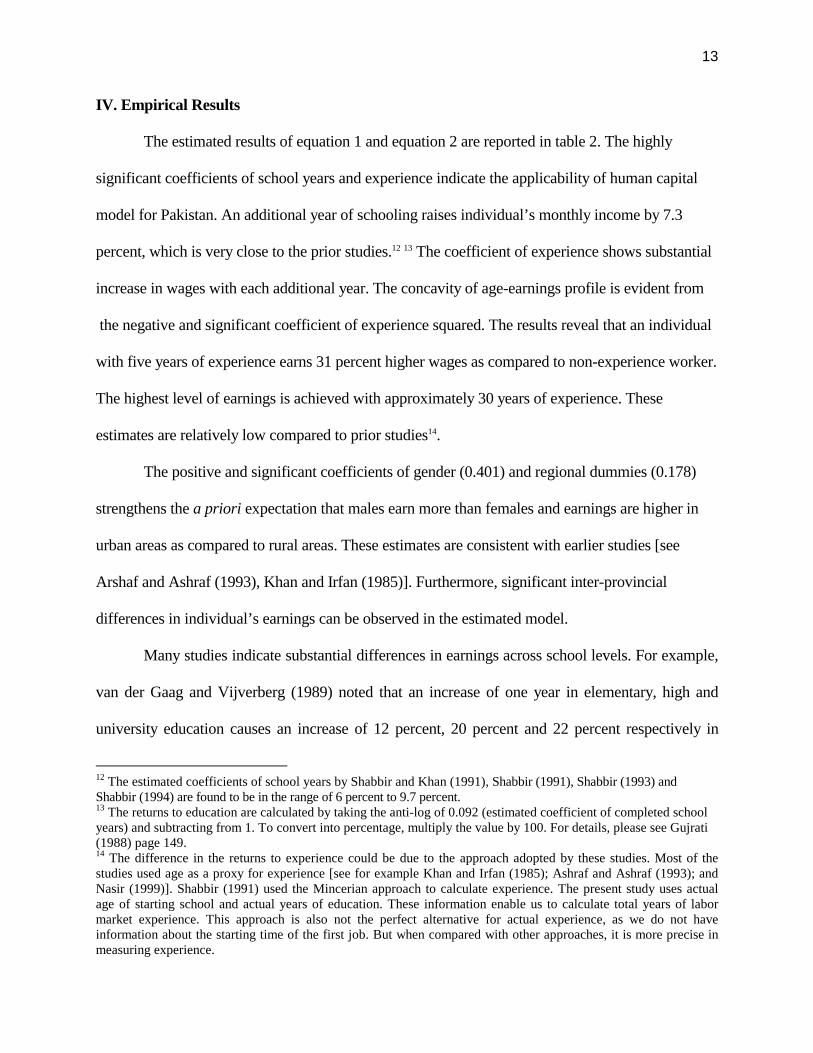
The estimated results of equation 1 and equation 2 are reported in table 2. The highly
significant coefficients of school years and experience indicate the applicability of human capital
model for Pakistan. An additional year of schooling raises individual’s monthly income by 7.3
percent, which is very close to the prior studies.12 13 The coefficient of experience shows substantial
increase in wages with each additional year. The concavity of age-earnings profile is evident from
the negative and significant coefficient of experience squared. The results reveal that an individual
with five years of experience earns 31 percent higher wages as compared to non-experience worker.
The highest level of earnings is achieved with approximately 30 years of experience. These
estimates are relatively low compared to prior studies14.
The positive and significant coefficients of gender (0.401) and regional dummies (0.178)
strengthens the a priori expectation that males earn more than females and earnings are higher in
urban areas as compared to rural areas. These estimates are consistent with earlier studies [see
Arshaf and Ashraf (1993), Khan and Irfan (1985)]. Furthermore, significant inter-provincial
differences in individual’s earnings can be observed in the estimated model.
Many studies indicate substantial differences in earnings across school levels. For example,
van der Gaag and Vijverberg (1989) noted that an increase of one year in elementary, high and
university education causes an increase of 12 percent, 20 percent and 22 percent respectively in
12 The estimated coefficients of school years by Shabbir and Khan (1991), Shabbir (1991), Shabbir (1993) and Shabbir (1994) are found to be in the range of 6 percent to 9.7 percent. 13 The returns to education are calculated by taking the anti-log of 0.092 (estimated coefficient of completed school years) and subtracting from 1. To convert into percentage, multiply the value by 100. For details, please see Gujrati (1988) page 149. 14 The difference in the returns to experience could be due to the approach adopted by these studies. Most of the studies used age as a proxy for experience [see for example Khan and Irfan (1985); Ashraf and Ashraf (1993); and Nasir (1999)]. Shabbir (1991) used the Mincerian approach to calculate experience. The present study uses actual age of starting school and actual years of education. These information enable us to calculate total years of labor market experience. This approach is also not the perfect alternative for actual experience, as we do not have information about the starting time of the first job. But when compared with other approaches, it is more precise in measuring experience.
14
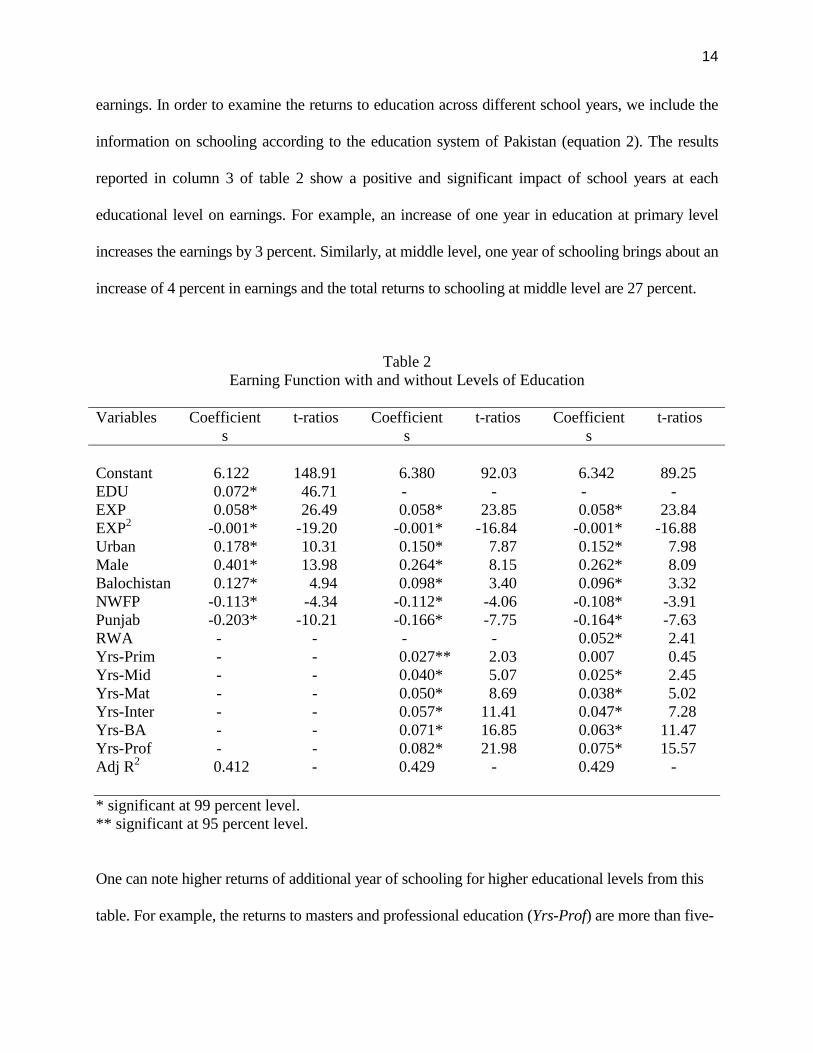
earnings. In order to examine the returns to education across different school years, we include the
information on schooling according to the education system of Pakistan (equation 2). The results
reported in column 3 of table 2 show a positive and significant impact of school years at each
educational level on earnings. For example, an increase of one year in education at primary level
increases the earnings by 3 percent. Similarly, at middle level, one year of schooling brings about an
increase of 4 percent in earnings and the total returns to schooling at middle level are 27 percent.
Table 2 Earning Function with and without Levels of Education
Variables Coefficient
s t-ratios Coefficient
s t-ratios Coefficient
s t-ratios
Constant 6.122 148.91 6.380 92.03 6.342 89.25 EDU 0.072* 46.71 - - - - EXP 0.058* 26.49 0.058* 23.85 0.058* 23.84 EXP2 -0.001* -19.20 -0.001* -16.84 -0.001* -16.88 Urban 0.178* 10.31 0.150* 7.87 0.152* 7.98 Male 0.401* 13.98 0.264* 8.15 0.262* 8.09 Balochistan 0.127* 4.94 0.098* 3.40 0.096* 3.32 NWFP -0.113* -4.34 -0.112* -4.06 -0.108* -3.91 Punjab -0.203* -10.21 -0.166* -7.75 -0.164* -7.63 RWA - - - - 0.052* 2.41 Yrs-Prim - - 0.027** 2.03 0.007 0.45 Yrs-Mid - - 0.040* 5.07 0.025* 2.45 Yrs-Mat - - 0.050* 8.69 0.038* 5.02 Yrs-Inter - - 0.057* 11.41 0.047* 7.28 Yrs-BA - - 0.071* 16.85 0.063* 11.47 Yrs-Prof - - 0.082* 21.98 0.075* 15.57 Adj R2 0.412 - 0.429 - 0.429 - * significant at 99 percent level. ** significant at 95 percent level.
One can note higher returns of additional year of schooling for higher educational levels from this
table. For example, the returns to masters and professional education (Yrs-Prof) are more than five-
15
times higher than that of primary school years (Yrs-Prim). The results exhibit a difference of 15
percent between primary graduates and illiterates, the excluded category. This category includes
illiterates as well as all those who have not obtained any formal schooling but have literacy and
numeracy skills15. To further explore the earning differential between primary school graduates and
those who never attended school but have literacy and numeracy skills, we have constructed an
index RWA that separates illiterates from those who have literacy and numeracy skills. This
index takes the value ‘zero’ if individual does not have any skill; ‘1’ if individual has only one
skill; ‘2’ if individual has two skills; and ‘3’ if individual has all three skills. We re-estimated
equation 2 with this new variable and the results are reported in column 5 of table 2. According to
our expectations, the coefficient of RWA is found not only large (0.05) in magnitude but also
statistically significant at 99 percent level. This indicates that the individuals with all three skills
earn 15 percent more than those who have no skill. On the other hand, the coefficient of Yrs-Prim
dropped to 0.007 and became insignificant16. The differential in the earnings of illiterates and those
having five years of primary education was 15 percent (0.03*5=0.15). This differential however,
reduced to approximately 9 percent (0.007*5+0.053=8.8) when we include those who have no
formal education but have literacy and numeracy skills. These high returns to cognitive skills
indicates the willingness of employer to pay higher wages to the able workers as compared to those
who have five or less years of schooling but do not have these skills.
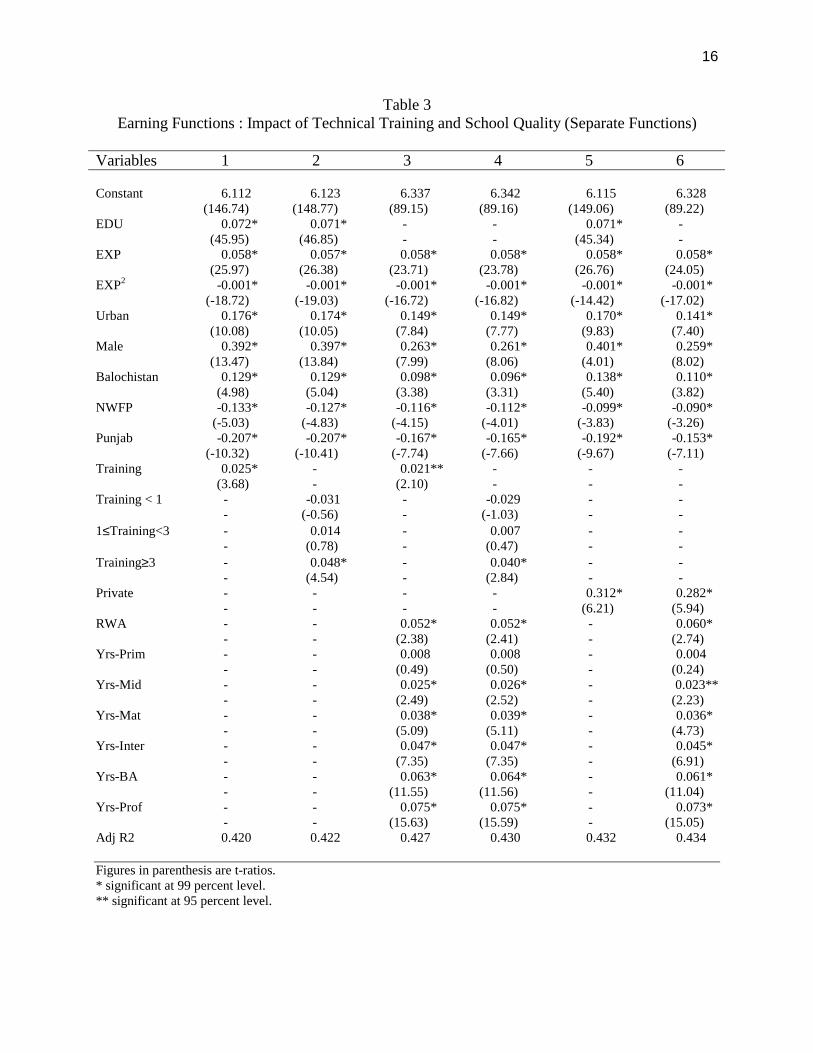
Now we examine the effect of technical training and quality of schooling on earnings, first
in separate equations and then in a single equation. The impact of technical training on earnings is
examined by including years of apprenticeship as continuous variable in our model. The results are
reported in column 1 of table 3. The results show a positive and significant impact of technical
15 There are 48 wage earners in our sample who have education less than primary but do not have any of these skill. Whereas we found 76 wage earners who do not have any formal education but have at least one of these skills. 16 This result is consistent with van der Gaag and Vijierberg (1989).
16
Table 3 Earning Functions : Impact of Technical Training and School Quality (Separate Functions)
Variables 1 2 3 4 5 6 Constant 6.112 6.123 6.337 6.342 6.115 6.328 (146.74) (148.77) (89.15) (89.16) (149.06) (89.22) EDU 0.072* 0.071* - - 0.071* - (45.95) (46.85) - - (45.34) - EXP 0.058* 0.057* 0.058* 0.058* 0.058* 0.058* (25.97) (26.38) (23.71) (23.78) (26.76) (24.05) EXP2 -0.001* -0.001* -0.001* -0.001* -0.001* -0.001* (-18.72) (-19.03) (-16.72) (-16.82) (-14.42) (-17.02) Urban 0.176* 0.174* 0.149* 0.149* 0.170* 0.141* (10.08) (10.05) (7.84) (7.77) (9.83) (7.40) Male 0.392* 0.397* 0.263* 0.261* 0.401* 0.259* (13.47) (13.84) (7.99) (8.06) (4.01) (8.02) Balochistan 0.129* 0.129* 0.098* 0.096* 0.138* 0.110* (4.98) (5.04) (3.38) (3.31) (5.40) (3.82) NWFP -0.133* -0.127* -0.116* -0.112* -0.099* -0.090* (-5.03) (-4.83) (-4.15) (-4.01) (-3.83) (-3.26) Punjab -0.207* -0.207* -0.167* -0.165* -0.192* -0.153* (-10.32) (-10.41) (-7.74) (-7.66) (-9.67) (-7.11) Training 0.025* - 0.021** - - - (3.68) - (2.10) - - - Training < 1 - -0.031 - -0.029 - - - (-0.56) - (-1.03) - - 1≤Training<3 - 0.014 - 0.007 - - - (0.78) - (0.47) - - Training≥3 - 0.048* - 0.040* - - - (4.54) - (2.84) - - Private - - - - 0.312* 0.282* - - - - (6.21) (5.94) RWA - - 0.052* 0.052* - 0.060* - - (2.38) (2.41) - (2.74) Yrs-Prim - - 0.008 0.008 - 0.004 - - (0.49) (0.50) - (0.24) Yrs-Mid - - 0.025* 0.026* - 0.023** - - (2.49) (2.52) - (2.23) Yrs-Mat - - 0.038* 0.039* - 0.036* - - (5.09) (5.11) - (4.73) Yrs-Inter - - 0.047* 0.047* - 0.045* - - (7.35) (7.35) - (6.91) Yrs-BA - - 0.063* 0.064* - 0.061* - - (11.55) (11.56) - (11.04) Yrs-Prof - - 0.075* 0.075* - 0.073* - - (15.63) (15.59) - (15.05) Adj R2 0.420 0.422 0.427 0.430 0.432 0.434 Figures in parenthesis are t-ratios. * significant at 99 percent level. ** significant at 95 percent level.
17
training on individuals earnings. The coefficient of this variable indicates that earnings increase by
2.5 percent with every additional year of training. All other estimates remain unchanged [see
column 1 of table 2]. In the next step we divide training into different levels (i.e. one year or less,
more than one year but less than three, and three or more years). These results, reported in column 2
of table 3, indicate that there is no significant impact of training on earnings if training is less than 3
years. However, three and higher years of training yield higher returns (5%). No obvious change in
the returns to technical training (as continuous variable) has been observed when school years for
levels of education are used (see column 3 and 4 of table 3). A slight decline in the coefficient of
highest category of technical training is noted when training is divided into levels. All other results
remain unchanged after the inclusion of technical training in the model. These results are consistent
with those for other countries which showed high returns to technical training17. These results
support the human capital view where training positively affects earnings by raising the productivity
of individuals.
The estimated models controlling for the quality of schooling are presented in columns 5
and 6 of table 3. These results show a positive, significant and substantial impact of private
schools on individual earnings. A graduate of private school earns 31 percent higher income
compared to the graduate of public school. All other estimated coefficients remain robust in our
models. An improvement in adjusted R2 is noted. The impact of private schools declines slightly
(28% from 31%) when we divide school years according to educational levels. These results
imply that education from private schools is important determinant of earnings and suggest that
employer do consider the skills of workers which they acquire through private schools. The
17 See, for example, Jimenez and Kugler (1987), King (1990), Khundker (1990), and Nasir (1990).
18
Table 4 Earning Functions: Simultaneous Impact of Technical Training and School Quality
Variables Coefficients t-ratios Coefficients t-ratios Coefficients t-ratios Coefficients t-ratios Constant 6.114 147.06 6.323 89.12 6.115 149.11 6.329 89.13 EDU 0.071* 45.32 - - 0.071* 46.22 - - EXP 0.057* 26.25 0.058* 23.92 0.058* 26.65 0.058* 23.99 EXP2 -0.001* -18.94 -0.001* -16.86 -0.001* -19.24 -0.001* -16.96 Urban 0.168* 9.62 0.139* 7.27 0.166* 9.58 0.138* 7.20 Male 0.392* 13.53 0.259* 8.02 0.397* 13.90 0.258* 7.98 Balochistan 0.140* 5.44 0.112* 3.86 0.140* 5.49 0.110* 3.80 NWFP -0.120* -4.55 -0.098* -3.50 -0.113* -4.32 -0.094* -3.35 Punjab -0.197* -9.79 -0.155* -7.22 -0.196* -9.88 -0.154* -7.14 Training 0.024** 3.72 0.020** 1.97 - - - - Training < 1 - - - - -0.033 -0.59 -0.030 -1.09 1<Training<3 - - - - 0.013 0.72 0.006 0.45 Training≥3 - - - - 0.047* 4.46 0.037* 2.65 Private 0.311* 3.72 0.280* 5.91 0.313* 6.15 0.278* 5.86 RWA - - 0.059* 2.72 - - 0.060* 2.75 Yrs-Prim - - 0.004 0.28 - - 0.004 0.29 Yrs-Mid - - 0.023** 2.27 - - 0.023** 2.30 Yrs-Mat - - 0.036* 4.79 - - 0.037* 4.82 Yrs-Inter - - 0.045* 6.98 - - 0.045* 6.99 Yrs-BA - - 0.061* 11.11 - - 0.062* 11.13 Yrs-Prof - - 0.073* 15.11 - - 0.073* 15.07 Adj R2 0.415 - 0.435 - 0.434 - 0.435 - * significant at 99 percent level. ** significant at 95 percent level.
19
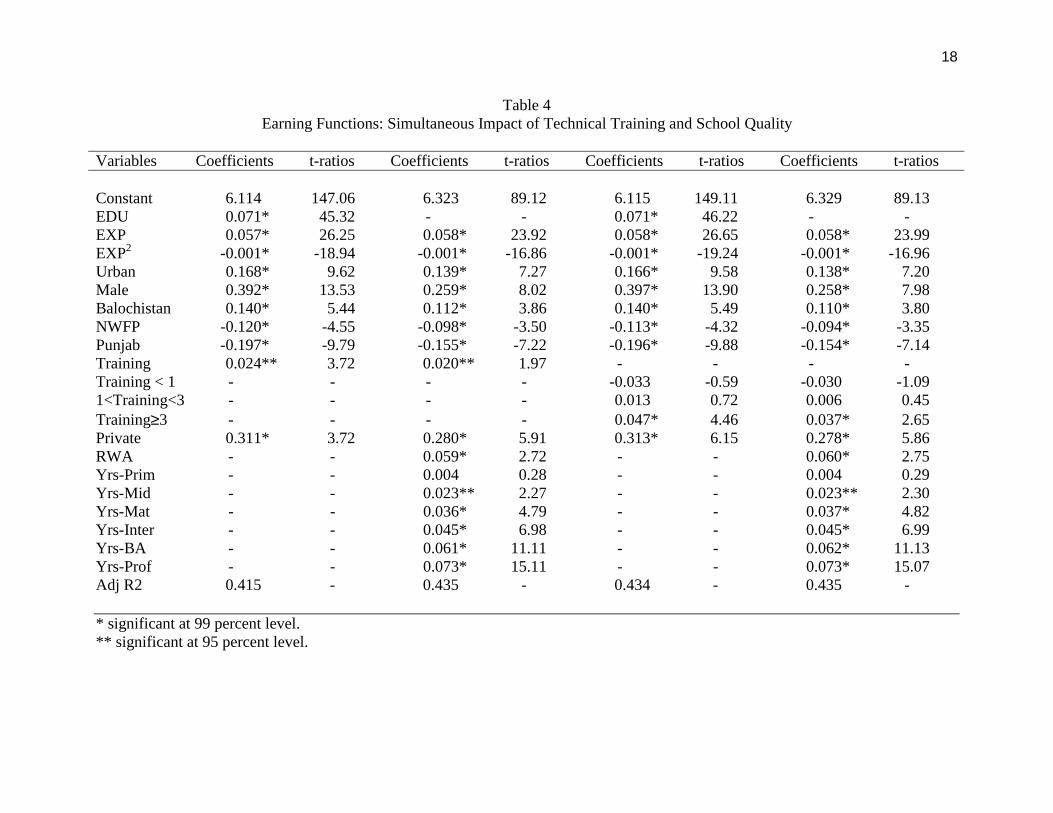
simultaneous effect of technical and quality of schooling on earnings is reported in table 4. The
estimated coefficients remain robust in both models. In addition, the size and level of
significance of the coefficients of technical training and private school variables do not change as
much as we foundin tables3 i.e., the effect of private schools and returns to highest category of
technical training on individual earnings are slightly higher in columns 1 and 5 of table 4.
Adjusted R2 however, improved to 0.44. This indicates direct, significant and positive impact of
technical training and quality of schooling on individual earnings. The results strongly endorse
the human capital model where earnings are related with the productivity of workers.
V. Conclusion and Policy Implications
This paper investigates the role of education, technical training, school quality and
literacy and numeracy skills on the earnings of wage earners and salaried persons in Pakistan.
Due to the lack of appropriate data, the previous studies are lacking in observing the role of these
variables on earnings. As PIHS (1995-96) provides information on completed school years
therefore this paper not only estimates the Mincerian earning function but also examines the
returns to education at different stages of schooling, i.e., how much increase in earnings takes place
with an additional year of education at specific levels, such as, primary, middle, matric,
intermediate, bachelors and masters.
The analysis confirms the positive role of education as each year of education brings
approximately 7 percent returns for wage earners. The results indicate that not only every additional
year of schooling causes a significant rise in earnings but higher earnings are found to be associated
with higher levels of education. In addition to these, the effect of literacy and numeracy skills is
observed to be large and significant. The returns are 15 percent higher for those who have all three
skills as compared to those who do not possess any of these skills. The inclusion of this variable
20
drastically reduces the returns to education for primary school years and makes it insignificant. This
implies that those who obtain literacy and numeracy skill without attending primary education, do
get the reward of these skills in terms of higher earnings as compared to those who have attended
primary school but do not have any of these skills. These findings support the results of earlier
studies that used the actual test scores of latent ability and cognitive skills [for reference see
footnote 7].
The impact of technical training and private schools is found to be positive and
significant. An additional year of technical training causes 2.4 percent increase in earnings, and
more than 3 years of training adds 4 percent premium in earnings. A graduate of private school
earns 30 percent higher income as compared to the graduate of public school. The simultaneous
inclusion of technical training and private schools does not change the size and significance
levels of the coefficients of education and experience, which indicates the robustness of our
findings. These results suggest that workers get the reward of those traits which enhance their
productivity.
There are three main policy implications of these findings. First, a large and significant
impact of literacy and numeracy skills highlights the importance of basic learning skills that leads to
higher wages in the labour market. Therefore, immediate attention should be paid for enhancing
literacy and numeracy skills through formal as well as informal education. In order to minimise the
wastage in education, the resources should be optimally utilised by diverting them to more effective
and efficient mode of education. This suggests that investment should be made not only to increase
the quantity of schools but also to improve the quality of education. To further test the effectiveness
of the education system, there is a need to prepare a nation wide in-depth data base on education
that contains the actual test scores on ability and cognitive skills. A significant impact of these
21
factors on human capital formation has been observed in rural Pakistan18. At national level,
however, their role is still unexplored.
Second, a positive and significant association between earnings and higher level of technical
training implies the urgent need of such institutions that can train individuals on modern lines in
order to cope with the rapidly changing technology. Because three or more years of training play an
important role in the labour market, therefore there is a dire need to keep workers update about the
technological advancements through high quality technical training.
Third, more emphasis should be placed on market oriented approach in education. The
effectiveness of private school system is a ready example for developing such approach. The
market-oriented approach should be introduced at the school level. This requires the overhauling
of public school system not only in terms of curriculum but also in teaching methods. Emphasis
should also be placed on teachers training. Unfortunately in Pakistan, low official requirements for
this position and extremely low salaries offered to the teachers, especially at the primary level,
imply the low level of priority accorded to basic education. This requires not only an increase in
the budgetary allocations for education but also its optimal utilisation. In addition, special measures
are needed to narrow down the gender and regional disparity.
18 Please see, Sabot (1989 and 1992), Behrman, Ross, Sabot and Tropp (1994), Alderman, Behrman, Ross and Sabot (1996a), and Behrman, Khan, Ross and Sabot (1997).
22
References
Ahmad, E. , M. F. Arshad and A. Ahmad (1991), “Learning and Earning Profiles in Pakistan’s Informal Sector”. Pakistan Economic and Social Review. Vol. XXIX, No. 2
Alderman, H., J. Behrman., D. Ross., and R. Sabot. (1996a). “The Returns to Endogenous Human
Capital in Pakistan’s Rural Wage Labour Market”. Oxford Bulletin of Economics and Statistics. Volume 58. No. 1.
Alderman, H., J. Behrman., D. Ross., and R. Sabot. (1996b). “Decomposing the Gender Gap in
Cognitive Skills in a Poor Rural Economy”. Journal of Human Resources. Volume XXXI. No. 1.
Ashraf, B. and J. Ashraf (1996), “Evidence on Gender Wage Discrimination from the 1984-85
HIES: A Note”. Pakistan Journal of Applied Economics. Vol. XII, No. 1. Ashraf, J. and B. Ashraf (1993a), “Estimating the Gender Wage Gap in Rawalpindi City”.
Journal of Development Studies. Vol. 24, No. 2. Ashraf, J. and B. Ashraf (1993b), “An Analysis of the Male-Female Earning Differential in
Pakistan”. The Pakistan Development Review. Vol. 32, No. 4. Becker, Gary S. (1962), “Investment in Human Capital: A Theoretical Analysis”. Journal of
Political Economy. Vol. 70, Supplement. Behrman, Jere and Nancy Birdsall (1983). “The Quality of Schooling: Quantity alone is
Misleading”. American Economic Review. Vol 73. 928-946. Behrman, Jere. R., David Ross, Richard Sabot, and Mathew Tropp (1994). “Improving the Quality
Versus Increasing the Quantity of Schooling”. Economics of Education Review. Vol 16, No. 2. pp 127-142.
Behrman, Jere. R., Shahrukh Khan, David Ross and Richard Sabot (1997). “School Quality and
Cognitive Achievement Production: A Case Study for Rural Pakistan”. Economics of Education Review. Vol 16, No. 2. pp 127-142.
Booissiere, M., J. B. Knight and R. H. Sabot (1985). “Earning, Schooling, Ability and Cognitive
Skills” American Economic Review. Vol 75 1016-30. Colemen, J., T. Hoffer and S. Kilgore (1982). “High School Achievements: Public, Catholic and
Private School Compared”. New York.: Basic Government of Pakistan. (1998 and 1999) Economic Survey. Finance Division. Islamabad.
23
Guisinger, S. E., J. W. Henderson, and G. W. Scully. (1984), “Earnings, rate of Returns to Education and Earning Distribution in Pakistan”. Economics of Education Review. Vol. 3, No. 4.
Gujrati, Damodar, N. (1988). Basic Econometrics. (2nd edition). New York: MacGraw-Hill, Inc. Hamdani, Khalil. (1977), "Education and the Income Differentials: An Estimation of Rawalpindi
City". The Pakistan Development Review. Vol XVI No. 2 Haq, Mahbub ul (1997). Human Development in South Asia. 1997. Human Development Centre.
Islamabad. Oxford University Press. Haque, Nadeemul. (1977), "An Economic Analysis of Personal Earnings in Rawalpindi City". The
Pakistan Development Review. 16:4. Jimenez, E. and B. Kugler (1986). “The Earnings, Impact of Training Duration in a Developing
Country” Journal of Human Resources. Volume 76: 604-20. Jimenez, E., M. E. Lockheed, E. Luna and V. Paqueo (1989). “School Effects and Cost for Private
and Public Schools in the Dominican Republic”. Working Paper No. 288. Population and Resource Planning Department. The World Bank. Washington. D.C.
Khandker, S. R. (1990). “Labour Market Participation, Returns to Education, and Male-Female
wage Differentials in Peru”. Working Paper No. 461. Population and Human Resource Department, The World Bank. Washington, D.C.
Khan, S. R. and M. Irfan. (1985), "Rate of Returns to Education and Determinants of Earnings in
Pakistan". The Pakistan Development Review. 34:3&4 King, E. M. (1990). “Does Education Pay in the Labour Market? The Labour Force Participation,
Occupation and Earnings of Peruvian Women”. Living Standard Measurement Study. Working Paper No. 67. The World Bank. Washington, D.C.
Knight, J. B. and R. H. Sabot (1990). Educational Productivity and Inequality: The East African
Natural Experiment Oxford University Press. New York. Mahmood Naushin (1999). “Education Development in Pakistan: Trends, Issues, and Policy
Concerns”. Research Report No. 172. Pakistan Institute of Development Economics. Islamabad.
Mincer, Jacob, (1974), Schooling, Experience and Earnings: New York: National Bureau of
Economic Research. Nasir, Z. M. (1999). “Do Private Schools Make Workers More Productive”. Pakistan Institute of
Development Economics. Mimeo.
24
Pasacharapoulos, G. (1980), “Returns to Education: An Updated International Comparison”. In T. King (ed.) Education and Income World Bank Staff Working Paper No. 402. Washington, D.C.
Pasacharapoulos, G. (1985), “Returns to Education: A Further International Update and
Implications”. The Journal of Human Resources. Vol. 20: 584-604. Pasacharapoulos, G and Ying Chu Ng. (1992), “Earning and Educations in Latin America”.
World Bank Working Paper Series No. 1056, World Bank. Washington, D.C. Pasacharapoulos, G. (1994), “Returns to Investment in Education: A Global Update”. World
Development. Vol. 22: Issue 9. Rizzuto, Ronald and Paul Watchtel (1980). Further Evidence on the Returns to School Quality”
Journal of Human Resources. 15:2, 240-254. Sabot, Richard (1989). “Human Capital Accumulation in Post-green Revolution Pakistan: Some
Preliminary Results. The Pakistan Development Review. Volume 28. No. 4. Part I Sabot, Richard (1992). “Human Capital Accumulation in Post Green Revolution Rural Pakistan: A
Progress Report. The Pakistan Development Review. Volume 31. No. 4. Part I Sawada, Yausyuki. (1997). “Human Capital Investment in Pakistan: Implications of Micro-
Evidence from Rural Pakistan”. The Pakistan Development Review. Volume 36, No. 4. Shabbir, T. and A. H. Khan (1991), “Mincerian Earning Functions for Pakistan: A Regional
Analysis”. Pakistan Economic and Social Review. Vol. XXIX, No. 2. Shabbir, Tayyab (1991), “Sheepskin Effects in the Returns to Education in a Developing Country”.
The Pakistan Development Review. Vol. 30, No. 1. Shabbir, Tayyab (1993), "Productivity-Enhancing Vs Credentialist Effects of Schooling in Rural
Pakistan". International Food Policy Research Institute. Shabbir, Tayyab (1994), “Mincerian Earning Functions for Pakistan”. The Pakistan Development
Review. Vol. 33, No. 1. Summers, Anita A. and Barbara L. Wolf (1977) “Do Schools Make a Difference”. American
Economic Review. 67:4, 634-652. van der Gaag, Jacques and Wim Vijverberg (1989), "Wage Determinants in Côte d’Ivorie:
Experience, Credentials and Human Capital." Economic Development and Cultural Change, 37:2.
25
Abstract This paper examines the role of education, technical training, school quality and literacy and numeracy skills on the earnings of wage earners and salaried persons in Pakistan by using the recent data of PIHS (1995-96). The analysis confirms the positive role of education as each year of education brings approximately 7 percent returns for wage earners. In addition, the effect of literacy and numeracy skills is observed to be large and significant. The returns are 15 percent higher for those who have all three skills as compared to those who do not possess any of these skills. The impact of technical training and private schools is found to be positive and significant. This paper draws three main policy implications. First, a large and significant impact of literacy and numeracy skills highlights the importance of basic learning skills that leads to higher wages in the labour market. This suggests the need of enhancing literacy and numeracy skills through formal as well as informal education. Second, a positive and significant association between earnings and higher level of technical training implies the urgent need of such institutions that can train individuals on modern lines in order to cope with the rapidly changing technology. And third, a large and significant coefficient of private schools highlights the importance of quality of education. The results suggests that more emphasis should be placed on market oriented approach in education. This requires the overhauling of public school system not only in terms of curriculum but also in teaching methods.