Embed Size (px)
Citation preview
Education
Statistics Digest
2017
Moulding The Future of Our Nation

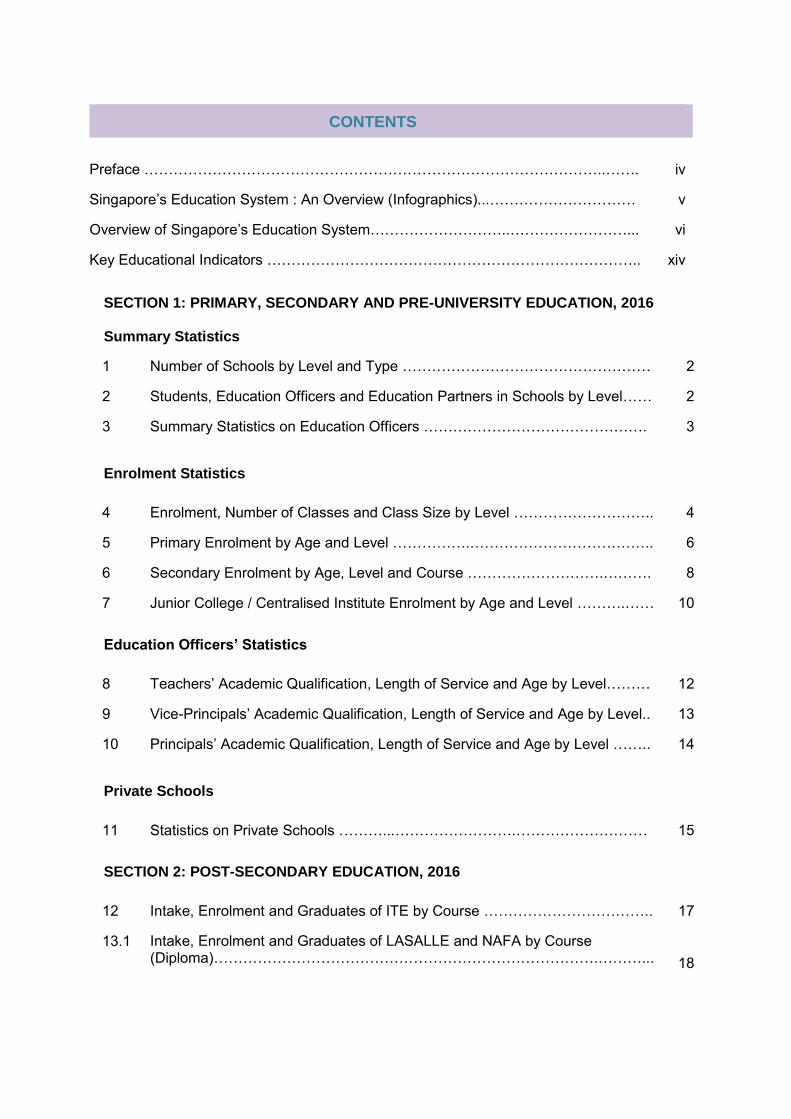
SECTION 1: PRIMARY, SECONDARY AND PRE-UNIVERSITY EDUCATION, 2016 Summary Statistics
1 Number of Schools by Level and Type …………………………………………… 2
2 Students, Education Officers and Education Partners in Schools by Level…… 2
3 Summary Statistics on Education Officers ………………………………………. 3
Enrolment Statistics
4 Enrolment, Number of Classes and Class Size by Level ……………………….. 4
5 Primary Enrolment by Age and Level …………….……………………………….. 6
6 Secondary Enrolment by Age, Level and Course ……………………….………. 8
7 Junior College / Centralised Institute Enrolment by Age and Level ……….…… 10
Education Officers’ Statistics
8 Teachers’ Academic Qualification, Length of Service and Age by Level……… 12
9 Vice-Principals’ Academic Qualification, Length of Service and Age by Level.. 13
10 Principals’ Academic Qualification, Length of Service and Age by Level …….. 14
Private Schools
11 Statistics on Private Schools ………...…………………….……………………… ……………………
15
SECTION 2: POST-SECONDARY EDUCATION, 2016
12 Intake, Enrolment and Graduates of ITE by Course …………………………….. 17
13.1 Intake, Enrolment and Graduates of LASALLE and NAFA by Course (Diploma)…………………………………………………………………….………...
18
CONTENTS
Preface …………………………………………………………………………………..……. iv
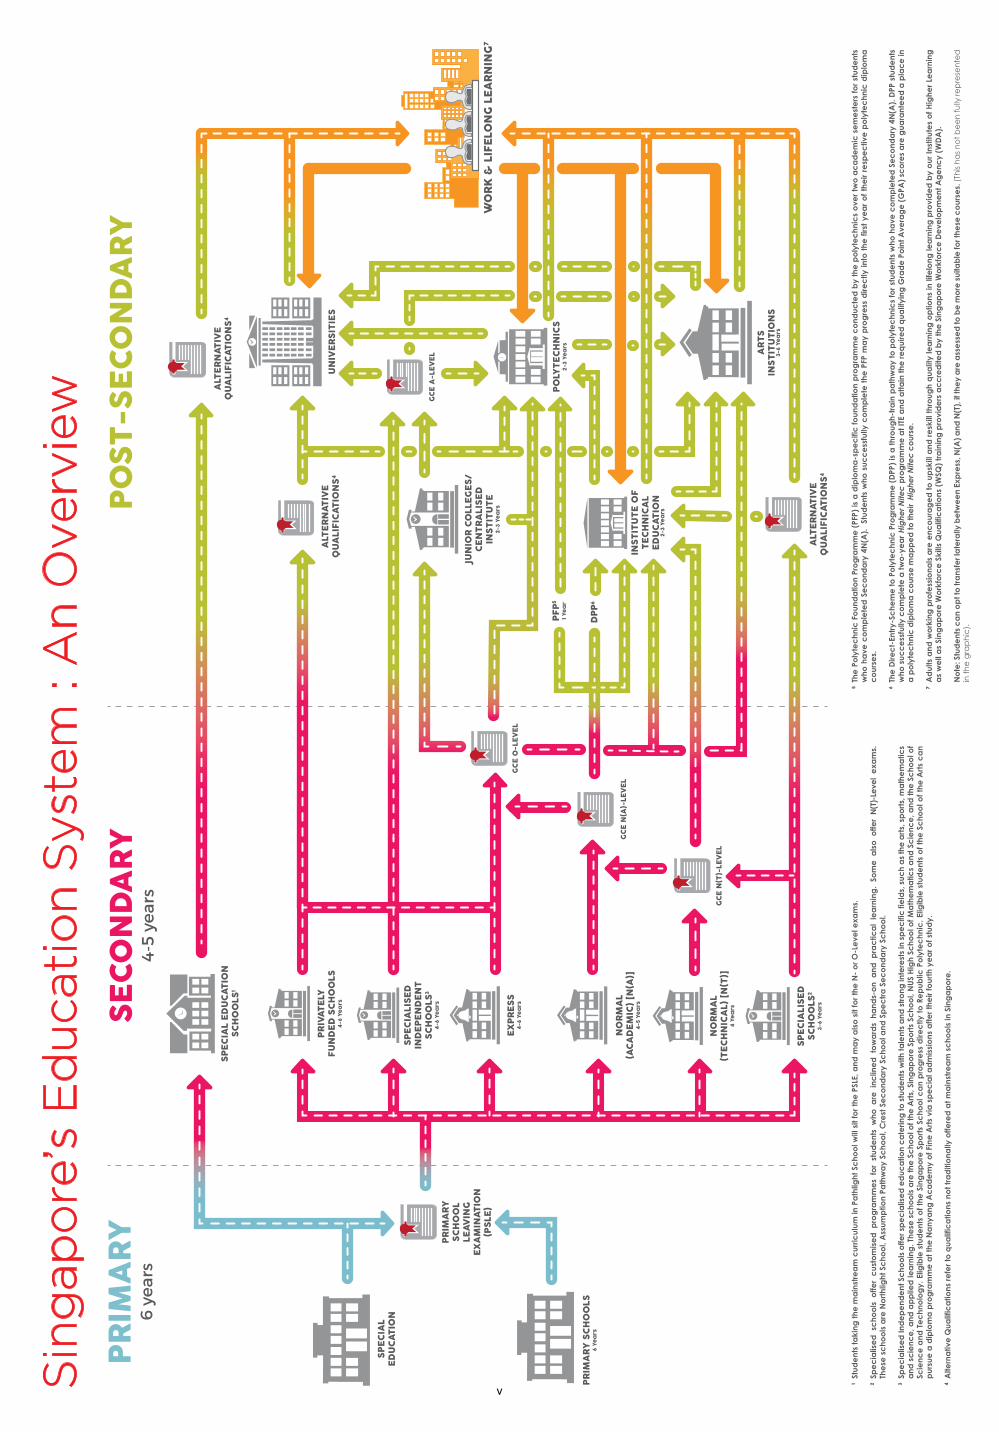
Singapore’s Education System : An Overview (Infographics)...………………………… v
Overview of Singapore’s Education System………………………..……………………... vi
Key Educational Indicators ………………………………………………………………….. xiv
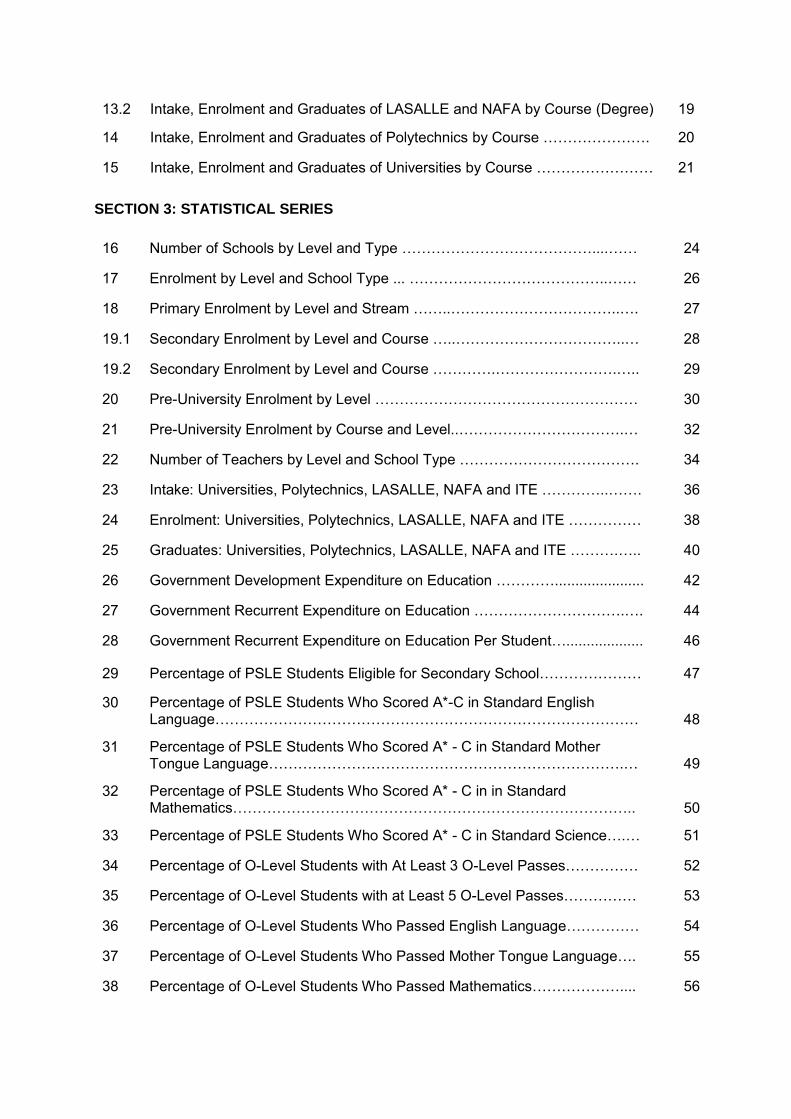
13.2 Intake, Enrolment and Graduates of LASALLE and NAFA by Course (Degree) 19
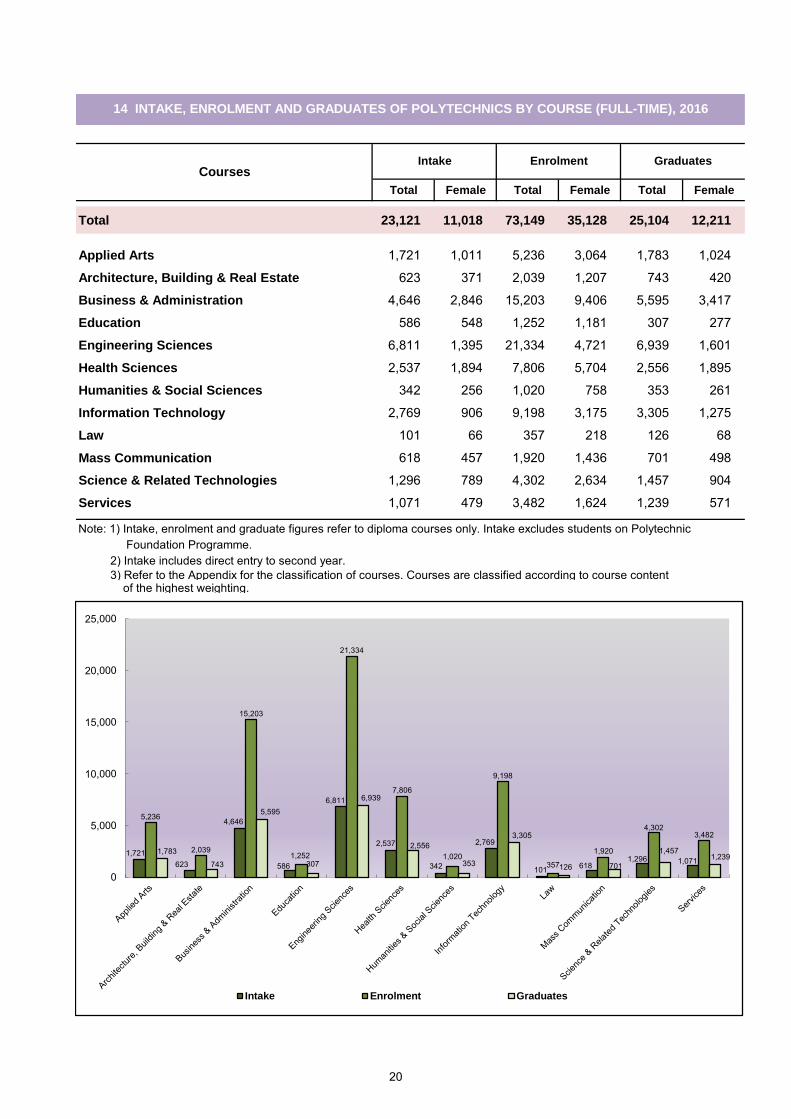
14 Intake, Enrolment and Graduates of Polytechnics by Course …………………. 20
15 Intake, Enrolment and Graduates of Universities by Course …………………… 21
SECTION 3: STATISTICAL SERIES
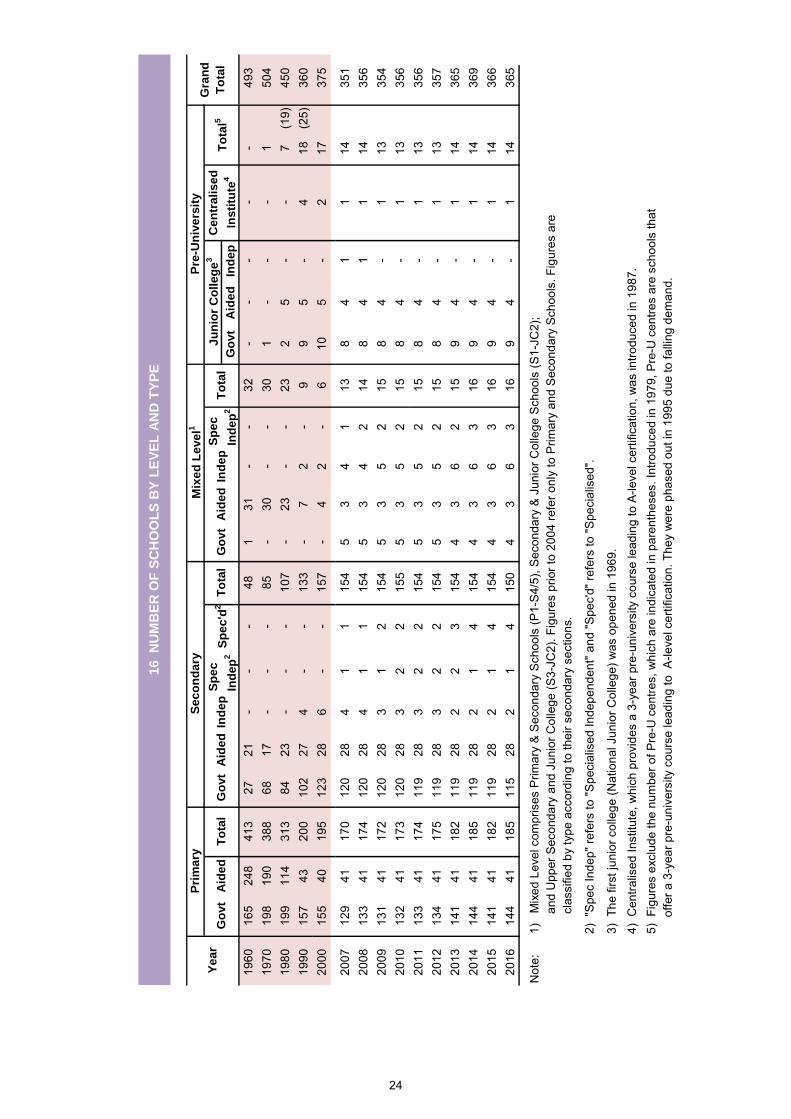
16 Number of Schools by Level and Type …………………………………....…… 24
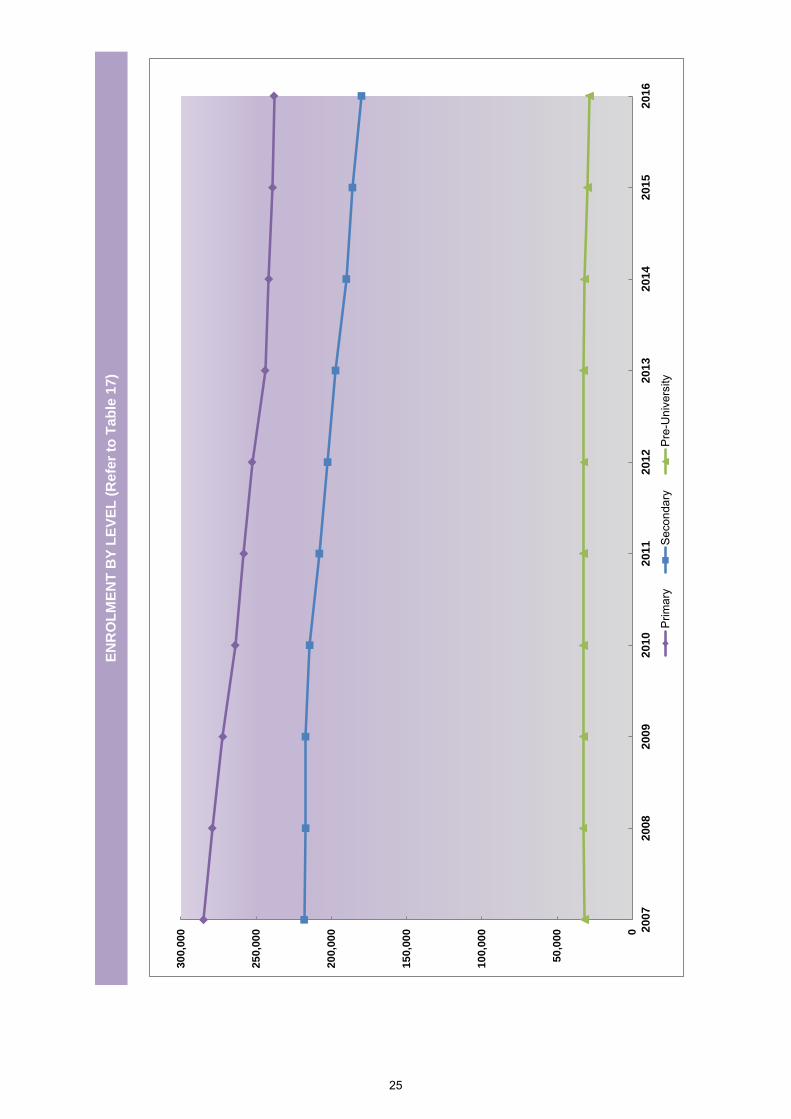
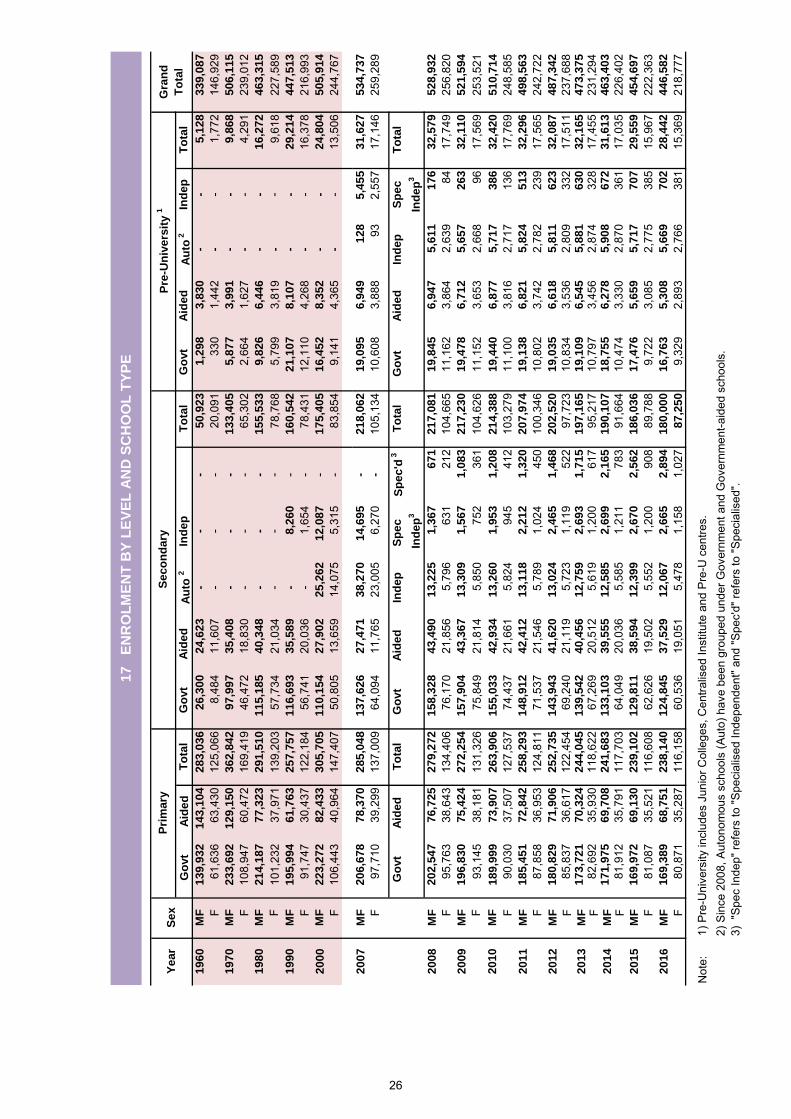
17 Enrolment by Level and School Type ... …………………………………..…… 26
18 Primary Enrolment by Level and Stream ……..……………………………..…. 27
19.1 Secondary Enrolment by Level and Course …..……………………………..… 28
19.2 Secondary Enrolment by Level and Course ………….…………………….….. 29
20 Pre-University Enrolment by Level ……………………………………………… 30
21 Pre-University Enrolment by Course and Level..…………………………….… 32
22 Number of Teachers by Level and School Type ………………………………. 34
23 Intake: Universities, Polytechnics, LASALLE, NAFA and ITE …………..……. 36
24 Enrolment: Universities, Polytechnics, LASALLE, NAFA and ITE …………… 38
25 Graduates: Universities, Polytechnics, LASALLE, NAFA and ITE ……….….. 40
26 Government Development Expenditure on Education …………...................... 42
27 Government Recurrent Expenditure on Education ………………………….…. 44
28 Government Recurrent Expenditure on Education Per Student…................... 46
29 Percentage of PSLE Students Eligible for Secondary School………………… 47
30 Percentage of PSLE Students Who Scored A*-C in Standard English Language…………………………………………………………………………… 48
31 Percentage of PSLE Students Who Scored A* - C in Standard Mother Tongue Language……………………………………………………………….… 49
32 Percentage of PSLE Students Who Scored A* - C in in Standard Mathematics……………………………………………………………………….. 50
33 Percentage of PSLE Students Who Scored A* - C in Standard Science….… 51
34 Percentage of O-Level Students with At Least 3 O-Level Passes…………… 52
35 Percentage of O-Level Students with at Least 5 O-Level Passes…………… ……………….……...
53
36 Percentage of O-Level Students Who Passed English Language…………… 54
37 Percentage of O-Level Students Who Passed Mother Tongue Language…. 55
38 Percentage of O-Level Students Who Passed Mathematics……………….... 56
39 Percentage of A-Level Students with at Least 3 ‘A’ / ‘H2’ Passes & Pass in GP / K&I..………………………………………………………………………….
57 40 Percentage of A-Level Students Who Passed General Paper or Knowledge
and Inquiry………………………………………………………………………… 58
41 Percentage of A-Level Students Who Passed Mother Tongue Language at ‘AO’/‘H1’ Level……………………………………………………………………… 59
42 Percentage of P1 Cohort That Progressed to Post-Secondary Education … 60
APPENDICES
Milestones in the Education System ……………………………….……………… 62
Classification of Courses in ITE, Polytechnics, LASALLE, NAFA and Universities……………………………………………………………………………. 70
PREFACE
We are pleased to present the 2017 edition of the Education Statistics Digest.
The Digest provides basic statistical information on education in Singapore in 2016. This information includes data on schools, enrolment, teachers, educational outcomes and finances. The Digest is divided into three sections.
a. The first section contains statistics on primary, secondary and pre-university education.
b. The second section covers post-secondary education i.e. the Institute of Technical Education (ITE), the two publicly-funded arts institutes (LASALLE College of the Arts and Nanyang Academy of Fine Arts (NAFA)), the polytechnics and the autonomous universities.
c. The third section shows time series on major education indicators to give you a historical perspective of the developments and trends in education over the years.
You can download these statistics and more in machine-readable format on www.data.gov.sg. We hope you find this information useful. If you have any queries, please email [email protected]. MANAGEMENT INFORMATION BRANCH RESEARCH AND MANAGEMENT INFORMATION DIVISION MINISTRY OF EDUCATION, SINGAPORE OCTOBER 2017
iv
Sin
gap
ore
’s E
du
cati
on
Syst
em
: A
n O
verv
iew
PO
ST-S
ECO
NDA
RYSE
CON
DARY
4-5
year
sPR
IMA
RY6
yea
rs
PRIM
ARY
SCH
OO
LS
6 Ye
ars
PRIM
ARY
SCH
OO
L LE
AVIN
GEX
AM
INAT
ION
(PSL
E)
SPEC
IAL
EDU
CATI
ON
SC
HO
OLS
1
SPEC
IALI
SED
IN
DEP
END
ENT
SCH
OO
LS3
4-6
Yea
rs
NO
RMA
L (A
CAD
EMIC
) [N
(A)]
4-
5 Ye
ars
NO
RMA
L (T
ECH
NIC
AL)
[N(T
)]
4 Ye
ars
EXPR
ESS
4-6
Yea
rs
SPEC
IALI
SED
SC
HO
OLS
2 3-
6 Ye
ars
PRIV
ATEL
Y FU
ND
ED S
CHO
OLS
4-
6 Ye
ars
GCE
N(A
)-LE
VEL
GCE
O-L
EVEL
GCE
N(T
)-LE
VEL
POLY
TECH
NIC
S2-
3 Ye
ars
UN
IVER
SITI
ES
ALT
ERN
ATIV
E Q
UA
LIFI
CATI
ON
S4
ALT
ERN
ATIV
E Q
UA
LIFI
CATI
ON
S4
ALT
ERN
ATIV
E Q
UA
LIFI
CATI
ON
S4
JUN
IOR
COLL
EGES
/ CE
NTR
ALI
SED
IN
STIT
UTE
2-
3 Ye
ars
ART
S IN
STIT
UTI
ON
S3-
6 Ye
ars
SPEC
IAL
EDU
CATI
ON
INST
ITU
TE O
FTE
CHN
ICA
LED
UCA
TIO
N
2-3
Yea
rs
GCE
A-L
EVEL
DPP
6
PFP5
1 Yea
r
WO
RK &
LIF
ELO
NG
LEA
RNIN
G7
Stud
ent
s ta
king
the
ma
inst
rea
m c
urric
ulum
in P
ath
light
Sc
hoo
l will
sit
for t
he P
SLE,
and
ma
y a
lso
sit
for t
he N
- o
r O-L
eve
l exa
ms.
Spe
cia
lise
d s
cho
ols
offe
r c
usto
mis
ed
pro
gra
mm
es
for
stud
ent
s w
ho a
re i
nclin
ed
to
wa
rds
hand
s-o
n a
nd p
rac
tica
l le
arn
ing
. So
me
als
o o
ffer
N(T
)-Le
vel
exa
ms.
Th
ese
sc
hoo
ls a
re N
ort
hlig
ht S
cho
ol,
Ass
ump
tion
Path
wa
y Sc
hoo
l, C
rest
Se
co
nda
ry S
cho
ol a
nd S
pe
ctr
a S
ec
ond
ary
Sc
hoo
l.
Spe
cia
lise
d In
de
pe
nde
nt S
cho
ols
offe
r sp
ec
ialis
ed
ed
uca
tion
ca
terin
g to
stu
de
nts
with
tale
nts
and
str
ong
inte
rest
s in
sp
ec
ific
fie
lds,
suc
h a
s th
e a
rts,
sp
ort
s, m
ath
em
atic
s a
nd s
cie
nce
, and
ap
plie
d le
arn
ing
. The
se s
cho
ols
are
the
Sc
hoo
l of t
he A
rts,
Sin
ga
po
re S
po
rts
Scho
ol,
NU
S H
igh
Scho
ol o
f Ma
the
ma
tics
and
Sc
ienc
e, a
nd th
e S
cho
ol o
f Sc
ienc
e a
nd T
ec
hno
log
y. E
ligib
le s
tud
ent
s o
f the
Sin
ga
po
re S
po
rts
Scho
ol c
an
pro
gre
ss d
irec
tly t
o R
ep
ublic
Po
lyte
chn
ic. E
ligib
le s
tud
ent
s o
f the
Sc
hoo
l of t
he A
rts
ca
n p
ursu
e a
dip
lom
a p
rog
ram
me
at t
he N
any
ang
Ac
ad
em
y o
f Fin
e A
rts
via
sp
ec
ial a
dm
issi
ons
afte
r the
ir fo
urth
ye
ar o
f stu
dy.
Alte
rna
tive
Qua
lific
atio
ns re
fer t
o q
ualif
ica
tions
no
t tra
diti
ona
lly o
ffere
d a
t ma
inst
rea
m s
cho
ols
in S
ing
ap
ore
.
The
Po
lyte
chn
ic F
oun
da
tion
Pro
gra
mm
e (
PFP)
is a
dip
lom
a-s
pe
cifi
c fo
und
atio
n p
rog
ram
me
co
nduc
ted
by
the
po
lyte
chn
ics
ove
r tw
o a
ca
de
mic
se
me
ste
rs fo
r st
ude
nts
who
ha
ve c
om
ple
ted
Se
co
nda
ry 4
N(A
).
Stud
ent
s w
ho s
ucc
ess
fully
co
mp
lete
the
PFP
ma
y p
rog
ress
dire
ctly
into
the
firs
t ye
ar
of
the
ir re
spe
ctiv
e p
oly
tec
hnic
dip
lom
a
co
urse
s.
The
Dire
ct-
Entr
y-Sc
hem
e to
Po
lyte
chn
ic P
rog
ram
me
(D
PP)
is a
thro
ugh-
tra
in p
ath
wa
y to
po
lyte
chn
ics
for s
tud
ent
s w
ho h
ave
co
mp
lete
d S
ec
ond
ary
4N
(A).
DPP
stu
de
nts
who
suc
ce
ssfu
lly c
om
ple
te a
two
-ye
ar
p
rog
ram
me
at I
TE a
nd a
ttain
the
req
uire
d q
ualif
ying
Gra
de
Po
int A
vera
ge
(G
PA)
sco
res
are
gua
rant
ee
d a
pla
ce
in
a p
oly
tec
hnic
dip
lom
a c
our
se m
ap
pe
d to
the
ir
co
urse
.
Ad
ults
and
wo
rkin
g p
rofe
ssio
nals
are
enc
our
ag
ed
to u
psk
ill a
nd r
esk
ill th
roug
h q
ualit
y le
arn
ing
op
tions
in li
felo
ng le
arn
ing
pro
vid
ed
by
our
Inst
itute
s o
f Hig
her
Lea
rnin
g
as
we
ll a
s Si
nga
po
re W
ork
forc
e S
kills
Qua
lific
atio
ns (
WSQ
) tr
ain
ing
pro
vid
ers
ac
cre
dite
d b
y th
e S
ing
ap
ore
Wo
rkfo
rce
De
velo
pm
ent
Ag
enc
y (W
DA
).
No
te: S
tud
ent
s c
an
op
t to
tra
nsfe
r la
tera
lly b
etw
ee
n Ex
pre
ss, N
(A)
and
N(T
), if
the
y a
re a
sse
sse
d to
be
mo
re s
uita
ble
for t
hese
co
urse
s. (
This
ha
s n
ot b
ee
n fu
lly re
pre
sen
ted
in
th
e g
rap
hic
).
1 2 3 4
5 6 7
Hig
her N
itec
Hig
her N
itec
v
OVERVIEW OF SINGAPORE’S EDUCATION SYSTEM
Singapore's education system aims to bring out the best in every child by
enabling students to discover their talents, realise their full potential, and develop a passion for life-long learning. We seek to nurture the whole child, and help them develop an enduring core of competencies, values and character, to ensure that they have the capabilities and dispositions to thrive in the 21st century. Our multiple educational pathways cater to students with different strengths, interests and learning styles, developing each child to his full potential.
Our schools provide a rich diversity of learning experiences for our students. On top of building a strong foundation in literacy and numeracy, we also cater to their educational needs in physical, aesthetic, moral, social and emotional aspects and develop them holistically. Besides the academic curriculum, our students can develop their interest and talent in music, arts and sports through co-curricular programmes and outdoor education. These activities also give them opportunities to hone their leadership skills as well as social and emotional competencies. There are opportunities to contribute to communities around the school through various Values-in-Action programmes, which are an integral part of school life. In addition, our schools offer enrichment activities to cater to students’ learning interests, and education and career guidance that offer perspectives beyond the classroom.
All these learning experiences help cultivate in our students qualities such as creativity, collaboration and compassion – life skills essential in a rapidly-changing world. Through nurturing the joy of learning and encouraging ‘entrepreneurial dare’, our students can develop the intrinsic motivation to explore and discover their interests as well as act on and pursue their passions. We also want to inculcate in them values such as respect, responsibility, resilience, integrity, care and harmony, all of which are important for a cohesive multi-racial and multi-cultural society.
The bilingual policy is a cornerstone of our education system which requires students to offer two languages: English Language and a Mother Tongue Language (MTL). This equips them with the language and cultural competencies to use their MTL as a living language and appreciate their culture and heritage. It also enables them to connect with people from different backgrounds in a multi-cultural environment, to give them a competitive edge in engaging regional counterparts and thrive in a globalised world.
Teachers, allied educators and school leaders form the core of Singapore’s education system. We are committed to nurturing and motivating our teachers to grow and reach their personal and professional best, in line with their aspirations and interests. Our teachers receive comprehensive pre-service training at the National Institute of Education and have many opportunities for continual development to build up their capabilities as teaching professionals. This is complemented by the teacher academies, language institutes and learning communities, which help to foster a strong culture of dedication, collaborative learning and professional excellence.
Parents are our key partners in delivering a holistic education. Their involvement and support in school programmes is crucial. To this end, we encourage
vi
parents and the community to work together with schools to create a conducive learning environment in schools, at home and within the community. PRIMARY EDUCATION
At the primary level, students go through a compulsory six-year course designed to give them a strong educational foundation. This includes developing language and numeracy skills, building character and nurturing sound values and good habits.
Core to the primary education curriculum are English Language, Mathematics and Mother Tongue Language, which help our students develop literacy, numeracy and problem-solving skills – skills that will be useful even beyond school.
Students also take subjects like Art, Music, Character and Citizenship
Education, Social Studies and Physical Education. Science is introduced from Primary 3 onwards. These subjects expose our students to different areas of study at an early stage to allow them to discover their interests and talents, equip them holistically with a range of knowledge and skills, and provide teachable moments to develop in them the core values that define a person’s character and their sense of responsibility to society.
After the initial foundation stage (Primary 1 to Primary 4), students can take
English Language, Mathematics, Mother Tongue Language and Science at either the foundation or standard level at Primary 5 and Primary 6. Students who do well in their Mother Tongue Language may also offer Higher Mother Tongue Language. Throughout primary school, teachers consider the ability of their students in designing lessons and assessment tasks. Students therefore learn at a pace that best suits them.
Schools have programmes to level up students, to ensure that help is at hand
for students who need it. These programmes ensure that students are able to keep up with core subjects like English and Mathematics, regardless of their starting point. Students receive more attention through small-group teaching by specially trained teachers using structured teaching approaches that meet their learning needs. At the other end of the spectrum, we have the Gifted Education Programme (GEP) for high ability learners. Students with high ability in specific subjects who are not in the GEP can also benefit from the enriched learning derived from school-based and MOE-run activities during or after school hours.
We will continuously seek to make learning more enjoyable and meaningful for
students while developing the desired skills and values that will put them in good stead for the future. Over the next few years, we will place greater emphasis on engaging teaching methods and holistic assessment, and providing opportunities for lower primary students to try out more sports, outdoor education and arts activities through the Programme for Active Learning (PAL). Upper primary students can take part in the revised Junior Sports Academy programme to explore and discover their strength and passion in a range of sports.
At the end of Primary 6, students take the Primary School Leaving Examination (PSLE), which assesses their suitability for secondary education and places them in the
vii
secondary school course that suits their pace of academic learning and aptitude. Students can also seek admission to a secondary school based on their achievements and talents across a diverse range of areas (such as art and sports) through the Direct School Admission exercise. SECONDARY EDUCATION At the secondary level, we offer three core courses designed to match students’ academic progress and interests.
Express Course. This is a four-year course leading to the Singapore-Cambridge General Certificate of Education (GCE) O-Level exam. Students learn English and Mother Tongue Languages,1 as well as Mathematics, the Sciences and the Humanities.
Normal (Academic) (N(A)) Course. This is a four-year course leading to the
GCE N(A)-Level exam. Students learn subjects similar to those in the Express course. Those who do well at the N(A)-Level will qualify for an additional year to prepare for the O-Level exam, or progress to Higher Nitec courses at the Institute of Technical Education (ITE). Selected students may sit for the O-Level exam in some subjects at Secondary 4, or bypass the N(A)-Level exam and progress directly to Secondary 5 to take the O-Level exam. Since 2013, students who do well at the N(A)-Level have two “through-train” pathways to the polytechnics – (i) a one-year Polytechnic Foundation Programme (PFP) and (ii) a two-year Direct-Entry-Scheme to Polytechnic Programme (DPP).
Normal (Technical) (N(T)) Course. This is a four-year course leading to the GCE
N(T)-Level exam. Students learn English and Mother Tongue Languages, Mathematics and subjects with technical or practical emphases, and the curriculum is regularly reviewed to enhance experiential and practice-oriented learning. Schools also offer Elective Modules, which cover a wide range of subjects including nursing, hospitality, digital animation and precision engineering.
While students may initially be placed in a particular course, there are
opportunities for lateral transfers mid-stream. Upper secondary students in the N(A) and N(T) courses may also take some subjects at a higher academic level if they perform well in these subjects. This flexibility is also being prototyped at the lower secondary level in 12 schools, and will be extended to all secondary schools offering the N(A) or N(T) course by 2018. The following schools form part of our diverse secondary school landscape, where there is a range of schools to suit the unique needs of every child:
Specialised Schools and Specialised Schools for Normal (Technical) Students. NorthLight School and Assumption Pathway School are Specialised Schools (SSes) catering to students who did not qualify for secondary school courses. Students graduate from these two schools with the ITE Skills
1 Students can opt to study Mother Tongue at either the standard, higher or Syllabus B levels depending on their ability and eligibility.
viii
Certificate (ISC), which prepares them for employment or admission into the ITE. Crest Secondary School and Spectra Secondary School are Specialised Schools for Normal (Technical) Students (SSNTs) that cater to students who are eligible for the N(T) course and prefer a hands-on and applied learning experience. Students from the two SSNTs offer the ISC as well as N(T) level English Language and Mathematics.
Specialised Independent Schools. The NUS High School of Mathematics and Sciences, School of Science and Technology, School of the Arts and Singapore Sports School develop students in areas such as Mathematics, the Sciences, the Arts and Sports at a higher level.
Integrated Programme. Some schools offer the Integrated Programme, a six-year programme for academically-strong students who prefer a more independent and less structured learning approach. Students in this programme proceed to pre-university education without sitting for the O-Level exam. Given the strong academic aptitude of its students, the programme stretches the potential of its students in non-academic aspects by engaging them in broader learning experiences. Students sit for the pre-university exams at the end of six years.
All secondary schools have distinctive programmes to better support students’
interests and talents. In particular, the Applied Learning Programme (ALP) and Learning for Life Programme (LLP) complement core academic and student development programmes, offering students more opportunities to pursue learning in line with their interests, while helping them develop 21st century competencies through applying classroom learning to real-life issues, and acquiring life-skills in authentic contexts.
To promote the holistic development of our students, all secondary schools
have access to quality art and music programmes. In addition, the Art and Music Elective Programmes, as well as the Enhanced Art and Music Programmes, enable students with keen disposition and capability in art and music to further develop their passion and talent. The revised Physical Education syllabus will see students engaging in a wider range of physical activities and sports and develop character and values in the process. Outdoor Education will also be enhanced to imbue in students resilience, ruggedness, tenacity and the ability to work well in teams, through experiences that cannot be replicated in classrooms.
To help students make better informed education and career choices in school
and beyond, a more structured and comprehensive Education and Career Guidance (ECG) system is being put in place to provide relevant and timely support at different life stages. The ECG curriculum is being enhanced with the deployment of a professional core of ECG counsellors as well as an online ECG portal that offers customised profiling and assessment tools and resources, as well as information on the education, training and career options available to individuals at different life stages. ECG fairs are also organised in collaboration with industry partners and post-secondary education institutions to bring the world of work to students and teachers.
ix
POST-SECONDARY EDUCATION After Secondary 4 or Secondary 5, most students proceed to one of the following post-secondary education institutions.
Junior Colleges / Centralised Institute. Students can apply for pre-university education at the junior colleges (two-year course) or centralised institute (three-year course) leading to the GCE A-Level exam or the International Baccalaureate Diploma Programme for Anglo-Chinese School (Independent), Singapore Sports School, School of The Arts and St Joseph’s Institution. The junior colleges and centralised institute offer a wide range of elective programmes and subjects. To ensure a good breadth of skills and knowledge, students take at least one contrasting subject, i.e. at least one subject from Mathematics and the Sciences and at least one subject from the Humanities and the Arts. To nurture social and emotional competencies and life skills, students are given ample opportunities to participate in Values-in-Action programmes that help them cultivate qualities such as initiative, leadership, social responsibility, and strength of character.
Polytechnics. Students with O-Level certificates, Nitec or Higher Nitec
qualifications may apply for full-time diploma courses at any of the five polytechnics. Those with other qualifications such as A-Level certificates may also be considered. Students with N-Level certificates may apply for a place in the polytechnics through the Polytechnic Foundation Programme, which admits students to the foundation year of a specific diploma course. The polytechnics offer a wide range of courses that equips students with industry-relevant skills, to prepare them for careers in fields such as engineering, applied sciences and biotechnology, info-communications, health sciences, early childhood education, business studies, accountancy, social sciences, mass communications, and digital media. Polytechnic graduates who wish to further their studies may be considered for admission to the universities based on their diploma qualifications.
Institute of Technical Education (ITE). Students with O- or N-Level
certificates can opt for full-time courses at ITE. These courses lead to the Nitec or Higher Nitec qualifications. Apart from full-time institutional training, students can also acquire skills certification through traineeship programmes conducted jointly by companies and ITE. ITE also offers Technical Diploma programmes in collaboration with foreign partners, in niche areas such as automotive engineering and culinary arts, to provide additional pathways for skills upgrading. ITE taps on industry expertise via its extensive partnerships and collaborations to ensure its graduates are well-equipped with skills needed by the industry. Those who are interested in furthering their education can also be considered for admission to the polytechnics based on their Nitec or Higher Nitec qualifications.
Arts Institutions. Students interested in the creative arts can enrol in
programmes offered by the LASALLE College of the Arts or the Nanyang Academy of Fine Arts (NAFA). These institutions offer a range of publicly-funded degree and diploma programmes in the visual and performing arts, such as music, theatre, dance, interior design and fashion design.
x
Universities Our universities prepare students not only for today’s economy but also for a future one with new jobs and challenges that do not exist today. There are six publicly-funded universities in Singapore, each of which are described below.
National University of Singapore (NUS) is a research-intensive university with 16 faculties and schools, including a music conservatory. Aside from traditional undergraduate programmes, NUS also offers other programmes such as the University Scholars Programme, which provides an inter-disciplinary academic experience, and a four-year liberal arts degree programme at the Yale-NUS College. NUS offers a wide range of graduate programmes, including specialised graduate programmes offered by its Graduate School for Integrative Sciences and Engineering, the Saw Swee Hock School of Public Health, the Lee Kuan Yew School of Public Policy, and the Duke-NUS Medical School. NUS collaborates with other universities to enrich their undergraduates’ educational experience and student life through dual degree and other joint programmes, research opportunities, and student exchange programmes.
Nanyang Technological University (NTU) is a comprehensive, research-
intensive university with a strong focus on engineering, science, and technology. It has five Colleges offering undergraduate and postgraduate programmes in various areas, and five autonomous entities – the Chinese Heritage Centre, Earth Observatory of Singapore, National Institute of Education, S. Rajaratnam School of International Studies, and Singapore Centre for Environmental Life Sciences Engineering. NTU also has a medical school, the Lee Kong Chian School of Medicine, which was established in collaboration with Imperial College London and admitted its first batch of medical students in 2013. NTU collaborates with many overseas institutions to offer dual degree and other joint programmes, research opportunities, and student exchange programmes.
Singapore Management University (SMU) offers undergraduate and
postgraduate business and social science programmes at its six schools. SMU is known for its interactive pedagogy of seminar-style teaching in small class sizes. In addition to offering single degree programmes with a second major, SMU undergraduates may pursue a double degree at any of its six schools. SMU hosts a wide range of research activities focusing on the social sciences, including research institutes such as the Behavioural Sciences Institute.
Singapore University of Technology & Design (SUTD) was established in
collaboration with the Massachusetts Institute of Technology and Zhejiang University. It is a small, top-tier research-intensive university focusing on design education in engineering and architecture, and leverages its partner universities’ strong tradition of engineering excellence and entrepreneurial spirit. SUTD also hosts an International Design Centre (IDC) that conducts world-class research on technologically-intensive design. SUTD collaborates extensively with reputable universities and industry partners, both locally and overseas, to enhance student learning through meaningful student exchanges, internship and research opportunities, and joint/dual degree programmes.
xi
Singapore Institute of Technology (SIT) offers degree programmes in
partnership with reputable overseas universities in sectors such as engineering and applied sciences, health sciences, design, and interactive digital media. SIT also offers its own applied degrees in sectors such as sustainable infrastructure engineering, pharmaceutical engineering, information & communications technology, hospitality, and accountancy.
SIM University (UniSIM)2 provides a distinct practice-oriented and applied
educational experience. It offers flexibility across different modes of learning for working professionals and adult learners to balance their career, family and academic priorities. It adopts an admissions model that takes into account prior learning and work experience, and its diverse student profile allows fresh school leavers to take classes alongside more mature part-time students with work experience, which provides a rich and unique learning experience. In addition to its diverse range of part-time degree programmes, UniSIM began offering full-time degree programmes in 2014. It currently offers full-time degree programmes in accountancy, marketing, finance, human resource management, supply chain management and social work.
LIFELONG LEARNING
Learning does not end after individuals enter the workforce. Adults who wish to deepen their skills or acquire new ones can undergo continual learning in post-secondary education institutions. These institutions provide a wide range of learning options for adults, which help to address manpower and skills gaps, support industry development and job creation, facilitate education and career transition via various pathways, and enable the workforce to stay employable amidst rapid shifts in the economic landscape.
ITE offers part-time Nitec, Higher Nitec, Specialist Nitec and ITE Skills Certificate courses. They are offered in modular form, giving participants the flexibility to sign up for training based on their needs. Adult learners can also undergo on-the-job (OJT) training at companies that are Certified OJT Centres, as well as attend in-house courses conducted by ITE’s Approved Training Centres. ITE also conducts skills evaluation tests for experienced workers, in addition to instructional skills and related programmes for industry trainers. For adult learners who wish to resume or continue with academic upgrading at the secondary level, ITE offers MOE-subsidised lessons from Secondary One Normal to N- and O-Level under its General Education Programme.
The polytechnics offer part-time programmes at diploma and post-diploma level,
covering areas such as engineering, environmental technology, chemical processes, pharmaceuticals, electronics, construction, aerospace, marine & offshore, logistics, business, accounting & finance, security, infocomm technology & digital media, early childhood education, healthcare, sports, retail and tourism.
2 SIM University (UniSIM) was renamed as the Singapore University of Social Sciences (SUSS) in 2017.
xii

Part-time diploma courses are designed to be modular and more compact than full-time diploma courses, to provide more flexible and accessible upgrading opportunities for adults with working experience.
Post-diploma courses cater to working professionals who are diploma or degree holders. They are modular, shorter in duration than diploma courses, and mostly designed for part-time study. These include the Advanced Diploma and Specialist Diploma courses that cater to adults seeking to deepen their skills and knowledge in the field they are trained or practising in, and Diploma (Conversion) courses that cater to adults seeking training in a different discipline so as to facilitate career switches.
The universities offer part-time degree courses at both undergraduate and
postgraduate levels. NUS offers part-time undergraduate programmes leading to a Bachelor of Technology while NTU offers part-time Bachelor of Engineering programmes. Both universities also offer part-time postgraduate courses for degree holders. UniSIM offers a range of more than 50 part-time undergraduate and postgraduate courses in arts and social sciences, business, human development & social services and science & technology.
With SkillsFuture, more options to encourage lifelong learning are being made available for all Singaporeans. Fresh polytechnic and ITE graduates have access to SkillsFuture Earn and Learn Programmes (ELPs), which are work-learn programmes featuring both workplace-based learning and institution-based instruction. The ELPs provide polytechnic and ITE graduates with more opportunities to build on the skills and knowledge they acquired in school after graduation, and to better support their transition into the workforce. This gives them a head-start in careers related to their discipline of study.
Skills-Based Modular Courses were also introduced at the polytechnics and
publicly-funded universities to provide adult learners with a more flexible and bite-sized learning option. They can tap on these courses to acquire industry relevant skills to help them stay responsive to a changing workplace.
. . . . .
xiii
KEY EDUCATIONAL INDICATORS
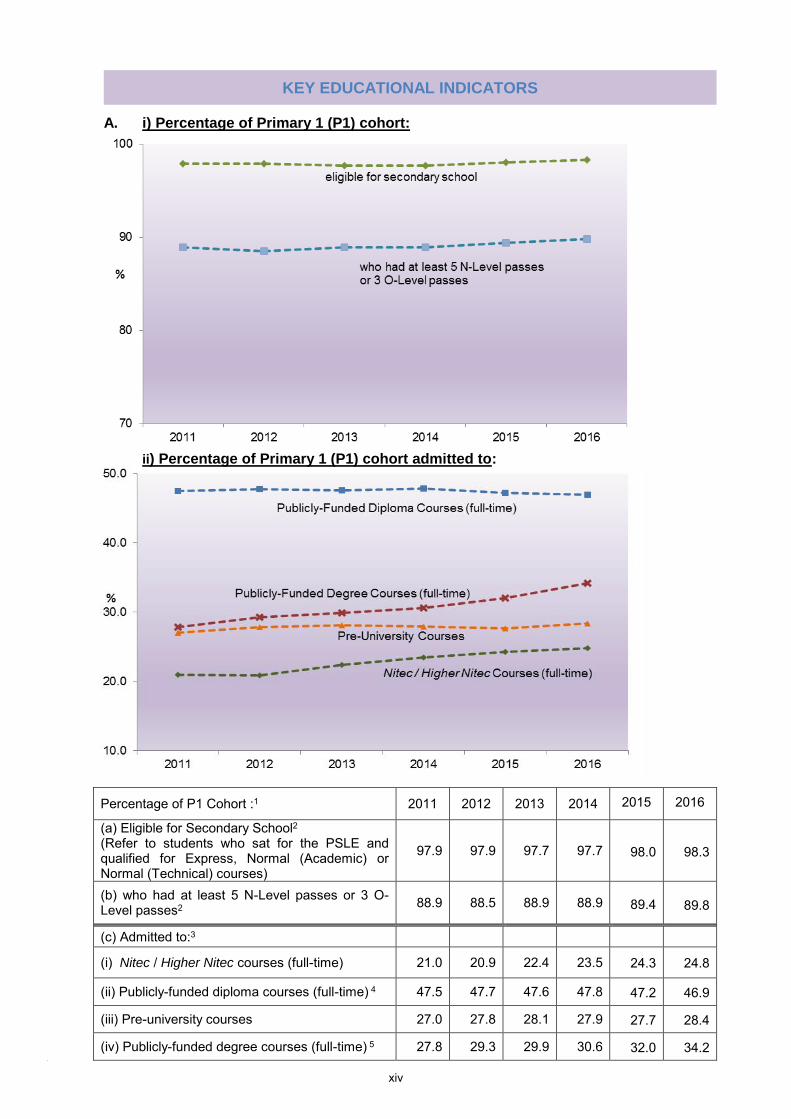
A. i) Percentage of Primary 1 (P1) cohort:
ii) Percentage of Primary 1 (P1) cohort admitted to:
Percentage of P1 Cohort :1 2011 2012 2013 2014 2015 2016
(a) Eligible for Secondary School2 (Refer to students who sat for the PSLE and qualified for Express, Normal (Academic) or Normal (Technical) courses)
97.9 97.9 97.7 97.7 98.0 98.3
(b) who had at least 5 N-Level passes or 3 O-Level passes2 88.9 88.5 88.9 88.9
89.4 89.8
(c) Admitted to:3
(i) Nitec / Higher Nitec courses (full-time) 21.0 20.9 22.4 23.5 24.3 24.8
(ii) Publicly-funded diploma courses (full-time) 4 47.5 47.7 47.6 47.8 47.2 46.9
(iii) Pre-university courses 27.0 27.8 28.1 27.9 27.7 28.4
(iv) Publicly-funded degree courses (full-time) 5 27.8 29.3 29.9 30.6 32.0 34.2
xiv
Note: 1. For indicators (a) and (b), figures for 2014 – 2016 are preliminary. For indicators (c(i)) to (c(iv)), figures for 2012 to 2016 are preliminary. 2. For a given year, the statistics are calculated based on the P1 cohort that would typically sit for these exams in that year. For example, for 2016, the percentage of the P1 cohort eligible for secondary school is calculated based on the cohort that entered P1 in 2011, and the percentage of the P1 cohort that had at least 5 N-Level or 3 O-Level passes is calculated based on the cohort that entered P1 in 2007. These figures may be different from those shown in Tables 29 to 41 as the latter are based on exam candidatures and not P1 cohorts i.e. they would include students who enter the school system after P1 and exclude those who left the country after P1. 3. Students who enrol in one course may progress subsequently to another course and are accounted for under both types of courses. For example, polytechnic students who progress to university will be accounted for under both publicly-funded diploma and degree courses. Figures for indicators (c(i)) to (c(iii)) are based on P1 cohorts from 10 years prior while indicator (c(iv)) is based on P1 cohort from 12 years prior to the year of reporting.
4. Publicly-funded diploma courses are offered by the five Polytechnics, ITE, LASALLE College of the Arts and Nanyang Academy of Fine Arts (NAFA). 5. Publicly-funded degree courses are offered by NUS, NTU, SMU, SUTD, SIT, UniSIM, LASALLE and NAFA.
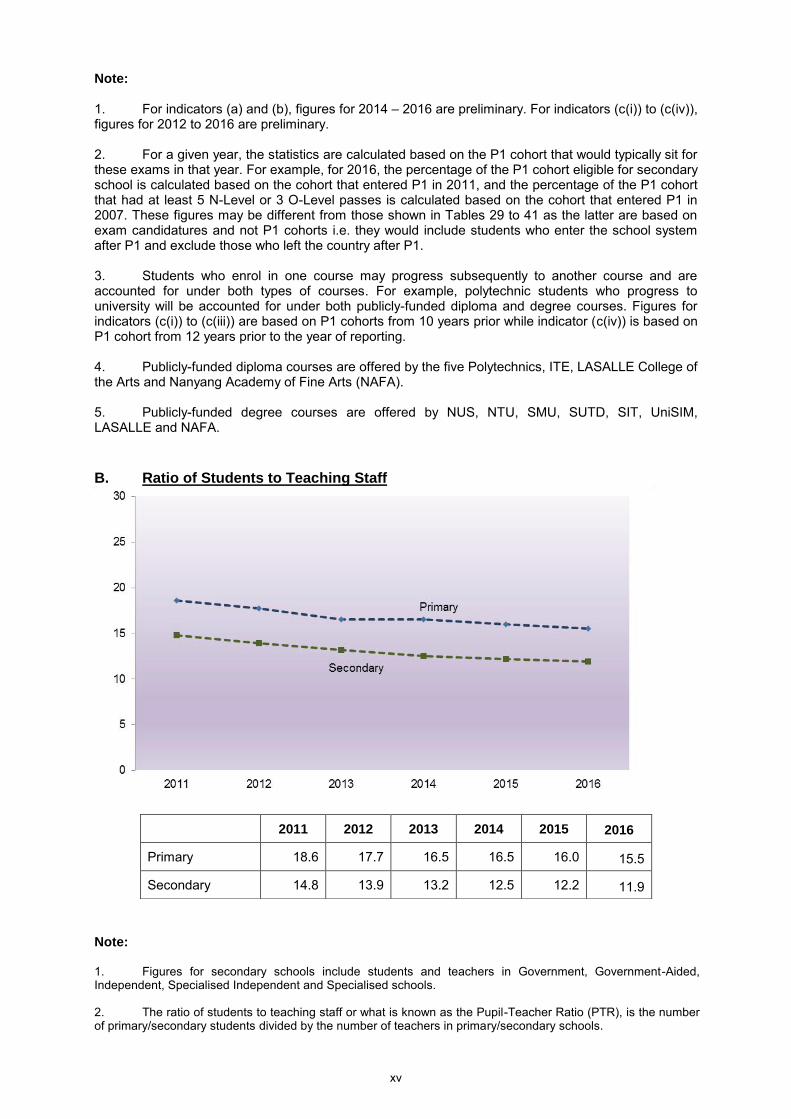
B. Ratio of Students to Teaching Staff
Note: 1. Figures for secondary schools include students and teachers in Government, Government-Aided, Independent, Specialised Independent and Specialised schools. 2. The ratio of students to teaching staff or what is known as the Pupil-Teacher Ratio (PTR), is the number of primary/secondary students divided by the number of teachers in primary/secondary schools.
2011 2012 2013 2014 2015 2016
Primary 18.6 17.7 16.5 16.5 16.0 15.5
Secondary 14.8 13.9 13.2 12.5 12.2 11.9
xv
Type of
School
Total
Government
Govt-Aided
IndependentSpecialised IndependentSpecialised
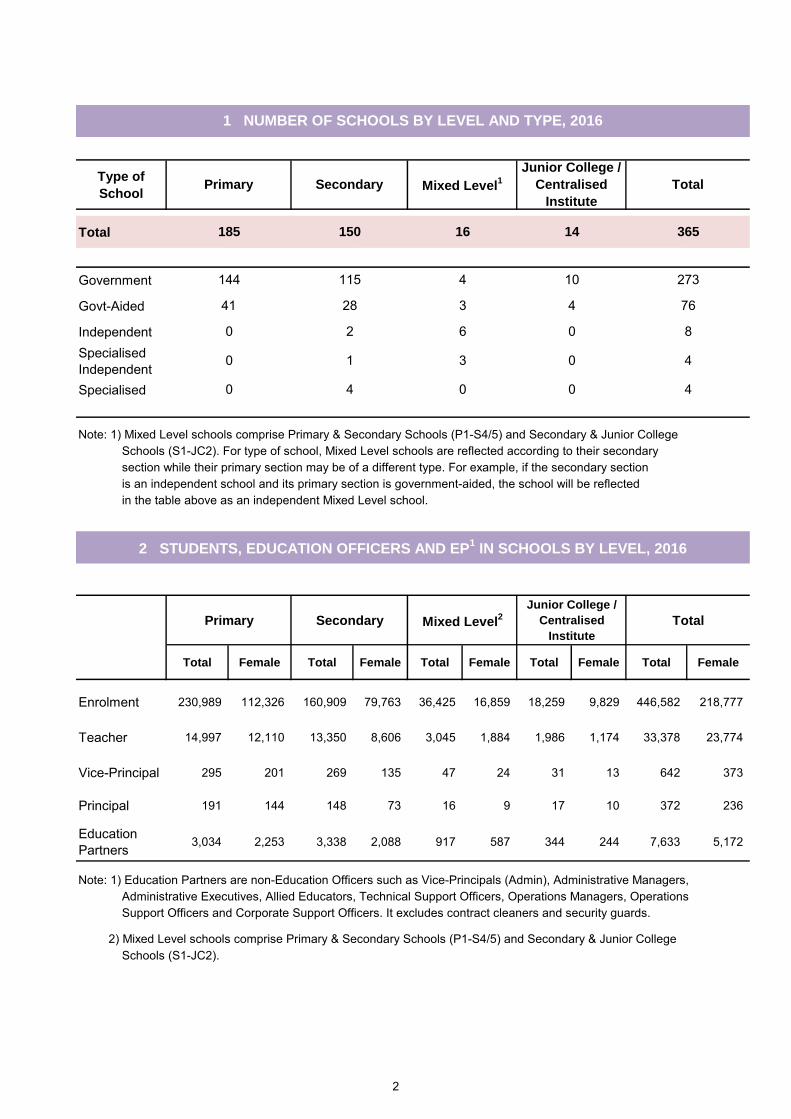
Note: 1) Mixed Level schools comprise Primary & Secondary Schools (P1-S4/5) and Secondary & Junior College Schools (S1-JC2). For type of school, Mixed Level schools are reflected according to their secondary section while their primary section may be of a different type. For example, if the secondary section is an independent school and its primary section is government-aided, the school will be reflected in the table above as an independent Mixed Level school.
Primary Secondary Mixed Level2
Junior College /
Centralised
Institute
Total
Total Female Total Female Total Female Total Female Total Female
Enrolment 230,989 112,326 160,909 79,763 36,425 16,859 18,259 9,829 446,582 218,777
Teacher 14,997 12,110 13,350 8,606 3,045 1,884 1,986 1,174 33,378 23,774
Vice-Principal 295 201 269 135 47 24 31 13 642 373
Principal 191 144 148 73 16 9 17 10 372 236
Education Partners 3,034 2,253 3,338 2,088 917 587 344 244 7,633 5,172
Note: 1) Education Partners are non-Education Officers such as Vice-Principals (Admin), Administrative Managers, Administrative Executives, Allied Educators, Technical Support Officers, Operations Managers, Operations Support Officers and Corporate Support Officers. It excludes contract cleaners and security guards.
2) Mixed Level schools comprise Primary & Secondary Schools (P1-S4/5) and Secondary & Junior College Schools (S1-JC2).
4
185 150 16 14 365
273
76
8
4
4 0
10
4
0
0
0
4
3
6
3
1 NUMBER OF SCHOOLS BY LEVEL AND TYPE, 2016
144
41
2 STUDENTS, EDUCATION OFFICERS AND EP1 IN SCHOOLS BY LEVEL, 2016
Primary Secondary Mixed Level1
Junior College /
Centralised
Institute
Total
0
0
0
115
28
2
1
2
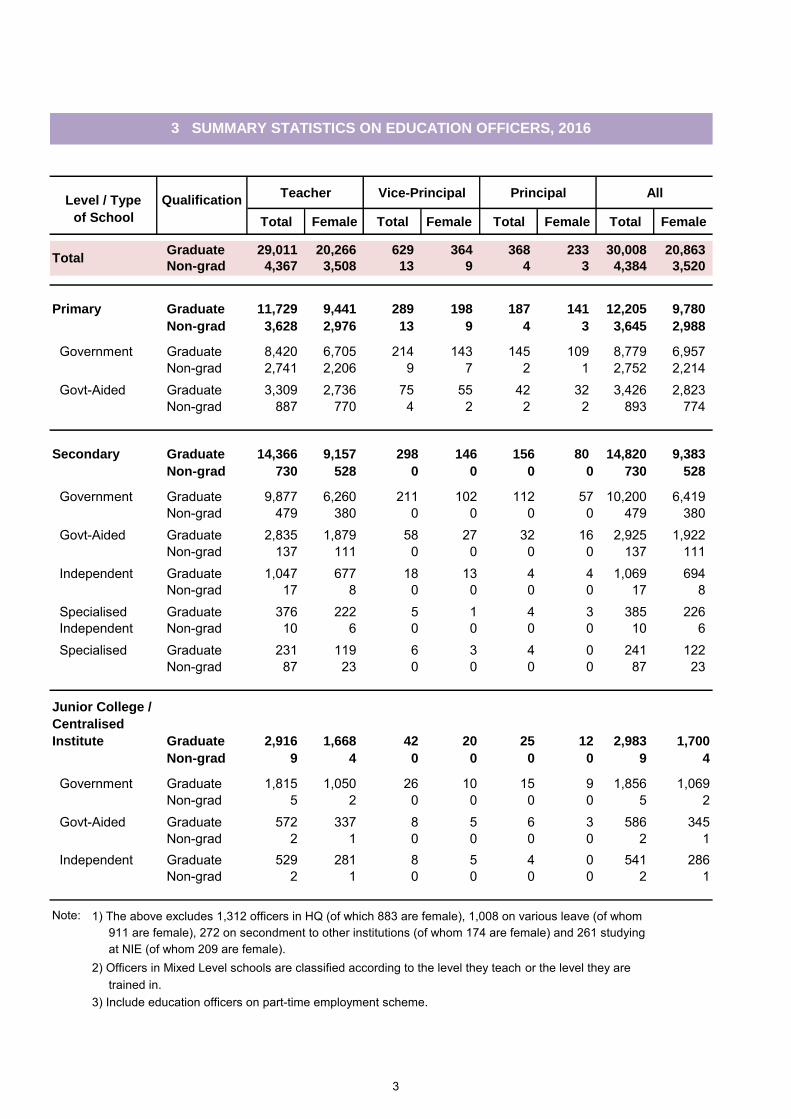
QualificationTeacher Vice-Principal Principal All
Total Female Total Female Total Female Total Female
Graduate 29,011 20,266 629 364 368 233 30,008 20,863
Non-grad 4,367 3,508 13 9 4 3 4,384 3,520
Graduate 11,729 9,441 289 198 187 141 12,205 9,780
Non-grad 3,628 2,976 13 9 4 3 3,645 2,988
Graduate 8,420 6,705 214 143 145 109 8,779 6,957 Non-grad 2,741 2,206 9 7 2 1 2,752 2,214 Graduate 3,309 2,736 75 55 42 32 3,426 2,823 Non-grad 887 770 4 2 2 2 893 774
Graduate 14,366 9,157 298 146 156 80 14,820 9,383
Non-grad 730 528 0 0 0 0 730 528
Graduate 9,877 6,260 211 102 112 57 10,200 6,419 Non-grad 479 380 0 0 0 0 479 380 Graduate 2,835 1,879 58 27 32 16 2,925 1,922 Non-grad 137 111 0 0 0 0 137 111
Independent Graduate 1,047 677 18 13 4 4 1,069 694 Non-grad 17 8 0 0 0 0 17 8 Graduate 376 222 5 1 4 3 385 226 Non-grad 10 6 0 0 0 0 10 6
Specialised Graduate 231 119 6 3 4 0 241 122 Non-grad 87 23 0 0 0 0 87 23
Graduate 2,916 1,668 42 20 25 12 2,983 1,700
Non-grad 9 4 0 0 0 0 9 4
Government Graduate 1,815 1,050 26 10 15 9 1,856 1,069 Non-grad 5 2 0 0 0 0 5 2 Graduate 572 337 8 5 6 3 586 345 Non-grad 2 1 0 0 0 0 2 1 Graduate 529 281 8 5 4 0 541 286 Non-grad 2 1 0 0 0 0 2 1
Note: 1) The above excludes 1,312 officers in HQ (of which 883 are female), 1,008 on various leave (of whom 911 are female), 272 on secondment to other institutions (of whom 174 are female) and 261 studying at NIE (of whom 209 are female).2) Officers in Mixed Level schools are classified according to the level they teach or the level they are trained in. 3) Include education officers on part-time employment scheme.
Government
3 SUMMARY STATISTICS ON EDUCATION OFFICERS, 2016
Level / Type
of School
Total
Primary
Government
Govt-Aided
Secondary
Govt-Aided
Independent
Govt-Aided
Specialised Independent
Junior College /
Centralised
Institute
3

Level Enrolment No. of Classes Average Class Size
Total 446,582 13,686 32.6
Primary 238,140 7,143 33.3
Pri 1 38,904 1,341 29.0
Pri 2 40,077 1,365 29.4
Pri 3 40,733 1,107 36.8
Pri 4 40,136 1,103 36.4
Pri 5 39,252 1,110 35.4
Pri 6 39,038 1,117 34.9
Secondary 180,000 5,281 34.1
Sec 1 39,550 1,117 35.4
Sec 2 42,477 1,197 35.5
Sec 3 44,250 1,303 34.0
Sec 4 47,869 1,422 33.7
Sec 5 5,854 242 24.2
Junior College / Centralised
Institute28,442 1,262 22.5
JC 1 / Pre-U 1 14,602 624 23.4
JC 2 / Pre-U 2 13,455 623 21.6
Pre-U 3 385 15 25.7
Note:
2) Students in Mixed Level schools are classified according to the level they are in.
4 ENROLMENT, NUMBER OF CLASSES AND CLASS SIZE BY LEVEL, 2016
1) Class size is the average number of students per class, calculated by dividing the number of students enrolled by the number of classes in that level. The classes here refer to form classes only. The actual class size can be smaller for some subjects and lessons, depending on the learning needs of the students or programme considerations. For instance, levelling up programmes such as the Learning Support Programme for lower primary students, School-based Dyslexia Remediation programme and coursework subjects like Design and Technology at secondary level are conducted in smaller classes.
4
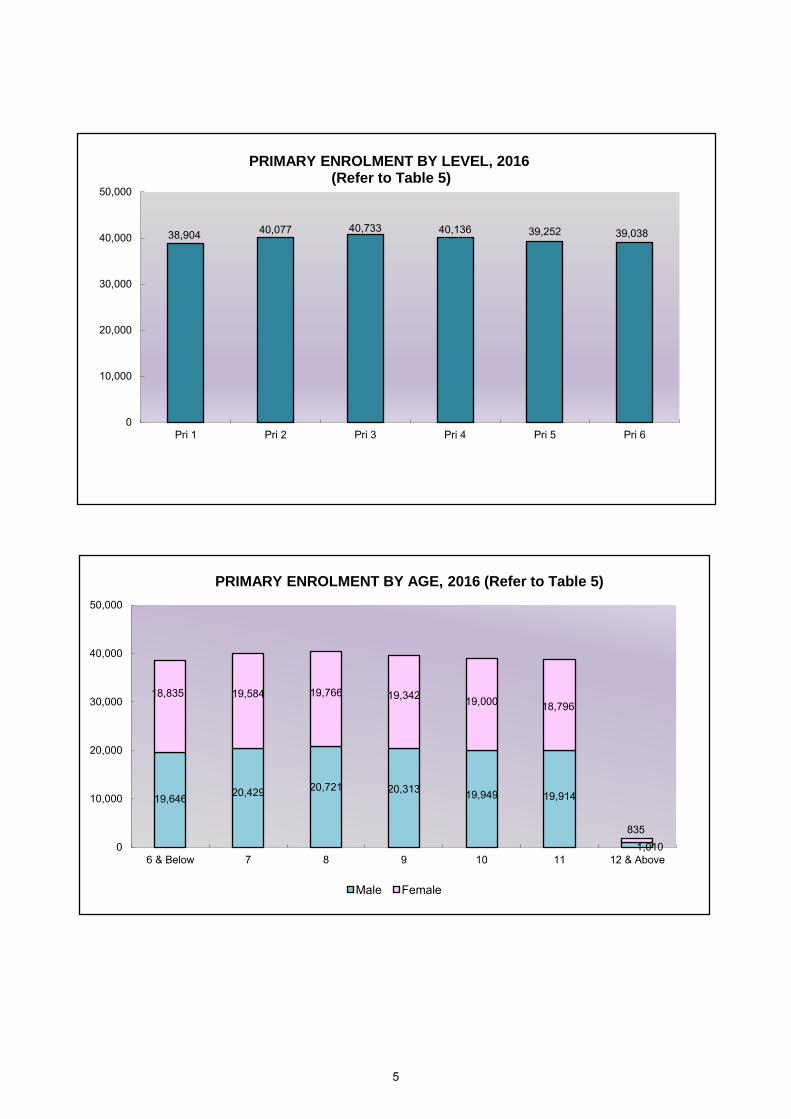
38,904 40,077 40,733 40,136 39,252 39,038
0
10,000
20,000
30,000
40,000
50,000
Pri 1 Pri 2 Pri 3 Pri 4 Pri 5 Pri 6
PRIMARY ENROLMENT BY LEVEL, 2016(Refer to Table 5)
19,646 20,429 20,721 20,313 19,949 19,914
1,010
18,835 19,584 19,766 19,342 19,000 18,796
8350
10,000
20,000
30,000
40,000
50,000
6 & Below 7 8 9 10 11 12 & Above
PRIMARY ENROLMENT BY AGE, 2016 (Refer to Table 5)
Male Female
5
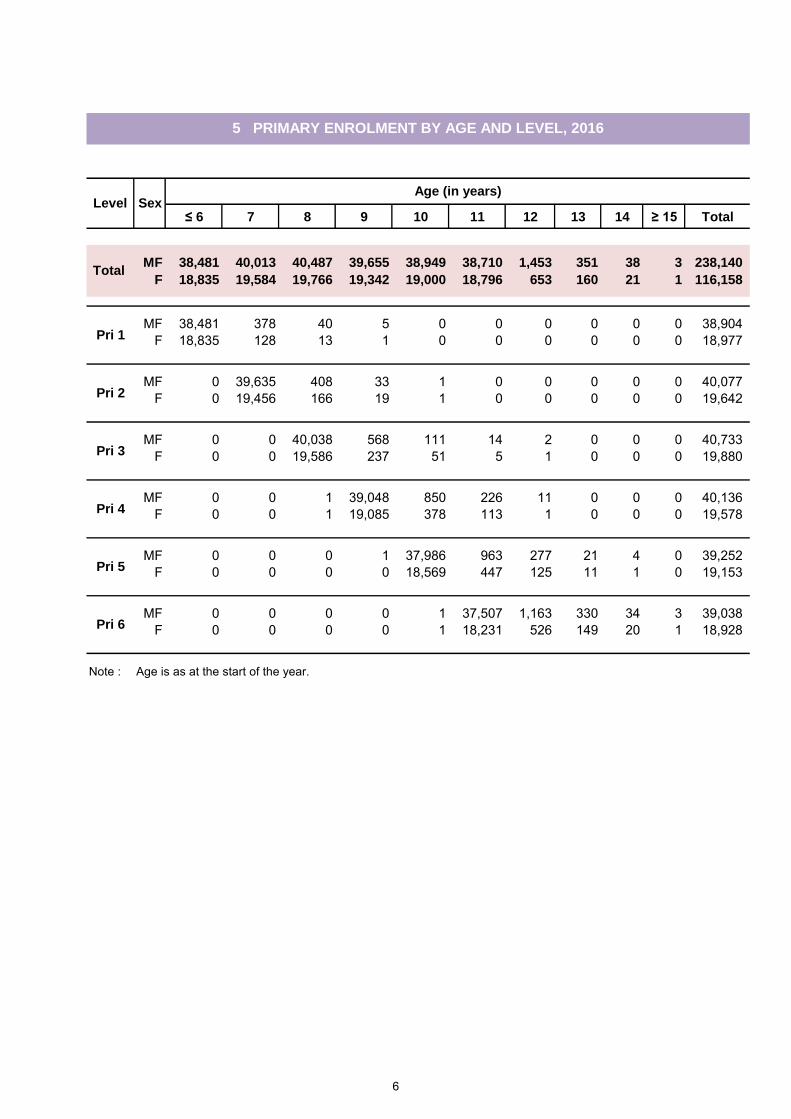
≤ 6 7 8 9 10 11 12 13 14 ≥ 15 Total
MF 38,481 40,013 40,487 39,655 38,949 38,710 1,453 351 38 3 238,140
F 18,835 19,584 19,766 19,342 19,000 18,796 653 160 21 1 116,158
MF 38,481 378 40 5 0 0 0 0 0 0 38,904 F 18,835 128 13 1 0 0 0 0 0 0 18,977
MF 0 39,635 408 33 1 0 0 0 0 0 40,077 F 0 19,456 166 19 1 0 0 0 0 0 19,642
MF 0 0 40,038 568 111 14 2 0 0 0 40,733 F 0 0 19,586 237 51 5 1 0 0 0 19,880
MF 0 0 1 39,048 850 226 11 0 0 0 40,136 F 0 0 1 19,085 378 113 1 0 0 0 19,578
MF 0 0 0 1 37,986 963 277 21 4 0 39,252 F 0 0 0 0 18,569 447 125 11 1 0 19,153
MF 0 0 0 0 1 37,507 1,163 330 34 3 39,038 F 0 0 0 0 1 18,231 526 149 20 1 18,928
Note : Age is as at the start of the year.
Pri 6
Pri 1
Pri 2
Pri 3
Pri 4
Pri 5
5 PRIMARY ENROLMENT BY AGE AND LEVEL, 2016
Total
Level SexAge (in years)
6
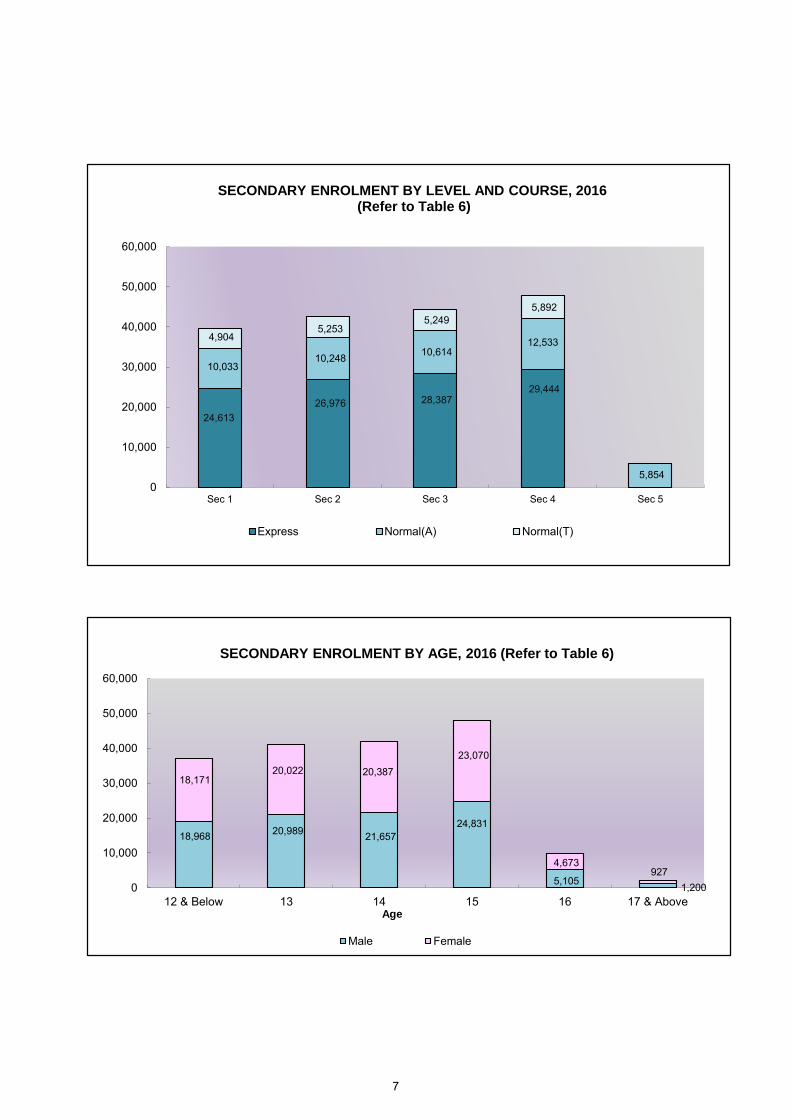
24,613 26,976 28,387
29,444
10,033 10,248 10,614
12,533
5,854
4,904 5,253
5,249 5,892
0
10,000
20,000
30,000
40,000
50,000
60,000
Sec 1 Sec 2 Sec 3 Sec 4 Sec 5
SECONDARY ENROLMENT BY LEVEL AND COURSE, 2016(Refer to Table 6)
Express Normal(A) Normal(T)
18,968 20,989 21,657 24,831
5,105 1,200
18,171 20,022 20,387
23,070
4,673 927
0
10,000
20,000
30,000
40,000
50,000
60,000
12 & Below 13 14 15 16 17 & AboveAge
SECONDARY ENROLMENT BY AGE, 2016 (Refer to Table 6)
Male Female
7
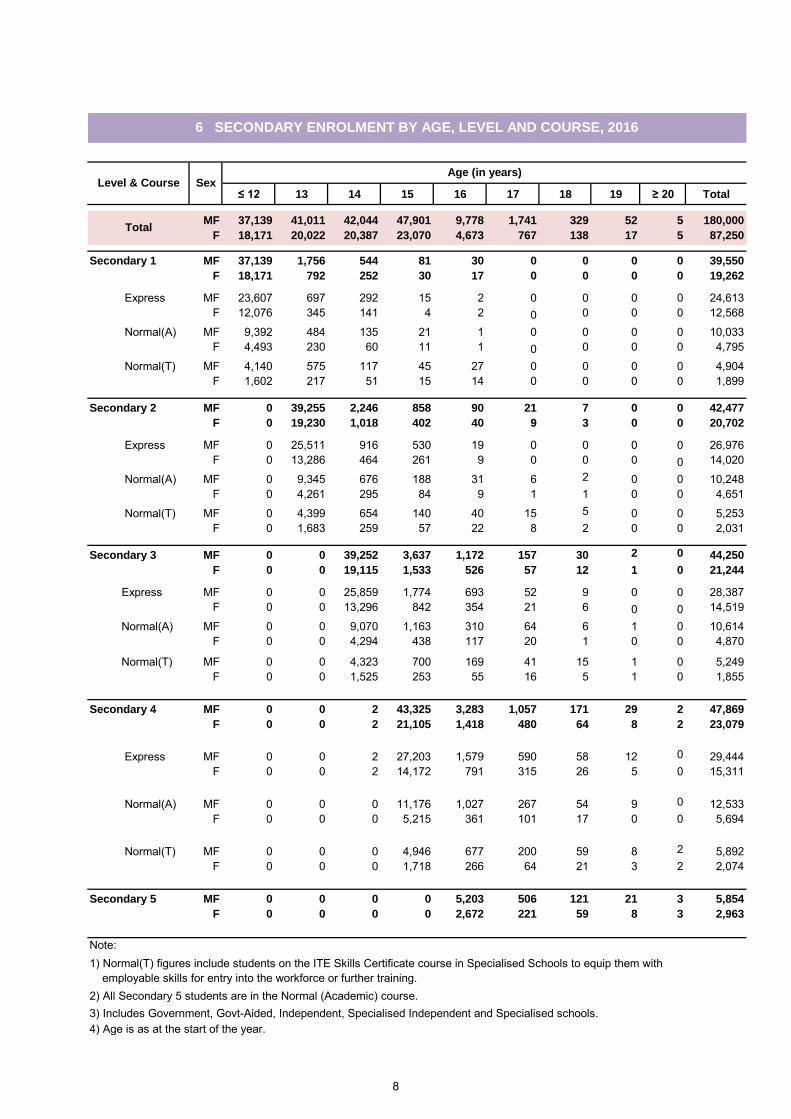
≤ 12 13 14 15 16 17 18 19 ≥ 20 Total
MF 37,139 41,011 42,044 47,901 9,778 1,741 329 52 5 180,000
F 18,171 20,022 20,387 23,070 4,673 767 138 17 5 87,250
Secondary 1 MF 37,139 1,756 544 81 30 0 0 0 0 39,550
F 18,171 792 252 30 17 0 0 0 0 19,262
Express MF 23,607 697 292 15 2 0 0 0 0 24,613 F 12,076 345 141 4 2 0 0 0 0 12,568
Normal(A) MF 9,392 484 135 21 1 0 0 0 0 10,033 F 4,493 230 60 11 1 0 0 0 0 4,795
Normal(T) MF 4,140 575 117 45 27 0 0 0 0 4,904 F 1,602 217 51 15 14 0 0 0 0 1,899
Secondary 2 MF 0 39,255 2,246 858 90 21 7 0 0 42,477
F 0 19,230 1,018 402 40 9 3 0 0 20,702
Express MF 0 25,511 916 530 19 0 0 0 0 26,976 F 0 13,286 464 261 9 0 0 0 0 14,020
Normal(A) MF 0 9,345 676 188 31 6 2 0 0 10,248 F 0 4,261 295 84 9 1 1 0 0 4,651
Normal(T) MF 0 4,399 654 140 40 15 5 0 0 5,253 F 0 1,683 259 57 22 8 2 0 0 2,031
Secondary 3 MF 0 0 39,252 3,637 1,172 157 30 2 0 44,250
F 0 0 19,115 1,533 526 57 12 1 0 21,244
Express MF 0 0 25,859 1,774 693 52 9 0 0 28,387 F 0 0 13,296 842 354 21 6 0 0 14,519
Normal(A) MF 0 0 9,070 1,163 310 64 6 1 0 10,614 F 0 0 4,294 438 117 20 1 0 0 4,870
Normal(T) MF 0 0 4,323 700 169 41 15 1 0 5,249 F 0 0 1,525 253 55 16 5 1 0 1,855
Secondary 4 MF 0 0 2 43,325 3,283 1,057 171 29 2 47,869
F 0 0 2 21,105 1,418 480 64 8 2 23,079
Express MF 0 0 2 27,203 1,579 590 58 12 0 29,444 F 0 0 2 14,172 791 315 26 5 0 15,311
Normal(A) MF 0 0 0 11,176 1,027 267 54 9 0 12,533 F 0 0 0 5,215 361 101 17 0 0 5,694
Normal(T) MF 0 0 0 4,946 677 200 59 8 2 5,892 F 0 0 0 1,718 266 64 21 3 2 2,074
Secondary 5 MF 0 0 0 0 5,203 506 121 21 3 5,854
F 0 0 0 0 2,672 221 59 8 3 2,963
Note:1) Normal(T) figures include students on the ITE Skills Certificate course in Specialised Schools to equip them with employable skills for entry into the workforce or further training.2) All Secondary 5 students are in the Normal (Academic) course.3) Includes Government, Govt-Aided, Independent, Specialised Independent and Specialised schools. 4) Age is as at the start of the year.
6 SECONDARY ENROLMENT BY AGE, LEVEL AND COURSE, 2016
Age (in years)
Total
Level & Course Sex
8
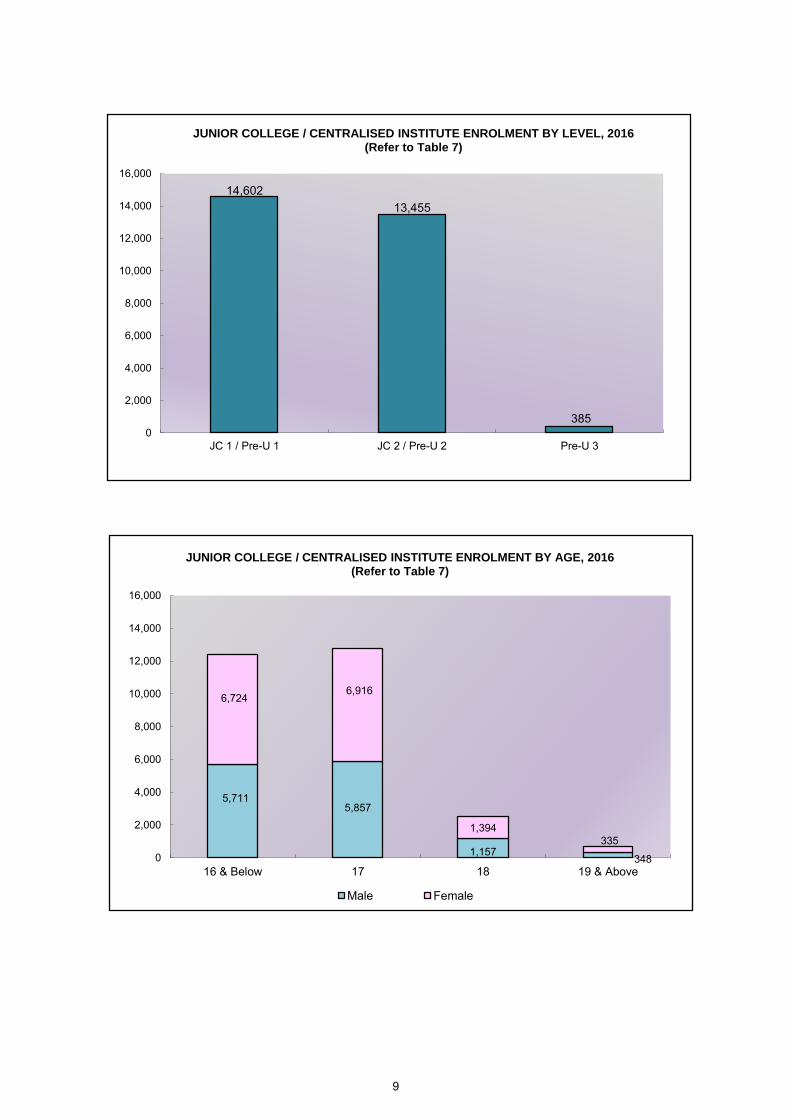
14,602 13,455
385 0
2,000
4,000
6,000
8,000
10,000
12,000
14,000
16,000
JC 1 / Pre-U 1 JC 2 / Pre-U 2 Pre-U 3
JUNIOR COLLEGE / CENTRALISED INSTITUTE ENROLMENT BY LEVEL, 2016 (Refer to Table 7)
5,711 5,857
1,157 348
6,724 6,916
1,394 335
0
2,000
4,000
6,000
8,000
10,000
12,000
14,000
16,000
16 & Below 17 18 19 & Above
JUNIOR COLLEGE / CENTRALISED INSTITUTE ENROLMENT BY AGE, 2016 (Refer to Table 7)
Male FemaleAge
9
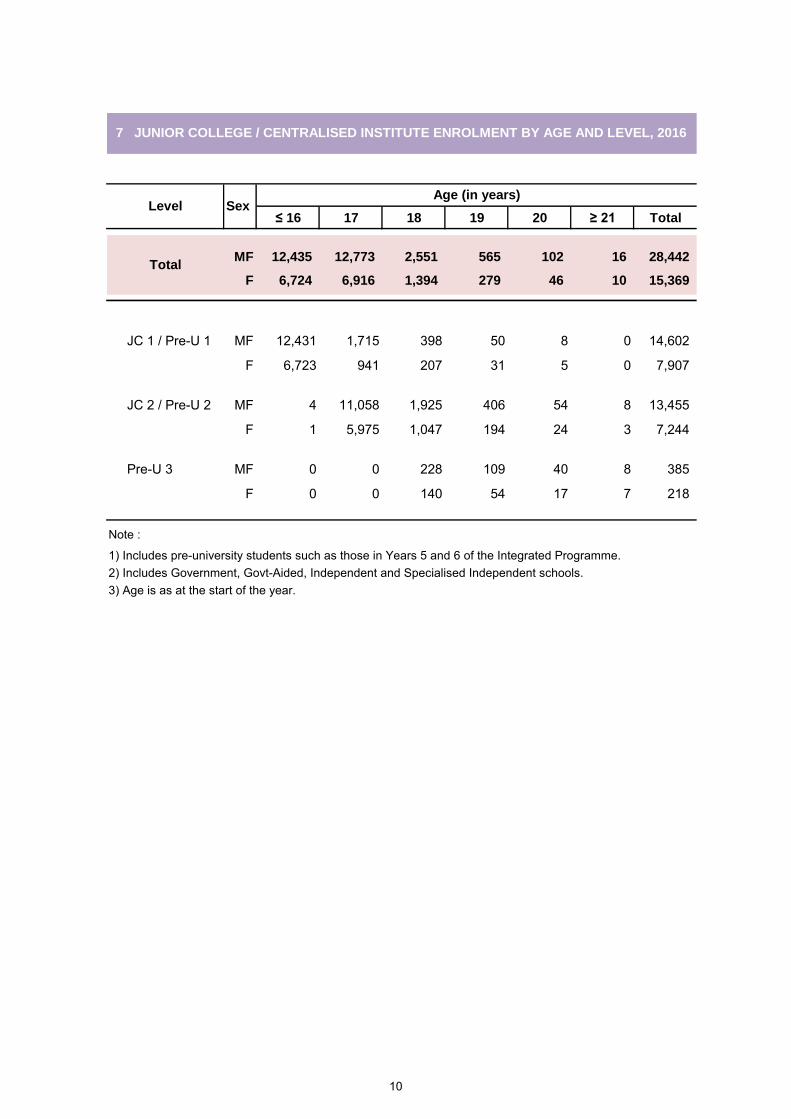
≤ 16 17 18 19 20 ≥ 21 Total
MF 12,435 12,773 2,551 565 102 16 28,442
F 6,724 6,916 1,394 279 46 10 15,369
JC 1 / Pre-U 1 MF 12,431 1,715 398 50 8 0 14,602
F 6,723 941 207 31 5 0 7,907
JC 2 / Pre-U 2 MF 4 11,058 1,925 406 54 8 13,455
F 1 5,975 1,047 194 24 3 7,244
Pre-U 3 MF 0 0 228 109 40 8 385
F 0 0 140 54 17 7 218
Note :
1) Includes pre-university students such as those in Years 5 and 6 of the Integrated Programme.2) Includes Government, Govt-Aided, Independent and Specialised Independent schools. 3) Age is as at the start of the year.
Level Sex
Total
Age (in years)
7 JUNIOR COLLEGE / CENTRALISED INSTITUTE ENROLMENT BY AGE AND LEVEL, 2016
10
Total
Male
Female
Total
Male
Female
442 83 359
3,925
776
3,149
12,726
3,053
9,673
11,364
3,891
7,473
4,921
1,801
3,120
0
2,000
4,000
6,000
8,000
10,000
12,000
14,000
Total Male Female
TEACHERS BY ACADEMIC QUALIFICATION, 2016 (Refer to Table 8)
O-Level A-Level/Dip. Pass Degree Honours Degree Postgraduate
8,532
2,651
5,881
8,512
2,680
5,832
6,785
1,968
4,817 4,445
1,305
3,140
2,339
518
1,821 1,242
239
1,003 1,523 1,523
0
1,000
2,000
3,000
4,000
5,000
6,000
7,000
8,000
9,000
Total Male Female
TEACHERS BY LENGTH OF SERVICE, 2016 (Refer to Table 8)
0-4 5-9 10-14 15-19 20-24 25-29 30 & Above (in years)
506 6
500
5,762
1,202
4,560
6,502
1,971
4,531
6,480
2,057
4,423
5,581
1,864
3,717 3,709
1,181
2,528 2,110
617
1,493
2,728
706
2,022
0
2,000
4,000
6,000
8,000
Total Male Female
TEACHERS BY AGE, 2016 (Refer to Table 8)
24 & Below 25-29 30-34 35-39 40-44 45-49 50-54 55 & Above (in years)
11
Primary Secondary Total
Total Female Total Female Total Female Total Female
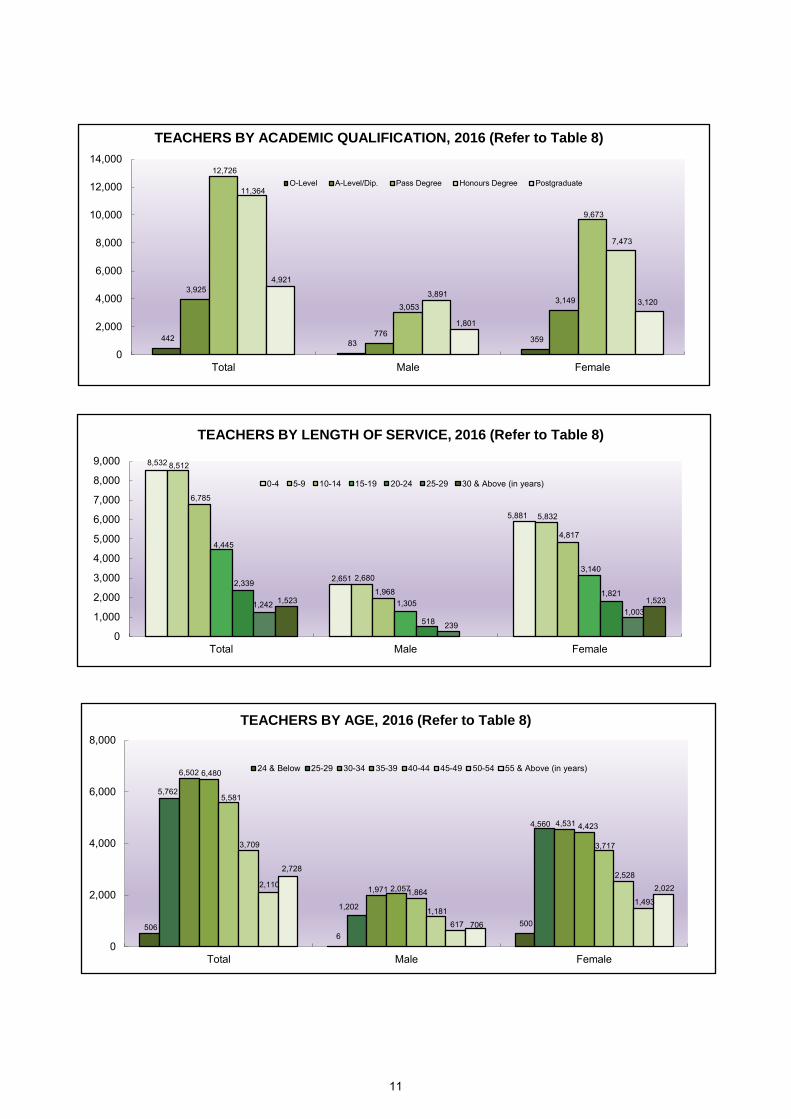
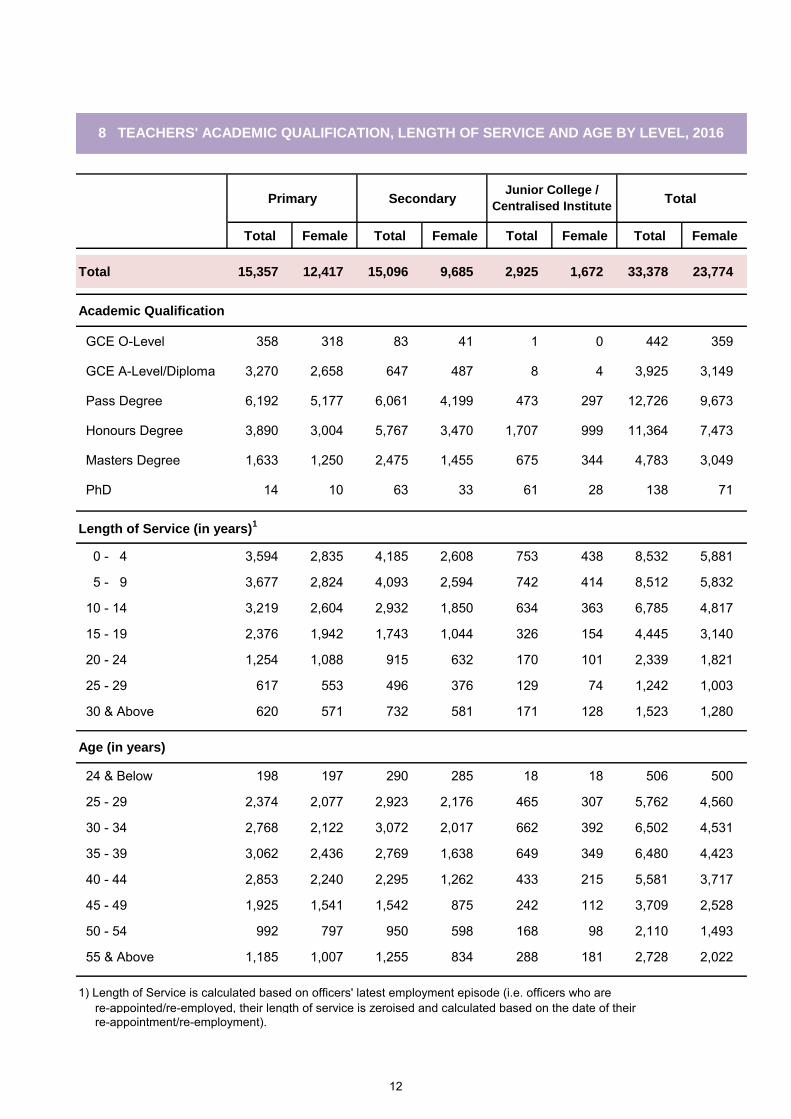
Total 15,357 12,417 15,096 9,685 2,925 1,672 33,378 23,774
Academic Qualification
GCE O-Level 358 318 83 41 1 0 442 359
GCE A-Level/Diploma 3,270 2,658 647 487 8 4 3,925 3,149
Pass Degree 6,192 5,177 6,061 4,199 473 297 12,726 9,673
Honours Degree 3,890 3,004 5,767 3,470 1,707 999 11,364 7,473
Masters Degree 1,633 1,250 2,475 1,455 675 344 4,783 3,049
PhD 14 10 63 33 61 28 138 71.
Length of Service (in years)1
0 - 4 3,594 2,835 4,185 2,608 753 438 8,532 5,881
5 - 9 3,677 2,824 4,093 2,594 742 414 8,512 5,832
10 - 14 3,219 2,604 2,932 1,850 634 363 6,785 4,817
15 - 19 2,376 1,942 1,743 1,044 326 154 4,445 3,140
20 - 24 1,254 1,088 915 632 170 101 2,339 1,821
25 - 29 617 553 496 376 129 74 1,242 1,003
30 & Above 620 571 732 581 171 128 1,523 1,280
Age (in years)
24 & Below 198 197 290 285 18 18 506 500
25 - 29 2,374 2,077 2,923 2,176 465 307 5,762 4,560
30 - 34 2,768 2,122 3,072 2,017 662 392 6,502 4,531
35 - 39 3,062 2,436 2,769 1,638 649 349 6,480 4,423
40 - 44 2,853 2,240 2,295 1,262 433 215 5,581 3,717
45 - 49 1,925 1,541 1,542 875 242 112 3,709 2,528
50 - 54 992 797 950 598 168 98 2,110 1,493
55 & Above 1,185 1,007 1,255 834 288 181 2,728 2,022
1) Length of Service is calculated based on officers' latest employment episode (i.e. officers who are re-appointed/re-employed, their length of service is zeroised and calculated based on the date of their re-appointment/re-employment).
8 TEACHERS' ACADEMIC QUALIFICATION, LENGTH OF SERVICE AND AGE BY LEVEL, 2016
Junior College /
Centralised Institute
12
Primary Secondary Total
Total Female Total Female Total Female Total Female
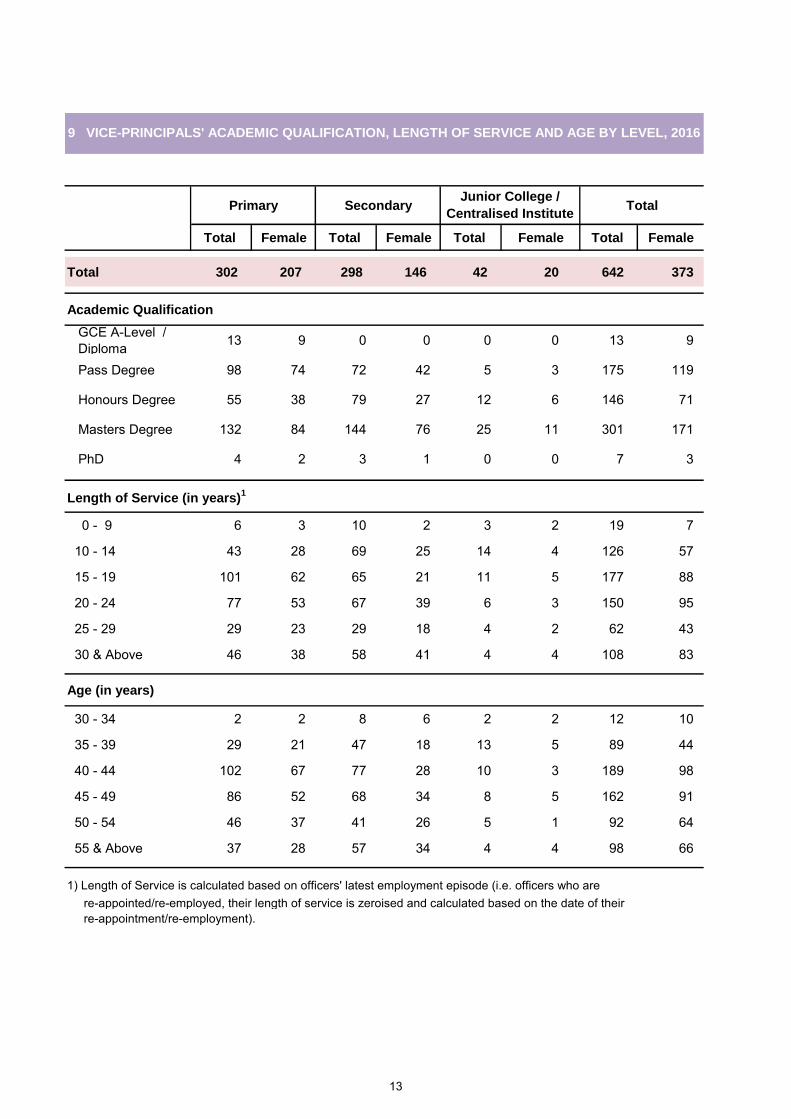
Total 302 207 298 146 42 20 642 373
Academic Qualification
GCE A-Level / Diploma 13 9 0 0 0 0 13 9
Pass Degree 98 74 72 42 5 3 175 119
Honours Degree 55 38 79 27 12 6 146 71
Masters Degree 132 84 144 76 25 11 301 171
PhD 4 2 3 1 0 0 7 3
Length of Service (in years)1
0 - 9 6 3 10 2 3 2 19 7
10 - 14 43 28 69 25 14 4 126 57
15 - 19 101 62 65 21 11 5 177 88
20 - 24 77 53 67 39 6 3 150 95
25 - 29 29 23 29 18 4 2 62 43
30 & Above 46 38 58 41 4 4 108 83
Age (in years)
30 - 34 2 2 8 6 2 2 12 10
35 - 39 29 21 47 18 13 5 89 44
40 - 44 102 67 77 28 10 3 189 98
45 - 49 86 52 68 34 8 5 162 91
50 - 54 46 37 41 26 5 1 92 64
55 & Above 37 28 57 34 4 4 98 66
1) Length of Service is calculated based on officers' latest employment episode (i.e. officers who are re-appointed/re-employed, their length of service is zeroised and calculated based on the date of their re-appointment/re-employment).
9 VICE-PRINCIPALS' ACADEMIC QUALIFICATION, LENGTH OF SERVICE AND AGE BY LEVEL, 2016
Junior College /
Centralised Institute
13

Primary SecondaryJunior College /
Centralised InstituteTotal
Total Female Total Female Total Female Total Female
Total 191 144 156 80 25 12 372 236
Academic Qualification
GCE A-Level / Diploma 4 3 0 0 0 0 4 3
Pass Degree 53 42 27 16 1 0 81 58
Honours Degree 24 16 36 18 6 3 66 37
Masters Degree 108 81 93 46 16 9 217 136
PhD 2 2 0 0 2 0 4 2
Length of Service (in years)1
0 - 9 3 3 1 0 3 1 7 4
10 - 14 6 4 12 3 1 0 19 7
15 - 19 38 27 42 15 3 1 83 43
20 - 24 46 32 38 22 2 2 86 56
25 - 29 39 31 20 11 2 1 61 43
30 & Above 59 47 43 29 14 7 116 83
Age (in years)
30 - 34 0 0 0 0 0 0 0 0
35 - 39 7 7 6 1 0 0 13 8
40 - 44 37 25 40 22 3 1 80 48
45 - 49 49 37 44 19 2 2 95 58
50 - 54 39 31 22 11 4 1 65 43
55 & Above 59 44 44 27 16 8 119 79
1) Length of Service is calculated based on officers' latest employment episode (i.e. officers who are re-appointed/re-employed, their length of service is zeroised and calculated based on the date of their re-appointment/re-employment).
10 PRINCIPALS' ACADEMIC QUALIFICATION, LENGTH OF SERVICE AND AGE BY LEVEL, 2016
14
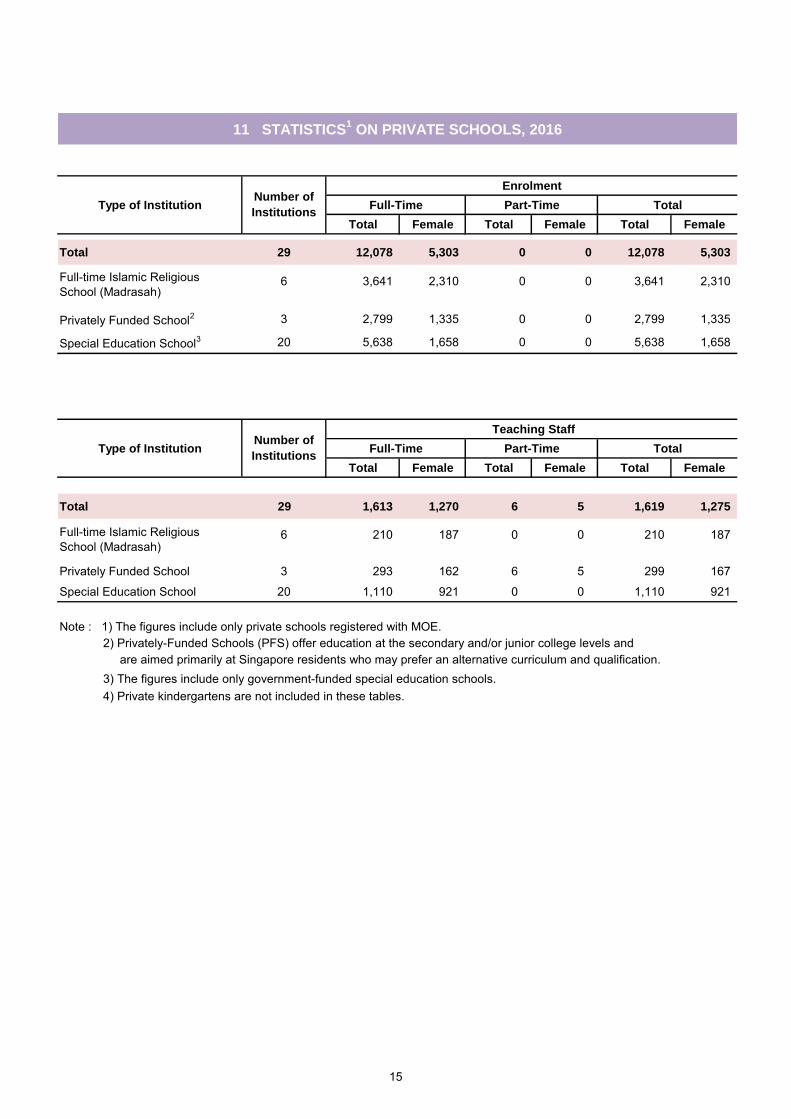
Enrolment
Type of Institution Full-Time Part-Time Total
Total Female Total Female Total Female
Total 29 12,078 5,303 0 0 12,078 5,303
6 3,641 2,310 0 0 3,641 2,310
Privately Funded School2 3 2,799 1,335 0 0 2,799 1,335
Special Education School3 20 5,638 1,658 0 0 5,638 1,658
Teaching Staff
Type of Institution Full-Time Part-Time Total
Total Female Total Female Total Female
Total 29 1,613 1,270 6 5 1,619 1,275
6 210 187 0 0 210 187
Privately Funded School 3 293 162 6 5 299 167
Special Education School 20 1,110 921 0 0 1,110 921
Note : 1) The figures include only private schools registered with MOE. 2) Privately-Funded Schools (PFS) offer education at the secondary and/or junior college levels and are aimed primarily at Singapore residents who may prefer an alternative curriculum and qualification. 3) The figures include only government-funded special education schools. 4) Private kindergartens are not included in these tables.
11 STATISTICS1 ON PRIVATE SCHOOLS, 2016
Full-time Islamic Religious School (Madrasah)
Full-time Islamic Religious School (Madrasah)
Number of
Institutions
Number of
Institutions
15
SECTION 2
Post-Secondary Education
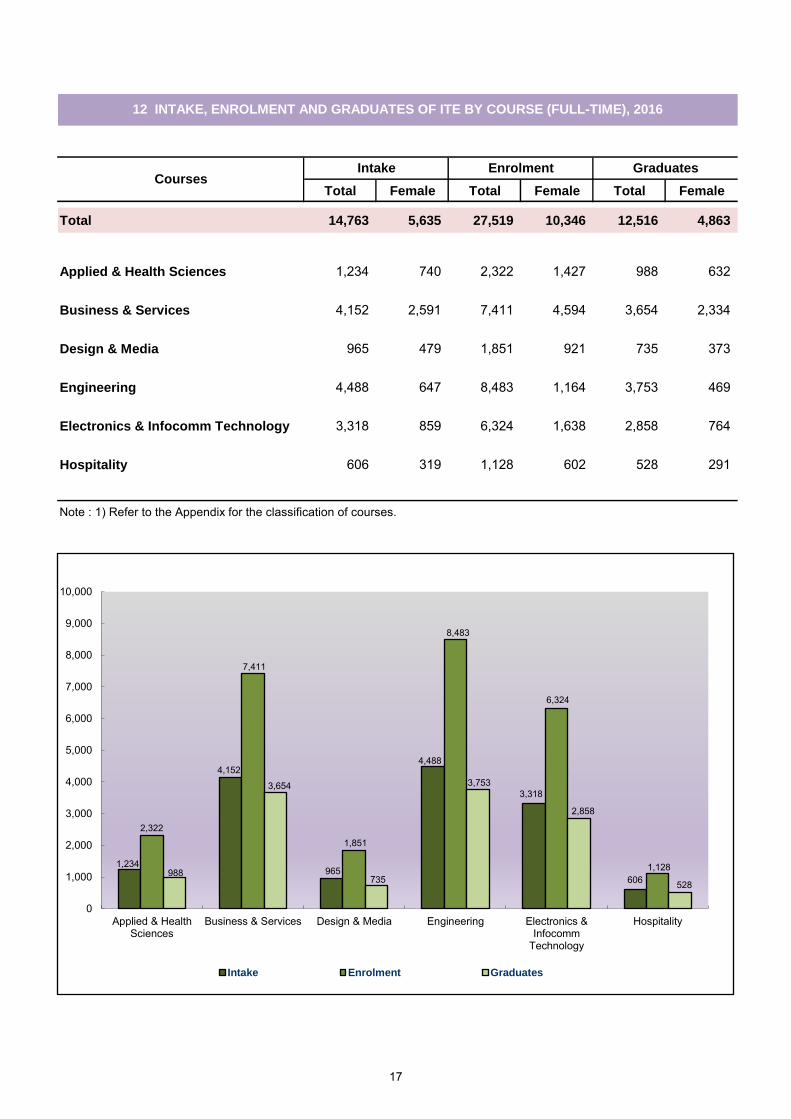
Total Female Total Female Total Female
Total 14,763 5,635 27,519 10,346 12,516 4,863
Applied & Health Sciences 1,234 740 2,322 1,427 988 632
Business & Services 4,152 2,591 7,411 4,594 3,654 2,334
Design & Media 965 479 1,851 921 735 373
Engineering 4,488 647 8,483 1,164 3,753 469
Electronics & Infocomm Technology 3,318 859 6,324 1,638 2,858 764
Hospitality 606 319 1,128 602 528 291
Note : 1) Refer to the Appendix for the classification of courses.
12 INTAKE, ENROLMENT AND GRADUATES OF ITE BY COURSE (FULL-TIME), 2016
CoursesIntake Enrolment Graduates
1,234
4,152
965
4,488
3,318
606
2,322
7,411
1,851
8,483
6,324
1,128 988
3,654
735
3,753
2,858
528
0
1,000
2,000
3,000
4,000
5,000
6,000
7,000
8,000
9,000
10,000
Applied & HealthSciences
Business & Services Design & Media Engineering Electronics &Infocomm
Technology
Hospitality
Intake Enrolment Graduates
17
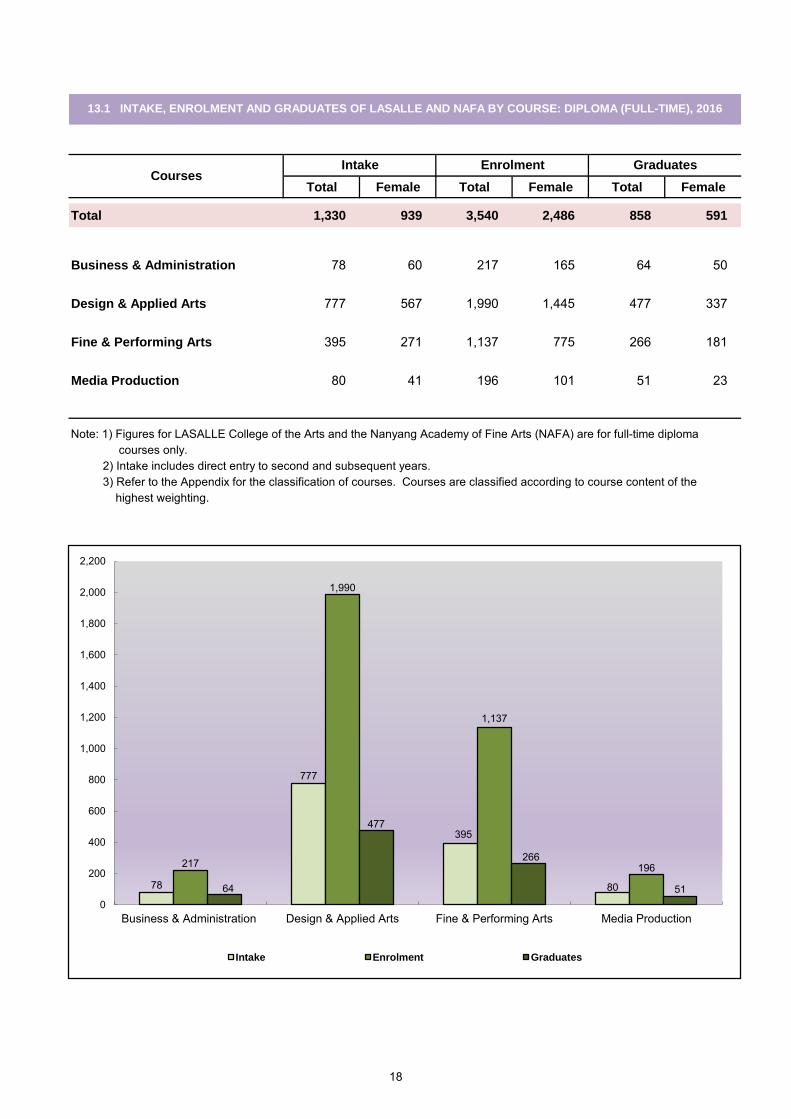
Total Female Total Female Total Female
Total 1,330 939 3,540 2,486 858 591
Business & Administration 78 60 217 165 64 50
Design & Applied Arts 777 567 1,990 1,445 477 337
Fine & Performing Arts 395 271 1,137 775 266 181
Media Production 80 41 196 101 51 23
Note: 1) Figures for LASALLE College of the Arts and the Nanyang Academy of Fine Arts (NAFA) are for full-time diploma courses only. 2) Intake includes direct entry to second and subsequent years. 3) Refer to the Appendix for the classification of courses. Courses are classified according to course content of the highest weighting.
13.1 INTAKE, ENROLMENT AND GRADUATES OF LASALLE AND NAFA BY COURSE: DIPLOMA (FULL-TIME), 2016
CoursesIntake Enrolment Graduates
78
777
395
80
217
1,990
1,137
196
64
477
266
510
200
400
600
800
1,000
1,200
1,400
1,600
1,800
2,000
2,200
Business & Administration Design & Applied Arts Fine & Performing Arts Media Production
Intake Enrolment Graduates
18
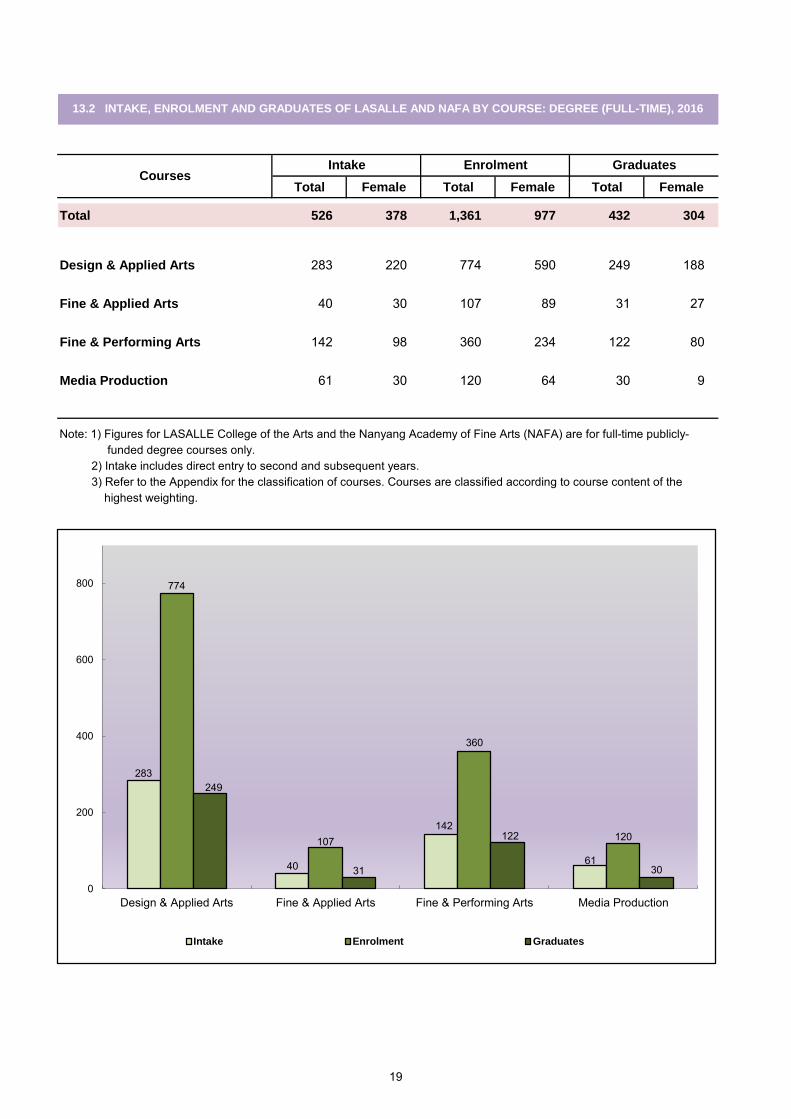
Total Female Total Female Total Female
Total 526 378 1,361 977 432 304
Design & Applied Arts 283 220 774 590 249 188
Fine & Applied Arts 40 30 107 89 31 27
Fine & Performing Arts 142 98 360 234 122 80
Media Production 61 30 120 64 30 9
Note: 1) Figures for LASALLE College of the Arts and the Nanyang Academy of Fine Arts (NAFA) are for full-time publicly- funded degree courses only. 2) Intake includes direct entry to second and subsequent years. 3) Refer to the Appendix for the classification of courses. Courses are classified according to course content of the highest weighting.
13.2 INTAKE, ENROLMENT AND GRADUATES OF LASALLE AND NAFA BY COURSE: DEGREE (FULL-TIME), 2016
CoursesIntake Enrolment Graduates
283
40
142
61
774
107
360
120
249
31
122
30
0
200
400
600
800
Design & Applied Arts Fine & Applied Arts Fine & Performing Arts Media Production
Intake Enrolment Graduates
19
Total Female Total Female Total Female
Total 23,121 11,018 73,149 35,128 25,104 12,211
Applied Arts 1,721 1,011 5,236 3,064 1,783 1,024
Architecture, Building & Real Estate 623 371 2,039 1,207 743 420
Business & Administration 4,646 2,846 15,203 9,406 5,595 3,417
Education 586 548 1,252 1,181 307 277
Engineering Sciences 6,811 1,395 21,334 4,721 6,939 1,601
Health Sciences 2,537 1,894 7,806 5,704 2,556 1,895
Humanities & Social Sciences 342 256 1,020 758 353 261
Information Technology 2,769 906 9,198 3,175 3,305 1,275
Law 101 66 357 218 126 68
Mass Communication 618 457 1,920 1,436 701 498
Science & Related Technologies 1,296 789 4,302 2,634 1,457 904
Services 1,071 479 3,482 1,624 1,239 571
Note: 1) Intake, enrolment and graduate figures refer to diploma courses only. Intake excludes students on Polytechnic Foundation Programme. 2) Intake includes direct entry to second year. 3) Refer to the Appendix for the classification of courses. Courses are classified according to course content of the highest weighting.
14 INTAKE, ENROLMENT AND GRADUATES OF POLYTECHNICS BY COURSE (FULL-TIME), 2016
CoursesIntake Enrolment Graduates
1,721623
4,646
586
6,811
2,537
342
2,769
101 6181,296 1,071
5,236
2,039
15,203
1,252
21,334
7,806
1,020
9,198
357
1,920
4,3023,482
1,783
743
5,595
307
6,939
2,556
353
3,305
126 701
1,4571,239
Intake Enrolment Graduates
20

Total Female Total Female Total Female
Total 18,552 9,350 66,531 33,763 15,496 8,060
Accountancy 1,521 912 5,090 2,909 1,103 664Architecture, Building & Real Estate 419 252 1,980 1,205 459 274Business & Administration 2,196 1,237 7,514 4,230 1,720 969Dentistry 54 39 220 145 53 28Education 217 172 743 577 406 327Engineering Sciences 4,997 1,333 16,975 4,859 4,283 1,267Fine & Applied Arts 458 297 1,628 958 432 259Health Sciences 798 593 1,860 1,335 480 368Humanities & Social Sciences 3,219 2,205 12,495 8,449 2,563 1,760Information Technology 1,379 398 4,810 1,499 1,051 381Law 399 210 1,593 740 351 173Mass Communication 190 148 774 596 188 153Medicine 410 204 1,845 912 278 147Natural, Physical & Mathematical Sciences 2,094 1,240 8,267 4,967 1,950 1,195Services 201 110 737 382 179 95
Note: 1) Refers to National University of Singapore, Nanyang Technological University, Singapore Management University, Singapore Institute of Technology, Singapore University of Technology & Design and SIM University.
2) Intake, enrolment and graduates figures refer to full-time first degree only. 3) Intake figures include students who entered directly into second and subsequent years. 4) Refer to the Appendix for the classification of courses. Courses are classified according to course content of the highest weighting.
15 INTAKE, ENROLMENT AND GRADUATES OF UNIVERSITIES1
BY COURSE (FULL-TIME), 2016
CoursesIntake Enrolment Graduates
1,521
419
2,196
54 217
4,997
458 798
3,219
1,379399
190410
2,094
201
5,090
1,980
7,514
220 743
16,975
1,628 1,860
12,495
4,810
1,593774
1,845
8,267
7371,103
459
1,720
53406
4,283
432 480
2,563
1,051351
188 278
1,950
1790
2,000
4,000
6,000
8,000
10,000
12,000
14,000
16,000
18,000
Intake Enrolment Graduates
21
SECTION 3
Statistical Series

NU
MB
ER
OF
SC
HO
OL
S B
Y L
EV
EL
(R
efe
r to
Ta
ble
16
)
Pri
mary
Seco
nd
ary
0
20
40
60
80
10
0
12
0
14
0
16
0
18
0
20
0 20
07
20
08
20
09
20
10
20
11
20
12
20
13
20
14
20
15
20
16
Prim
ary
Sec
onda
ryM
ixed
Lev
elP
re-U
nive
rsity
23
Sp
ec
Sp
ec
Ind
ep
2In
de
p2
Go
vt
Aid
ed
Ind
ep
1960
16
524
841
327
21-
--
481
31-
-32
--
--
-49
319
70
198
190
388
6817
--
-85
-30
--
301
--
-1
504
1980
19
911
431
384
23-
--
107
-23
--
232
5-
-7
(19)
450
1990
15
743
200
102
274
--
133
-7
2-
99
5-
418
(25)
360
2000
15
540
195
123
286
--
157
-4
2-
610
5-
217
375
2007
12
941
170
120
284
11
154
53
41
138
41
114
351
2008
13
341
174
120
284
11
154
53
42
148
41
114
356
2009
13
141
172
120
283
12
154
53
52
158
4-
113
354
2010
13
241
173
120
283
22
155
53
52
158
4-
113
356
2011
13
341
174
119
283
22
154
53
52
158
4-
113
356
2012
13
441
175
119
283
22
154
53
52
158
4-
113
357
2013
14
141
182
119
282
23
154
43
62
159
4-
114
365
2014
14
441
185
119
282
14
154
43
63
169
4-
114
369
2015
14
141
182
119
282
14
154
43
63
169
4-
114
366
2016
14
441
185
115
282
14
150
43
63
169
4-
114
365
Not
e:
2) "
Spe
c In
dep"
refe
rs to
"Spe
cial
ised
Inde
pend
ent"
and
"Spe
c'd"
refe
rs to
"Spe
cial
ised
".
3) T
he fi
rst j
unio
r col
lege
(Nat
iona
l Jun
ior C
olle
ge) w
as o
pene
d in
196
9.
4) C
entra
lised
Inst
itute
, whi
ch p
rovi
des
a 3-
year
pre
-uni
vers
ity c
ours
e le
adin
g to
A-le
vel c
ertif
icat
ion,
was
intro
duce
d in
198
7.5)
Fig
ures
exc
lude
the
num
ber o
f Pre
-U c
entre
s, w
hich
are
indi
cate
d in
par
enth
eses
. Int
rodu
ced
in 1
979,
Pre
-U c
entre
s ar
e sc
hool
s th
at
offe
r a 3
-yea
r pre
-uni
vers
ity c
ours
e le
adin
g to
A-le
vel c
ertif
icat
ion.
The
y w
ere
phas
ed o
ut in
199
5 du
e to
falli
ng d
eman
d.
16 N
UM
BE
R O
F S
CH
OO
LS
BY
LE
VE
L A
ND
TY
PE
Ye
ar
Pri
ma
ryS
ec
on
da
ryM
ixe
d L
eve
l1
Aid
ed
Gra
nd
To
tal
Go
vt
To
tal5
Pre
-Un
ive
rsit
y
To
tal
Sp
ec
'd2
To
tal
Aid
ed
and
Upp
er S
econ
dary
and
Jun
ior C
olle
ge (S
3-JC
2). F
igur
es p
rior t
o 20
04 re
fer o
nly
to P
rimar
y an
d S
econ
dary
Sch
ools
. Fig
ures
are
Go
vt
To
tal
clas
sifie
d by
type
acc
ordi
ng to
thei
r sec
onda
ry s
ectio
ns.
Ind
ep
Aid
ed
1)
Mix
ed L
evel
com
pris
es P
rimar
y &
Sec
onda
ry S
choo
ls (P
1-S
4/5)
, Sec
onda
ry &
Jun
ior C
olle
ge S
choo
ls (S
1-JC
2);
Ce
ntr
ali
se
d
Ins
titu
te4
Go
vt
Ind
ep
Ju
nio
r C
oll
eg
e3
24
2008
2009
2010
2011
2012
2013
2014
2015
2016
EN
RO
LM
EN
T B
Y L
EV
EL
(R
efe
r to
Ta
ble
17
)
0
50
,000
10
0,0
00
15
0,0
00
20
0,0
00
25
0,0
00
30
0,0
00 2
007
2008
200
92
01
02
01
12
01
22013
2014
201
52
01
6
Prim
ary
Sec
onda
ryP
re-U
nive
rsity
25
Go
vt
Aid
ed
To
tal
Go
vt
Aid
ed
Au
to 2
Ind
ep
To
tal
Go
vt
Aid
ed
Au
to 2
Ind
ep
To
tal
1960
MF
139,9
32
143,1
04
283,0
36
26,3
00
24,6
23
--
-50,9
23
1,2
98
3,8
30
--
5,1
28
339,0
87
F
61,6
3663
,430
125,
066
8,48
411
,607
--
-20
,091
330
1,44
2-
-1,
772
146,
929
1970
MF
233,6
92
129,1
50
362,8
42
97,9
97
35,4
08
--
-133,4
05
5,8
77
3,9
91
--
9,8
68
506,1
15
F
108,
947
60,4
7216
9,41
946
,472
18,8
30-
--
65,3
022,
664
1,62
7-
-4,
291
239,
012
1980
MF
214,1
87
77,3
23
291,5
10
115,1
85
40,3
48
--
-155,5
33
9,8
26
6,4
46
--
16,2
72
463,3
15
F
101,
232
37,9
7113
9,20
357
,734
21,0
34-
--
78,7
685,
799
3,81
9-
-9,
618
227,
589
1990
MF
195,9
94
61,7
63
257,7
57
116,6
93
35,5
89
-8,2
60
-160,5
42
21,1
07
8,1
07
--
29,2
14
447,5
13
F
91,7
4730
,437
122,
184
56,7
4120
,036
-1,
654
-78
,431
12,1
104,
268
--
16,3
7821
6,99
32000
MF
223,2
72
82,4
33
305,7
05
110,1
54
27,9
02
25,2
62
12,0
87
-175,4
05
16,4
52
8,3
52
--
24,8
04
505,9
14
F
106,
443
40,9
6414
7,40
750
,805
13,6
5914
,075
5,31
5-
83,8
549,
141
4,36
5-
-13
,506
244,
767
2007
MF
206,6
78
78,3
70
285,0
48
137,6
26
27,4
71
38,2
70
14,6
95
-218,0
62
19,0
95
6,9
49
128
5,4
55
31,6
27
534,7
37
F
97,7
1039
,299
137,
009
64,0
9411
,765
23,0
056,
270
-10
5,13
410
,608
3,88
893
2,55
717
,146
259,
289
Go
vt
Aid
ed
To
tal
Go
vt
Aid
ed
In
dep
Sp
ec
Sp
ec'd
3T
ota
lG
ovt
Aid
ed
Ind
ep
Sp
ec
To
tal
Ind
ep
3In
dep
3
2008
MF
202,5
47
76,7
25
279,2
72
158,3
28
43,4
90
13,2
25
1,3
67
671
217,0
81
19,8
45
6,9
47
5,6
11
176
32,5
79
528,9
32
F
95,7
6338
,643
134,
406
76,1
7021
,856
5,79
663
121
210
4,66
511
,162
3,86
42,
639
8417
,749
256,
820
2009
MF
196,8
30
75,4
24
272,2
54
157,9
04
43,3
67
13,3
09
1,5
67
1,0
83
217,2
30
19,4
78
6,7
12
5,6
57
263
32,1
10
521,5
94
F
93,1
4538
,181
131,
326
75,8
4921
,814
5,85
075
236
110
4,62
611
,152
3,65
32,
668
9617
,569
253,
521
2010
MF
189,9
99
73,9
07
263,9
06
155,0
33
42,9
34
13,2
60
1,9
53
1,2
08
214,3
88
19,4
40
6,8
77
5,7
17
386
32,4
20
510,7
14
F
90,0
3037
,507
127,
537
74,4
3721
,661
5,82
494
541
210
3,27
911
,100
3,81
62,
717
136
17,7
6924
8,58
52011
MF
185,4
51
72,8
42
258,2
93
148,9
12
42,4
12
13,1
18
2,2
12
1,3
20
207,9
74
19,1
38
6,8
21
5,8
24
513
32,2
96
498,5
63
F
87,8
5836
,953
124,
811
71,5
3721
,546
5,78
91,
024
450
100,
346
10,8
023,
742
2,78
223
917
,565
242,
722
2012
MF
180,8
29
71,9
06
252,7
35
143,9
43
41,6
20
13,0
24
2,4
65
1,4
68
202,5
20
19,0
35
6,6
18
5,8
11
623
32,0
87
487,3
42
F
85,8
3736
,617
122,
454
69,2
4021
,119
5,72
31,
119
522
97,7
2310
,834
3,53
62,
809
332
17,5
1123
7,68
82013
MF
173,7
21
70,3
24
244,0
45
139,5
42
40,4
56
12,7
59
2,6
93
1,7
15
197,1
65
19,1
09
6,5
45
5,8
81
630
32,1
65
473,3
75
F
82,6
9235
,930
118,
622
67,2
6920
,512
5,61
91,
200
617
95,2
1710
,797
3,45
62,
874
328
17,4
5523
1,29
42014
MF
171,9
75
69,7
08
241,6
83
133,1
03
39,5
55
12,5
85
2,6
99
2,1
65
190,1
07
18,7
55
6,2
78
5,9
08
672
31,6
13
463,4
03
F
81,9
1235
,791
117,
703
64,0
4920
,036
5,58
51,
211
783
91,6
6410
,474
3,33
02,
870
361
17,0
3522
6,40
22015
MF
169,9
72
69,1
30
239,1
02
129,8
11
38,5
94
12,3
99
2,6
70
2,5
62
186,0
36
17,4
76
5,6
59
5,7
17
707
29,5
59
454,6
97
F
81,0
8735
,521
116,
608
62,6
2619
,502
5,55
21,
200
908
89,7
889,
722
3,08
52,
775
385
15,9
6722
2,36
32016
MF
169,3
89
68,7
51
238,1
40
124,8
45
37,5
29
12,0
67
2,6
65
2,8
94
180,0
00
16,7
63
5,3
08
5,6
69
702
28,4
42
446,5
82
F
80,8
7135
,287
116,
158
60,5
3619
,051
5,47
81,
158
1,02
787,2
50
9,32
92,
893
2,76
638
115
,369
218,
777
Not
e:
1) P
re-U
nive
rsity
incl
udes
Jun
ior C
olle
ges,
Cen
tralis
ed In
stitu
te a
nd P
re-U
cen
tres.
2) S
ince
200
8, A
uton
omou
s sc
hool
s (A
uto)
hav
e be
en g
roup
ed u
nder
Gov
ernm
ent a
nd G
over
nmen
t-aid
ed s
choo
ls.
Pre
-Un
ivers
ity 1
Gra
nd
To
tal
17
E
NR
OL
ME
NT
BY
LE
VE
L A
ND
SC
HO
OL
TY
PE
Year
Sex
Pri
mary
Seco
nd
ary
3) "
Spe
c In
dep"
refe
rs to
"Spe
cial
ised
Inde
pend
ent"
and
"Spe
c'd"
refe
rs to
"Spe
cial
ised
".
26
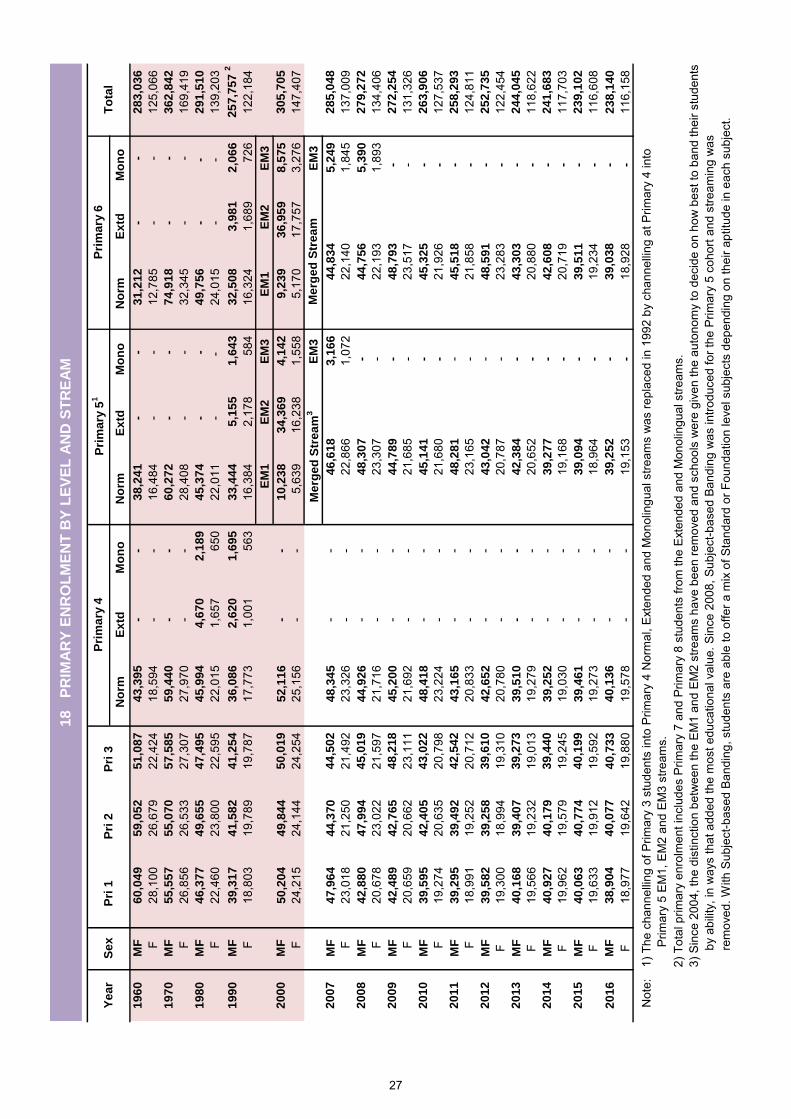
No
rmE
xtd
Mo
no
No
rmE
xtd
Mo
no
No
rm E
xtd
Mo
no
19
60
MF
60
,04
9
59
,05
2
51
,08
7
43
,39
5
-
-3
8,2
41
-
-
31
,21
2
-
-2
83
,03
6
F28
,100
26,6
79
22
,424
18,5
94
-
-16
,484
-
-
12,7
85
-
-12
5,06
6
1
97
0M
F5
5,5
57
5
5,0
70
5
7,5
85
5
9,4
40
-
-
60
,27
2
-
-7
4,9
18
-
-
36
2,8
42
F26
,856
26,5
33
27
,307
27,9
70
-
-28
,408
-
-
32,3
45
-
-16
9,41
9
1
98
0M
F4
6,3
77
4
9,6
55
4
7,4
95
4
5,9
94
4
,67
0
2
,18
9
4
5,3
74
-
-
49
,75
6
-
-
29
1,5
10
F22
,460
23,8
00
22
,595
22,0
15
1,
657
65
0
22
,011
-
-
24,0
15
-
-13
9,20
3
1
99
0M
F3
9,3
17
4
1,5
82
4
1,2
54
3
6,0
86
2
,62
0
1
,69
5
3
3,4
44
5
,15
5
1
,64
3
32
,50
8
3,9
81
2,0
66
2
57
,75
7 2
F18
,803
19,7
89
19
,787
17,7
73
1,
001
56
3
16
,384
2,17
8
584
16
,324
1,68
9
726
12
2,18
4
EM
1E
M2
E
M3
E
M1
E
M2
E
M3
20
00
MF
50
,20
4
49
,84
4
50
,01
9
52
,11
6
-
-1
0,2
38
3
4,3
69
4
,14
2
9,2
39
36
,95
9
8,5
75
3
05
,70
5
F24
,215
24,1
44
24
,254
25,1
56
-
-5,
639
16
,238
1,55
8
5,
170
17
,757
3,27
6
14
7,40
7
E
M3
E
M3
20
07
MF
47
,96
4
44
,37
0
44
,50
2
48
,34
5
-
-
3,1
66
5
,24
9
28
5,0
48
F23
,018
21,2
50
21
,492
23,3
26
-
-1,
072
1,84
5
13
7,00
9
2
00
8M
F4
2,8
80
4
7,9
94
4
5,0
19
4
4,9
26
-
--
5,3
90
2
79
,27
2
F20
,678
23,0
22
21
,597
21,7
16
-
--
1,89
3
13
4,40
6
2
00
9M
F4
2,4
89
4
2,7
65
4
8,2
18
4
5,2
00
-
--
-2
72
,25
4
F20
,659
20,6
62
23
,111
21,6
92
-
--
-13
1,32
6
2
01
0M
F3
9,5
95
4
2,4
05
4
3,0
22
4
8,4
18
-
--
-2
63
,90
6
F19
,274
20,6
35
20
,798
23,2
24
-
--
-12
7,53
7
2
01
1M
F3
9,2
95
3
9,4
92
4
2,5
42
4
3,1
65
-
--
-2
58
,29
3
F18
,991
19,2
52
20
,712
20,8
33
-
--
-12
4,81
1
2
01
2M
F3
9,5
82
3
9,2
58
3
9,6
10
4
2,6
52
-
--
-2
52
,73
5
F19
,300
18,9
94
19
,310
20,7
80
-
--
-12
2,45
4
2
01
3M
F4
0,1
68
3
9,4
07
3
9,2
73
3
9,5
10
-
-
--
24
4,0
45
F19
,566
19,2
32
19
,013
19,2
79
-
--
-11
8,62
2
2
01
4M
F4
0,9
27
4
0,1
79
3
9,4
40
3
9,2
52
-
--
-2
41
,68
3
F19
,962
19,5
79
19
,245
19,0
30
-
--
-11
7,70
3
2
01
5M
F4
0,0
63
4
0,7
74
4
0,1
99
3
9,4
61
-
--
-2
39
,10
2
F19
,633
19,9
12
19
,592
19,2
73
-
--
-11
6,60
8
2
01
6M
F3
8,9
04
4
0,0
77
4
0,7
33
4
0,1
36
-
--
-2
38
,14
0
F18
,977
19,6
42
19
,880
19,5
78
-
--
-11
6,15
8
Not
e:
1) T
he c
hann
ellin
g of
Prim
ary
3 st
uden
ts in
to P
rimar
y 4
Nor
mal
, Ext
ende
d an
d M
onol
ingu
al s
tream
s w
as re
plac
ed in
199
2 by
cha
nnel
ling
at P
rimar
y 4
into
P
rimar
y 5
EM
1, E
M2
and
EM
3 st
ream
s.2)
Tot
al p
rimar
y en
rolm
ent i
nclu
des
Prim
ary
7 an
d P
rimar
y 8
stud
ents
from
the
Ext
ende
d an
d M
onol
ingu
al s
tream
s.3)
Sin
ce 2
004,
the
dist
inct
ion
betw
een
the
EM
1 an
d E
M2
stre
ams
have
bee
n re
mov
ed a
nd s
choo
ls w
ere
give
n th
e au
tono
my
to d
ecid
e on
how
bes
t to
band
thei
r stu
dent
s
by
abili
ty, i
n w
ays
that
add
ed th
e m
ost e
duca
tiona
l val
ue. S
ince
200
8, S
ubje
ct-b
ased
Ban
ding
was
intro
duce
d fo
r the
Prim
ary
5 co
hort
and
stre
amin
g w
as
r
emov
ed. W
ith S
ubje
ct-b
ased
Ban
ding
, stu
dent
s ar
e ab
le to
offe
r a m
ix o
f Sta
ndar
d or
Fou
ndat
ion
leve
l sub
ject
s de
pend
ing
on th
eir a
ptitu
de in
eac
h su
bjec
t.
18,9
6419
,234
39
,25
23
9,0
38
19,1
5318
,928
39
,27
74
2,6
08
19,1
6820
,719
39
,09
43
9,5
11
20,7
8723
,283
42
,38
44
3,3
03
20,6
5220
,880
48
,28
14
5,5
18
23,1
6521
,858
43
,04
24
8,5
91
21,6
8523
,517
45
,14
14
5,3
25
21,6
8021
,926
48
,30
74
4,7
56
23,3
0722
,193
44
,78
94
8,7
93
Me
rge
d S
tre
am
3
M
erg
ed
Str
ea
m
46
,61
84
4,8
34
22,8
6622
,140
18
PR
IMA
RY
EN
RO
LM
EN
T B
Y L
EV
EL
AN
D S
TR
EA
M
Ye
ar
Se
xP
ri 1
Pri
2P
ri 3
Pri
ma
ry 4
Pri
ma
ry 5
1P
rim
ary
6T
ota
l
27

Sp
ec
ial
Ex
pre
ss
1N
orm
al
(Ac
ad
)
No
rma
l
(Te
ch
)2T
ota
lS
pe
cia
lE
xp
res
s1
No
rma
l
(Ac
ad
)
No
rma
l
(Te
ch
)2T
ota
lS
pe
cia
lE
xp
res
s1
No
rma
l
(Ac
ad
)
No
rma
l
(Te
ch
)2T
ota
l
19
60
MF
-2
0,8
42
--
20
,84
2
-
13
,04
8
-
-1
3,0
48
-9
,33
3
--
9,3
33
F-
8,04
0
-
-8,
040
-5,
597
--
5,59
7
-
3,71
0
-
-3,
710
19
70
MF
-3
8,2
00
--
38
,20
0
-
36
,97
0
-
-3
6,9
70
-3
0,4
85
--
30
,48
5
F-
18,8
86
--
18,8
86
-17
,701
-
-17
,701
-
15,0
71
--
15,0
71
19
80
MF
1,5
11
45
,48
9
-
-4
7,0
00
1,7
37
39
,06
8
-
-4
0,8
05
-3
4,8
03
--
34
,80
3
F80
022
,509
-
-23
,309
97
8
19,7
65
--
20,7
43
-17
,860
-
-17
,860
1
99
0M
F2
,35
42
0,1
13
13
,29
2
-
35
,75
9
2
,27
8
2
2,3
36
13
,16
7
-
37
,78
1
2
,22
8
2
1,5
03
12
,62
3
-
36
,35
4
F1,
133
10,0
27
6,27
9
-
17,4
39
1,13
4
11
,114
6,
093
-18
,341
1,
092
10
,790
5,
897
-17
,779
2
00
0M
F4
,18
22
2,5
85
9,8
55
7
,79
5
44
,41
7
3
,76
6
1
9,9
39
9,4
72
5
,80
8
38
,98
5
4
,32
9
2
2,5
73
10
,60
9
5
,97
5
43
,48
6
F2,
239
11,3
01
4,68
7
3,
160
21,3
87
1,99
7
10
,126
4,
270
2,35
9
18
,752
2,
262
11
,353
4,
738
2,38
6
20
,739
20
07
MF
4,2
38
27
,39
6
1
1,9
81
7,0
72
5
0,6
87
4,2
77
27
,47
3
1
3,2
82
6,9
94
5
2,0
26
4,8
18
27
,85
6
1
4,3
86
6,6
00
5
3,6
60
F2,
380
13,8
92
5,64
0
2,
593
24,5
05
2,34
6
14
,201
6,
059
2,53
0
25
,136
2,
698
14
,281
6,
386
2,36
4
25
,729
2
00
8M
F-
30
,87
3
1
2,8
11
6,5
30
5
0,2
14
4,1
56
27
,78
1
1
2,8
79
7,0
14
5
1,8
30
4,7
51
28
,45
6
1
4,4
81
6,8
69
5
4,5
57
F-
15,9
58
5,95
6
2,
210
24,1
24
2,34
9
14
,251
5,
976
2,51
8
25
,094
2,
574
14
,743
6,
373
2,47
8
26
,168
2
00
9M
F-
30
,80
8
1
2,4
89
6,7
86
5
0,0
83
-3
1,1
59
13
,44
5
6
,43
9
51
,04
3
4
,62
6
2
8,9
59
13
,93
2
6
,92
3
54
,44
0
F-
15,8
82
5,81
1
2,
384
24,0
77
-16
,222
6,
143
2,17
2
24
,537
2,
572
14
,919
6,
214
2,46
1
26
,166
2
01
0M
F-
29
,78
5
1
2,3
94
6,4
91
4
8,6
70
-3
1,2
96
12
,97
8
6
,66
1
50
,93
5
-
32
,93
3
1
4,0
48
6,1
97
5
3,1
78
F-
15,4
17
5,83
2
2,
260
23,5
09
-16
,230
6,
023
2,28
5
24
,538
-
17,1
40
6,28
7
2,
047
25,4
74
20
11
MF
-2
7,7
32
11
,43
6
6
,04
5
45
,21
3
-
30
,22
6
1
2,8
82
6,2
48
4
9,3
56
-3
2,8
69
13
,57
9
6
,51
3
52
,96
1
F-
14,2
40
5,47
5
2,
172
21,8
87
-15
,746
5,
984
2,14
6
23
,876
-
17,0
69
6,15
1
2,
215
25,4
35
20
12
MF
-2
7,2
93
11
,84
8
6
,05
7
45
,19
8
-
28
,03
8
1
1,8
25
5,8
42
4
5,7
05
-3
1,3
87
13
,32
4
6
,08
4
50
,79
5
F-
13,8
03
5,63
6
2,
289
21,7
28
-14
,507
5,
551
2,07
1
22
,129
-
16,3
78
6,08
3
2,
069
24,5
30
20
13
MF
-2
8,8
70
12
,74
7
6
,47
7
48
,09
4
-
27
,67
1
1
2,1
32
5,7
45
4
5,5
48
-2
8,8
97
12
,14
4
5
,67
4
46
,71
5
F-
14,8
02
5,95
5
2,
346
23,1
03
-14
,077
5,
695
2,09
5
21
,867
-
15,0
16
5,55
4
1,
992
22,5
62
20
14
MF
-2
7,4
90
9,8
73
5
,60
6
42
,96
9
-
29
,24
1
1
2,9
73
6,1
14
4
8,3
28
-2
8,6
19
12
,44
7
5
,64
6
46
,71
2
F-
13,9
63
4,71
3
2,
080
20,7
56
-15
,071
5,
988
2,16
9
23
,228
-
14,6
07
5,69
8
2,
029
22,3
34
20
15
MF
-2
6,7
36
9,9
72
5
,50
9
42
,21
7
-
27
,71
9
1
0,1
41
5,3
96
4
3,2
56
-3
0,0
07
13
,22
2
5
,97
3
49
,20
2
F-
13,8
41
4,55
6
2,
191
20,5
88
-14
,155
4,
791
1,94
7
20
,893
-
15,5
30
5,92
7
2,
098
23,5
55
20
16
MF
-2
4,6
13
10
,03
3
4
,90
4
39
,55
0
-
26
,97
6
1
0,2
48
5,2
53
4
2,4
77
-2
8,3
87
10
,61
4
5
,24
9
44
,25
0
F-
12,5
68
4,79
5
1,
899
19,2
62
-14
,020
4,
651
2,03
1
20
,702
-
14,5
19
4,87
0
1,
855
21,2
44
Con
tinue
d ne
xt p
age
Not
e:
As
coho
rts p
rogr
ess
over
the
year
s, th
e nu
mbe
rs a
cros
s co
urse
s m
ay fl
uctu
ate
as s
tude
nts
have
opp
ortu
nitie
s to
tran
sfer
late
rally
acr
oss
cour
ses.
1
) Spe
cial
and
Exp
ress
stre
ams
have
bee
n m
erge
d si
nce
the
2008
Sec
onda
ry 1
coh
ort.
2) N
orm
al(T
ech)
incl
ude
stud
ents
on
the
ITE
Ski
ll C
ertif
icat
e (IS
C) c
ours
e.
19.1
S
EC
ON
DA
RY
EN
RO
LM
EN
T B
Y L
EV
EL
AN
D C
OU
RS
E
Ye
ar
Se
x
Se
co
nd
ary
1S
ec
on
da
ry 2
Se
co
nd
ary
3
28
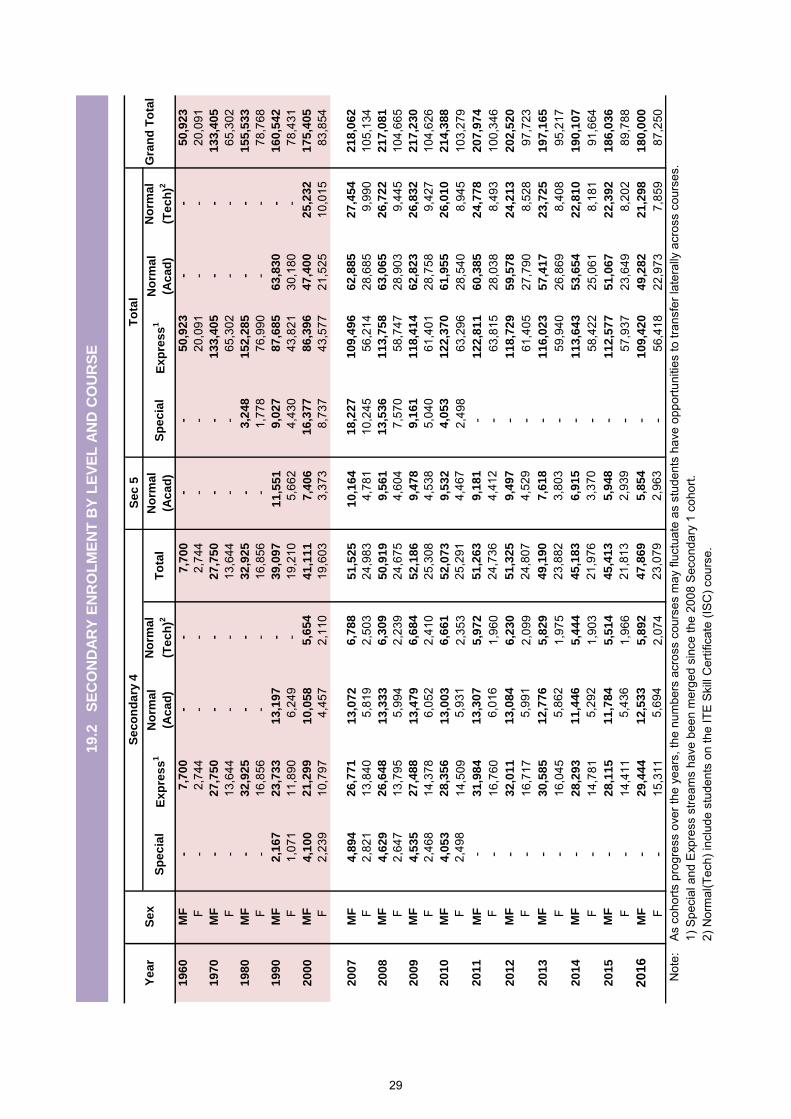
Se
c 5
Sp
ec
ial
Ex
pre
ss
1N
orm
al
(Ac
ad
)
No
rma
l
(Te
ch
)2T
ota
lN
orm
al
(Ac
ad
)S
pe
cia
lE
xp
res
s1
No
rma
l
(Ac
ad
)
No
rma
l
(Te
ch
)2
19
60
MF
-7
,70
0-
-7
,70
0-
-5
0,9
23
--
50
,92
3
F-
2,74
4-
-2,
744
--
20,0
91-
-20
,091
19
70
MF
-2
7,7
50
--
27
,75
0-
-1
33
,40
5-
-1
33
,40
5
F-
13,6
44-
-13
,644
--
65,3
02-
-65
,302
19
80
MF
-3
2,9
25
--
32
,92
5-
3,2
48
15
2,2
85
--
15
5,5
33
F-
16,8
56-
-16
,856
-1,
778
76,9
90-
-78
,768
19
90
MF
2,1
67
23
,73
31
3,1
97
-3
9,0
97
11
,55
19
,02
78
7,6
85
63
,83
0-
16
0,5
42
F1,
071
11,8
906,
249
-19
,210
5,66
24,
430
43,8
2130
,180
-78
,431
20
00
MF
4,1
00
21
,29
91
0,0
58
5,6
54
41
,11
17
,40
61
6,3
77
86
,39
64
7,4
00
25
,23
21
75
,40
5
F2,
239
10,7
974,
457
2,11
019
,603
3,37
38,
737
43,5
7721
,525
10,0
1583
,854
20
07
MF
4,8
94
26
,77
11
3,0
72
6,7
88
51
,52
51
0,1
64
18
,22
71
09
,49
66
2,8
85
27
,45
42
18
,06
2
F2,
821
13,8
405,
819
2,50
324
,983
4,78
110
,245
56,2
1428
,685
9,99
010
5,13
42
00
8M
F4
,62
92
6,6
48
13
,33
36
,30
95
0,9
19
9,5
61
13
,53
61
13
,75
86
3,0
65
26
,72
22
17
,08
1
F2,
647
13,7
955,
994
2,23
924
,675
4,60
47,
570
58,7
4728
,903
9,44
510
4,66
52
00
9M
F4
,53
52
7,4
88
13
,47
96
,68
45
2,1
86
9,4
78
9,1
61
11
8,4
14
62
,82
32
6,8
32
21
7,2
30
F2,
468
14,3
786,
052
2,41
025
,308
4,53
85,
040
61,4
0128
,758
9,42
710
4,62
62
01
0M
F4
,05
32
8,3
56
13
,00
36
,66
15
2,0
73
9,5
32
4,0
53
12
2,3
70
61
,95
52
6,0
10
21
4,3
88
F2,
498
14,5
095,
931
2,35
325
,291
4,46
72,
498
63,2
9628
,540
8,94
510
3,27
92
01
1M
F-
31
,98
41
3,3
07
5,9
72
51
,26
39
,18
1-
12
2,8
11
60
,38
52
4,7
78
20
7,9
74
F-
16,7
606,
016
1,96
024
,736
4,41
2-
63,8
1528
,038
8,49
310
0,34
62
01
2M
F-
32
,01
11
3,0
84
6,2
30
51
,32
59
,49
7-
11
8,7
29
59
,57
82
4,2
13
20
2,5
20
F-
16,7
175,
991
2,09
924
,807
4,52
9-
61,4
0527
,790
8,52
897
,723
20
13
MF
-3
0,5
85
12
,77
65
,82
94
9,1
90
7,6
18
-1
16
,02
35
7,4
17
23
,72
51
97
,16
5
F-
16,0
455,
862
1,97
523
,882
3,80
3-
59,9
4026
,869
8,40
895
,217
20
14
MF
-2
8,2
93
11
,44
65
,44
44
5,1
83
6,9
15
-1
13
,64
35
3,6
54
22
,81
01
90
,10
7
F-
14,7
815,
292
1,90
321
,976
3,37
0-
58,4
2225
,061
8,18
191
,664
20
15
MF
-2
8,1
15
11
,78
45
,51
44
5,4
13
5,9
48
-1
12
,57
75
1,0
67
22
,39
21
86
,03
6
F-
14,4
115,
436
1,96
621
,813
2,93
9-
57,9
3723
,649
8,20
289
,788
2016
MF
-2
9,4
44
12
,53
35
,89
24
7,8
69
5,8
54
-1
09
,42
04
9,2
82
21
,29
81
80
,00
0
F-
15,3
115,
694
2,07
423
,079
2,96
3-
56,4
1822
,973
7,85
987
,250
Not
e:
As
coho
rts p
rogr
ess
over
the
year
s, th
e nu
mbe
rs a
cros
s co
urse
s m
ay fl
uctu
ate
as s
tude
nts
have
opp
ortu
nitie
s to
tran
sfer
late
rally
acr
oss
cour
ses.
1) S
peci
al a
nd E
xpre
ss s
tream
s ha
ve b
een
mer
ged
sinc
e th
e 20
08 S
econ
dary
1 c
ohor
t.2)
Nor
mal
(Tec
h) in
clud
e st
uden
ts o
n th
e IT
E S
kill
Cer
tific
ate
(ISC
) cou
rse.
19.2
S
EC
ON
DA
RY
EN
RO
LM
EN
T B
Y L
EV
EL
AN
D C
OU
RS
E
Ye
ar
Se
x
Se
co
nd
ary
4T
ota
l
Gra
nd
To
tal
29
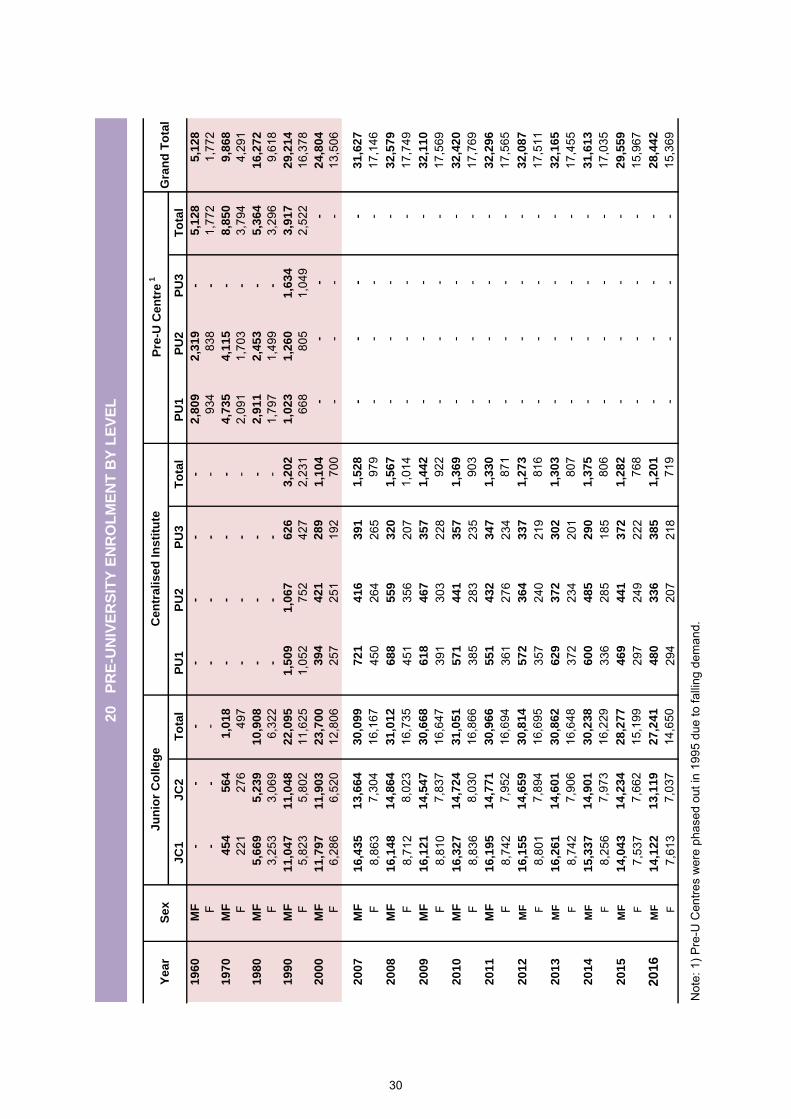
JC
1J
C2
To
tal
PU
1P
U2
PU
3T
ota
l
PU
1
P
U2
PU
3T
ota
l
19
60
MF
-
-
--
--
-2
,80
92
,31
9-
5,1
28
5,1
28
F-
-
-
--
--
934
838
-1,
772
1,77
21
97
0M
F4
54
56
41
,01
8-
--
-4
,73
54
,11
5-
8,8
50
9,8
68
F22
127
649
7-
--
-2,
091
1,70
3-
3,79
44,
291
19
80
MF
5,6
69
5,2
39
10
,90
8-
--
-2
,91
12
,45
3-
5,3
64
16
,27
2
F3,
253
3,06
96,
322
--
--
1,79
71,
499
-3,
296
9,61
81
99
0M
F1
1,0
47
11
,04
82
2,0
95
1,5
09
1,0
67
62
63
,20
21
,02
31
,26
01
,63
43
,91
72
9,2
14
F5,
823
5,80
211
,625
1,05
275
242
72,
231
668
805
1,04
92,
522
16,3
782
00
0M
F1
1,7
97
11
,90
32
3,7
00
39
44
21
28
91
,10
4-
-
-
-
2
4,8
04
F6,
286
6,52
012
,806
257
251
192
700
-
-
-
-
13,5
06
20
07
MF
16
,43
51
3,6
64
30
,09
97
21
41
63
91
1,5
28
-
-
-
-
31
,62
7
F8,
863
7,30
416
,167
450
264
265
979
-
-
-
-
17,1
462
00
8M
F1
6,1
48
14
,86
43
1,0
12
68
85
59
32
01
,56
7-
-
-
-
3
2,5
79
F8,
712
8,02
316
,735
451
356
207
1,01
4-
-
-
-
17
,749
20
09
MF
16
,12
11
4,5
47
30
,66
86
18
46
73
57
1,4
42
-
-
-
-
32
,11
0
F8,
810
7,83
716
,647
391
303
228
922
-
-
-
-
17,5
692
01
0M
F1
6,3
27
14
,72
43
1,0
51
57
14
41
35
71
,36
9-
-
-
-
3
2,4
20
F8,
836
8,03
016
,866
385
283
235
903
-
-
-
-
17,7
692
01
1M
F1
6,1
95
14
,77
13
0,9
66
55
14
32
34
71
,33
0-
-
-
-
3
2,2
96
F8,
742
7,95
216
,694
361
276
234
871
-
-
-
-
17,5
652
01
2M
F1
6,1
55
14
,65
93
0,8
14
57
23
64
33
71
,27
3-
-
-
-
3
2,0
87
F8,
801
7,89
416
,695
357
240
219
816
-
-
-
-
17,5
112
01
3M
F1
6,2
61
14
,60
13
0,8
62
62
93
72
30
21
,30
3-
-
-
-
3
2,1
65
F8,
742
7,90
616
,648
372
234
201
807
-
-
-
-
17,4
552
01
4M
F1
5,3
37
14
,90
13
0,2
38
60
04
85
29
01
,37
5-
-
-
-
3
1,6
13
F8,
256
7,97
316
,229
336
285
185
806
-
-
-
-
17,0
352
01
5M
F1
4,0
43
14
,23
42
8,2
77
46
94
41
37
21
,28
2-
-
-
-
2
9,5
59
F7,
537
7,66
215
,199
297
249
222
768
-
-
-
-
15,9
672016
MF
14
,12
21
3,1
19
27
,24
14
80
33
63
85
1,2
01
-
-
-
-
28
,44
2
F7,
613
7,03
714
,650
294
207
218
719
-
-
-
-
15,3
69
Not
e: 1
) Pre
-U C
entre
s w
ere
phas
ed o
ut in
199
5 du
e to
falli
ng d
eman
d.
20
PR
E-U
NIV
ER
SIT
Y E
NR
OL
ME
NT
BY
LE
VE
L
Ye
ar
Se
xJ
un
ior
Co
lle
ge
Cen
trali
se
d I
ns
titu
teP
re-U
Ce
ntr
e 1
Gra
nd
To
tal
30
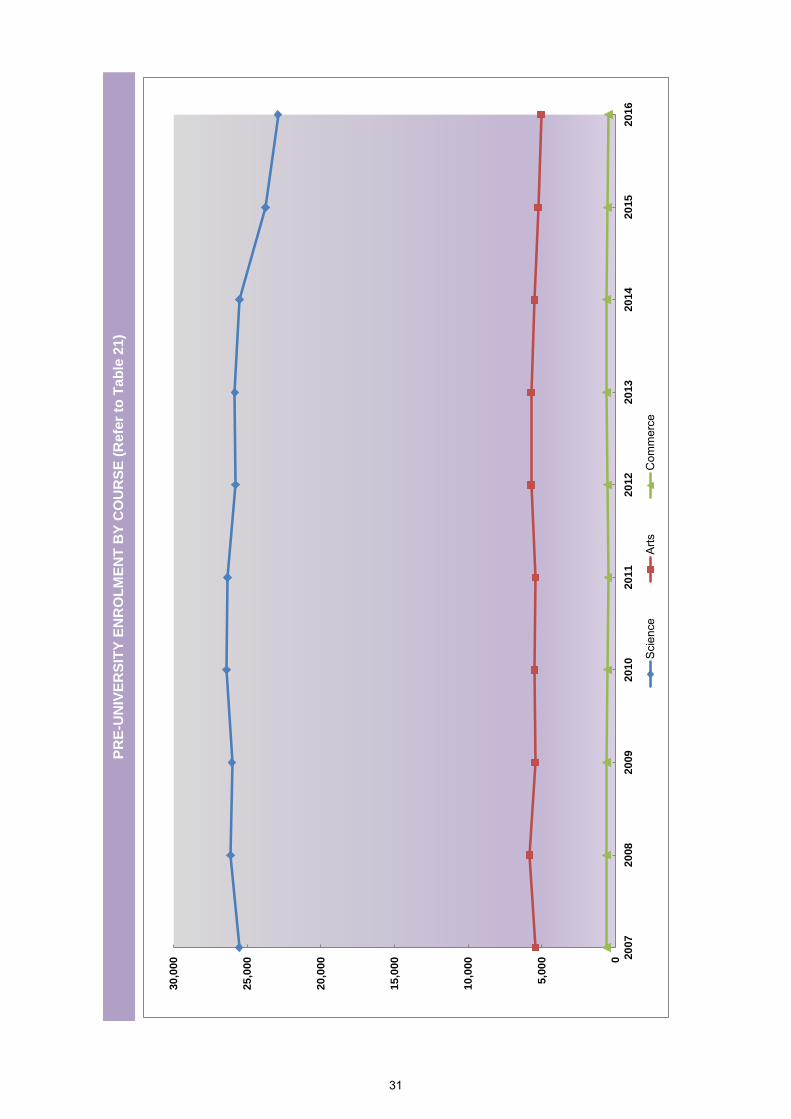
PR
E-U
NIV
ER
SIT
Y E
NR
OL
ME
NT
BY
CO
UR
SE
(R
efe
r to
Ta
ble
21
)
0
5,0
00
10
,000
15
,000
20
,000
25
,000
30
,000 2
007
20
08
20
09
20
10
20
11
20
12
20
13
20
14
20
15
20
16
Sci
ence
Arts
Com
mer
ce
31
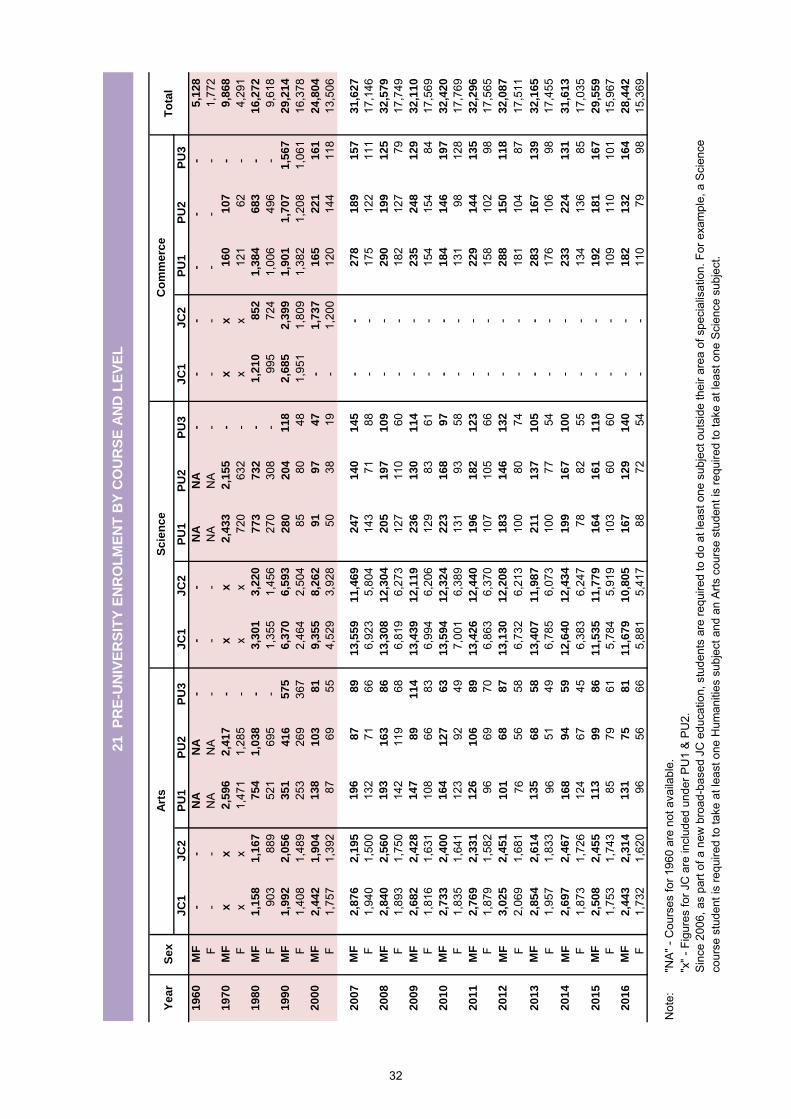
JC
1 JC
2P
U1
PU
2P
U3
JC
1 J
C2
PU
1P
U2
PU
3JC
1 JC
2 P
U1
PU
2 P
U3
1960
MF
--
NA
NA
--
-N
AN
A-
--
--
-5,1
28
F-
-N
AN
A-
--
NA
NA
--
--
--
1,77
2
1970
MF
xx
2,5
96
2,4
17
-
xx
2,4
33
2,1
55
-x
x160
107
-9,8
68
Fx
x1,
471
1,28
5
-
xx
720
63
2
-x
x12
1
62
-
4,29
1
1980
MF
1,1
58
1,1
67
754
1,0
38
-
3,3
01
3,2
20
773
732
-1,2
10
852
1,3
84
683
-16,2
72
F90
3
889
52
1
695
-
1,35
5
1,
456
270
30
8
-99
5
724
1,
006
496
-
9,61
8
1990
MF
1,9
92
2,0
56
351
416
575
6,3
70
6,5
93
280
204
118
2,6
85
2,3
99
1,9
01
1,7
07
1,5
67
29,2
14
F1,
408
1,48
9
25
3
269
36
7
2,46
4
2,
504
85
80
48
1,95
1
1,
809
1,38
2
1,
208
1,06
1
16
,378
2000
MF
2,4
42
1,9
04
138
103
81
9,3
55
8,2
62
91
97
47
-1,7
37
165
221
161
24,8
04
F1,
757
1,39
2
87
69
55
4,
529
3,92
8
50
38
19
-
1,20
0
12
0
144
11
8
13,5
06
2007
MF
2,8
76
2,1
95
196
87
89
13,5
59
11,4
69
247
140
145
--
278
189
157
31,6
27
F1,
940
1,50
0
13
2
71
66
6,
923
5,80
4
14
3
71
88
-
-17
5
122
11
1
17,1
46
2008
MF
2,8
40
2,5
60
193
163
86
13,3
08
12,3
04
205
197
109
--
290
199
125
32,5
79
F1,
893
1,75
0
14
2
119
68
6,
819
6,27
3
12
7
110
60
-
-18
2
127
79
17,7
49
2009
MF
2,6
82
2,4
28
147
89
114
13,4
39
12,1
19
236
130
114
--
235
248
129
32,1
10
F1,
816
1,63
1
10
8
66
83
6,
994
6,20
6
12
9
83
61
-
-15
4
154
84
17,5
69
2010
MF
2,7
33
2,4
00
164
127
63
13,5
94
12,3
24
223
168
97
--
184
146
197
32,4
20
F1,
835
1,64
1
12
3
92
49
7,
001
6,38
9
13
1
93
58
-
-13
1
98
12
8
17,7
69
2011
MF
2,7
69
2,3
31
126
106
89
13,4
26
12,4
40
196
182
123
--
229
144
135
32,2
96
F1,
879
1,58
2
96
69
70
6,
863
6,37
0
10
7
105
66
-
-15
8
102
98
17,5
65
2012
MF
3,0
25
2,4
51
101
68
87
13,1
30
12,2
08
183
146
132
--
288
150
118
32,0
87
F2,
069
1,68
1
76
56
58
6,
732
6,21
3
10
0
80
74
-
-18
1
104
87
17,5
11
2013
MF
2,8
54
2,6
14
135
68
58
13,4
07
11,9
87
211
137
105
--
283
167
139
32,1
65
F1,
957
1,83
3
96
51
49
6,
785
6,07
3
10
0
77
54
-
-17
6
106
98
17,4
55
2014
MF
2,6
97
2,4
67
168
94
59
12,6
40
12,4
34
199
167
100
--
233
224
131
31,6
13
F1,
873
1,72
6
12
4
67
45
6,
383
6,24
7
78
82
55
-
-13
4
136
85
17,0
35
2015
MF
2,5
08
2,4
55
113
99
86
11,5
35
11,7
79
164
161
119
--
192
181
167
29,5
59
F1,
753
1,74
3
85
79
61
5,
784
5,91
9
10
3
60
60
-
-10
9
110
10
1
15,9
67
2016
MF
2,4
43
2,3
14
131
75
81
11,6
79
10,8
05
167
129
140
--
182
132
164
28,4
42
F1,
732
1,62
0
96
56
66
5,
881
5,41
7
88
72
54
-
-11
0
79
98
15,3
69
Not
e:
"NA
" - C
ours
es fo
r 196
0 ar
e no
t ava
ilabl
e."x
" - F
igur
es fo
r JC
are
incl
uded
und
er P
U1
& P
U2.
Sin
ce 2
006,
as
part
of a
new
bro
ad-b
ased
JC
edu
catio
n, s
tude
nts
are
requ
ired
to d
o at
leas
t one
sub
ject
out
side
thei
r are
a of
spe
cial
isat
ion.
For
exa
mpl
e, a
Sci
ence
cour
se s
tude
nt is
requ
ired
to ta
ke a
t lea
st o
ne H
uman
ities
sub
ject
and
an
Arts
cou
rse
stud
ent i
s re
quire
d to
take
at l
east
one
Sci
ence
sub
ject
.
21
P
RE
-UN
IVE
RS
ITY
EN
RO
LM
EN
T B
Y C
OU
RS
E A
ND
LE
VE
L
Year
Sex
Art
sS
cie
nce
Co
mm
erc
eT
ota
l
32

NU
MB
ER
OF
TE
AC
HE
RS
BY
LE
VE
L (
Refe
r to
Tab
le 2
2)
0
2,0
00
4,0
00
6,0
00
8,0
00
10
,000
12
,000
14
,000
16
,000
18
,000 2
007
20
08
20
09
20
10
20
11
20
12
20
13
20
14
20
15
20
16
Prim
ary
Sec
onda
ryP
re-U
nive
rsity
33
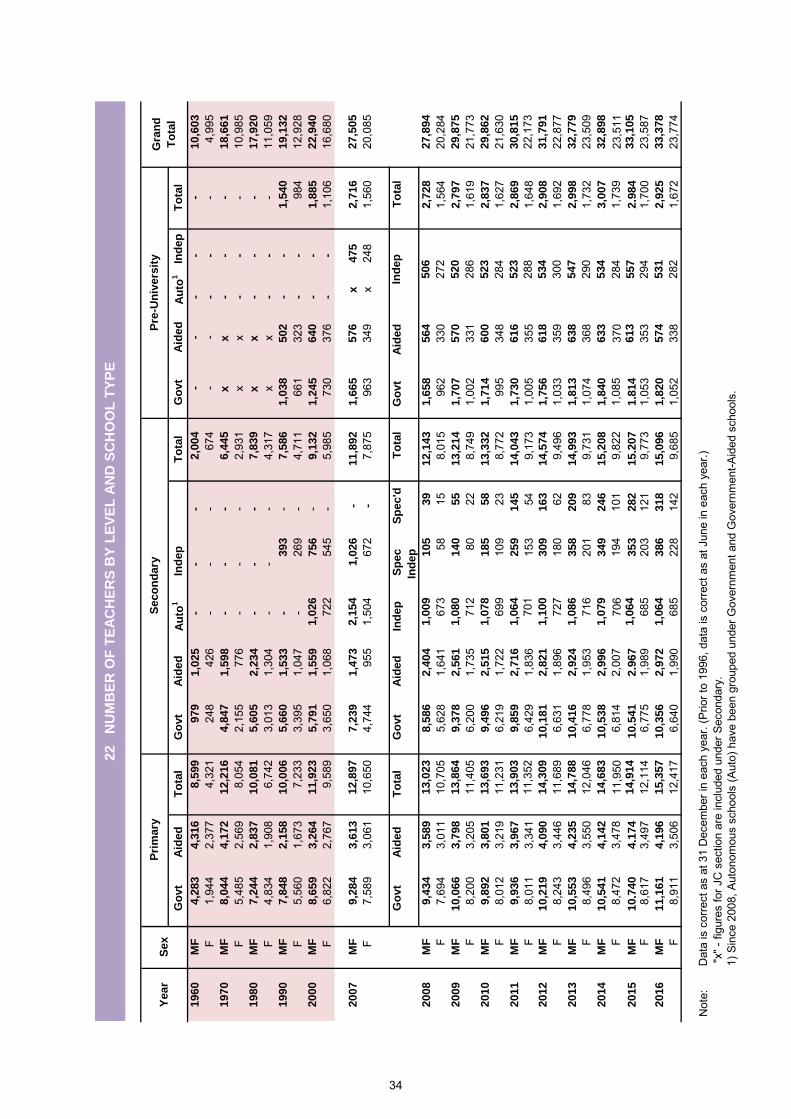
Go
vt
Aid
ed
To
tal
Go
vt
Aid
ed
A
uto
1In
dep
To
tal
Go
vt
Aid
ed
Au
to1
Ind
ep
To
tal
1960
MF
4,2
83
4,3
16
8,5
99
979
1,0
25
-
-
-
2,0
04
-
-
-
-
-10,6
03
F1,
944
2,37
7
4,
321
24
8
426
-
- -
674
-
-
-
-
-4,
995
1970
MF
8,0
44
4,1
72
12,2
16
4,8
47
1,5
98
-
-
-
6,4
45
x
x
-
-
-
18,6
61
F5,
485
2,56
9
8,
054
2,
155
776
-
- -
2,93
1x
x
-
-
-
10,9
851980
MF
7,2
44
2,8
37
10,0
81
5,6
05
2,2
34
-
-
-
7,8
39
x
x
-
-
-
17,9
20
F4,
834
1,90
8
6,
742
3,
013
1,30
4
-
- -
4,31
7x
x
-
-
-
11,0
591990
MF
7,8
48
2,1
58
10,0
06
5,6
60
1,5
33
-
393
-
7,5
86
1,0
38
502
-
-
1,5
40
19,1
32
F5,
560
1,67
3
7,
233
3,
395
1,04
7
-
269
- 4,
711
661
323
-
-
984
12,9
282000
MF
8,6
59
3,2
64
11,9
23
5,7
91
1,5
59
1,0
26
756
-
9,1
32
1,2
45
640
-
-
1,8
85
22,9
40
F6,
822
2,76
7
9,
589
3,
650
1,06
8
72
2
545
- 5,
985
730
376
-
-
1,10
616
,680
2007
MF
9,2
84
3,6
13
12,8
97
7,2
39
1,4
73
2,1
54
1,0
26
-11,8
92
1,6
65
576
x475
2,7
16
27,5
05
F7,
589
3,06
1
10
,650
4,74
4
95
5
1,50
4
67
2
-
7,87
596
334
9x
248
1,
560
20,0
85
Go
vt
Aid
ed
To
tal
Go
vt
Aid
ed
In
dep
Sp
ec
Sp
ec'd
To
tal
Go
vt
Aid
ed
To
tal
Ind
ep
2008
MF
9,4
34
3,5
89
13,0
23
8,5
86
2,4
04
1,0
09
105
39
12,1
43
1,6
58
564
2,7
28
27,8
94
F
7,69
4
3,
011
10,7
05
5,
628
1,64
1
67
3
58
15
8,01
596
233
01,
564
20,2
842009
MF
10,0
66
3,7
98
13,8
64
9,3
78
2,5
61
1,0
80
140
55
13,2
14
1,7
07
570
2,7
97
29,8
75
F
8,20
0
3,
205
11,4
05
6,
200
1,73
5
71
2
80
22
8,74
91,
002
331
1,61
921
,773
2010
MF
9,8
92
3,8
01
13,6
93
9,4
96
2,5
15
1,0
78
185
58
13,3
32
1,7
14
600
2,8
37
29,8
62
F
8,01
2
3,
219
11,2
31
6,
219
1,72
2
69
9
109
23
8,77
299
534
81,
627
21,6
302011
MF
9,9
36
3,9
67
13,9
03
9,8
59
2,7
16
1,0
64
259
145
14,0
43
1,7
30
616
2,8
69
30,8
15
F
8,01
1
3,
341
11,3
52
6,
429
1,83
6
70
1
153
54
9,17
31,
005
355
1,64
822
,173
2012
MF
10,2
19
4,0
90
14,3
09
10,1
81
2,8
21
1,1
00
309
163
14,5
74
1,7
56
618
2,9
08
31,7
91
F
8,24
3
3,
446
11,6
89
6,
631
1,89
6
72
7
180
62
9,49
61,
033
359
1,69
222
,877
2013
MF
10,5
53
4,2
35
14,7
88
10,4
16
2,9
24
1,0
86
358
209
14,9
93
1,8
13
638
2,9
98
32,7
79
F
8,49
6
3,
550
12,0
46
6,
778
1,95
3
71
6
201
83
9,73
11,
074
368
1,73
223
,509
2014
MF
10,5
41
4,1
42
14,6
83
10,5
38
2,9
96
1,0
79
349
246
15,2
08
1,8
40
633
3,0
07
32,8
98
F
8,47
2
3,
478
11,9
50
6,
814
2,00
7
70
6
194
101
9,
822
1,08
537
01,
739
23,5
112015
MF
10,7
40
4,1
74
14,9
14
10,5
41
2,9
67
1,0
64
353
282
15,2
07
1,8
14
613
2,9
84
33,1
05
F
8,61
7
3,
497
12,1
14
6,
775
1,98
9
68
5
203
121
9,
773
1,05
335
31,
700
23,5
872016
MF
11,1
61
4,1
96
15,3
57
10,3
56
2,9
72
1,0
64
386
318
15,0
96
1,8
20
574
2,9
25
33,3
78
F
8,91
1
3,
506
12,4
17
6,
640
1,99
0
68
5
228
142
9,
685
1,05
233
81,
672
23,7
74
Not
e:
Dat
a is
cor
rect
as
at 3
1 D
ecem
ber i
n ea
ch y
ear.
(Prio
r to
1996
, dat
a is
cor
rect
as
at J
une
in e
ach
year
.) "x
" - fi
gure
s fo
r JC
sec
tion
are
incl
uded
und
er S
econ
dary
.1)
Sin
ce 2
008,
Aut
onom
ous
scho
ols
(Aut
o) h
ave
been
gro
uped
und
er G
over
nmen
t and
Gov
ernm
ent-A
ided
sch
ools
.
506
300
Ind
ep
272
290
534
547
523
22 N
UM
BE
R O
F T
EA
CH
ER
S B
Y L
EV
EL
AN
D S
CH
OO
L T
YP
E
Year
Sex
Pri
mary
Seco
nd
ary
Gra
nd
To
tal
Pre
-Un
ivers
ity
520
286
523
284
288
534
284
557
294
531
282
34

INT
AK
E:
UN
IVE
RS
ITIE
S,
PO
LY
TE
CH
NIC
S,
LA
SA
LL
E,
NA
FA
AN
D I
TE
(F
UL
L-T
IME
) (R
efe
r to
Ta
ble
23)
0
5,0
00
10
,000
15
,000
20
,000
25
,000
30
,000 2
007
20
08
20
09
20
10
20
11
20
12
20
13
20
14
20
15
20
16
Uni
vers
ities
NIE
Pol
ytec
hnic
sLA
SALL
EN
AFA
ITE
35
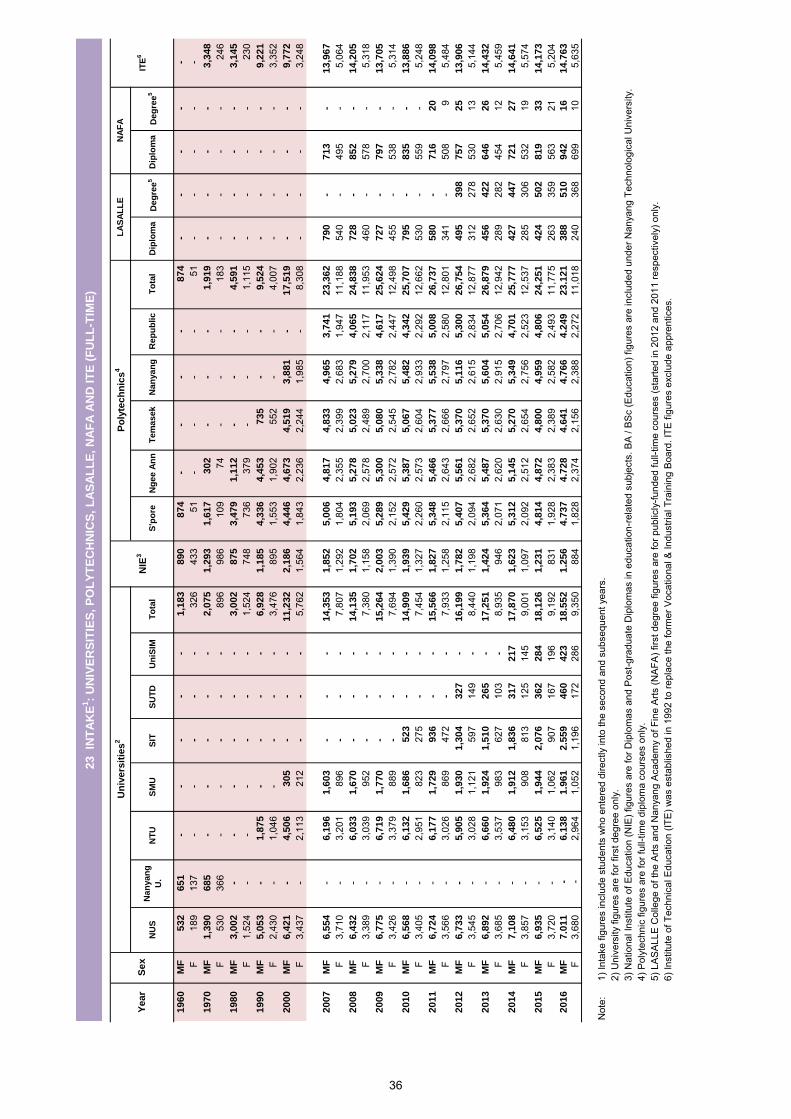
NU
SN
an
yan
g
U.
NT
US
MU
SIT
SU
TD
Un
iSIM
To
tal
S'p
ore
Ng
ee A
nn
Tem
asek
Nan
yan
gR
ep
ub
lic
To
tal
Dip
lom
aD
eg
ree
5D
iplo
ma
De
gre
e5
19
60
MF
53
2
65
1-
--
--
1,1
83
8
90
8
74
-
--
-8
74
-
--
--
F18
9
137
--
--
-32
6 43
3
51
--
--
51
-
--
--
19
70
MF
1,3
90
6
85
--
--
-2
,07
5
1,2
93
1
,61
7
30
2
--
-1
,91
9
--
--
3,3
48
F53
0
366
--
--
-89
6 98
6
109
74
--
-18
3
--
--
246
19
80
MF
3,0
02
-
--
--
-3
,00
2
87
5
3,4
79
1
,11
2
--
-4
,59
1
--
--
3,1
45
F1,
524
-
--
--
-1,
524
748
73
6 37
9
--
-1,
115
--
--
230
19
90
MF
5,0
53
-
1,8
75
-
--
-6
,92
8
1,1
85
4
,33
6
4,4
53
7
35
-
-9
,52
4
--
--
9,2
21
F2,
430
-
1,04
6 -
--
-3,
476
895
1,
553
1,90
2
552
-
-4,
007
--
--
3,35
2 2
00
0M
F6
,42
1
-4
,50
6
30
5
--
-1
1,2
32
2
,18
6
4,4
46
4
,67
3
4,5
19
3
,88
1
-1
7,5
19
--
--
9,7
72
F3,
437
-
2,11
3 21
2
--
-5,
762
1,56
4
1,84
3 2,
236
2,
244
1,
985
-8,
308
--
--
3,24
8
20
07
MF
6,5
54
-
6,1
96
1
,60
3
--
-1
4,3
53
1
,85
2
5,0
06
4
,81
7
4,8
33
4
,96
5
3,7
41
2
3,3
62
79
0
-7
13
-1
3,9
67
F3,
710
-
3,20
1 89
6
--
-7,
807
1,29
2
1,80
4 2,
355
2,
399
2,
683
1,94
7 11
,188
540
-
495
-5,
064
20
08
MF
6,4
32
-
6,0
33
1
,67
0
--
-1
4,1
35
1
,70
2
5,1
93
5
,27
8
5,0
23
5
,27
9
4,0
65
2
4,8
38
72
8
-8
52
-1
4,2
05
F3,
389
-
3,03
9 95
2
--
-7,
380
1,15
8
2,06
9 2,
578
2,
489
2,
700
2,11
7 11
,953
460
-
578
-5,
318
20
09
MF
6,7
75
-
6,7
19
1
,77
0
--
-1
5,2
64
2
,00
3
5,2
89
5
,30
0
5,0
80
5
,33
8
4,6
17
2
5,6
24
72
7
-7
97
-1
3,7
05
F3,
426
-
3,37
9 88
9
--
-7,
694
1,39
0
2,15
2 2,
572
2,
545
2,
782
2,44
7 12
,498
455
-
538
-5,
314
20
10
MF
6,5
68
-
6,1
32
1
,68
6
52
3
--
14
,90
9
1,9
39
5
,42
9
5,3
87
5
,06
7
5,4
82
4
,34
2
25
,70
7
7
95
-
83
5-
13
,88
6
F3,
405
-
2,95
1 82
3
275
-
-7,
454
1,32
7
2,26
0 2,
573
2,
604
2,
933
2,29
2 12
,662
530
-
559
-5,
248
20
11
MF
6,7
24
-
6,1
77
1
,72
9
93
6
--
15
,56
6
1,8
27
5
,34
8
5,4
66
5
,37
7
5,5
38
5
,00
8
26
,73
7
5
80
-
71
62
0
1
4,0
98
F3,
566
-
3,02
6 86
9
472
-
-7,
933
1,25
8
2,11
5 2,
643
2,
666
2,
797
2,58
0 12
,801
341
-
508
9
5,48
4 2
01
2M
F6
,73
3
-5
,90
5
1,9
30
1
,30
4
32
7
-1
6,1
99
1
,78
2
5,4
07
5
,56
1
5,3
70
5
,11
6
5,3
00
2
6,7
54
49
5
39
8
75
72
5
1
3,9
06
F3,
545
-
3,02
8 1,
121
59
7
149
-
8,44
0 1,
198
2,
094
2,68
2
2,65
2
2,61
5 2,
834
12,8
77
31
2
278
53
013
5,14
4 2
01
3M
F6
,89
2
-6
,66
0
1,9
24
1
,51
0
26
5
-1
7,2
51
1
,42
4
5,3
64
5
,48
7
5,3
70
5
,60
4
5,0
54
2
6,8
79
45
6
42
2
64
62
6
1
4,4
32
F3,
685
-
3,53
7 98
3
627
10
3
-8,
935
946
2,
071
2,62
0
2,63
0
2,91
5 2,
706
12,9
42
28
9
282
45
412
5,45
9 2
01
4M
F7
,10
8
-6
,48
0
1,9
12
1
,83
6
31
7
2
17
17
,87
0
1,6
23
5
,31
2
5,1
45
5
,27
0
5,3
49
4
,70
1
25
,77
7
4
27
4
47
7
21
27
14
,64
1
F3,
857
-
3,15
3 90
8
813
12
5
14
5
9,00
1 1,
097
2,
092
2,51
2
2,65
4
2,75
6 2,
523
12,5
37
28
5
306
53
219
5,57
4 2
01
5M
F6
,93
5
-6
,52
5
1,9
44
2
,07
6
36
2
2
84
18
,12
6
1,2
31
4
,81
4
4,8
72
4
,80
0
4,9
59
4
,80
6
24
,25
1
4
24
5
02
8
19
33
14
,17
3
F3,
720
-
3,14
0 1,
062
90
7
167
196
9,
192
831
1,
928
2,38
3
2,38
9
2,58
2 2,
493
11,7
75
26
3
359
56
321
5,20
4 2
01
6M
F7
,01
1
-6
,13
8
1,9
61
2
,55
9
46
0
4
23
18
,55
2
1,2
56
4
,73
7
4,7
28
4
,64
1
4,7
66
4
,24
9
23
,12
1
3
88
5
10
9
42
16
14
,76
3
F3,
680
-
2,96
4 1,
052
1,
196
17
2
28
6
9,35
0 88
4
1,82
8 2,
374
2,
156
2,
388
2,27
2 11
,018
240
36
8
699
10
5,
635
Not
e:1)
Inta
ke fi
gure
s in
clud
e st
uden
ts w
ho e
nter
ed d
irect
ly in
to th
e se
cond
and
sub
sequ
ent y
ears
.2)
Uni
vers
ity fi
gure
s ar
e fo
r firs
t deg
ree
only
. 3)
Nat
iona
l Ins
titut
e of
Edu
catio
n (N
IE) f
igur
es a
re fo
r Dip
lom
as a
nd P
ost-g
radu
ate
Dip
lom
as in
edu
catio
n-re
late
d su
bjec
ts. B
A /
BS
c (E
duca
tion)
figu
res
are
incl
uded
und
er N
anya
ng T
echn
olog
ical
Uni
vers
ity.
4) P
olyt
echn
ic fi
gure
s ar
e fo
r ful
l-tim
e di
plom
a co
urse
s on
ly.
5) L
AS
ALL
E C
olle
ge o
f the
Arts
and
Nan
yang
Aca
dem
y of
Fin
e A
rts (N
AFA
) firs
t deg
ree
figur
es a
re fo
r pub
licly
-fund
ed fu
ll-tim
e co
urse
s (s
tarte
d in
201
2 an
d 20
11 re
spec
tivel
y) o
nly.
6) In
stitu
te o
f Tec
hnic
al E
duca
tion
(ITE
) was
est
ablis
hed
in 1
992
to re
plac
e th
e fo
rmer
Voc
atio
nal &
Indu
stria
l Tra
inin
g B
oard
. ITE
figu
res
excl
ude
appr
entic
es.
ITE
6
LA
SA
LL
EN
AF
A
23
INT
AK
E1:
UN
IVE
RS
ITIE
S,
PO
LY
TE
CH
NIC
S,
LA
SA
LL
E,
NA
FA
AN
D I
TE
(F
UL
L-T
IME
)
Year
Sex
Un
ivers
itie
s2
NIE
3
Po
lyte
ch
nic
s4
36
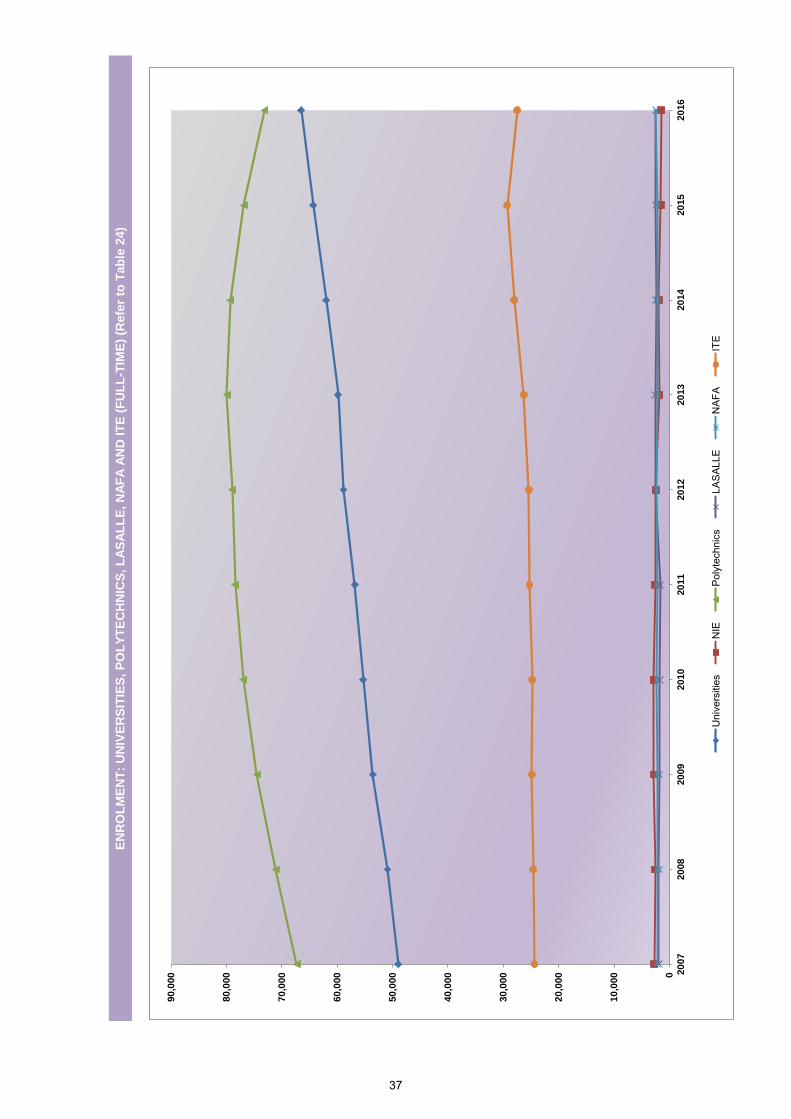
EN
RO
LM
EN
T:
UN
IVE
RS
ITIE
S,
PO
LY
TE
CH
NIC
S,
LA
SA
LL
E,
NA
FA
AN
D I
TE
(F
UL
L-T
IME
) (R
efe
r to
Tab
le 2
4)
0
10
,000
20
,000
30
,000
40
,000
50
,000
60
,000
70
,000
80
,000
90
,000 2
007
20
08
20
09
20
10
20
11
20
12
20
13
20
14
20
15
20
16
Uni
vers
ities
NIE
Pol
ytec
hnic
sLA
SA
LLE
NA
FAIT
E
37
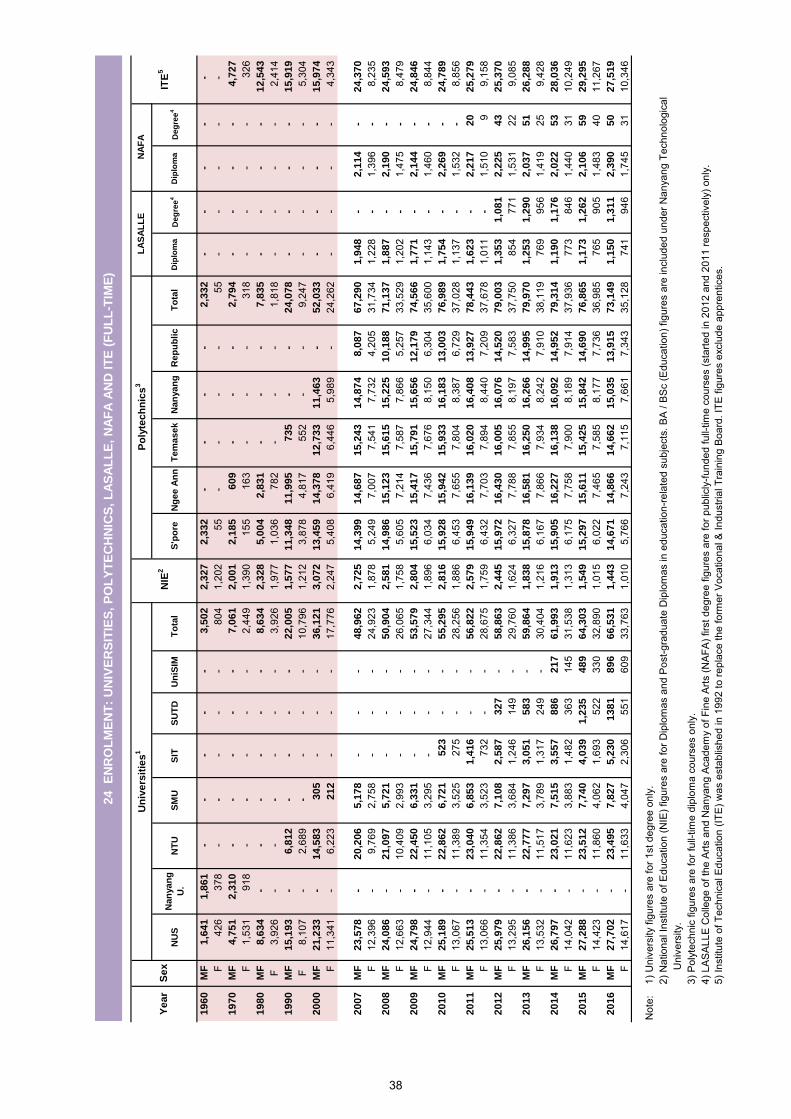
NU
SN
an
ya
ng
U.
NT
US
MU
SIT
SU
TD
Un
iSIM
To
tal
S'p
ore
Ng
ee
An
nT
em
as
ek
Na
nya
ng
Re
pu
bli
cT
ota
lD
iplo
ma
Deg
ree
4D
iplo
ma
Deg
ree
4
19
60
MF
1,6
41
1
,86
1
--
--
-3
,50
2
2,3
27
2
,33
2
-
--
-2
,33
2
--
--
-
F
426
378
--
--
-80
4 1,
202
55
--
--
55
-
--
- -
19
70
MF
4,7
51
2
,31
0
--
--
-7
,06
1
2,0
01
2
,18
5
6
09
--
-2
,79
4
--
--
4,7
27
F
1,53
1 91
8 -
--
--
2,44
9 1,
390
155
16
3
--
-31
8
--
--
326
19
80
MF
8,6
34
-
--
--
-8
,63
4
2,3
28
5
,00
4
2
,83
1
-
--
7,8
35
-
--
-1
2,5
43
F3,
926
--
--
--
3,92
6 1,
977
1,03
6
78
2
--
-1,
818
--
--
2,41
4 1
99
0M
F1
5,1
93
-
6,8
12
-
--
-2
2,0
05
1
,57
7
11
,34
8
11
,99
5
73
5
-
-2
4,0
78
--
--
15
,91
9
F8,
107
-2,
689
--
--
10,7
96
1,21
2 3,
878
4,81
7
55
2
--
9,24
7
-
--
-5,
304
20
00
MF
21
,23
3
-1
4,5
83
3
05
-
--
36
,12
1
3,0
72
1
3,4
59
1
4,3
78
1
2,7
33
11
,46
3
-5
2,0
33
--
--
15
,97
4
F
11,3
41
-6,
223
21
2
--
-17
,776
2,
247
5,40
8
6,
419
6,44
6
5,
989
-24
,262
-
--
-4,
343
20
07
MF
23
,57
8
-2
0,2
06
5
,17
8
--
-4
8,9
62
2
,72
5
14
,39
9
14
,68
7
15
,24
3
1
4,8
74
8
,08
7
6
7,2
90
1,9
48
-2
,11
4
-
24
,37
0
F
12,3
96
-9,
769
2,75
8 -
--
24,9
23
1,87
8 5,
249
7,00
7
7,
541
7,73
2
4,
205
31,7
34
1,22
8
-1,
396
-8,
235
20
08
MF
24
,08
6
-2
1,0
97
5
,72
1
--
-5
0,9
04
2
,58
1
14
,98
6
15
,12
3
15
,61
5
1
5,2
25
1
0,1
88
7
1,1
37
1,8
87
-2
,19
0
-
24
,59
3
F
12,6
63
-10
,409
2,
993
--
-26
,065
1,
758
5,60
5
7,
214
7,58
7
7,
866
5,25
7
33
,529
1,
202
-
1,47
5
-
8,47
9 2
00
9M
F2
4,7
98
-
22
,45
0
6,3
31
-
--
53
,57
9
2,8
04
1
5,5
23
1
5,4
17
1
5,7
91
15
,65
6
12
,17
9
74
,56
6
1
,77
1
-
2,1
44
-2
4,8
46
F
12,9
44
-11
,105
3,
295
--
-27
,344
1,
896
6,03
4
7,
436
7,67
6
8,
150
6,30
4
35
,600
1,
143
-
1,46
0
-
8,84
4 2
01
0M
F2
5,1
89
-
22
,86
2
6,7
21
5
23
-
-5
5,2
95
2
,81
6
15
,92
8
15
,94
2
15
,93
3
1
6,1
83
1
3,0
03
7
6,9
89
1,7
54
-2
,26
9
-
24
,78
9
F
13,0
67
-11
,389
3,
525
275
--
28,2
56
1,88
6 6,
453
7,65
5
7,
804
8,38
7
6,
729
37,0
28
1,13
7
-1,
532
-8,
856
20
11
MF
25
,51
3
-2
3,0
40
6
,85
3
1,4
16
-
-5
6,8
22
2
,57
9
15
,94
9
16
,13
9
16
,02
0
1
6,4
08
1
3,9
27
7
8,4
43
1,6
23
-2
,21
7
2
0
2
5,2
79
F
13,0
66
-11
,354
3,
523
732
--
28,6
75
1,75
9 6,
432
7,70
3
7,
894
8,44
0
7,
209
37,6
78
1,01
1
-1,
510
9
9,15
8 2
01
2M
F2
5,9
79
-
22
,86
2
7,1
08
2
,58
7
32
7
-5
8,8
63
2
,44
5
15
,97
2
16
,43
0
16
,00
5
1
6,0
76
1
4,5
20
7
9,0
03
1,3
53
1,0
81
2
,22
5
4
3
2
5,3
70
F
13,2
95
-11
,386
3,
684
1,24
6 14
9 -
29,7
60
1,62
4 6,
327
7,78
8
7,
855
8,19
7
7,
583
37,7
50
854
771
1,53
1
22
9,
085
20
13
MF
26
,15
6
-2
2,7
77
7
,29
7
3,0
51
5
83
-
59
,86
4
1,8
38
1
5,8
78
1
6,5
81
1
6,2
50
16
,26
6
14
,99
5
79
,97
0
1
,25
3
1
,29
0
2,0
37
51
26
,28
8
F
13,5
32
-11
,517
3,
789
1,31
7 24
9 -
30,4
04
1,21
6 6,
167
7,86
6
7,
934
8,24
2
7,
910
38,1
19
769
956
1,41
9
25
9,
428
20
14
MF
26
,79
7
-2
3,0
21
7
,51
5
3,5
57
8
86
2
17
6
1,9
93
1
,91
3
15
,90
5
16
,22
7
16
,13
8
1
6,0
92
1
4,9
52
7
9,3
14
1,1
90
1,1
76
2
,02
2
5
3
2
8,0
36
F
14,0
42
-11
,623
3,
883
1,48
2 36
3 14
5 31
,538
1,
313
6,17
5
7,
758
7,90
0
8,
189
7,91
4
37
,936
77
3
84
6
1,
440
31
10,2
49
20
15
MF
27
,28
8
-2
3,5
12
7
,74
0
4,0
39
1
,23
5
48
9
64
,30
3
1,5
49
1
5,2
97
1
5,6
11
1
5,4
25
15
,84
2
14
,69
0
76
,86
5
1
,17
3
1
,26
2
2,1
06
59
29
,29
5
F
14,4
23
-11
,860
4,
062
1,69
3 52
2 33
0 32
,890
1,
015
6,02
2
7,
465
7,58
5
8,
177
7,73
6
36
,985
76
5
90
5
1,
483
40
11,2
67
20
16
MF
27
,70
2
-2
3,4
95
7
,82
7
5,2
30
1
38
1
89
6
66
,53
1
1,4
43
1
4,6
71
1
4,8
66
1
4,6
62
15
,03
5
13
,91
5
73
,14
9
1
,15
0
1
,31
1
2,3
90
50
27
,51
9
F
14,6
17
-11
,633
4,
047
2,30
6 55
1 60
9 33
,763
1,
010
5,76
6
7,
243
7,11
5
7,
661
7,34
3
35
,128
74
1
94
6
1,
745
31
10,3
46
Not
e:1)
Uni
vers
ity fi
gure
s ar
e fo
r 1st
deg
ree
only
.2)
Nat
iona
l Ins
titut
e of
Edu
catio
n (N
IE) f
igur
es a
re fo
r Dip
lom
as a
nd P
ost-g
radu
ate
Dip
lom
as in
edu
catio
n-re
late
d su
bjec
ts. B
A /
BS
c (E
duca
tion)
figu
res
are
incl
uded
und
er N
anya
ng T
echn
olog
ical
U
nive
rsity
.3)
Pol
ytec
hnic
figu
res
are
for f
ull-t
ime
dipl
oma
cour
ses
only
.4)
LA
SA
LLE
Col
lege
of t
he A
rts a
nd N
anya
ng A
cade
my
of F
ine
Arts
(NA
FA) f
irst d
egre
e fig
ures
are
for p
ublic
ly-fu
nded
full-
time
cour
ses
(sta
rted
in 2
012
and
2011
resp
ectiv
ely)
onl
y.5)
Inst
itute
of T
echn
ical
Edu
catio
n (IT
E) w
as e
stab
lishe
d in
199
2 to
repl
ace
the
form
er V
ocat
iona
l & In
dust
rial T
rain
ing
Boa
rd. I
TE fi
gure
s ex
clud
e ap
pren
tices
.
ITE
5
LA
SA
LL
E
24
EN
RO
LM
EN
T:
UN
IVE
RS
ITIE
S,
PO
LY
TE
CH
NIC
S,
LA
SA
LL
E,
NA
FA
AN
D I
TE
(F
UL
L-T
IME
)
NA
FA
Ye
ar
Se
x
Un
ive
rsit
ies
1
NIE
2
Po
lyte
ch
nic
s3
38
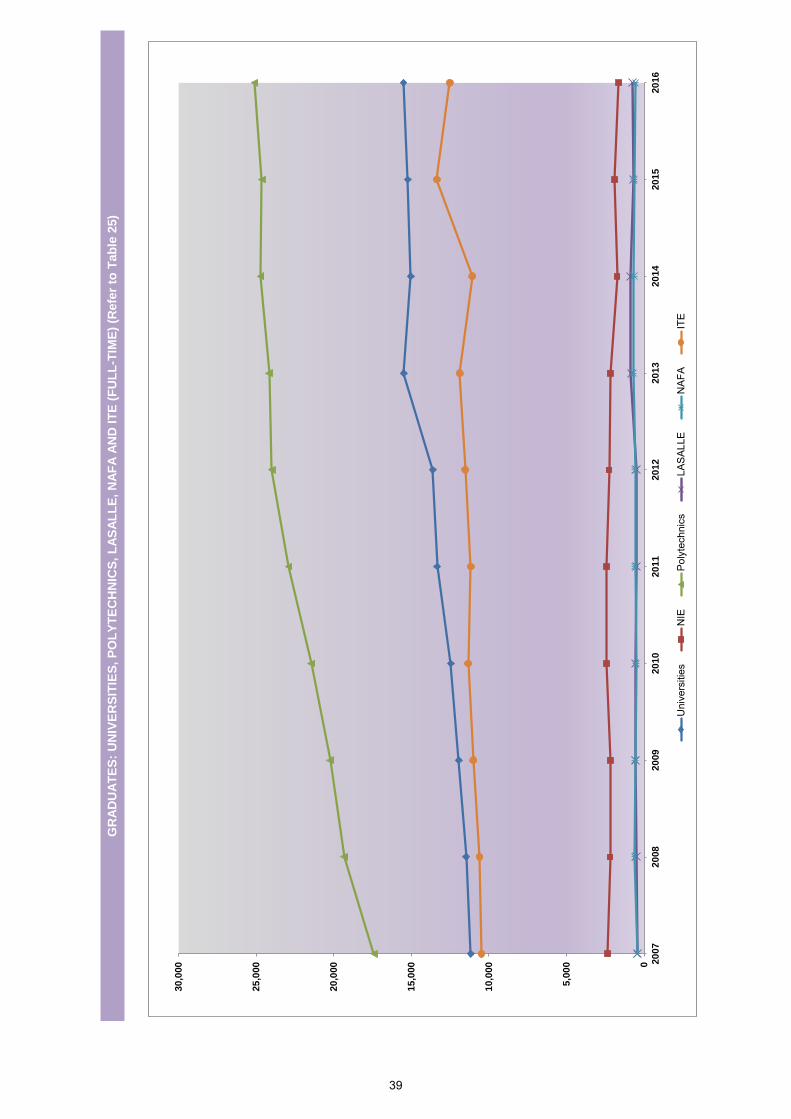
GR
AD
UA
TE
S:
UN
IVE
RS
ITIE
S,
PO
LY
TE
CH
NIC
S,
LA
SA
LL
E,
NA
FA
AN
D I
TE
(F
UL
L-T
IME
) (R
efe
r to
Tab
le 2
5)
Ju
nio
r
Po
lyte
ch
nic
ITE
NIE
0
5,0
00
10
,000
15
,000
20
,000
25
,000
30
,000 2
007
20
08
20
09
20
10
20
11
20
12
20
13
20
14
20
15
20
16
Uni
vers
ities
NIE
Pol
ytec
hnic
sLA
SA
LLE
NA
FAIT
E
39
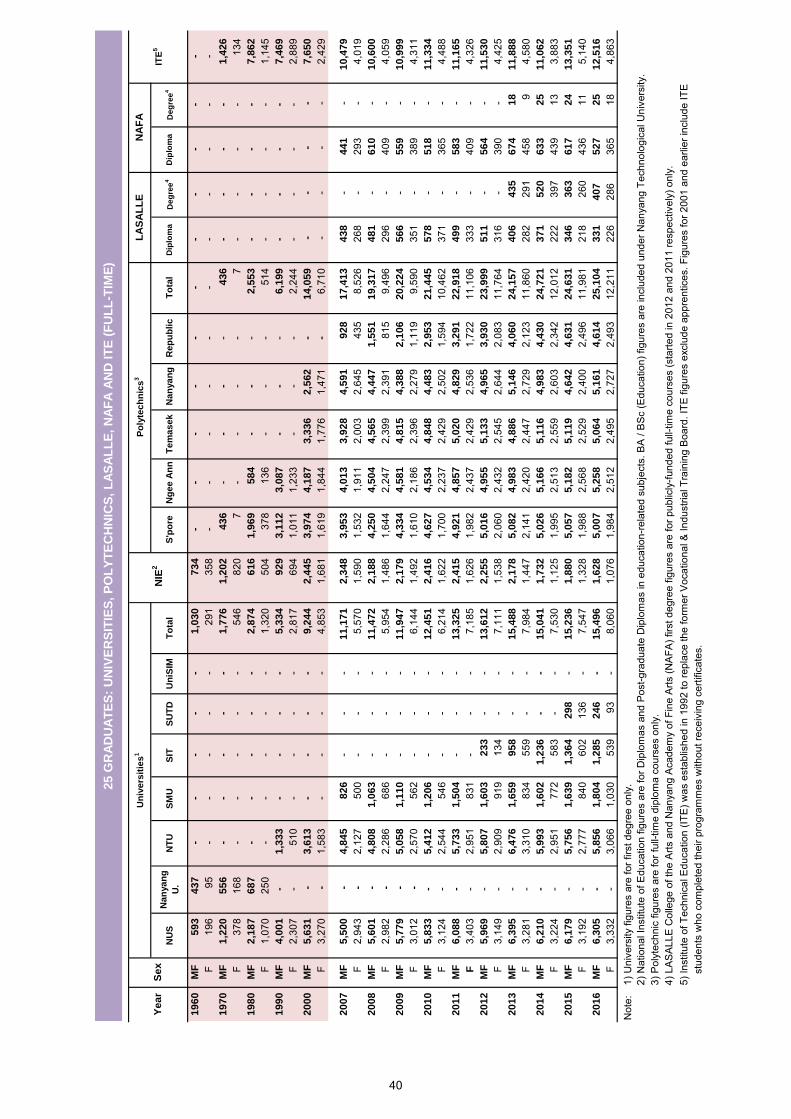
NU
SN
an
ya
ng
U.
NT
US
MU
SIT
SU
TD
Un
iSIM
To
tal
S'p
ore
Ng
ee
An
nT
em
as
ek
Na
nya
ng
Re
pu
bli
cT
ota
lD
iplo
ma
Deg
ree
4D
iplo
ma
Deg
ree
4
19
60
MF
59
3
43
7
-
--
--
1,0
30
7
34
--
--
--
--
--
-
F19
6 95
-
--
--
291
35
8
--
--
--
--
--
-1
97
0M
F1
,22
0
55
6
-
--
--
1,7
76
1
,20
2
43
6
-
--
-4
36
-
--
-1
,42
6
F37
8 16
8
--
--
-54
6
820
7
--
--
7
--
--
134
1
98
0M
F2
,18
7
68
7
-
--
--
2,8
74
6
16
1,9
69
58
4
--
-2
,55
3
--
--
7,8
62
F1,
070
250
-
--
--
1,32
0
50
4
378
13
6
--
-51
4
--
--
1,14
5
19
90
MF
4,0
01
-
1,3
33
-
--
-5
,33
4
92
9
3
,11
2
3
,08
7
--
-6
,19
9
--
--
7,4
69
F2,
307
-51
0
--
--
2,81
7
69
4
1,01
1
1,
233
-
--
2,24
4
-
--
-2,
889
2
00
0M
F5
,63
1
-3
,61
3
--
--
9,2
44
2
,44
5
3,9
74
4,1
87
3
,33
6
2,5
62
-1
4,0
59
- -
- -
7,6
50
F3,
270
-1,
583
-
--
-4,
853
1,68
1
1,
619
1,84
4
1,77
6
1,47
1
-
6,71
0
-
- -
-2,
429
20
07
MF
5,5
00
-
4,8
45
8
26
-
--
11
,17
1
2
,34
8
3,9
53
4,0
13
3
,92
8
4,5
91
92
8
17
,41
3
4
38
-
44
1
-
10
,47
9
F2,
943
-2,
127
50
0 -
--
5,57
0
1,
590
1,53
2
1,
911
2,
003
2,
645
435
8,
526
268
-
293
-
4,01
9
20
08
MF
5,6
01
-
4,8
08
1
,06
3
--
-1
1,4
72
2,1
88
4
,25
0
4
,50
4
4,5
65
4
,44
7
1
,55
1
19
,31
7
4
81
-
61
0
-
10
,60
0
F2,
982
-2,
286
68
6 -
--
5,95
4
1,
486
1,64
4
2,
247
2,
399
2,
391
815
9,
496
296
-
409
-
4,05
9
20
09
MF
5,7
79
-
5,0
58
1
,11
0
--
-1
1,9
47
2,1
79
4
,33
4
4
,58
1
4,8
15
4
,38
8
2
,10
6
20
,22
4
5
66
-
55
9
-
10
,99
9
F3,
012
-2,
570
56
2 -
--
6,14
4
1,
492
1,61
0
2,
186
2,
396
2,
279
1,11
9
9,59
0
35
1
-38
9
-4,
311
2
01
0M
F5
,83
3
-5
,41
2
1,2
06
-
--
12
,45
1
2
,41
6
4,6
27
4,5
34
4
,84
8
4,4
83
2,9
53
2
1,4
45
57
8
-5
18
-1
1,3
34
F3,
124
-2,
544
54
6 -
--
6,21
4
1,
622
1,70
0
2,
237
2,
429
2,
502
1,59
4
10,4
62
37
1
-36
5
-4,
488
2
01
1M
F6
,08
8
-5
,73
3
1,5
04
-
--
13
,32
5
2
,41
5
4,9
21
4,8
57
5
,02
0
4,8
29
3,2
91
2
2,9
18
49
9
-5
83
-1
1,1
65
F
3,40
3 -
2,95
1
831
--
-7,
185
1,62
6
1,
982
2,43
7
2,42
9
2,53
6
1,
722
11
,106
333
-
409
-
4,32
6
20
12
MF
5,9
69
-
5,8
07
1
,60
3
23
3
--
13
,61
2
2
,25
5
5,0
16
4,9
55
5
,13
3
4,9
65
3,9
30
2
3,9
99
51
1
-5
64
-1
1,5
30
F3,
149
-2,
909
91
9 13
4 -
-7,
111
1,53
8
2,
060
2,43
2
2,54
5
2,64
4
2,
083
11
,764
316
-
390
-
4,42
5
20
13
MF
6,3
95
-
6,4
76
1
,65
9
95
8
--
15
,48
8
2
,17
8
5,0
82
4,9
83
4
,88
6
5,1
46
4,0
60
2
4,1
57
40
6
43
5
67
4
1
8
1
1,8
88
F3,
281
-3,
310
83
4 55
9 -
-7,
984
1,44
7
2,
141
2,42
0
2,44
7
2,72
9
2,
123
11
,860
282
29
1
458
9
4,
580
2
01
4M
F6
,21
0
-5
,99
3
1,6
02
1
,23
6
--
15
,04
1
1
,73
2
5,0
26
5,1
66
5
,11
6
4,9
83
4,4
30
2
4,7
21
37
1
52
0
63
3
2
5
1
1,0
62
F3,
224
-2,
951
77
2 58
3 -
-7,
530
1,12
5
1,
995
2,51
3
2,55
9
2,60
3
2,
342
12
,012
222
39
7
439
13
3,
883
2
01
5M
F6
,17
9
-5
,75
6
1,6
39
1
,36
4
29
8
-1
5,2
36
1,8
80
5
,05
7
5
,18
2
5,1
19
4
,64
2
4
,63
1
24
,63
1
3
46
3
63
6
17
24
13
,35
1
F3,
192
-2,
777
84
0 60
2 13
6
-7,
547
1,32
8
1,
988
2,56
8
2,52
9
2,40
0
2,
496
11
,981
218
26
0
436
11
5,
140
2
01
6M
F6
,30
5
-5
,85
6
1,8
04
1
,28
5
24
6
-1
5,4
96
1,6
28
5
,00
7
5
,25
8
5,0
64
5
,16
1
4
,61
4
25
,10
4
3
31
4
07
52
7
2
5
1
2,5
16
F3,
332
-3,
066
1,
030
539
93
-8,
060
1,07
6
1,
984
2,51
2
2,49
5
2,72
7
2,
493
12
,211
226
28
6
365
18
4,
863
-
N
ote:
1) U
nive
rsity
figu
res
are
for f
irst d
egre
e on
ly.
2) N
atio
nal I
nstit
ute
of E
duca
tion
figur
es a
re fo
r Dip
lom
as a
nd P
ost-g
radu
ate
Dip
lom
as in
edu
catio
n-re
late
d su
bjec
ts. B
A /
BS
c (E
duca
tion)
figu
res
are
incl
uded
und
er N
anya
ng T
echn
olog
ical
Uni
vers
ity.
3) P
olyt
echn
ic fi
gure
s ar
e fo
r ful
l-tim
e di
plom
a co
urse
s on
ly.
4) L
AS
ALL
E C
olle
ge o
f the
Arts
and
Nan
yang
Aca
dem
y of
Fin
e A
rts (N
AFA
) firs
t deg
ree
figur
es a
re fo
r pub
licly
-fund
ed fu
ll-tim
e co
urse
s (s
tarte
d in
201
2 an
d 20
11 re
spec
tivel
y) o
nly.
5) In
stitu
te o
f Tec
hnic
al E
duca
tion
(ITE
) was
est
ablis
hed
in 1
992
to re
plac
e th
e fo
rmer
Voc
atio
nal &
Indu
stria
l Tra
inin
g B
oard
. ITE
figu
res
excl
ude
appr
entic
es. F
igur
es fo
r 200
1 an
d ea
rlier
incl
ude
ITE
s
tude
nts
who
com
plet
ed th
eir p
rogr
amm
es w
ithou
t rec
eivi
ng c
ertif
icat
es.
ITE
5
LA
SA
LL
EN
AF
A
25 G
RA
DU
AT
ES
: U
NIV
ER
SIT
IES
, P
OL
YT
EC
HN
ICS
, L
AS
AL
LE
, N
AF
A A
ND
IT
E (
FU
LL
-TIM
E)
Ye
ar
Se
x
Un
ive
rsit
ies
1
NIE
2
Po
lyte
ch
nic
s3
40
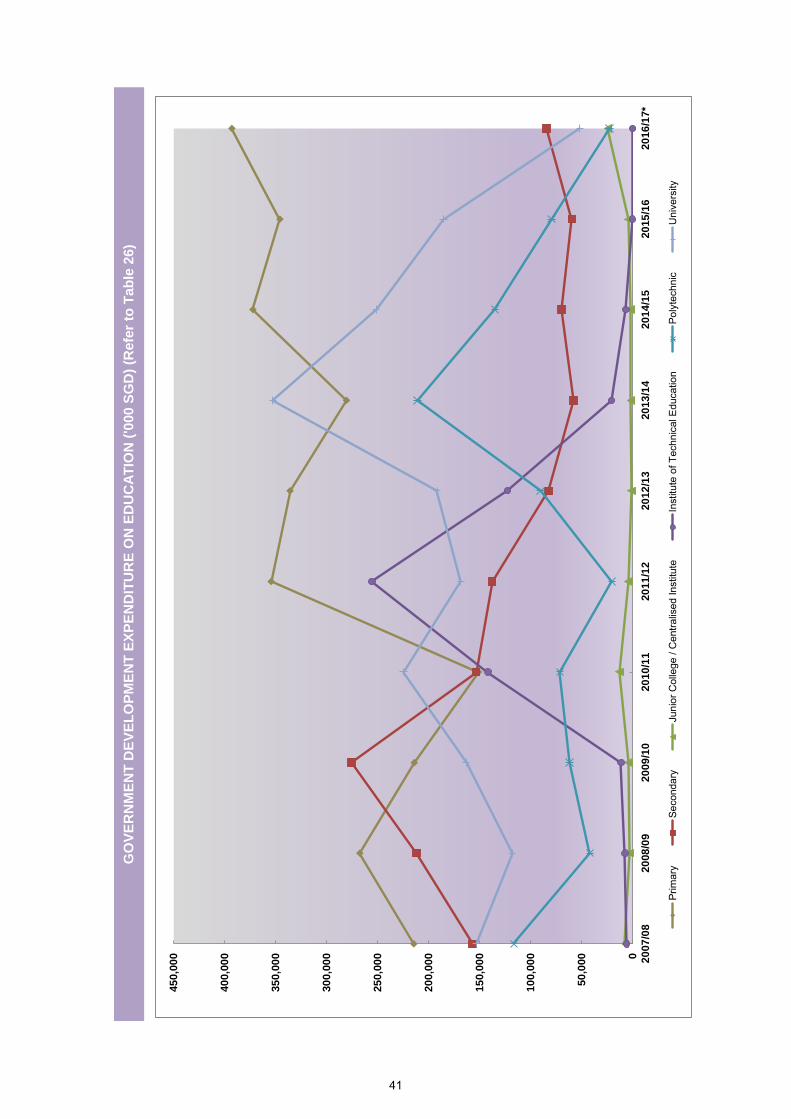
GO
VE
RN
ME
NT
DE
VE
LO
PM
EN
T E
XP
EN
DIT
UR
E O
N E
DU
CA
TIO
N (
'000 S
GD
) (R
efe
r to
Tab
le 2
6)
0
50
,000
10
0,0
00
15
0,0
00
20
0,0
00
25
0,0
00
30
0,0
00
35
0,0
00
40
0,0
00
45
0,0
00 20
07
/08
20
08
/09
20
09
/10
20
10
/11
20
11
/12
20
12
/13
20
13
/14
20
14
/15
20
15
/16
20
16
/17*
Prim
ary
Seco
ndar
yJu
nior
Col
lege
/ C
entra
lised
Inst
itute
Inst
itute
of T
echn
ical
Edu
catio
nPo
lyte
chni
cU
nive
rsity
N
41
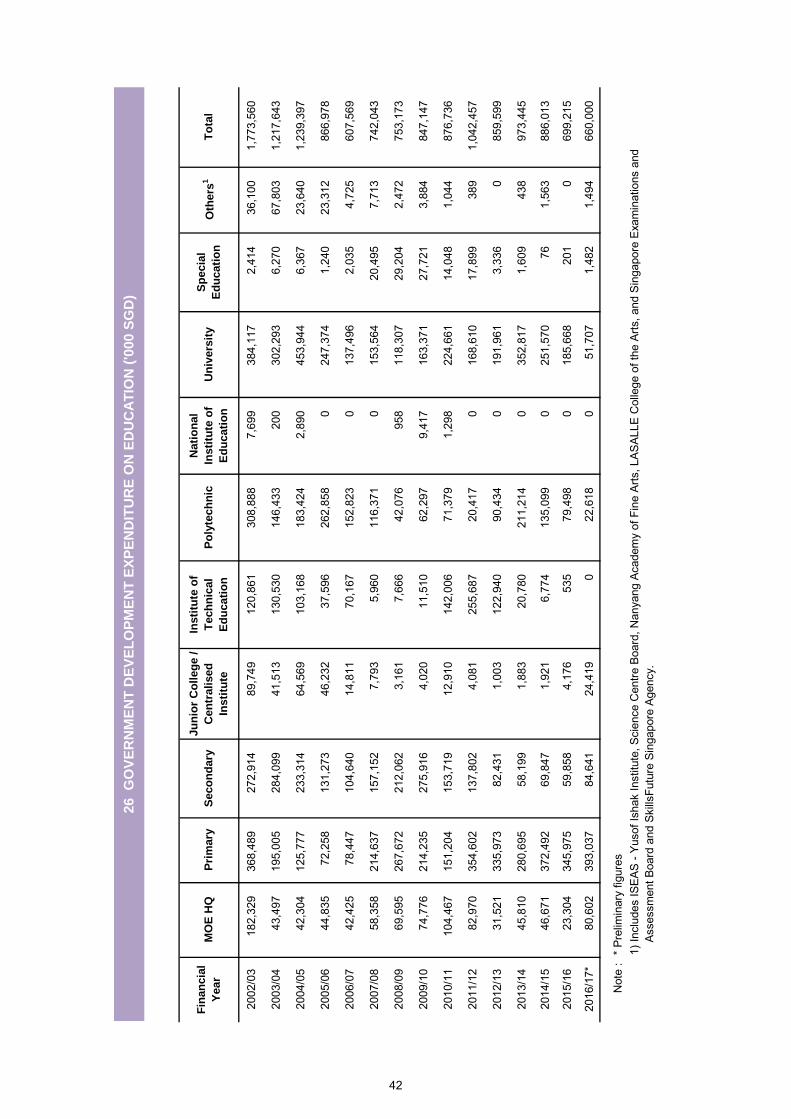
2002
/03
182,
329
368,
489
272,
914
89,7
4912
0,86
130
8,88
87,
699
384,
117
2,41
436
,100
1,77
3,56
0
2003
/04
43,4
9719
5,00
528
4,09
941
,513
130,
530
146,
433
200
302,
293
6,27
067
,803
1,21
7,64
3
2004
/05
42,3
0412
5,77
723
3,31
464
,569
103,
168
183,
424
2,89
045
3,94
46,
367
23,6
401,
239,
397
2005
/06
44,8
3572
,258
131,
273
46,2
3237
,596
262,
858
024
7,37
41,
240
23,3
1286
6,97
8
2006
/07
42,4
2578
,447
104,
640
14,8
1170
,167
152,
823
013
7,49
62,
035
4,72
560
7,56
9
2007
/08
58,3
5821
4,63
715
7,15
27,
793
5,96
011
6,37
10
153,
564
20,4
957,
713
742,
043
2008
/09
69,5
9526
7,67
221
2,06
23,
161
7,66
642
,076
958
118,
307
29,2
042,
472
753,
173
2009
/10
74,7
7621
4,23
527
5,91
64,
020
11,5
1062
,297
9,41
716
3,37
127
,721
3,88
484
7,14
7
2010
/11
104,
467
151,
204
153,
719
12,9
1014
2,00
671
,379
1,29
822
4,66
114
,048
1,04
487
6,73
6
2011
/12
82,9
7035
4,60
213
7,80
24,
081
255,
687
20,4
170
168,
610
17,8
9938
91,
042,
457
2012
/13
31,5
2133
5,97
382
,431
1,00
312
2,94
090
,434
019
1,96
13,
336
085
9,59
9
2013
/14
45,8
1028
0,69
558
,199
1,88
320
,780
211,
214
035
2,81
71,
609
438
973,
445
2014
/15
46,6
7137
2,49
269
,847
1,92
16,
774
135,
099
025
1,57
076
1,56
388
6,01
3
2015
/16
23,3
0434
5,97
559
,858
4,17
653
579
,498
018
5,66
820
10
699,
215
2016
/17*
80,6
0239
3,03
784
,641
24,4
190
22,6
180
51,7
071,
482
1,49
466
0,00
0
Not
e :
* Pr
elim
inar
y fig
ures
1) In
clud
es IS
EAS
- Yus
of Is
hak
Inst
itute
, Sci
ence
Cen
tre B
oard
, Nan
yang
Aca
dem
y of
Fin
e Ar
ts, L
ASAL
LE C
olle
ge o
f the
Arts
, and
Sin
gapo
re E
xam
inat
ions
and
A
sses
smen
t Boa
rd a
nd S
kills
Futu
re S
inga
pore
Age
ncy.
26 G
OV
ER
NM
EN
T D
EV
EL
OP
ME
NT
EX
PE
ND
ITU
RE
ON
ED
UC
AT
ION
('0
00 S
GD
)
Po
lyte
ch
nic
Un
ivers
ity
Sp
ecia
l
Ed
ucati
on
Fin
an
cia
l
Year
Nati
on
al
Insti
tute
of
Ed
ucati
on
MO
E H
QP
rim
ary
Seco
nd
ary
Ju
nio
r C
oll
eg
e /
Cen
trali
sed
Insti
tute
Insti
tute
of
Tech
nic
al
Ed
ucati
on
Oth
ers
1T
ota
l
42
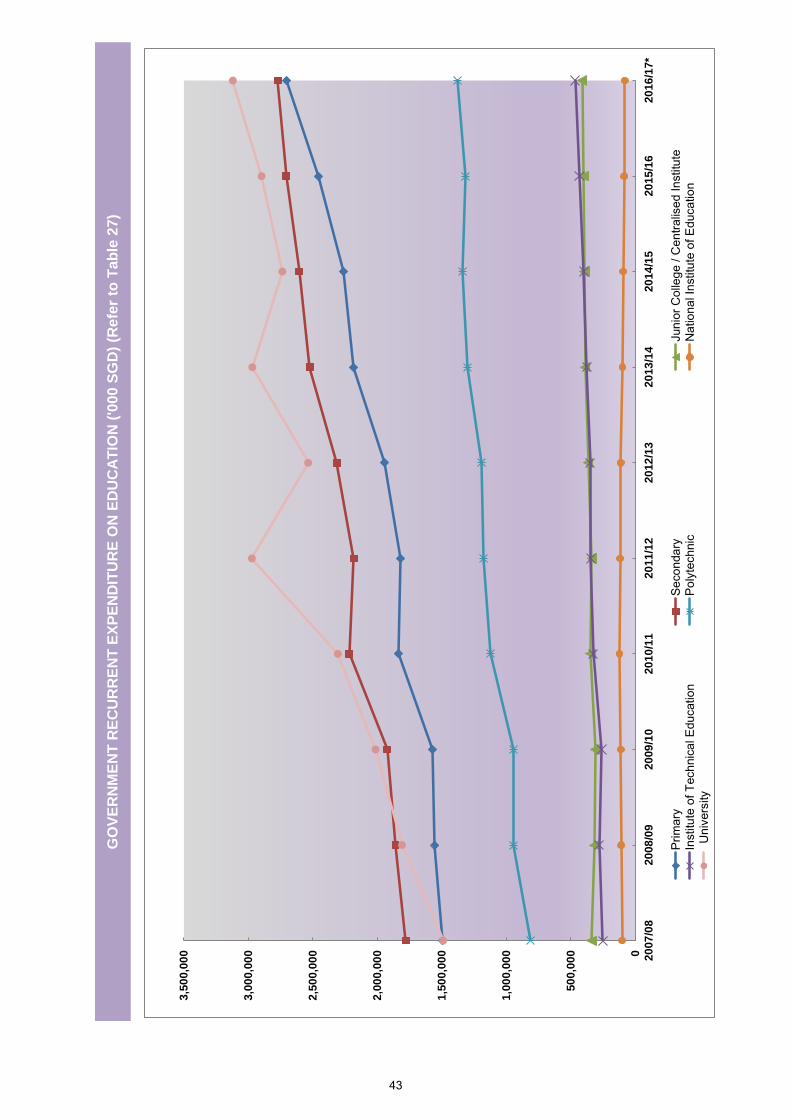
GO
VE
RN
ME
NT
RE
CU
RR
EN
T E
XP
EN
DIT
UR
E O
N E
DU
CA
TIO
N (
'00
0 S
GD
) (R
efe
r to
Ta
ble
27
)
Un
ivers
ity
ITE
Pri
mar
Seco
nd
a
Ju
nio
r
Po
lyt
0
50
0,0
00
1,0
00,0
00
1,5
00,0
00
2,0
00,0
00
2,5
00,0
00
3,0
00,0
00
3,5
00,0
00 20
07
/08
20
08
/09
20
09
/10
20
10
/11
20
11
/12
20
12
/13
20
13
/14
20
14
/15
20
15
/16
20
16
/17*
Prim
ary
Sec
onda
ryJu
nior
Col
lege
/ C
entra
lised
Inst
itute
Inst
itute
of T
echn
ical
Edu
catio
nP
olyt
echn
icN
atio
nal I
nstit
ute
of E
duca
tion
Uni
vers
ity
43
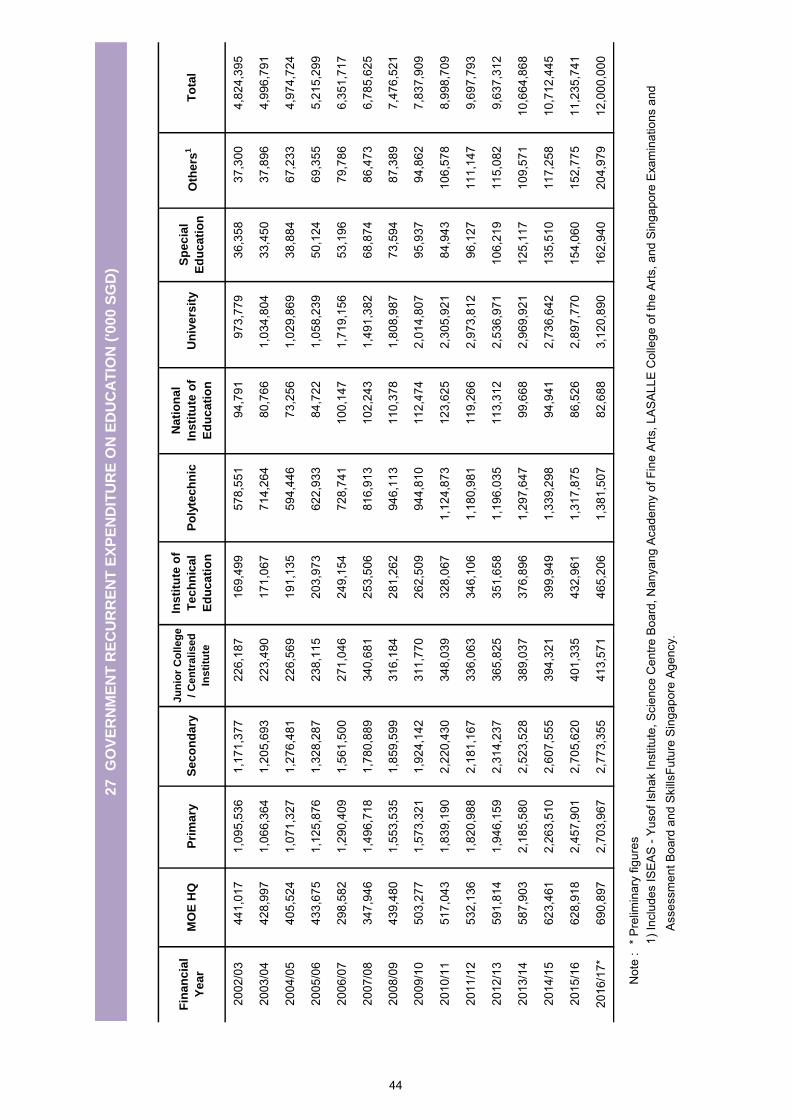
2002
/03
441,
017
1,09
5,53
61,
171,
377
226,
187
169,
499
578,
551
94,7
9197
3,77
936
,358
37,3
004,
824,
395
2003
/04
428,
997
1,06
6,36
41,
205,
693
223,
490
171,
067
714,
264
80,7
661,
034,
804
33,4
5037
,896
4,99
6,79
1
2004
/05
405,
524
1,07
1,32
71,
276,
481
226,
569
191,
135
594,
446
73,2
561,
029,
869
38,8
8467
,233
4,97
4,72
4
2005
/06
433,
675
1,12
5,87
61,
328,
287
238,
115
203,
973
622,
933
84,7
221,
058,
239
50,1
2469
,355
5,21
5,29
9
2006
/07
298,
582
1,29
0,40
91,
561,
500
271,
046
249,
154
728,
741
100,
147
1,71
9,15
653
,196
79,7
866,
351,
717
2007
/08
347,
946
1,49
6,71
81,
780,
889
340,
681
253,
506
816,
913
102,
243
1,49
1,38
268
,874
86,4
736,
785,
625
2008
/09
439,
480
1,55
3,53
51,
859,
599
316,
184
281,
262
946,
113
110,
378
1,80
8,98
773
,594
87,3
897,
476,
521
2009
/10
503,
277
1,57
3,32
11,
924,
142
311,
770
262,
509
944,
810
112,
474
2,01
4,80
795
,937
94,8
627,
837,
909
2010
/11
517,
043
1,83
9,19
02,
220,
430
348,
039
328,
067
1,12
4,87
312
3,62
52,
305,
921
84,9
4310
6,57
88,
998,
709
2011
/12
532,
136
1,82
0,98
82,
181,
167
336,
063
346,
106
1,18
0,98
111
9,26
62,
973,
812
96,1
2711
1,14
79,
697,
793
2012
/13
591,
814
1,94
6,15
92,
314,
237
365,
825
351,
658
1,19
6,03
511
3,31
22,
536,
971
106,
219
115,
082
9,63
7,31
2
2013
/14
587,
903
2,18
5,58
02,
523,
528
389,
037
376,
896
1,29
7,64
799
,668
2,96
9,92
112
5,11
710
9,57
110
,664
,868
2014
/15
623,
461
2,26
3,51
02,
607,
555
394,
321
399,
949
1,33
9,29
894
,941
2,73
6,64
213
5,51
011
7,25
810
,712
,445
2015
/16
628,
918
2,45
7,90
12,
705,
620
401,
335
432,
961
1,31
7,87
586
,526
2,89
7,77
015
4,06
015
2,77
511
,235
,741
2016
/17*
690,
897
2,70
3,96
72,
773,
355
413,
571
465,
206
1,38
1,50
782
,688
3,12
0,89
016
2,94
020
4,97
912
,000
,000
Not
e :
* P
relim
inar
y fig
ures
1) In
clud
es IS
EA
S -
Yuso
f Ish
ak In
stitu
te, S
cien
ce C
entre
Boa
rd, N
anya
ng A
cade
my
of F
ine
Arts
, LA
SA
LLE
Col
lege
of t
he A
rts, a
nd S
inga
pore
Exa
min
atio
ns a
nd
Ass
essm
ent B
oard
and
Ski
llsFu
ture
Sin
gapo
re A
genc
y.
27
GO
VE
RN
ME
NT
RE
CU
RR
EN
T E
XP
EN
DIT
UR
E O
N E
DU
CA
TIO
N (
'00
0 S
GD
)
Fin
an
cia
l
Ye
ar
MO
E H
QP
rim
ary
Se
co
nd
ary
Ju
nio
r C
oll
eg
e
/ C
en
trali
sed
Ins
titu
te
Ins
titu
te o
f
Te
ch
nic
al
Ed
uc
ati
on
Po
lyte
ch
nic
To
tal
Na
tio
na
l
Ins
titu
te o
f
Ed
uc
ati
on
U
niv
ers
ity
Sp
ec
ial
Ed
uc
ati
on
Oth
ers
1
44
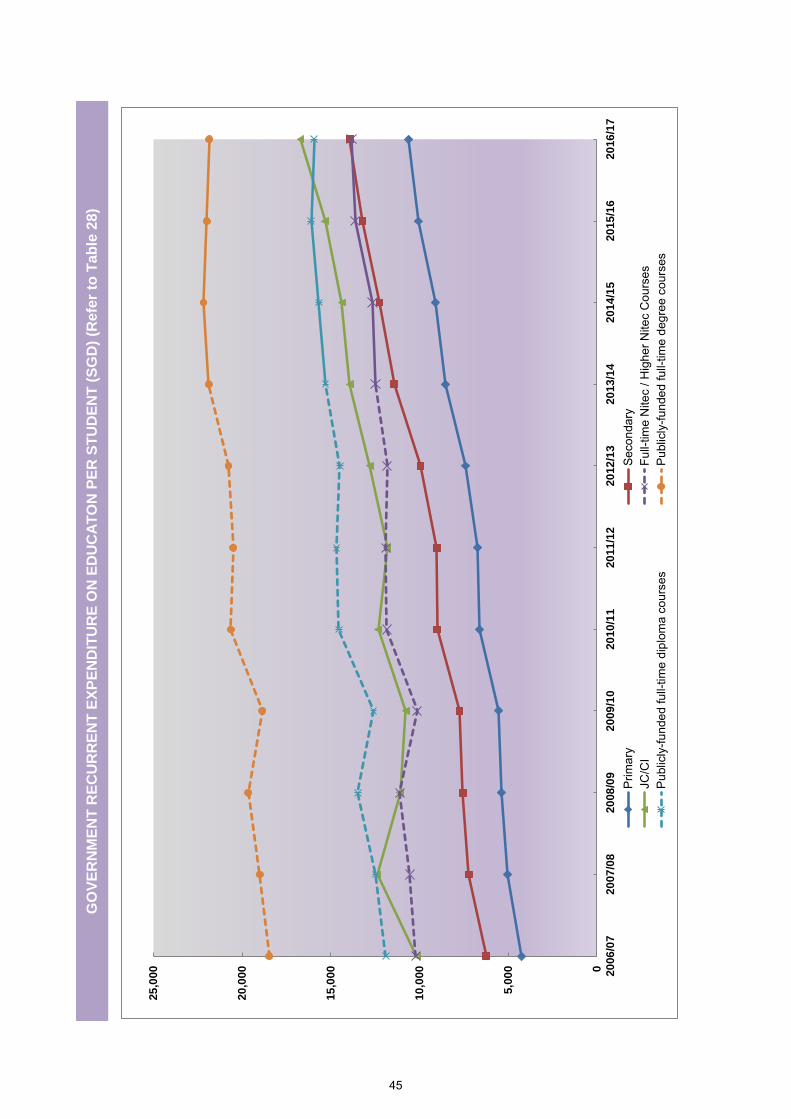
GO
VE
RN
ME
NT
RE
CU
RR
EN
T E
XP
EN
DIT
UR
E O
N E
DU
CA
TO
N P
ER
ST
UD
EN
T (
SG
D)
(Re
fer
to T
ab
le 2
8)
0
5,0
00
10
,000
15
,000
20
,000
25
,000 20
06
/07
20
07
/08
20
08
/09
20
09
/10
20
10
/11
20
11
/12
20
12
/13
20
13
/14
20
14
/15
20
15
/16
20
16
/17
Prim
ary
Sec
onda
ryJC
/CI
Full-
time
Nite
c / H
ighe
r Nite
c C
ours
esP
ublic
ly-fu
nded
full-
time
dipl
oma
cour
ses
Pub
licly
-fund
ed fu
ll-tim
e de
gree
cou
rses
45

Fin
an
cia
l Y
ear
Pri
mary
Seco
nd
ary
1Ju
nio
r C
olleg
e /
Cen
tralised
In
sti
tute
Insti
tute
of
Tech
nic
al
Ed
ucati
on
Po
lyte
ch
nic
Un
ivers
ity
2002
/03
3,53
55,
614
8,49
78,
056
9,79
314
,287
2003
/04
3,50
85,
437
8,79
18,
367
10,1
9717
,477
2004
/05
3,57
55,
746
8,85
09,
399
10,6
9517
,609
2005
/06
3,82
05,
793
9,44
59,
249
10,8
4317
,793
2006
/07
4,24
36,
246
10,1
6110
,209
11,9
0318
,472
2007
/08
5,02
67,
230
12,3
8610
,543
12,4
8219
,011
2008
/09
5,39
77,
551
11,0
9411
,106
13,4
7919
,664
2009
/10
5,53
77,
736
10,7
7210
,129
12,5
9818
,868
2010
/11
6,62
49,
008
12,3
3111
,839
14,5
5220
,630
2011
/12
6,71
29,
022
11,8
3011
,898
14,6
8720
,505
Pri
mary
Seco
nd
ary
1Ju
nio
r C
olleg
e /
Cen
tralise
d In
sti
tute
Fu
ll-t
ime N
itec /
Hig
her
Nit
ec c
ou
rses
2
Pu
blicly
-fu
nd
ed
fu
ll-
tim
e d
iplo
ma c
ou
rses
3
Pu
blicly
-fu
nd
ed
fu
ll-
tim
e d
eg
ree c
ou
rses
4
2012
/13
7,39
69,
940
12,8
0611
,837
14,4
8720
,777
2013
/14
8,54
911
,434
13,9
4212
,491
15,3
0421
,870
2014
/15
9,12
312
,261
14,3
7912
,650
15,6
8122
,181
2015
/16
10,0
8113
,213
15,3
2613
,619
16,1
1821
,988
2016
/17*
10,6
0013
,931
16,7
1713
,830
15,9
4321
,853
Not
e : *
Pre
limin
ary
figur
es
1) F
igur
es e
xclu
de In
depe
nden
t Sch
ools
.
b
y I
TE
are
in
clu
de
d u
nd
er
“Pu
blic
ly-f
un
de
d f
ull-
tim
e d
iplo
ma
co
urs
es"
fro
m F
Y2
01
2 o
nw
ard
s.
an
d R
epub
lic P
olyt
echn
ic. S
ince
FY2
012,
it in
clud
es p
ublic
ly-fu
nded
full-
time
dipl
oma
cour
ses
offe
red
by IT
E, L
ASA
LLE
Col
lege
of t
he A
rts (L
ASA
LLE
) and
Nan
yang
Aca
dem
y of
Fin
e A
rts (N
AFA
).
Uni
vers
ity a
nd S
inga
pore
Inst
itute
of T
echn
olog
y (w
ef F
Y201
0). I
t inc
lude
s pu
blic
ly-fu
nded
full-
time
degr
ee c
ours
es o
ffere
d by
Sin
gapo
re U
nive
rsity
of
Tec
hnol
ogy
& D
esig
n, L
ASA
LLE
and
NAF
A fr
om F
Y201
2 an
d S
IM U
nive
rsity
from
FY2
014.
28
GO
VE
RN
ME
NT
RE
CU
RR
EN
T E
XP
EN
DIT
UR
E O
N E
DU
CA
TIO
N P
ER
ST
UD
EN
T (
SG
D)
2
) Ref
ers
to fu
ll-tim
e N
ite
c /
Hig
he
r N
ite
c c
ours
es o
ffere
d by
the
Inst
itute
of T
echn
ical
Edu
catio
n (IT
E).
Pub
licly
-fund
ed fu
ll-tim
e di
plom
a co
urse
s of
fere
d
3
) Ref
ers
to p
ublic
ly-fu
nded
full-
time
dipl
oma
cour
ses
offe
red
by S
inga
pore
Pol
ytec
hnic
, Nge
e A
nn P
olyt
echn
ic, T
emas
ek P
olyt
echn
ic,
Nan
yang
Pol
ytec
hnic
4
) Ref
ers
to p
ublic
ly-fu
nded
full-
time
degr
ee c
ours
es o
ffere
d by
Nat
iona
l Uni
vers
ity o
f Sin
gapo
re, N
anya
ng T
echn
olog
ical
Uni
vers
ity,
Sin
gapo
re M
anag
emen
t
46
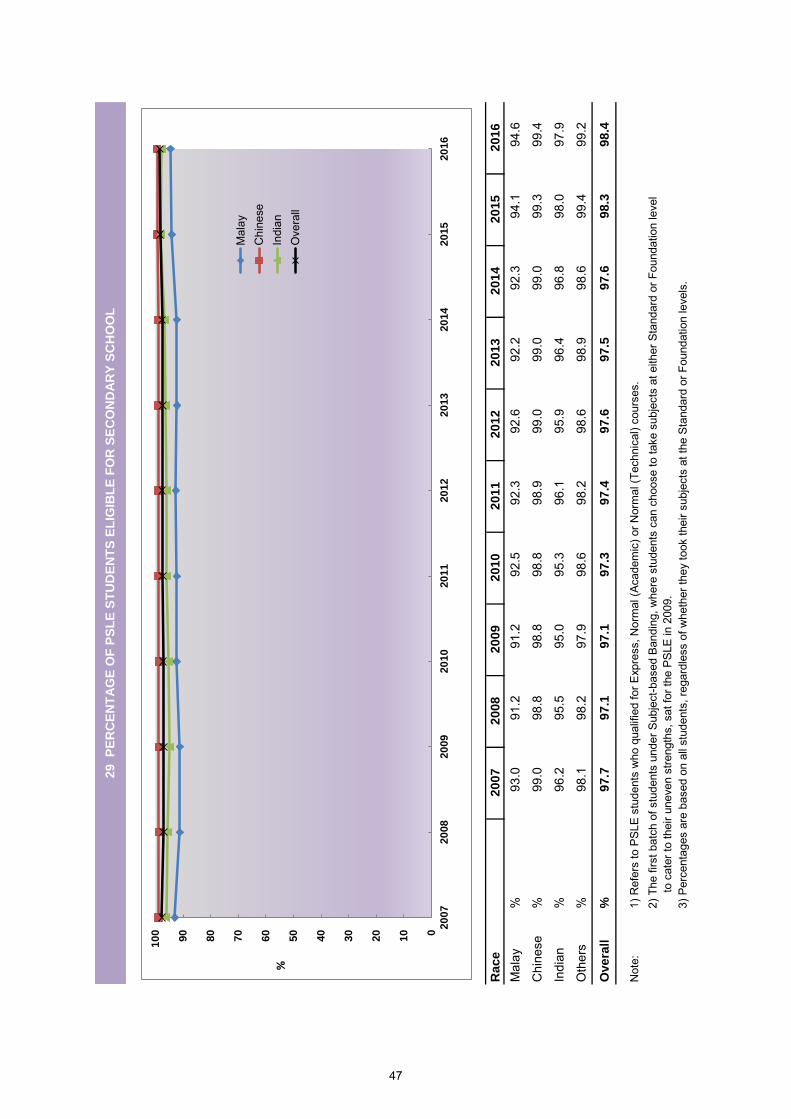
Race
20
07
20
08
20
09
20
10
20
11
20
12
20
13
20
14
20
15
20
16
Mal
ay%
93
.0
91
.2
91
.2
92
.5
92
.3
92
.6
92
.2
92
.3
94
.1
94
.6
Chi
nese
%
99.0
98.8
98.8
98.8
98.9
99.0
99.0
99.0
99.3
99.4
Indi
an%
96
.2
95
.5
95
.0
95
.3
96
.1
95
.9
96
.4
96
.8
98
.0
97
.9
Oth
ers
%
98.1
98.2
97.9
98.6
98.2
98.6
98.9
98.6
99.4
99.2
Overa
ll%
9
7.7
9
7.1
9
7.1
9
7.3
9
7.4
9
7.6
9
7.5
9
7.6
9
8.3
9
8.4
Not
e:1)
Ref
ers
to P
SLE
stud
ents
who
qua
lifie
d fo
r Exp
ress
, Nor
mal
(Aca
dem
ic) o
r Nor
mal
(Tec
hnic
al) c
ours
es.
2) T
he fi
rst b
atch
of s
tude
nts
unde
r Sub
ject
-bas
ed B
andi
ng, w
here
stu
dent
s ca
n ch
oose
to ta
ke s
ubje
cts
at e
ither
Sta
ndar
d or
Fou
ndat
ion
leve
l
to
cate
r to
thei
r une
ven
stre
ngth
s, s
at fo
r the
PSL
E in
200
9.3)
Per
cent
ages
are
bas
ed o
n al
l stu
dent
s, re
gard
less
of w
heth
er th
ey to
ok th
eir s
ubje
cts
at th
e St
anda
rd o
r Fou
ndat
ion
leve
ls.
29 P
ER
CE
NT
AG
E O
F P
SL
E S
TU
DE
NT
S E
LIG
IBL
E F
OR
SE
CO
ND
AR
Y S
CH
OO
L
0
10
20
30
40
50
60
70
80
90
10
0
20
07
20
08
20
09
20
10
20
11
20
12
20
13
20
14
20
15
20
16
%
Mal
ayC
hine
seIn
dian
Ove
rall
47
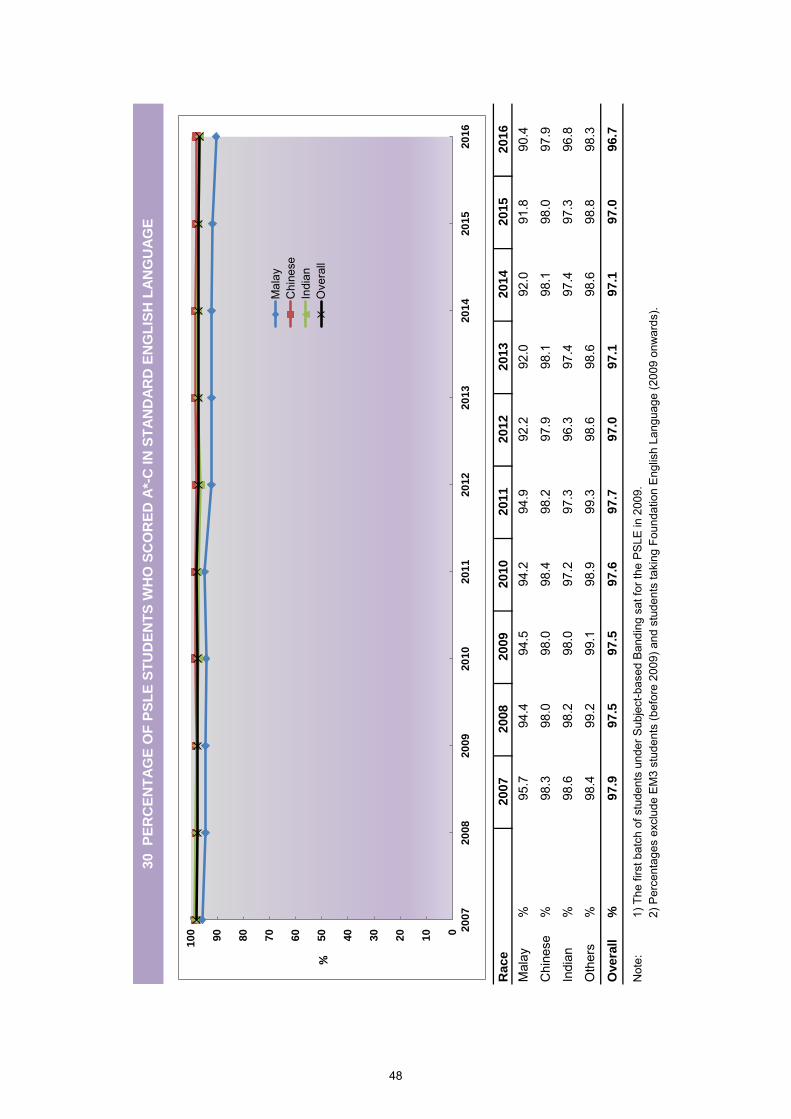
Race
2007
2008
2009
2010
2011
2012
2013
2014
2015
2016
Mal
ay%
95.7
94.4
94.5
94.2
94.9
92.2
92.0
92.0
91.8
90.4
Chi
nese
%98
.3
98
.0
98
.0
98
.498
.297
.998
.198
.198
.097
.9
Indi
an%
98.6
98.2
98.0
97.2
97.3
96.3
97.4
97.4
97.3
96.8
Oth
ers
%98
.4
99
.2
99
.1
98
.999
.398
.698
.698
.698
.898
.3
Overa
ll%
97.9
97.5
97.5
97.6
97.7
97.0
97.1
97.1
97.0
96.7
Not
e:1)
The
firs
t bat
ch o
f stu
dent
s un
der S
ubje
ct-b
ased
Ban
ding
sat
for t
he P
SLE
in 2
009.
2) P
erce
ntag
es e
xclu
de E
M3
stud
ents
(bef
ore
2009
) and
stu
dent
s ta
king
Fou
ndat
ion
Eng
lish
Lang
uage
(200
9 on
war
ds).
30
P
ER
CE
NT
AG
E O
F P
SL
E S
TU
DE
NT
S W
HO
SC
OR
ED
A*-
C IN
ST
AN
DA
RD
EN
GL
ISH
LA
NG
UA
GE
0
10
20
30
40
50
60
70
80
90
10
0 20
07
20
08
20
09
20
10
20
11
20
12
20
13
20
14
20
15
20
16
%
Mal
ayC
hine
seIn
dian
Ove
rall
48
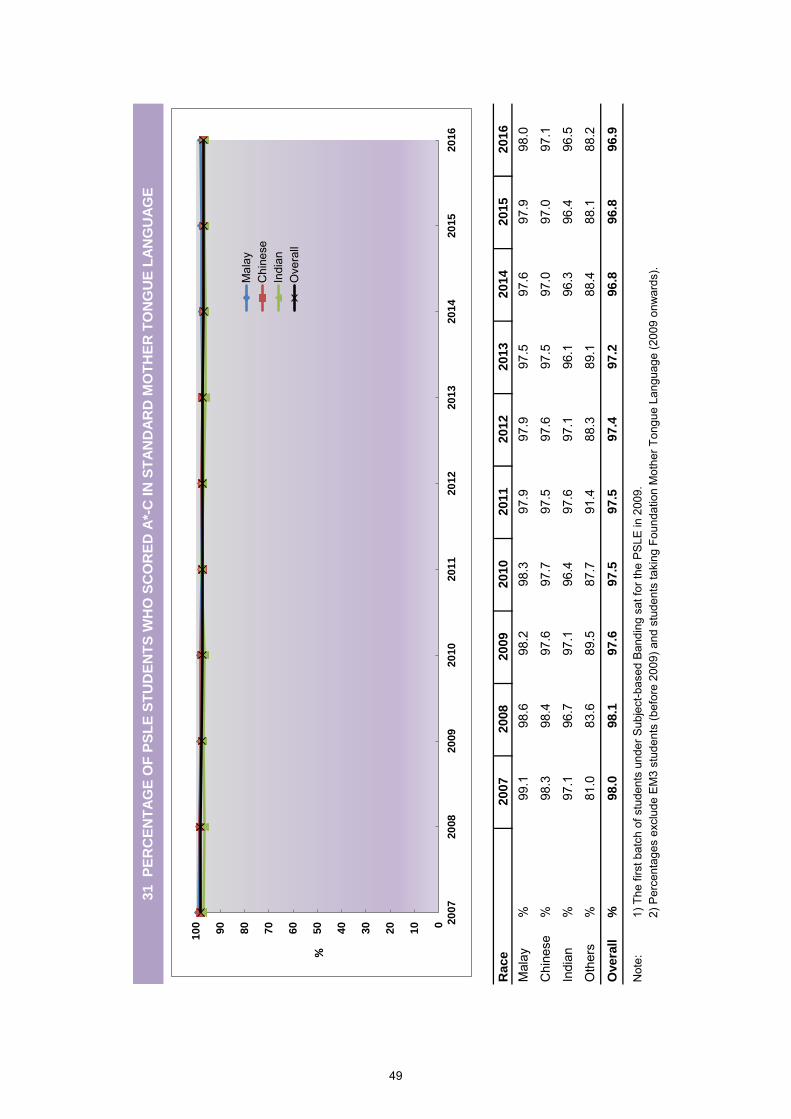
Race
2007
2008
2009
2010
2011
2012
2013
2014
2015
2016
Mal
ay%
99.1
98.6
98.2
98.3
97.9
97.9
97.5
97.6
97.9
98.0
Chi
nese
%98
.3
98
.4
97
.6
97
.797
.597
.697
.597
.097
.097
.1
Indi
an%
97.1
96.7
97.1
96.4
97.6
97.1
96.1
96.3
96.4
96.5
Oth
ers
%81
.0
83
.6
89
.5
87
.791
.488
.389
.188
.488
.188
.2
Overa
ll%
98.0
98.1
97.6
97.5
97.5
97.4
97.2
96.8
96.8
96.9
Not
e:1)
The
firs
t bat
ch o
f stu
dent
s un
der S
ubje
ct-b
ased
Ban
ding
sat
for t
he P
SLE
in 2
009.
2) P
erce
ntag
es e
xclu
de E
M3
stud
ents
(bef
ore
2009
) and
stu
dent
s ta
king
Fou
ndat
ion
Mot
her T
ongu
e La
ngua
ge (2
009
onw
ards
).
31
P
ER
CE
NT
AG
E O
F P
SL
E S
TU
DE
NT
S W
HO
SC
OR
ED
A*-
C IN
ST
AN
DA
RD
MO
TH
ER
TO
NG
UE
LA
NG
UA
GE
0
10
20
30
40
50
60
70
80
90
10
0 20
07
20
08
20
09
20
10
20
11
20
12
20
13
20
14
20
15
20
16
%
Mal
ayC
hine
seIn
dian
Ove
rall
49
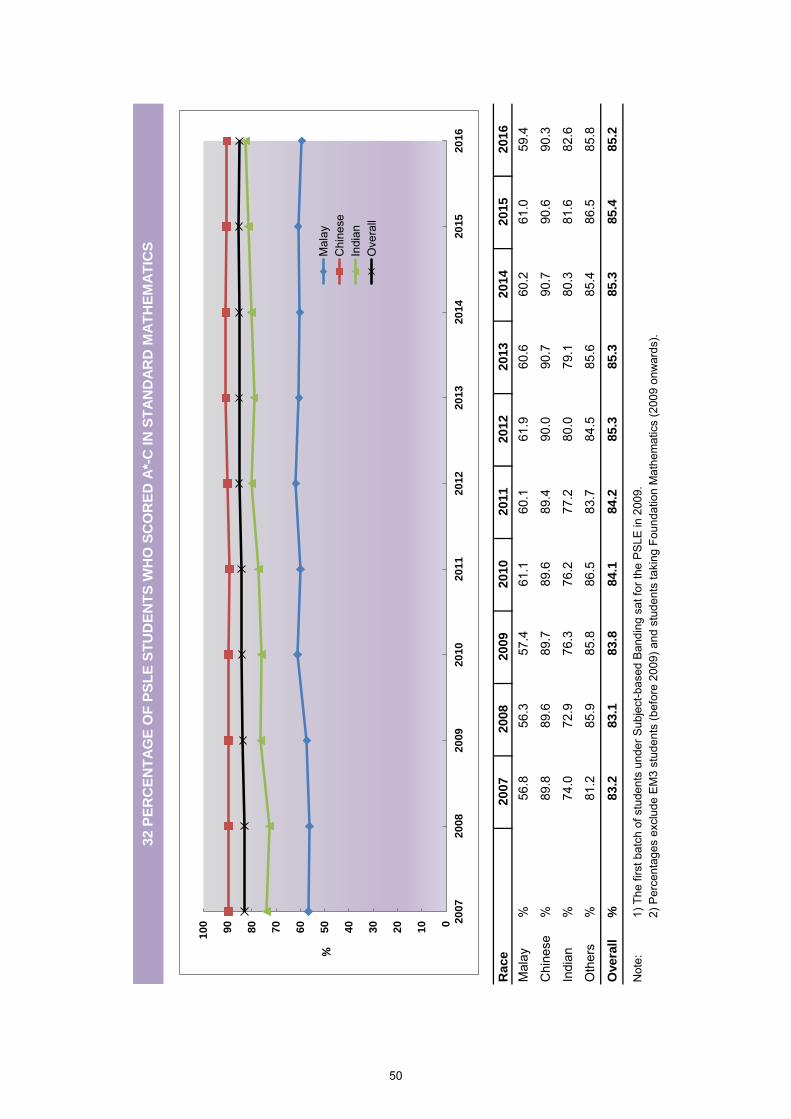
Race
2007
2008
2009
2010
2011
2012
2013
2014
2015
2016
Mal
ay%
56.8
56.3
57.4
61.1
60.1
61.9
60.6
60.2
61.0
59.4
Chi
nese
%89
.8
89
.6
89
.7
89
.689
.490
.090
.790
.790
.690
.3
Indi
an%
74.0
72.9
76.3
76.2
77.2
80.0
79.1
80.3
81.6
82.6
Oth
ers
%81
.2
85
.9
85
.8
86
.583
.784
.585
.685
.486
.585
.8
Overa
ll%
83.2
83.1
83.8
84.1
84.2
85.3
85.3
85.3
85.4
85.2
Not
e:1)
The
firs
t bat
ch o
f stu
dent
s un
der S
ubje
ct-b
ased
Ban
ding
sat
for t
he P
SLE
in 2
009.
2) P
erce
ntag
es e
xclu
de E
M3
stud
ents
(bef
ore
2009
) and
stu
dent
s ta
king
Fou
ndat
ion
Mat
hem
atic
s (2
009
onw
ards
).
32
PE
RC
EN
TA
GE
OF
PS
LE
ST
UD
EN
TS
WH
O S
CO
RE
D A
*-C
IN
ST
AN
DA
RD
MA
TH
EM
AT
ICS
0
10
20
30
40
50
60
70
80
90
10
0 20
07
20
08
20
09
20
10
20
11
20
12
20
13
20
14
20
15
20
16
%M
alay
Chi
nese
Indi
anO
vera
ll
50
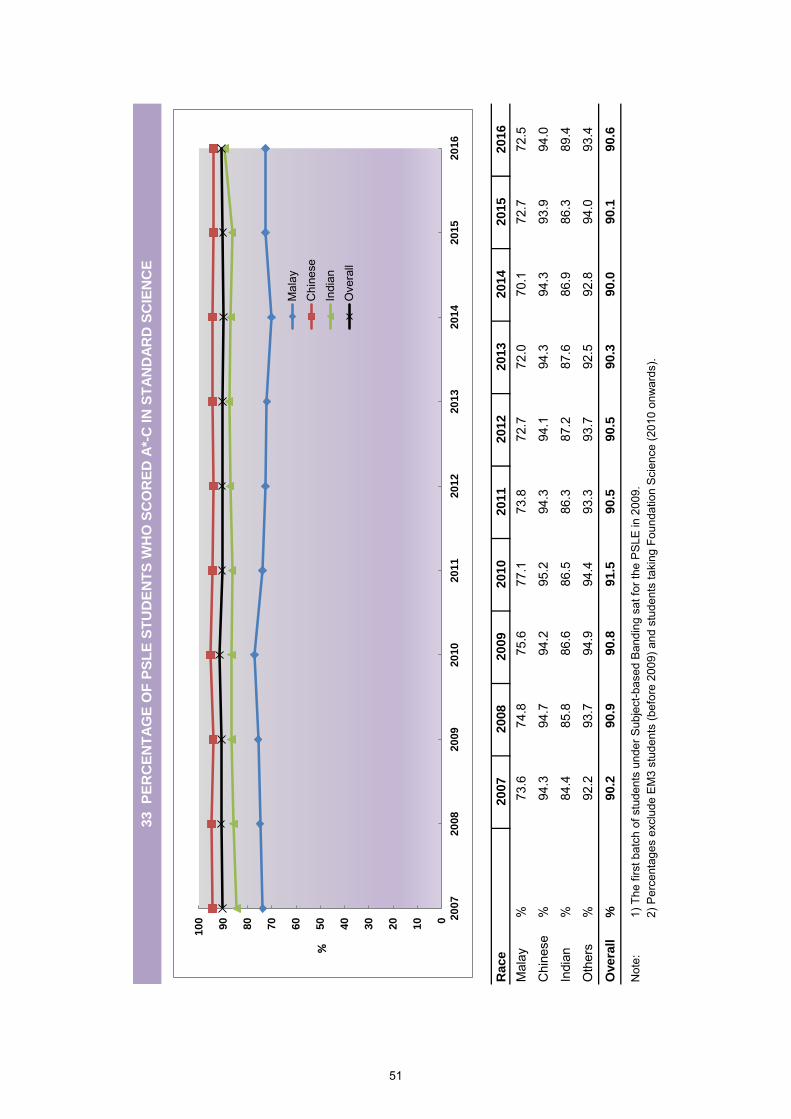
Race
2007
2008
2009
2010
2011
2012
2013
2014
2015
2016
Mal
ay%
73.6
74.8
75.6
77.1
73.8
72.7
72.0
70.1
72.7
72.5
Chi
nese
%94
.3
94
.7
94
.2
95
.294
.394
.194
.394
.393
.994
.0
Indi
an%
84.4
85.8
86.6
86.5
86.3
87.2
87.6
86.9
86.3
89.4
Oth
ers
%92
.2
93
.7
94
.9
94
.493
.393
.792
.592
.894
.093
.4
Overa
ll%
90.2
90.9
90.8
91.5
90.5
90.5
90.3
90.0
90.1
90.6
Not
e:1)
The
firs
t bat
ch o
f stu
dent
s un
der S
ubje
ct-b
ased
Ban
ding
sat
for t
he P
SLE
in 2
009.
2) P
erce
ntag
es e
xclu
de E
M3
stud
ents
(bef
ore
2009
) and
stu
dent
s ta
king
Fou
ndat
ion
Sci
ence
(201
0 on
war
ds).
33
P
ER
CE
NT
AG
E O
F P
SL
E S
TU
DE
NT
S W
HO
SC
OR
ED
A*-
C IN
ST
AN
DA
RD
SC
IEN
CE
0
10
20
30
40
50
60
70
80
90
10
0 20
07
20
08
20
09
20
10
20
11
20
12
20
13
20
14
20
15
20
16
%
Mal
ayC
hine
seIn
dian
Ove
rall
51

Race
2007
2008
2009
2010
2011
2012
2013
2014
2015
2016
Mal
ay%
86
.6
85
.6
88
.1
87
.188
.188
.688
.889
.990
.291
.3
Chi
nese
%
96.5
96.8
96.6
96.9
96.8
96.8
96.9
97.0
97.2
97.5
Indi
an%
91
.3
91
.3
91
.8
91
.792
.092
.993
.595
.094
.093
.9
Oth
ers
%
95.4
95.6
95.9
95.6
95.5
94.0
94.3
94.6
95.6
94.4
Overa
ll%
94.7
94.8
95.1
95.2
95.3
95.4
95.6
95.9
96.0
96.4
Not
e:1)
Fig
ures
exc
lude
Inte
grat
ed P
rogr
amm
e (IP
) stu
dent
s.2)
Fig
ures
incl
ude
all s
choo
l can
dida
tes
exce
pt th
ose
who
took
O-L
evel
sub
ject
s no
t in
thei
r gra
duat
ing
year
.
34
P
ER
CE
NT
AG
E O
F O
-LE
VE
L S
TU
DE
NT
S W
ITH
AT
LE
AS
T 3
O-L
EV
EL
PA
SS
ES
0
10
20
30
40
50
60
70
80
90
10
0 20
07
20
08
20
09
20
10
20
11
20
12
20
13
20
14
20
15
20
16
%
Mal
ay
Chi
nese
Indi
an
Ove
rall
52
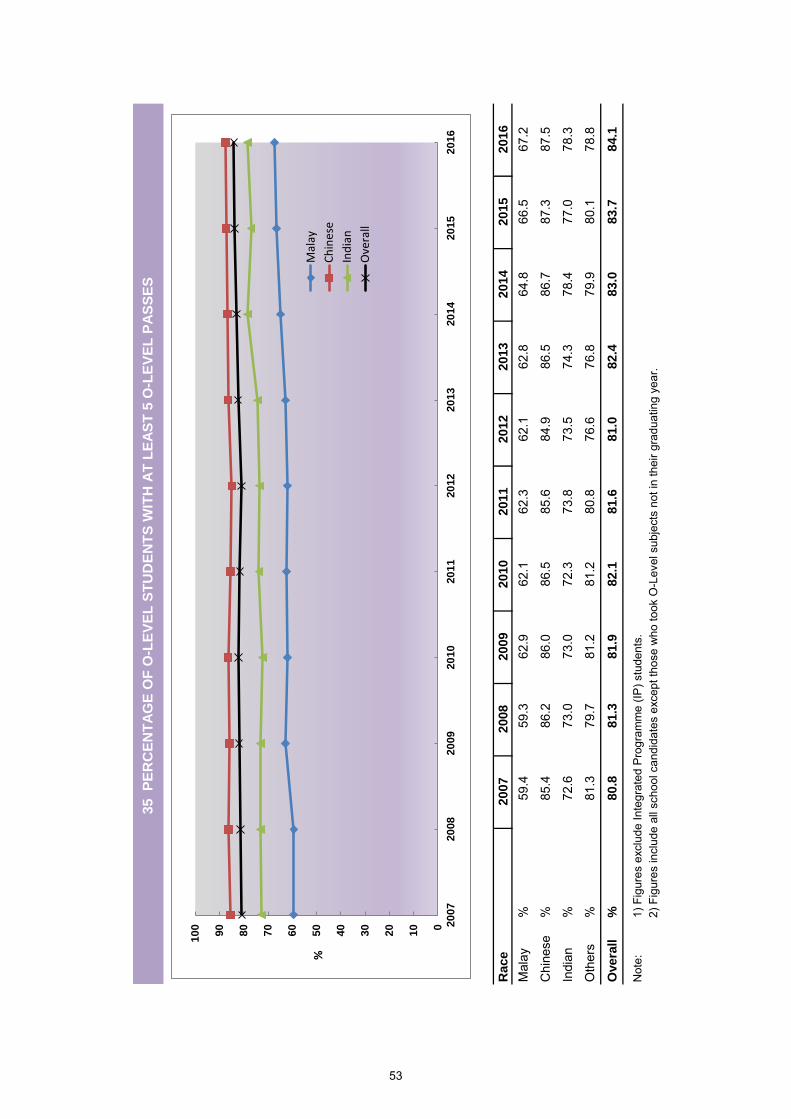
Race
2007
2008
2009
2010
2011
2012
2013
2014
2015
2016
Mal
ay%
59.4
59.3
62.9
62.1
62.3
62.1
62.8
64.8
66.5
67.2
Chi
nese
%
85.4
86.2
86.0
86.5
85.6
84.9
86.5
86.7
87.3
87.5
Indi
an%
72
.6
73
.0
73
.072
.373
.873
.574
.378
.477
.078
.3
Oth
ers
%
81.3
79.7
81.2
81.2
80.8
76.6
76.8
79.9
80.1
78.8
Overa
ll%
80.8
81.3
81.9
82.1
81.6
81.0
82.4
83.0
83.7
84.1
Not
e:1)
Fig
ures
exc
lude
Inte
grat
ed P
rogr
amm
e (IP
) stu
dent
s.2)
Fig
ures
incl
ude
all s
choo
l can
dida
tes
exce
pt th
ose
who
took
O-L
evel
sub
ject
s no
t in
thei
r gra
duat
ing
year
.
35
P
ER
CE
NT
AG
E O
F O
-LE
VE
L S
TU
DE
NT
S W
ITH
AT
LE
AS
T 5
O-L
EV
EL
PA
SS
ES
0
10
20
30
40
50
60
70
80
90
10
0 20
07
20
08
20
09
20
10
20
11
20
12
20
13
20
14
20
15
20
16
%Malay
Chinese
Indian
Overall
53

Race
2007
2008
2009
2010
2011
2012
2013
2014
2015
2016
Mal
ay%
79
.3
79
.5
82
.1
80
.882
.683
.384
.982
.682
.685
.3
Chi
nese
%
86.9
87.7
87.2
87.3
88.0
87.8
89.4
88.6
89.2
89.1
Indi
an%
90
.3
90
.2
91
.1
89
.591
.091
.192
.692
.190
.391
.5
Oth
ers
%
90.7
90.6
91.3
88.4
90.1
90.0
90.9
90.3
91.3
92.9
Overa
ll%
86.1
86.8
86.9
86.6
87.6
87.6
89.1
88.2
88.6
89.0
Not
e:1)
Fig
ures
exc
lude
Inte
grat
ed P
rogr
amm
e (IP
) stu
dent
s.2)
Fig
ures
incl
ude
all s
choo
l can
dida
tes
exce
pt th
ose
who
took
O-L
evel
sub
ject
s no
t in
thei
r gra
duat
ing
year
.
36
P
ER
CE
NT
AG
E O
F O
-LE
VE
L S
TU
DE
NT
S W
HO
PA
SS
ED
EN
GL
ISH
LA
NG
UA
GE
0
10
20
30
40
50
60
70
80
90
10
0 20
07
20
08
20
09
20
10
20
11
20
12
20
13
20
14
20
15
20
16
%
Mal
ay
Chi
nese
Indi
an
Ove
rall
54
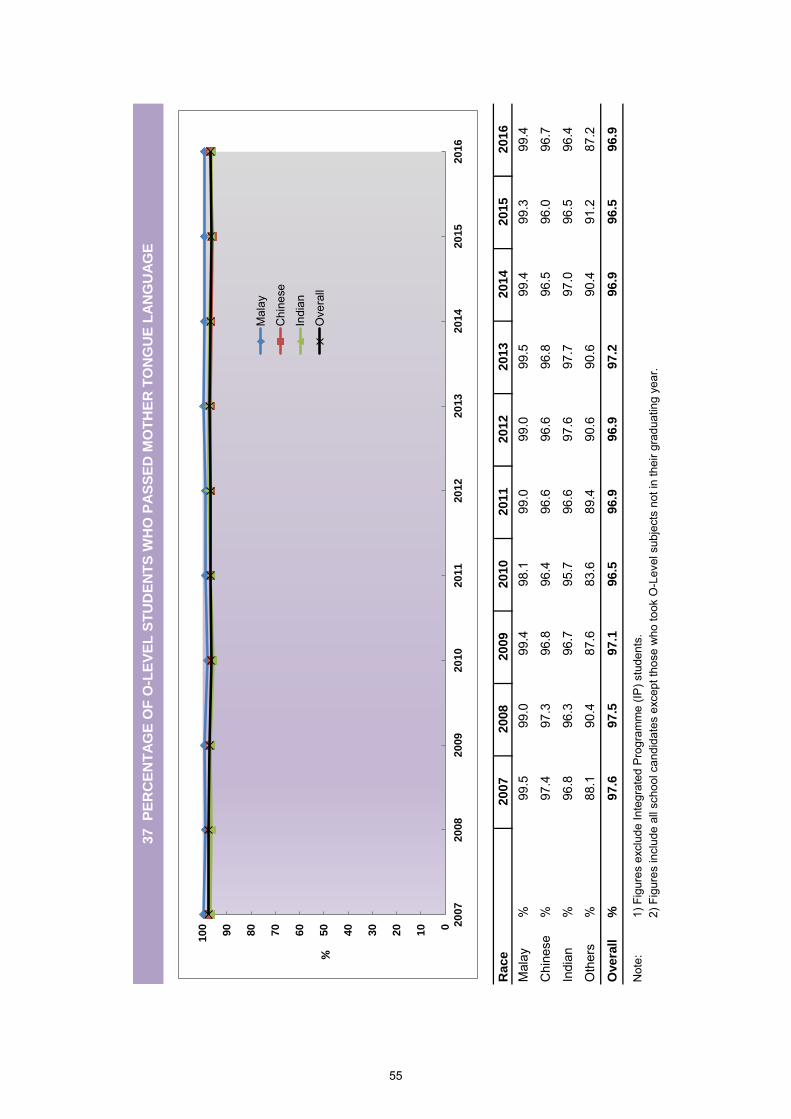
Race
2007
2008
2009
2010
2011
2012
2013
2014
2015
2016
Mal
ay%
99
.5
99
.0
99
.4
98
.199
.099
.099
.599
.499
.399
.4
Chi
nese
%
97.4
97.3
96.8
96.4
96.6
96.6
96.8
96.5
96.0
96.7
Indi
an%
96
.8
96
.3
96
.7
95
.796
.697
.697
.797
.096
.596
.4
Oth
ers
%
88.1
90.4
87.6
83.6
89.4
90.6
90.6
90.4
91.2
87.2
Overa
ll%
97.6
97.5
97.1
96.5
96.9
96.9
97.2
96.9
96.5
96.9
Not
e:1)
Fig
ures
exc
lude
Inte
grat
ed P
rogr
amm
e (IP
) stu
dent
s.2)
Fig
ures
incl
ude
all s
choo
l can
dida
tes
exce
pt th
ose
who
took
O-L
evel
sub
ject
s no
t in
thei
r gra
duat
ing
year
.
37
P
ER
CE
NT
AG
E O
F O
-LE
VE
L S
TU
DE
NT
S W
HO
PA
SS
ED
MO
TH
ER
TO
NG
UE
LA
NG
UA
GE
0
10
20
30
40
50
60
70
80
90
10
0 20
07
20
08
20
09
20
10
20
11
20
12
20
13
20
14
20
15
20
16
%
Mal
ay
Chi
nese
Indi
an
Ove
rall
55

Race
2007
2008
2009
2010
2011
2012
2013
2014
2015
2016
Mal
ay%
66.2
66.4
69.8
70.1
71.2
70.4
69.2
71.7
71.3
70.6
Chi
nese
%91
.7
92
.6
93
.2
93
.292
.892
.892
.793
.493
.393
.5
Indi
an%
75.9
77.6
77.7
78.2
79.1
79.7
79.5
82.9
80.2
81.5
Oth
ers
%88
.6
89
.1
89
.6
90
.290
.188
.886
.088
.788
.285
.3
Overa
ll%
87.0
87.8
88.9
89.0
88.9
88.9
88.7
89.7
89.4
89.6
Not
e:1)
Fig
ures
exc
lude
Inte
grat
ed P
rogr
amm
e (IP
) stu
dent
s2)
Fig
ures
incl
ude
all s
choo
l can
dida
tes
exce
pt th
ose
who
took
O-L
evel
sub
ject
s no
t in
thei
r gra
duat
ing
year
.
38
P
ER
CE
NT
AG
E O
F O
-LE
VE
L S
TU
DE
NT
S W
HO
PA
SS
ED
MA
TH
EM
AT
ICS
0
10
20
30
40
50
60
70
80
90
10
0 20
07
20
08
20
09
20
10
20
11
20
12
20
13
20
14
20
15
20
16
%
Malay
Chinese
Indian
Overall
56
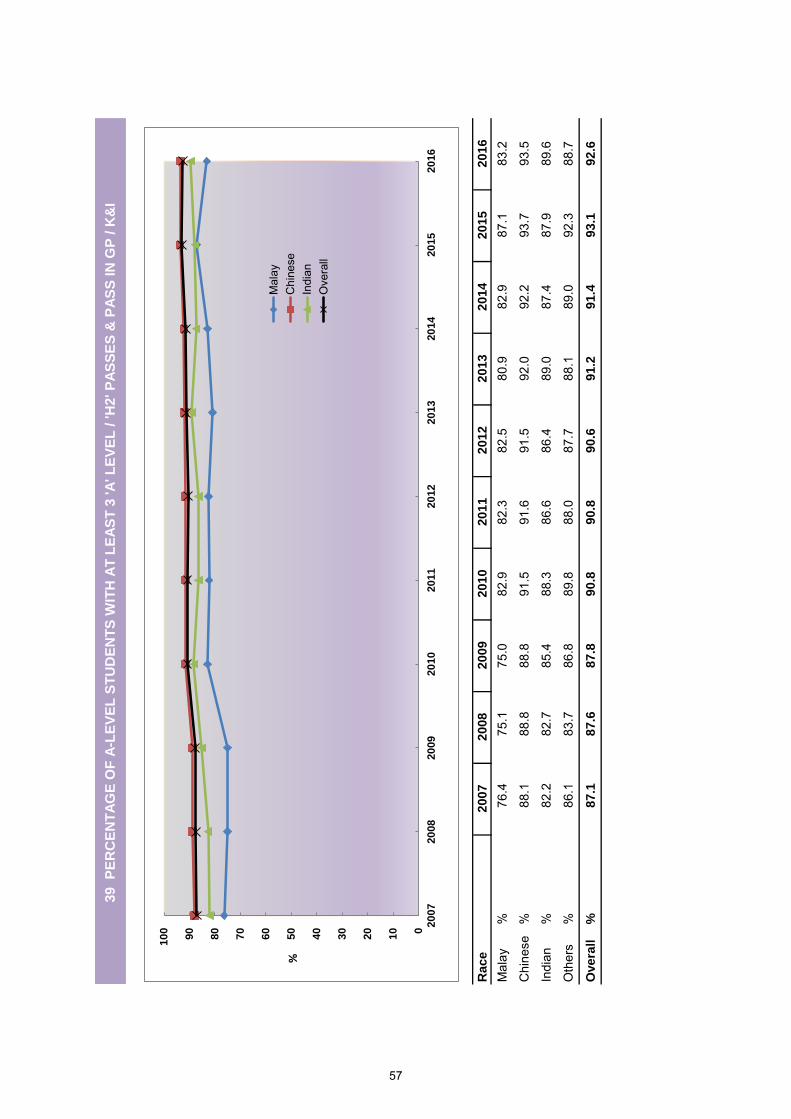
Race
20
07
20
08
20
09
20
10
20
11
20
12
20
13
20
14
20
15
20
16
Mal
ay%
76
.4
75
.1
75
.0
82
.9
82
.3
82
.5
80
.982
.987
.183
.2
Chi
nese
%
88.1
88.8
88.8
91.5
91.6
91.5
92.0
92.2
93.7
93.5
Indi
an%
82
.2
82
.7
85
.4
88
.3
86
.6
86
.4
89
.087
.487
.989
.6
Oth
ers
%
86.1
83.7
86.8
89.8
88.0
87.7
88.1
89.0
92.3
88.7
Overa
ll%
8
7.1
8
7.6
8
7.8
9
0.8
9
0.8
9
0.6
9
1.2
91
.49
3.1
92
.6
39 P
ER
CE
NT
AG
E O
F A
-LE
VE
L S
TU
DE
NT
S W
ITH
AT
LE
AS
T 3
'A
' L
EV
EL
/ 'H
2' P
AS
SE
S &
PA
SS
IN
GP
/ K
&I
0
10
20
30
40
50
60
70
80
90
10
0
20
07
20
08
20
09
20
10
20
11
20
12
20
13
20
14
20
15
20
16
%
Mal
ayC
hine
seIn
dian
Ove
rall
57
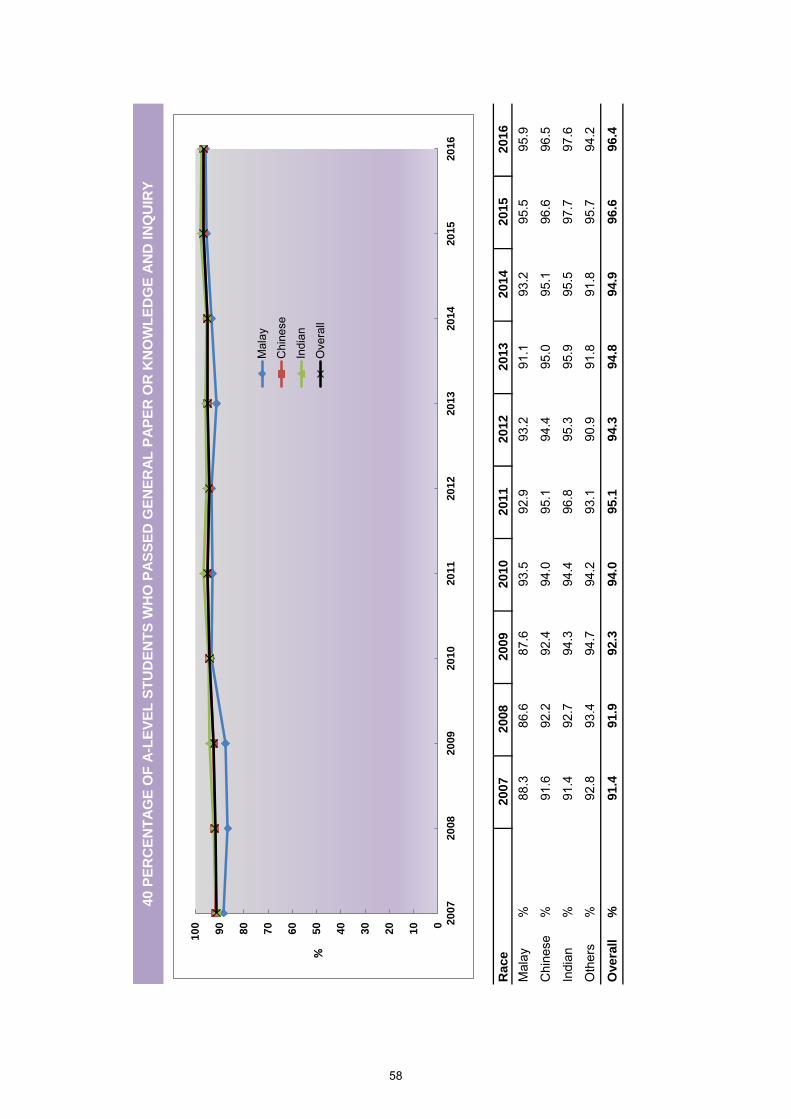
Race
2007
2008
2009
2010
2011
2012
2013
2014
2015
2016
Mal
ay%
88
.3
86
.6
87
.6
93
.592
.993
.291
.193
.295
.595
.9
Chi
nese
%
91.6
92.2
92.4
94.0
95.1
94.4
95.0
95.1
96.6
96.5
Indi
an%
91
.4
92
.7
94
.3
94
.496
.895
.395
.995
.597
.797
.6
Oth
ers
%
92.8
93.4
94.7
94.2
93.1
90.9
91.8
91.8
95.7
94.2
Overa
ll%
91.4
91.9
92.3
94.0
95.1
94.3
94.8
94.9
96.6
96.4
40
PE
RC
EN
TA
GE
OF
A-L
EV
EL
ST
UD
EN
TS
WH
O P
AS
SE
D G
EN
ER
AL
PA
PE
R O
R K
NO
WL
ED
GE
AN
D IN
QU
IRY
0
10
20
30
40
50
60
70
80
90
10
0 20
07
20
08
20
09
20
10
20
11
20
12
20
13
20
14
20
15
20
16
%
Mal
ay
Chi
nese
Indi
an
Ove
rall
58
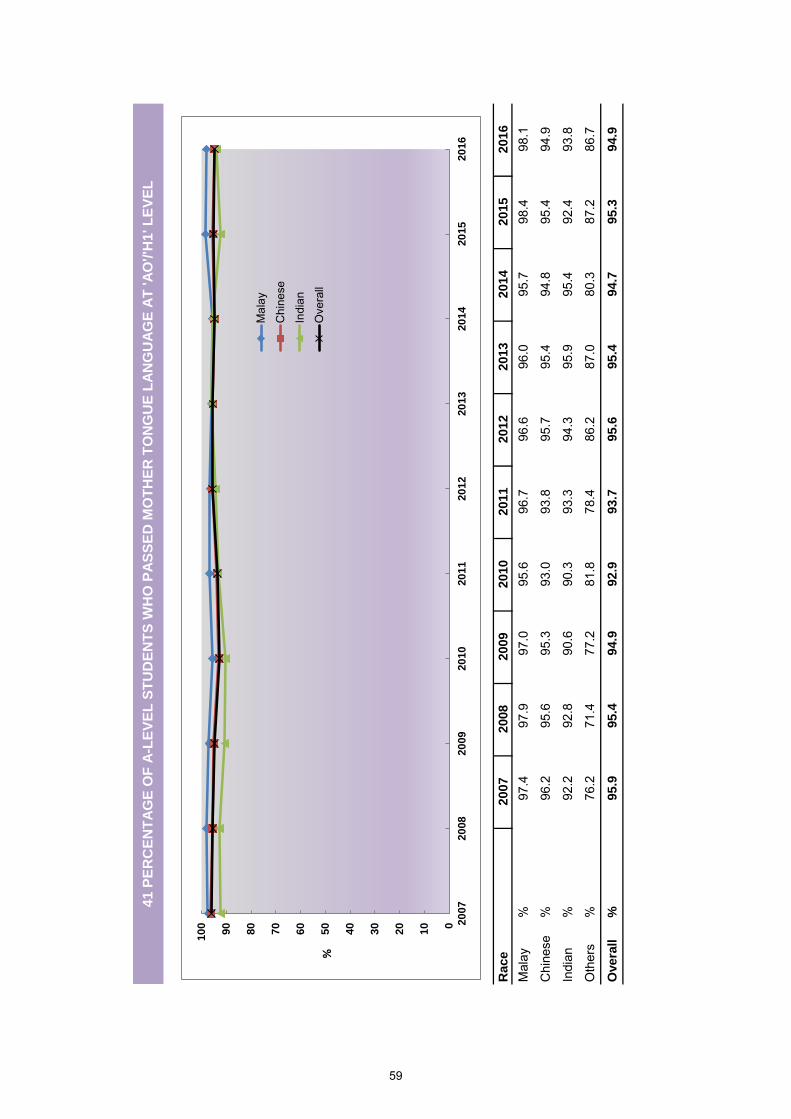
Race
2007
2008
2009
2010
2011
2012
2013
2014
2015
2016
Mal
ay%
97
.4
97
.9
97
.0
95
.696
.796
.696
.095
.798
.498
.1
Chi
nese
%
96.2
95.6
95.3
93.0
93.8
95.7
95.4
94.8
95.4
94.9
Indi
an%
92
.2
92
.8
90
.6
90
.393
.394
.395
.995
.492
.493
.8
Oth
ers
%
76.2
71.4
77.2
81.8
78.4
86.2
87.0
80.3
87.2
86.7
Overa
ll%
95.9
95.4
94.9
92.9
93.7
95.6
95.4
94.7
95.3
94.9
41
PE
RC
EN
TA
GE
OF
A-L
EV
EL
ST
UD
EN
TS
WH
O P
AS
SE
D M
OT
HE
R T
ON
GU
E L
AN
GU
AG
E A
T 'A
O'/'H
1' L
EV
EL
0
10
20
30
40
50
60
70
80
90
10
0 20
07
20
08
20
09
20
10
20
11
20
12
20
13
20
14
20
15
20
16
%
Mal
ay
Chi
nese
Indi
an
Ove
rall
59
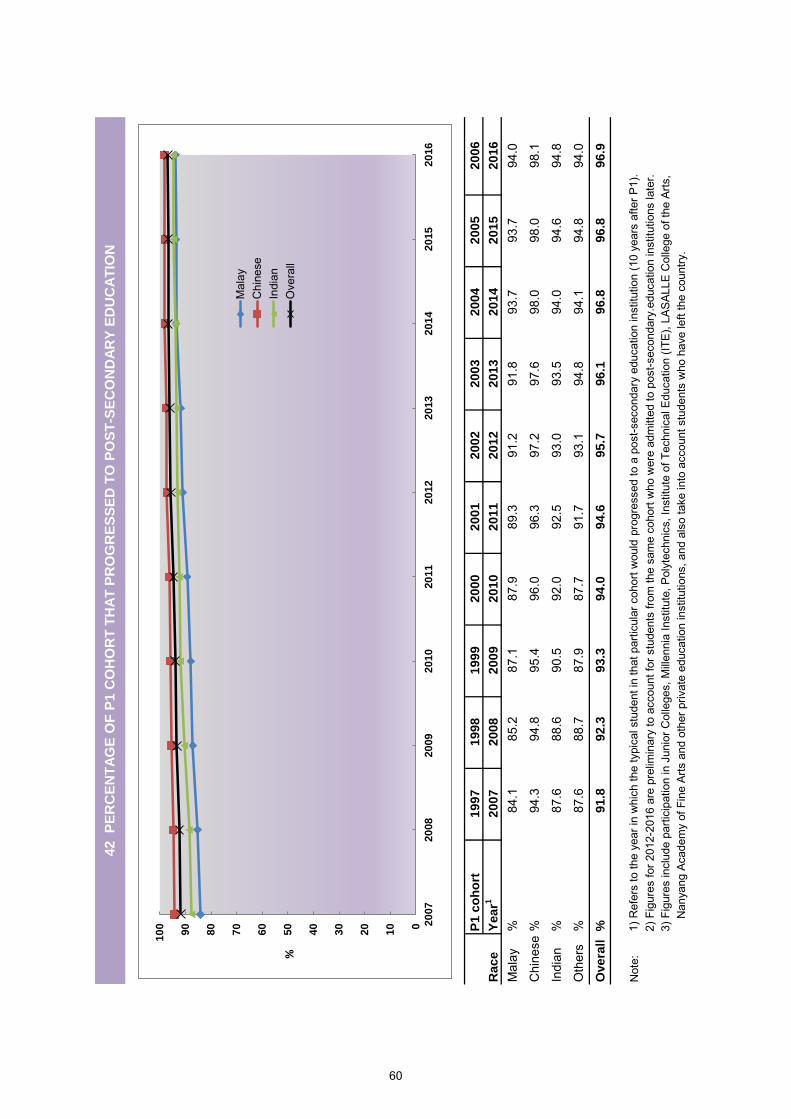
P1 c
oh
ort
19
97
19
98
19
99
20
00
20
01
20
02
20
03
20
04
20
05
20
06
Year1
20
07
20
08
20
09
20
10
20
11
20
12
20
13
20
14
20
15
20
16
Mal
ay%
84
.1
85
.2
87
.187
.989
.391
.291
.893
.793
.794
.0
Chi
nese
%
94.3
94.8
95.4
96.0
96.3
97.2
97.6
98.0
98.0
98.1
Indi
an%
87
.6
88
.6
90
.592
.092
.593
.093
.594
.094
.694
.8
Oth
ers
%
87.6
88.7
87.9
87.7
91.7
93.1
94.8
94.1
94.8
94.0
Overa
ll%
9
1.8
9
2.3
9
3.3
94
.09
4.6
95
.79
6.1
96
.89
6.8
96
.9
Not
e:1)
Ref
ers
to th
e ye
ar in
whi
ch th
e ty
pica
l stu
dent
in th
at p
artic
ular
coh
ort w
ould
pro
gres
sed
to a
pos
t-sec
onda
ry e
duca
tion
inst
itutio
n (1
0 ye
ars
afte
r P1)
. 2)
Fig
ures
for 2
012-
2016
are
pre
limin
ary
to a
ccou
nt fo
r stu
dent
s fro
m th
e sa
me
coho
rt w
ho w
ere
adm
itted
to p
ost-s
econ
dary
.edu
catio
n in
stitu
tions
late
r.3)
Fig
ures
incl
ude
parti
cipa
tion
in J
unio
r Col
lege
s, M
illen
nia
Inst
itute
, Pol
ytec
hnic
s, In
stitu
te o
f Tec
hnic
al E
duca
tion
(ITE)
, LAS
ALLE
Col
lege
of t
he A
rts,
N
anya
ng A
cade
my
of F
ine
Arts
and
oth
er p
rivat
e ed
ucat
ion
inst
itutio
ns, a
nd a
lso
take
into
acc
ount
stu
dent
s w
ho h
ave
left
the
coun
try.
Race
42 P
ER
CE
NT
AG
E O
F P
1 C
OH
OR
T T
HA
T P
RO
GR
ES
SE
D T
O P
OS
T-S
EC
ON
DA
RY
ED
UC
AT
ION
0
10
20
30
40
50
60
70
80
90
10
0 20
07
20
08
20
09
20
10
20
11
20
12
20
13
20
14
20
15
20
16
%
Mal
ayC
hine
seIn
dian
Ove
rall
60
APPENDICES
Milestones in the Education System
Pre-Primary Education
1993 Preparatory Year programme in schools was discontinued to allow schools to concentrate on primary education, leaving kindergarten education to the private sector.
2014 MOE kindergartens were set up in HDB heartlands in a mix of primary
schools and community sites, to provide quality pre-school education that is affordable to Singaporeans, as well as to pilot teaching and learning resources and establish good practices for sharing with the pre-school sector.
Primary Education 1979 Primary streaming was introduced starting with the 1979 Primary 3 (P3)
cohort – The Goh Report recommended that students be channelled to the Normal, Extended and Monolingual streams. The Normal course led to the PSLE at the end of P6. The Extended course offered a slower pace of teaching and learning and students sit for the PSLE after 7-8 years in primary school. The Monolingual course, which helped students to acquire basic literacy and numeracy skills to prepare them for training in a skill or trade with then-Vocational and Industrial Training Board (VITB), led to the Primary School Proficiency Examination (PSPE) at the end of 8 years of schooling.
1991 P3 streaming was removed, and P4 streaming (EM1, EM2 and EM3) was
introduced. At P4, schools assessed students’ performance in English, Mother Tongue and Mathematics, and place each student in one of three language learning streams, while ensuring comparable standards across schools. The students advance to P5 in the same school.
1993 Last batch of P8 Extended and P8 Monolingual students. 2004 Streaming was refined further by merging the EM1 and EM2 streams, while
keeping the EM3 stream. The distinction between the EM1 and EM2 streams was removed to give schools greater flexibility in organising and banding their students to achieve the best educational outcomes. Schools were also given the flexibility to develop their own end-of-year P4 exams to identify students who were capable of studying Higher Mother Tongue (HMTL), or would be best served by the foundational programme offered in EM3.
2008 Subject-based Banding was introduced to replace the EM3 stream, starting
with the 2008 P5 cohort. Under Subject-based Banding, students can offer a mix of Standard or Foundation subjects depending on their aptitude in each subject. With this change, there is no longer any streaming at the primary level.
62
Secondary Education 1980 Secondary streaming was introduced. Based on their PSLE results, students
promoted to Secondary (Sec) 1 are streamed to one of three courses at the secondary level – the Normal course, Express course or Special course. The Normal course is a 5-year course leading to the GCE O-Level exam. The Express course is for more academically-inclined students who can complete the O-Level exam in 4 years. The Special course is offered to the best of PSLE candidates, who offer EL and their MT at the first language level and complete their secondary education in 4 years as in the case with Express course students.
1988 Independent schools were established – Anglo-Chinese School, St Joseph’s
Institution and The Chinese High. The Singapore Chinese Girls’ School and Methodist Girls’ School followed suit in 1989, Raffles Institution in 1990, and Raffles Girls’ School and Nanyang Girls’ High School in 1993.
1994 Sec 1 Normal (Technical) (N(T)) course was introduced to cater to the needs
of students who are more technically inclined. It provides these students with an opportunity to complete 10 years of basic education and prepares them for post-secondary education in ITE, including a possible transfer to the Normal (Academic) (N(A)) course.
1994 Autonomous schools were established. A number of non-independent
schools were given greater autonomy as well as additional funding to develop a wider and better range of programmes for their students. This provides parents with more options when choosing a school suited for their children.
2004 The progression structure for the Normal (Technical) course was revised
to provide additional pathways for transfers to the Normal (Academic) course on a “lateral” basis, e.g. Sec 2N(T) to Sec 2N(A), to provide greater flexibility and choice to cater to the different abilities of N(T) students. The new system of lateral transfers replaced the provision for promotion from Sec 4N(T) to Sec 5.
2004 The Singapore Sports School admitted its first batch of students. It is the
first Specialised Independent School offering an integrated academic and sports programme.
2005 NUS High School of Mathematics and Science, a Specialised Independent
School admitted its first batch of students. NUS High aims to nurture well-rounded and world-ready scientific minds.
2007 NorthLight School, Singapore’s first Specialised School, was established
to better cater to students who can benefit from a more customised and vocational curriculum.
63
2008 The Special and Express Courses were merged into the Express Course to
recognise the diminishing differences between the two courses. 2008 The School of The Arts (SOTA) admitted its first batch of students. It is a
Specialised Independent School offering a dedicated development path for those who have interest and show early talent in the arts.
2008 Assumption Vocational Institute was re-modelled into the Assumption
Pathway School, Singapore’s second Specialised School. Like NorthLight School, it provides student who can benefit more from a hands-on and practical approach to learning.
2010 The School of Science and Technology (SST), a Specialised Independent
School admitted its first batch of students in 2010. It offers students a range of options in applied areas related to technology, media and design.
2013 Crest Secondary, the first Specialised School for Normal (Technical)
(SSNT) students, admitted its first batch of students. The school provides a customised curriculum to suit the learning needs of its students. It also works closely with the Institute of Technical Education (ITE) and industry partners to develop programmes and attachment opportunities for its students.
2014 Spectra Secondary, the second SSNT, admitted its first batch of students.
Post-Secondary Education
Pre-University 1969 Junior college education was introduced to improve the quality of education
at pre-university level. National Junior College was the first Junior College. 1979 A three-year Pre-University course was introduced to (i) provide an extra
year for non-English stream students to upgrade their proficiency in the English Language and (ii) cater to students who require an extra year to suit their pace of learning.
1987 Centralised Institutes were introduced. Unlike Pre-U Centres, Centralised
Institutes have their own facilities. They offer the same A-Level courses as Junior Colleges, but with a greater emphasis on commerce subjects.
1995 Pre-U Centres were phased out due to falling demand.
64

2000 The A-Level commerce course in Junior Colleges was phased out because the polytechnics already offer a commerce course and can take in more students than before.
2004 The Integrated Programme (IP) was introduced to provide academically
strong students with an enriched curriculum beyond academic content. IP students can progress to JC without taking the O-Levels.
Polytechnic 1954 Singapore Polytechnic was established to meet the manpower needs of
industrialisation. 1963 Ngee Ann College was inaugurated as an independent college. It later became
Ngee Ann Technical College in 1968 and then Ngee Ann Polytechnic in 1981. 1990 Temasek Polytechnic, Singapore’s third polytechnic, was established to cater
to the growing number of people opting for polytechnic education, and helped widen the range of courses to meet industry needs. It was the first major tertiary institution in the east.
1992 Nanyang Polytechnic, Singapore’s fourth polytechnic, was established and
enrolled its pioneer batch of students in its School of Health Sciences and School of Business Management. The courses offered were new options at the diploma level at that time.
2002 Republic Polytechnic, Singapore’s fifth polytechnic, was established to cater to the need for increased capacity for pre-employment training. It admitted its first batch of students in 2003.
2006 Polytechnic admission criteria were broadened to recognise a wider range of
aptitudes and talents other than academic achievements, with the introduction of the Joint Polytechnic Special Admissions Exercise (JPSAE) in 2006 and Direct Polytechnic Admission Exercise (DPA) in 2007.
2013 The one-year Polytechnic Foundation Programme (PFP) was rolled out to
provide an alternative education pathway to prepare students who had performed very well in their GCE N(A)-Level examinations for entry into relevant polytechnic diploma courses.
2016 Aptitude-based admissions to polytechnics were enhanced with the newly-
introduced Polytechnic Early Admissions Exercise (EAE), which expanded the allowance for students to gain admission to the polytechnics based on their aptitude and interest related to their intended fields of study.
65
Institute of Technical Education 1958 The Adult Education Board (AEB) was established to promote education for
adults after the end of Second World War. 1961 Vocational schools were introduced to provide two-year vocational courses
for over-age primary school leavers who did not qualify for admission to secondary schools. By 1969, these were eventually merged with academic schools, converted to vocational institutes (VIs), or phased out due to falling demand.
1964 The Singapore Vocational Institute was established as the first VI to prepare
premature school leavers and O-Level holders for post-secondary technical education or employment. By 1979, the rapidly growing pace of industrialisation saw the establishment of 12 more VIs.
1969 The Singapore Technical Institute (STI) was established to meet the
industry’s requirement for industrial technicians. STI’s courses helped bridge the gap between the trade courses offered in the VIs, and the three-year technician diploma courses at Singapore Polytechnic and the Ngee Ann Technical College.
1973 The Industrial Training Board (ITB) was established to centralise, co-
ordinate and promote all forms of skills training both in education and in the industry itself.
1979 The Vocational & Industrial Training Board (VITB) was established as a
statutory board as a result of a merger of AEB & ITB, and took charge of the VIs. 1992 The VITB was restructured into the Institute of Technical Education (ITE).
The primary role of ITE was to ensure that its graduates had technical knowledge and skills that were relevant to industry. ITE was also the national authority for the setting of skills standards and the certification of skills in Singapore.
2005 ITE implemented the ‘One ITE System, Three Colleges’ model which saw
the restructuring of the 10 ITE institutes into three regional colleges. 2008 The Direct-Entry-Scheme to Higher Nitec Programme (DES) was launched
as an alternative pathway for Secondary 4 Normal (Academic) students. Under the DES, students who complete their GCE N(A)-Level examinations can progress to Higher Nitec courses directly instead of taking the GCE O-Level examinations at Secondary 5.
2013 The Direct-Entry-Scheme to Polytechnic Programme (DPP) replaced the
DES. It allows selected students who have completed their GCE N(A)-Level
66
examinations to progress directly to a Higher Nitec programme in ITE, and subsequently to a related polytechnic diploma course.
2017 Aptitude-based admissions to ITE was enhanced with the newly-introduced ITE EAE, which allows secondary school and Nitec students to gain admission to Nitec and Higher Nitec courses based on their aptitude and interest related to their intended fields of study.
University Education 1956 Nanyang University (Nantah or NU) admitted its first batch of students. It
was formed in response to greater demand for higher education in the Chinese language medium.
1962 The University of Singapore (SU) was set up after its split from the University
of Malaya. 1980 The National University of Singapore (NUS) was established with the
merger of SU and NU. It promoted English as Singapore's main language. 1981 The Nanyang Technological Institute (NTI) was established to produce
practice-oriented programmes for engineers who wished to concentrate on application. NTI admitted its first batch of students in 1982.
1991 The NTI was re-constituted to Nanyang Technological University (NTU) to
increase the number of university places. 2000 The Singapore Management University (SMU) was established as
Singapore’s first Autonomous University. SMU was set in a city campus to facilitate a closer nexus with businesses in its degree and executive programmes.
2005 Duke-NUS Medical School (Duke-NUS) was established as a collaboration
between NUS and Duke University. As our only graduate medical school, it adds diversity to the medical education landscape and provides an avenue to train clinician-scientists.
2005 SIM University (UniSIM) was established as a private university dedicated to
adult learners. It began offering publicly-subsidised part-time undergraduate degree programmes in 2008, and publicly-subsidised full-time degree programmes in 2014.
2009 The Singapore Institute of Technology (SIT) was established to provide an
improved upgrading pathway for polytechnic graduates to obtain industry-
67
relevant degrees offered in partnership with overseas universities. It admitted its first batch of students in 2010.
2009 The Singapore University of Technology and Design (SUTD) was
incorporated in collaboration with the Massachusetts Institute of Technology and Zhejiang University. It admitted its first batch of students in 2012.
2010 The Lee Kong Chian School of Medicine (LKCMedicine) was established as
Singapore’s third medical school, as a collaboration between NTU and Imperial College London. It admitted its first batch of students in 2013.
2011 Yale-NUS College (YNC) was established as a collaboration between NUS
and Yale University to offer a liberal arts education, integrating the best of Western and Asian intellectual traditions. It admitted its first batch of students in 2013.
2014 SIT attained the status of Autonomous University and further added to the
diversity of the university landscape in Singapore by pioneering a new applied degree pathway along with SIM University (UniSIM). SIT launched its own degree programmes in Accountancy, Infocomm Technology and Sustainable Infrastructure Engineering (Land), and UniSIM launched its first full-time degree programmes in Accountancy, Finance, Marketing and Human Resource Management.
2017 UniSIM was renamed as the Singapore University of Social Sciences
(SUSS) and attained the status of Autonomous University. SUSS offers full-time and part-time degree-level programmes that are designed to support the needs of working adults and those who prefer a more applied model of learning. The focus of its programmes will be on those that prepare individuals for careers in the social sector, such as social work and early childhood education, careers with a strong social orientation, such as human resource management, as well as law (focusing on family and criminal law).
Arts Institutions
1938 Nanyang Academy of Fine Arts (NAFA) was established by Chinese artist
and art educator Lim Hak Tai. As Singapore’s pioneer arts education institution, the school was modelled after the Chinese art academies but with a balance of Western and Chinese art traditions in its curriculum.
1982 NAFA launched a full-time Diploma in Applied Arts course, the first
institution to do so in Singapore. Courses in computer graphic design were also offered.
68
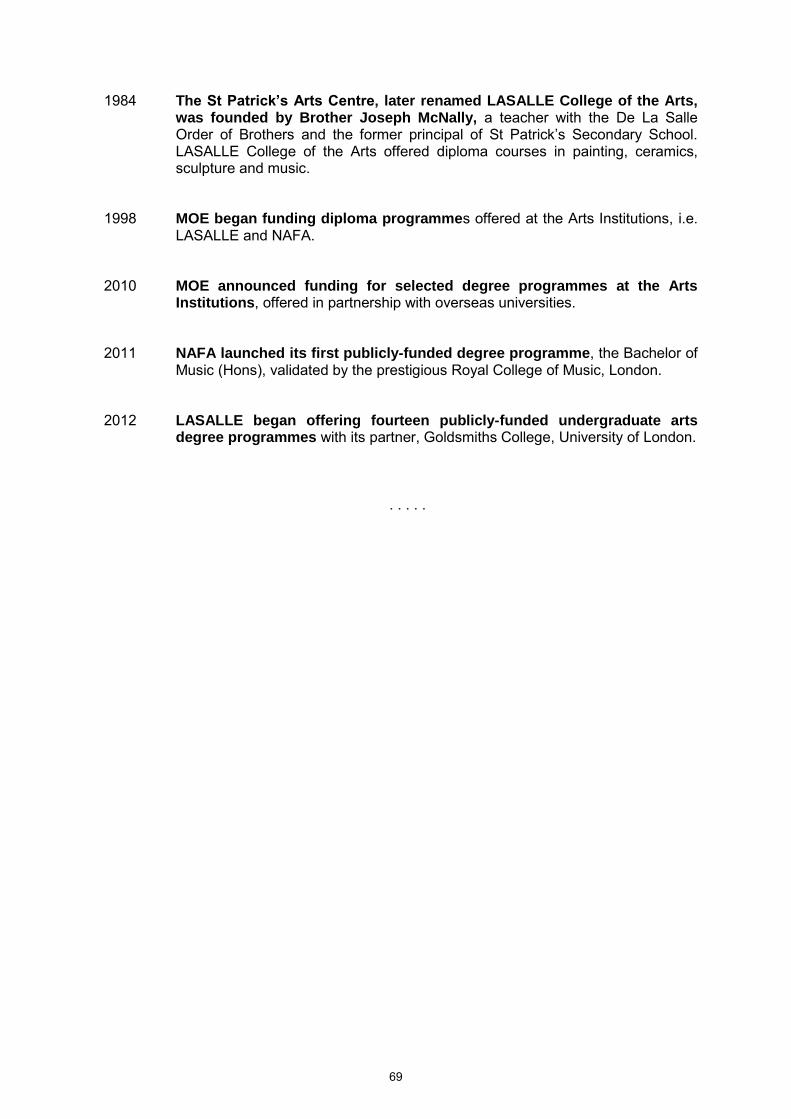
1984 The St Patrick’s Arts Centre, later renamed LASALLE College of the Arts, was founded by Brother Joseph McNally, a teacher with the De La Salle Order of Brothers and the former principal of St Patrick’s Secondary School. LASALLE College of the Arts offered diploma courses in painting, ceramics, sculpture and music.
1998 MOE began funding diploma programmes offered at the Arts Institutions, i.e. LASALLE and NAFA.
2010 MOE announced funding for selected degree programmes at the Arts
Institutions, offered in partnership with overseas universities. 2011 NAFA launched its first publicly-funded degree programme, the Bachelor of
Music (Hons), validated by the prestigious Royal College of Music, London. 2012 LASALLE began offering fourteen publicly-funded undergraduate arts
degree programmes with its partner, Goldsmiths College, University of London.
. . . . .
69
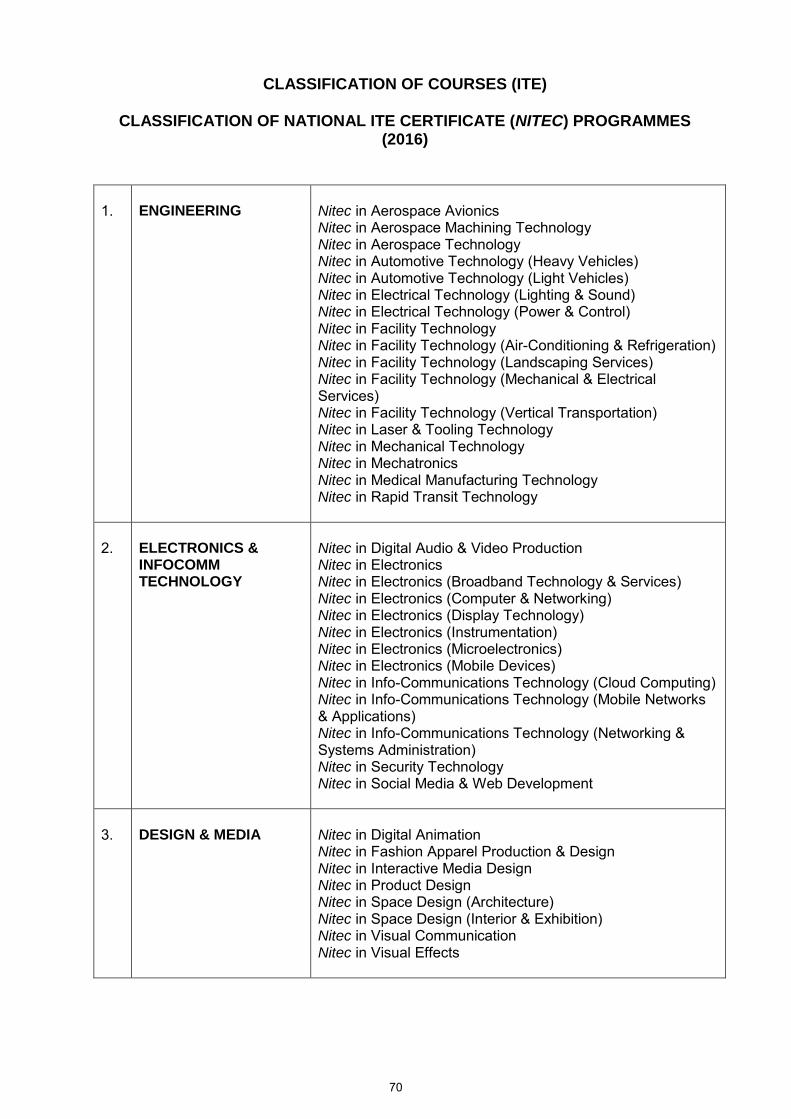
CLASSIFICATION OF COURSES (ITE)
CLASSIFICATION OF NATIONAL ITE CERTIFICATE (NITEC) PROGRAMMES (2016)
1.
ENGINEERING
Nitec in Aerospace Avionics Nitec in Aerospace Machining Technology Nitec in Aerospace Technology Nitec in Automotive Technology (Heavy Vehicles) Nitec in Automotive Technology (Light Vehicles) Nitec in Electrical Technology (Lighting & Sound) Nitec in Electrical Technology (Power & Control) Nitec in Facility Technology Nitec in Facility Technology (Air-Conditioning & Refrigeration) Nitec in Facility Technology (Landscaping Services) Nitec in Facility Technology (Mechanical & Electrical Services) Nitec in Facility Technology (Vertical Transportation) Nitec in Laser & Tooling Technology Nitec in Mechanical Technology Nitec in Mechatronics Nitec in Medical Manufacturing Technology Nitec in Rapid Transit Technology
2.
ELECTRONICS & INFOCOMM TECHNOLOGY
Nitec in Digital Audio & Video Production Nitec in Electronics Nitec in Electronics (Broadband Technology & Services) Nitec in Electronics (Computer & Networking) Nitec in Electronics (Display Technology) Nitec in Electronics (Instrumentation) Nitec in Electronics (Microelectronics) Nitec in Electronics (Mobile Devices) Nitec in Info-Communications Technology (Cloud Computing) Nitec in Info-Communications Technology (Mobile Networks & Applications) Nitec in Info-Communications Technology (Networking & Systems Administration) Nitec in Security Technology Nitec in Social Media & Web Development
3.
DESIGN & MEDIA
Nitec in Digital Animation Nitec in Fashion Apparel Production & Design Nitec in Interactive Media Design Nitec in Product Design Nitec in Space Design (Architecture) Nitec in Space Design (Interior & Exhibition) Nitec in Visual Communication Nitec in Visual Effects
70
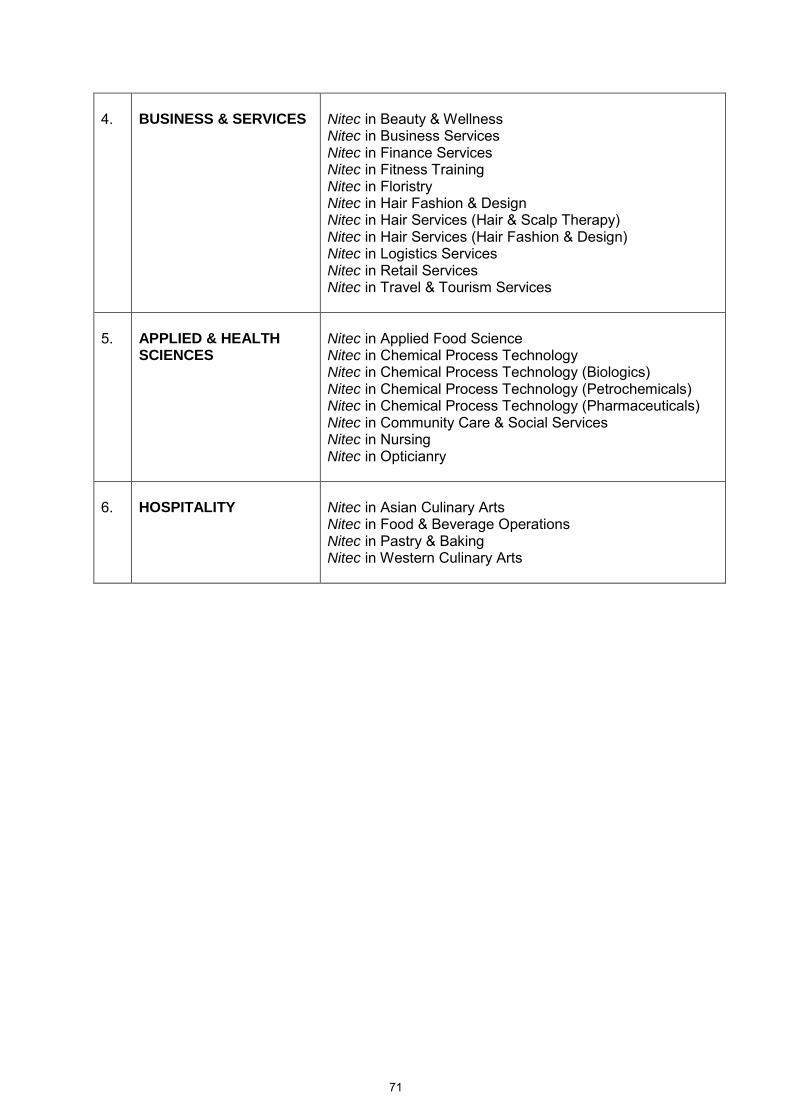
4.
BUSINESS & SERVICES
Nitec in Beauty & Wellness Nitec in Business Services Nitec in Finance Services Nitec in Fitness Training Nitec in Floristry Nitec in Hair Fashion & Design Nitec in Hair Services (Hair & Scalp Therapy) Nitec in Hair Services (Hair Fashion & Design) Nitec in Logistics Services Nitec in Retail Services Nitec in Travel & Tourism Services
5.
APPLIED & HEALTH SCIENCES
Nitec in Applied Food Science Nitec in Chemical Process Technology Nitec in Chemical Process Technology (Biologics) Nitec in Chemical Process Technology (Petrochemicals) Nitec in Chemical Process Technology (Pharmaceuticals) Nitec in Community Care & Social Services Nitec in Nursing Nitec in Opticianry
6.
HOSPITALITY
Nitec in Asian Culinary Arts Nitec in Food & Beverage Operations Nitec in Pastry & Baking Nitec in Western Culinary Arts
71
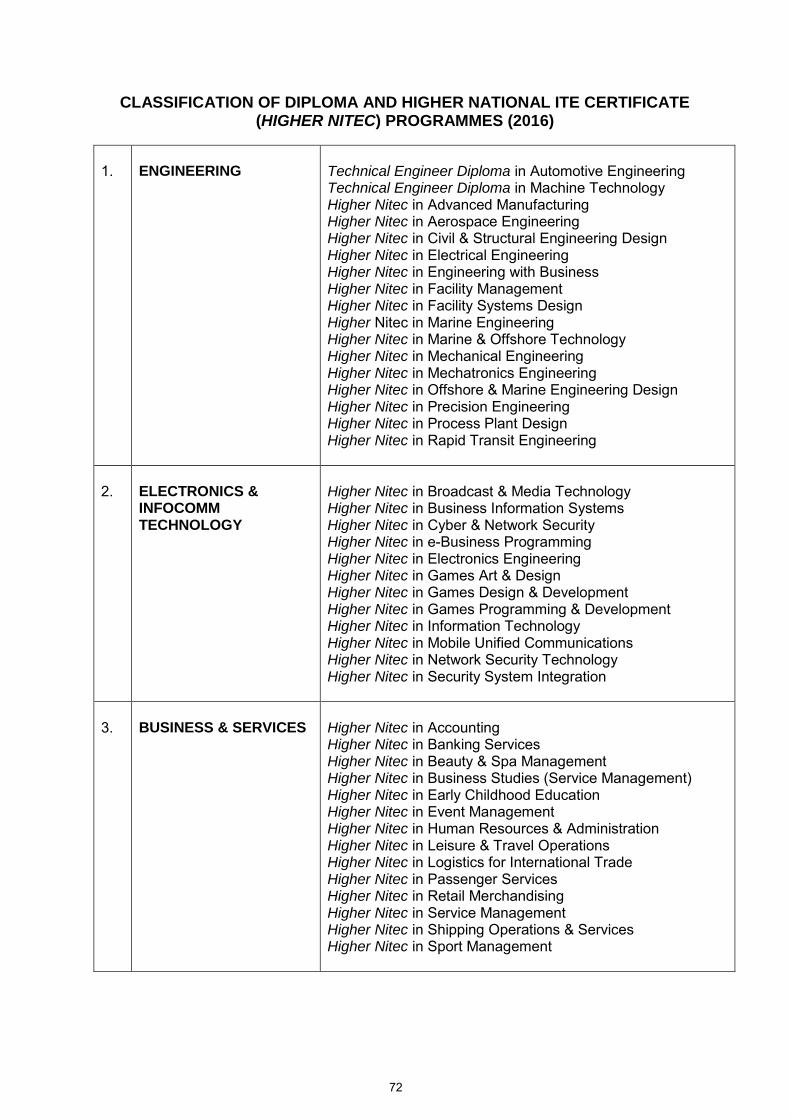
CLASSIFICATION OF DIPLOMA AND HIGHER NATIONAL ITE CERTIFICATE (HIGHER NITEC) PROGRAMMES (2016)
1.
ENGINEERING
Technical Engineer Diploma in Automotive Engineering Technical Engineer Diploma in Machine Technology Higher Nitec in Advanced Manufacturing Higher Nitec in Aerospace Engineering Higher Nitec in Civil & Structural Engineering Design Higher Nitec in Electrical Engineering Higher Nitec in Engineering with Business Higher Nitec in Facility Management Higher Nitec in Facility Systems Design Higher Nitec in Marine Engineering Higher Nitec in Marine & Offshore Technology Higher Nitec in Mechanical Engineering Higher Nitec in Mechatronics Engineering Higher Nitec in Offshore & Marine Engineering Design Higher Nitec in Precision Engineering Higher Nitec in Process Plant Design Higher Nitec in Rapid Transit Engineering
2.
ELECTRONICS & INFOCOMM TECHNOLOGY
Higher Nitec in Broadcast & Media Technology Higher Nitec in Business Information Systems Higher Nitec in Cyber & Network Security Higher Nitec in e-Business Programming Higher Nitec in Electronics Engineering Higher Nitec in Games Art & Design Higher Nitec in Games Design & Development Higher Nitec in Games Programming & Development Higher Nitec in Information Technology Higher Nitec in Mobile Unified Communications Higher Nitec in Network Security Technology Higher Nitec in Security System Integration
3.
BUSINESS & SERVICES
Higher Nitec in Accounting Higher Nitec in Banking Services Higher Nitec in Beauty & Spa Management Higher Nitec in Business Studies (Service Management) Higher Nitec in Early Childhood Education Higher Nitec in Event Management Higher Nitec in Human Resources & Administration Higher Nitec in Leisure & Travel Operations Higher Nitec in Logistics for International Trade Higher Nitec in Passenger Services Higher Nitec in Retail Merchandising Higher Nitec in Service Management Higher Nitec in Shipping Operations & Services Higher Nitec in Sport Management
72
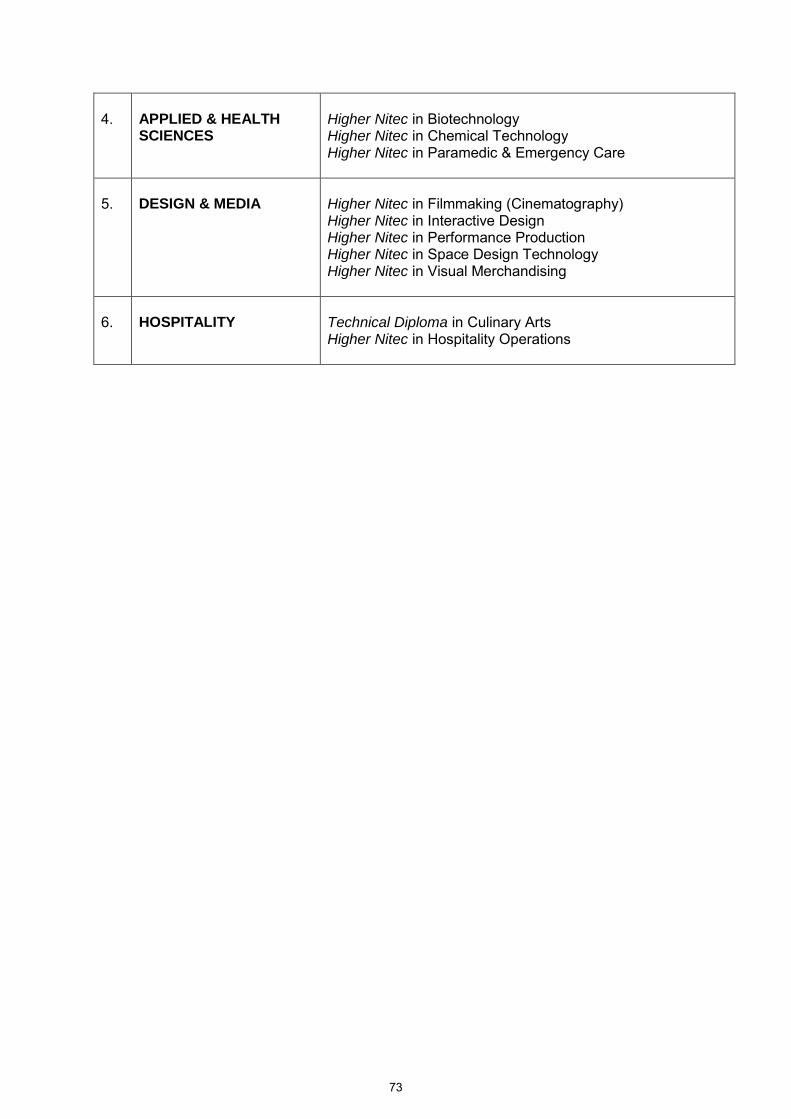
4.
APPLIED & HEALTH SCIENCES
Higher Nitec in Biotechnology Higher Nitec in Chemical Technology Higher Nitec in Paramedic & Emergency Care
5.
DESIGN & MEDIA
Higher Nitec in Filmmaking (Cinematography) Higher Nitec in Interactive Design Higher Nitec in Performance Production Higher Nitec in Space Design Technology Higher Nitec in Visual Merchandising
6.
HOSPITALITY
Technical Diploma in Culinary Arts Higher Nitec in Hospitality Operations
73
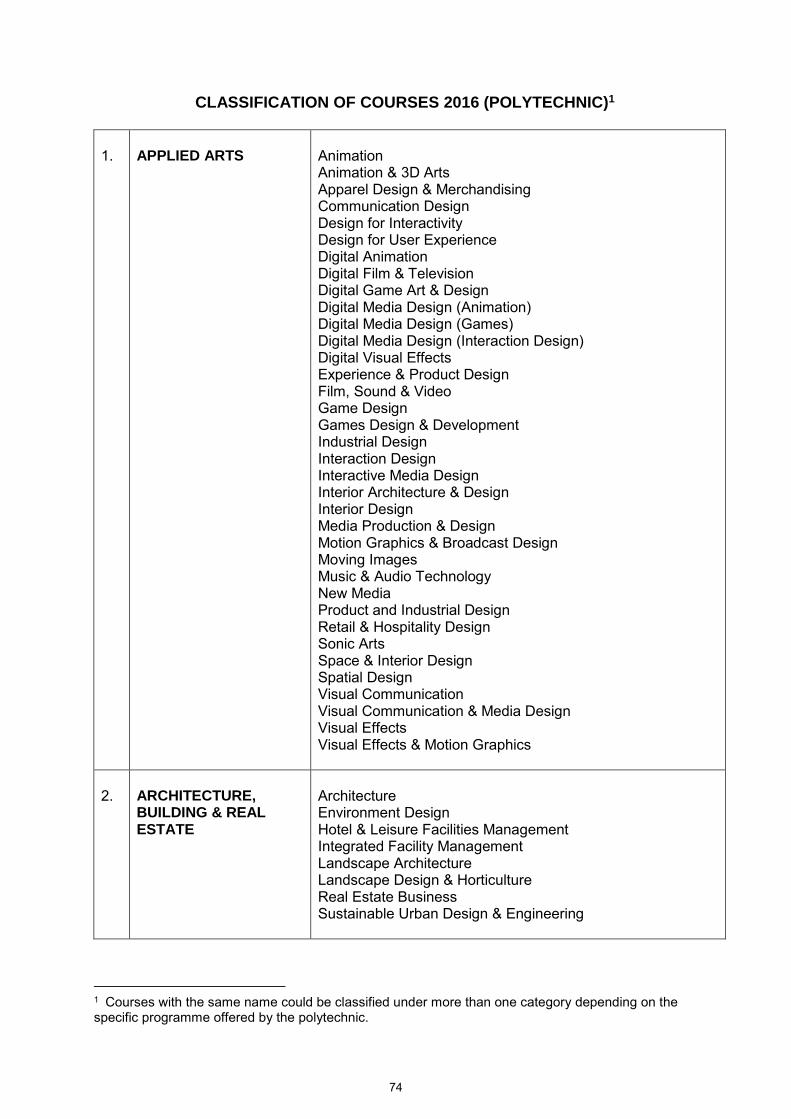
CLASSIFICATION OF COURSES 2016 (POLYTECHNIC)1
1.
APPLIED ARTS
Animation Animation & 3D Arts Apparel Design & Merchandising Communication Design Design for Interactivity Design for User Experience Digital Animation Digital Film & Television Digital Game Art & Design Digital Media Design (Animation) Digital Media Design (Games) Digital Media Design (Interaction Design) Digital Visual Effects Experience & Product Design Film, Sound & Video Game Design Games Design & Development Industrial Design Interaction Design Interactive Media Design Interior Architecture & Design Interior Design Media Production & Design Motion Graphics & Broadcast Design Moving Images Music & Audio Technology New Media Product and Industrial Design Retail & Hospitality Design Sonic Arts Space & Interior Design Spatial Design Visual Communication Visual Communication & Media Design Visual Effects Visual Effects & Motion Graphics
2.
ARCHITECTURE, BUILDING & REAL ESTATE
Architecture Environment Design Hotel & Leisure Facilities Management Integrated Facility Management Landscape Architecture Landscape Design & Horticulture Real Estate Business Sustainable Urban Design & Engineering
1 Courses with the same name could be classified under more than one category depending on the specific programme offered by the polytechnic.
74
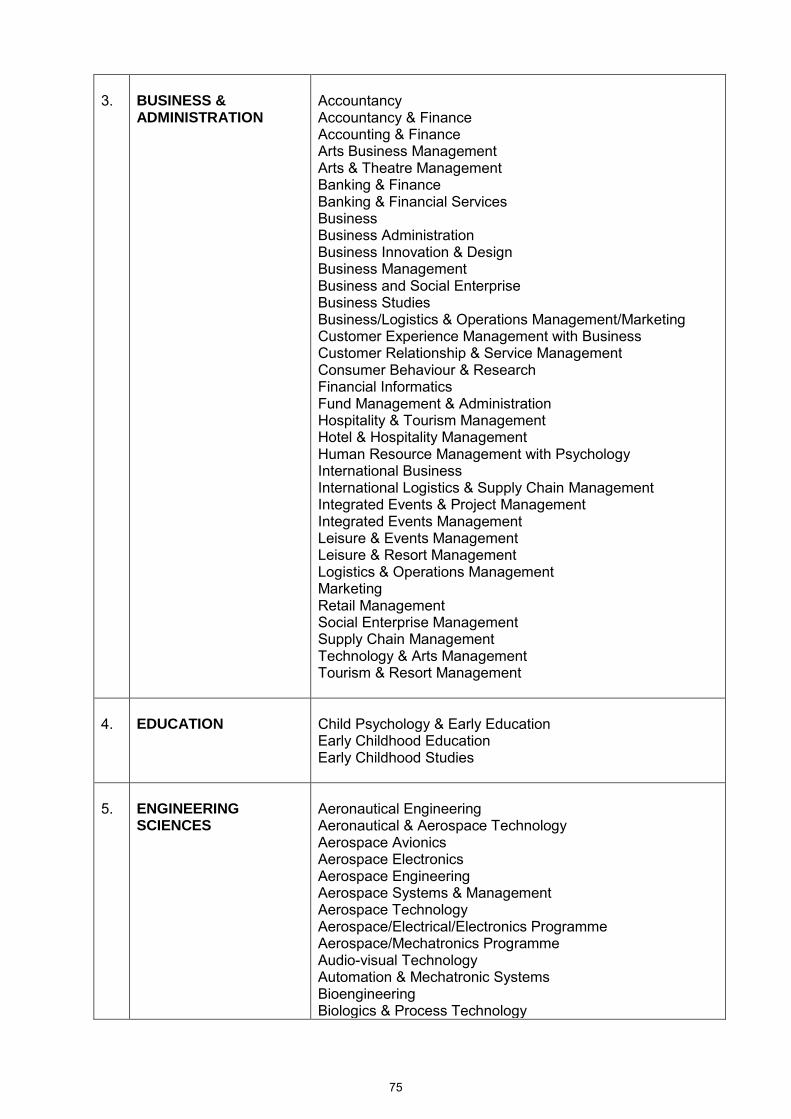
3.
BUSINESS & ADMINISTRATION
Accountancy Accountancy & Finance Accounting & Finance Arts Business Management Arts & Theatre Management Banking & Finance Banking & Financial Services Business Business Administration Business Innovation & Design Business Management Business and Social Enterprise Business Studies Business/Logistics & Operations Management/Marketing Customer Experience Management with Business Customer Relationship & Service Management Consumer Behaviour & Research Financial Informatics Fund Management & Administration Hospitality & Tourism Management Hotel & Hospitality Management Human Resource Management with Psychology International Business International Logistics & Supply Chain Management Integrated Events & Project Management Integrated Events Management Leisure & Events Management Leisure & Resort Management Logistics & Operations Management Marketing Retail Management Social Enterprise Management Supply Chain Management Technology & Arts Management Tourism & Resort Management
4.
EDUCATION
Child Psychology & Early Education Early Childhood Education Early Childhood Studies
5.
ENGINEERING SCIENCES
Aeronautical Engineering Aeronautical & Aerospace Technology Aerospace Avionics Aerospace Electronics Aerospace Engineering Aerospace Systems & Management Aerospace Technology Aerospace/Electrical/Electronics Programme Aerospace/Mechatronics Programme Audio-visual Technology Automation & Mechatronic Systems Bioengineering Biologics & Process Technology
75
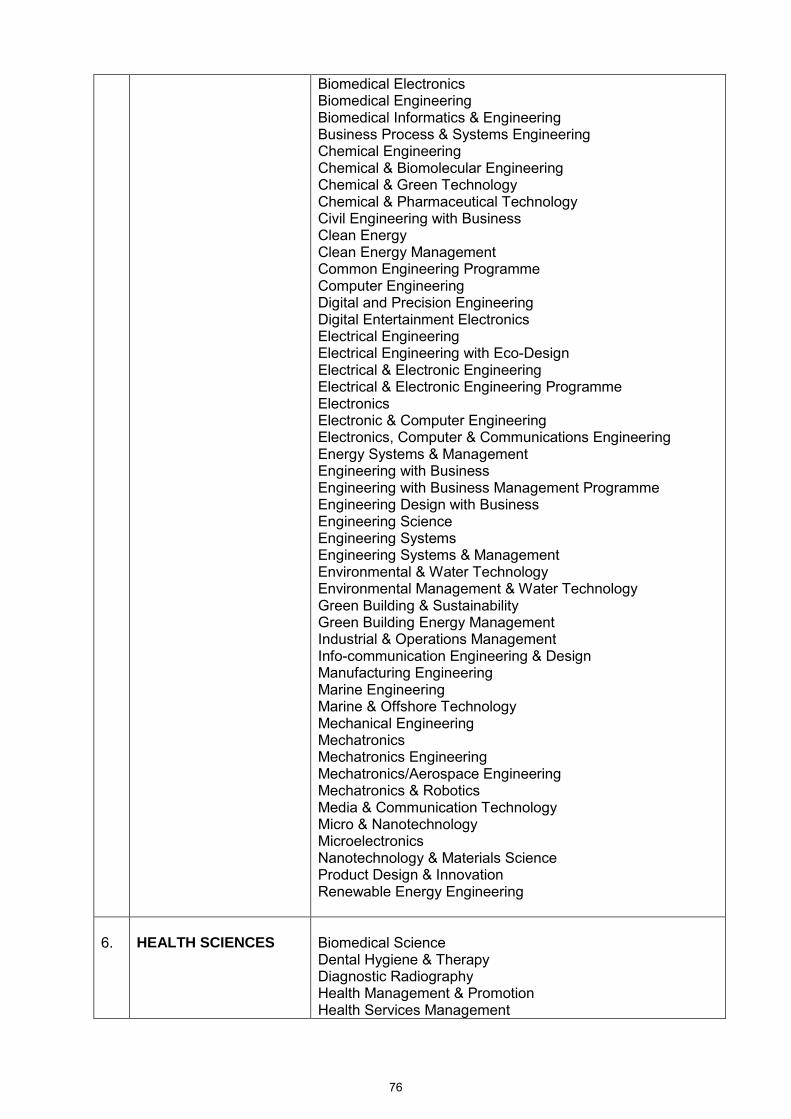
Biomedical Electronics Biomedical Engineering Biomedical Informatics & Engineering Business Process & Systems Engineering Chemical Engineering Chemical & Biomolecular Engineering Chemical & Green Technology Chemical & Pharmaceutical Technology Civil Engineering with Business Clean Energy Clean Energy Management Common Engineering Programme Computer Engineering Digital and Precision Engineering Digital Entertainment Electronics Electrical Engineering Electrical Engineering with Eco-Design Electrical & Electronic Engineering Electrical & Electronic Engineering Programme Electronics Electronic & Computer Engineering Electronics, Computer & Communications Engineering Energy Systems & Management Engineering with Business Engineering with Business Management Programme Engineering Design with Business Engineering Science Engineering Systems Engineering Systems & Management Environmental & Water Technology Environmental Management & Water Technology Green Building & Sustainability Green Building Energy Management Industrial & Operations Management Info-communication Engineering & Design Manufacturing Engineering Marine Engineering Marine & Offshore Technology Mechanical Engineering Mechatronics Mechatronics Engineering Mechatronics/Aerospace Engineering Mechatronics & Robotics Media & Communication Technology Micro & Nanotechnology Microelectronics Nanotechnology & Materials Science Product Design & Innovation Renewable Energy Engineering
6.
HEALTH SCIENCES
Biomedical Science Dental Hygiene & Therapy Diagnostic Radiography Health Management & Promotion Health Services Management
76
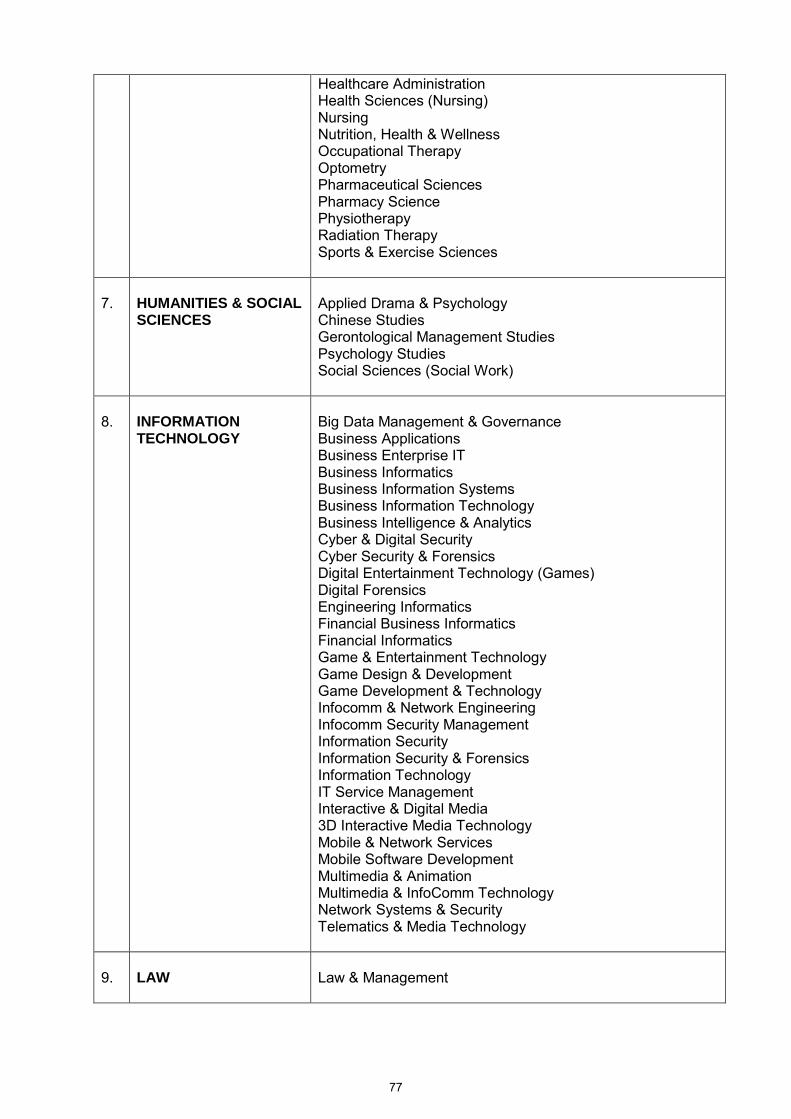
Healthcare Administration Health Sciences (Nursing) Nursing Nutrition, Health & Wellness Occupational Therapy Optometry Pharmaceutical Sciences Pharmacy Science Physiotherapy Radiation Therapy Sports & Exercise Sciences
7.
HUMANITIES & SOCIAL SCIENCES
Applied Drama & Psychology Chinese Studies Gerontological Management Studies Psychology Studies Social Sciences (Social Work)
8.
INFORMATION TECHNOLOGY
Big Data Management & Governance Business Applications Business Enterprise IT Business Informatics Business Information Systems Business Information Technology Business Intelligence & Analytics Cyber & Digital Security Cyber Security & Forensics Digital Entertainment Technology (Games) Digital Forensics Engineering Informatics Financial Business Informatics Financial Informatics Game & Entertainment Technology Game Design & Development Game Development & Technology Infocomm & Network Engineering Infocomm Security Management Information Security Information Security & Forensics Information Technology IT Service Management Interactive & Digital Media 3D Interactive Media Technology Mobile & Network Services Mobile Software Development Multimedia & Animation Multimedia & InfoComm Technology Network Systems & Security Telematics & Media Technology
9.
LAW
Law & Management
77
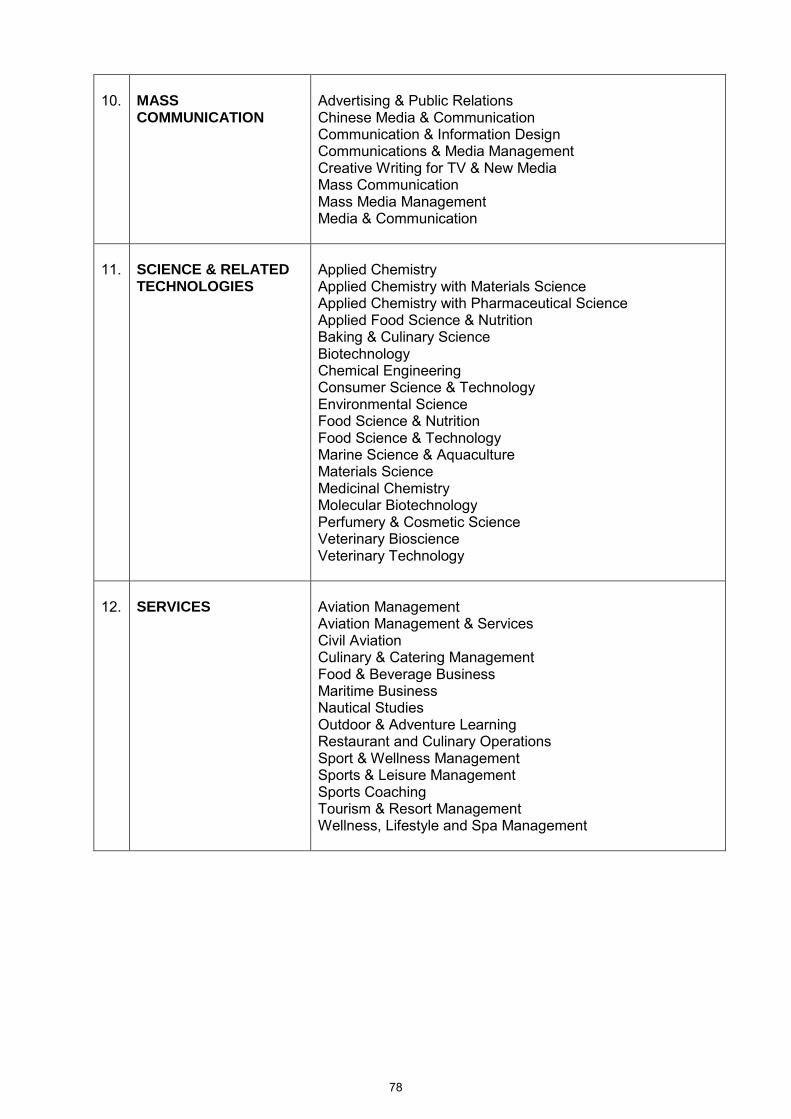
10.
MASS COMMUNICATION
Advertising & Public Relations Chinese Media & Communication Communication & Information Design Communications & Media Management Creative Writing for TV & New Media Mass Communication Mass Media Management Media & Communication
11.
SCIENCE & RELATED TECHNOLOGIES
Applied Chemistry Applied Chemistry with Materials Science Applied Chemistry with Pharmaceutical Science Applied Food Science & Nutrition Baking & Culinary Science Biotechnology Chemical Engineering Consumer Science & Technology Environmental Science Food Science & Nutrition Food Science & Technology Marine Science & Aquaculture Materials Science Medicinal Chemistry Molecular Biotechnology Perfumery & Cosmetic Science Veterinary Bioscience Veterinary Technology
12.
SERVICES
Aviation Management Aviation Management & Services Civil Aviation Culinary & Catering Management Food & Beverage Business Maritime Business Nautical Studies Outdoor & Adventure Learning Restaurant and Culinary Operations Sport & Wellness Management Sports & Leisure Management Sports Coaching Tourism & Resort Management Wellness, Lifestyle and Spa Management
78
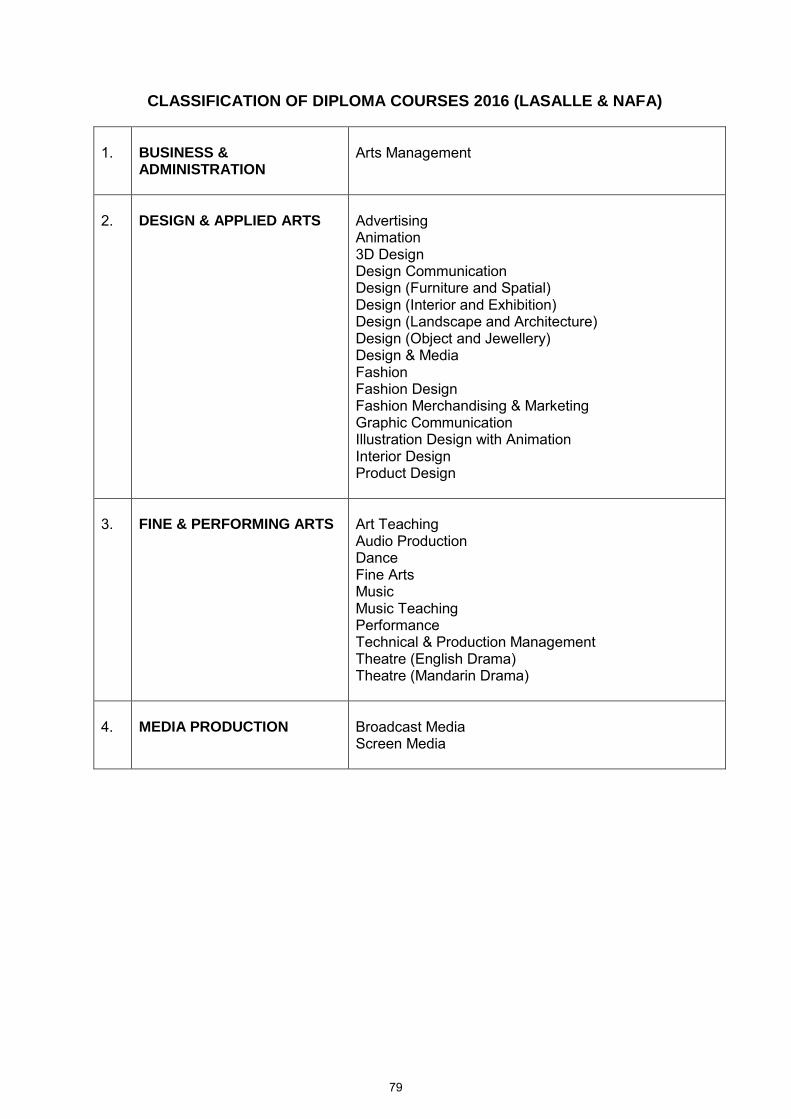
CLASSIFICATION OF DIPLOMA COURSES 2016 (LASALLE & NAFA) 1.
BUSINESS & ADMINISTRATION
Arts Management
2.
DESIGN & APPLIED ARTS
Advertising Animation 3D Design Design Communication Design (Furniture and Spatial) Design (Interior and Exhibition) Design (Landscape and Architecture) Design (Object and Jewellery) Design & Media Fashion Fashion Design Fashion Merchandising & Marketing Graphic Communication Illustration Design with Animation Interior Design Product Design
3.
FINE & PERFORMING ARTS
Art Teaching Audio Production Dance Fine Arts Music Music Teaching Performance Technical & Production Management Theatre (English Drama) Theatre (Mandarin Drama)
4.
MEDIA PRODUCTION
Broadcast Media Screen Media
79
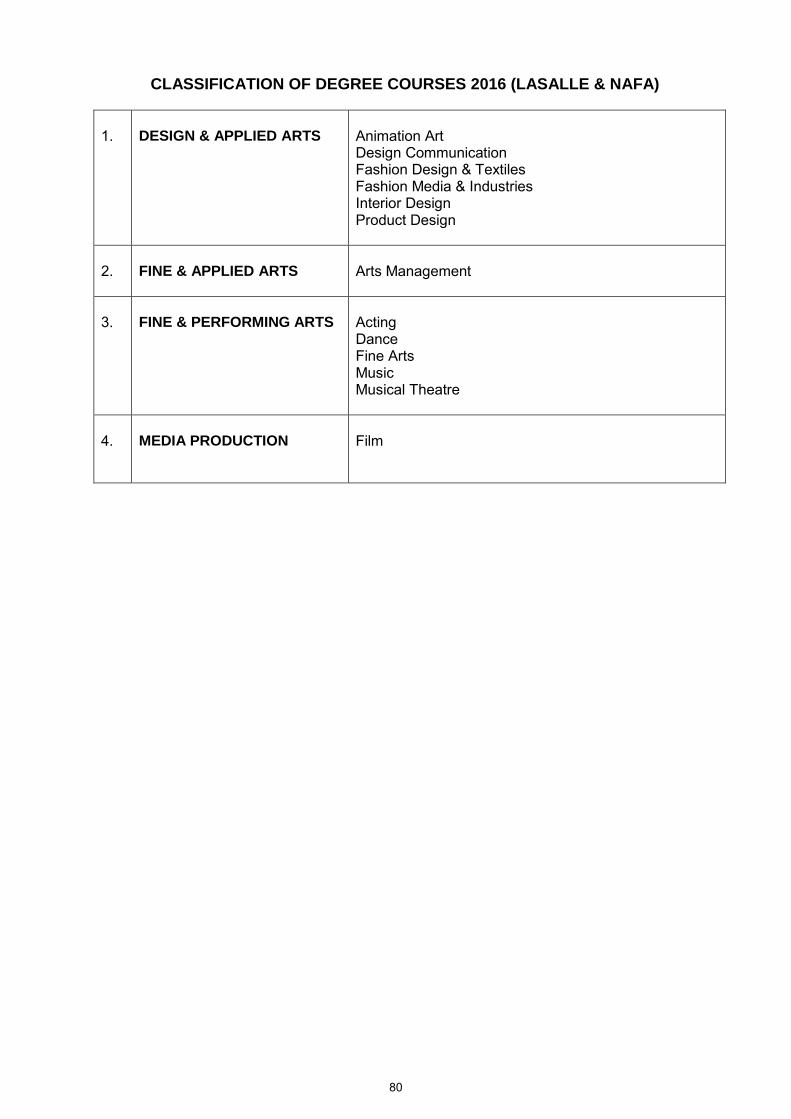
CLASSIFICATION OF DEGREE COURSES 2016 (LASALLE & NAFA) 1.
DESIGN & APPLIED ARTS
Animation Art Design Communication Fashion Design & Textiles Fashion Media & Industries Interior Design Product Design
2.
FINE & APPLIED ARTS
Arts Management
3.
FINE & PERFORMING ARTS
Acting Dance Fine Arts Music Musical Theatre
4.
MEDIA PRODUCTION
Film
80
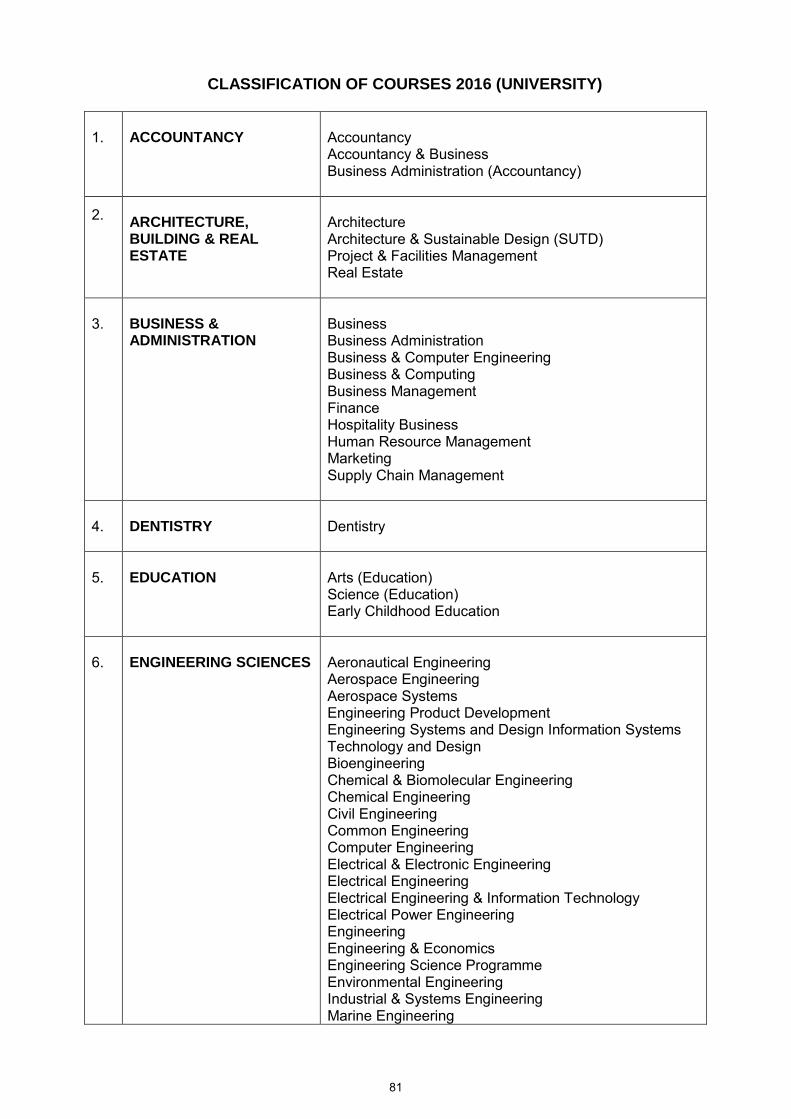
CLASSIFICATION OF COURSES 2016 (UNIVERSITY)
1.
ACCOUNTANCY
Accountancy Accountancy & Business Business Administration (Accountancy)
2. ARCHITECTURE, BUILDING & REAL ESTATE
Architecture Architecture & Sustainable Design (SUTD) Project & Facilities Management Real Estate
3.
BUSINESS & ADMINISTRATION
Business Business Administration Business & Computer Engineering Business & Computing Business Management Finance Hospitality Business Human Resource Management Marketing Supply Chain Management
4.
DENTISTRY
Dentistry
5.
EDUCATION
Arts (Education) Science (Education) Early Childhood Education
6.
ENGINEERING SCIENCES
Aeronautical Engineering Aerospace Engineering Aerospace Systems Engineering Product Development Engineering Systems and Design Information Systems Technology and Design Bioengineering Chemical & Biomolecular Engineering Chemical Engineering Civil Engineering Common Engineering Computer Engineering Electrical & Electronic Engineering Electrical Engineering Electrical Engineering & Information Technology Electrical Power Engineering Engineering Engineering & Economics Engineering Science Programme Environmental Engineering Industrial & Systems Engineering Marine Engineering
81
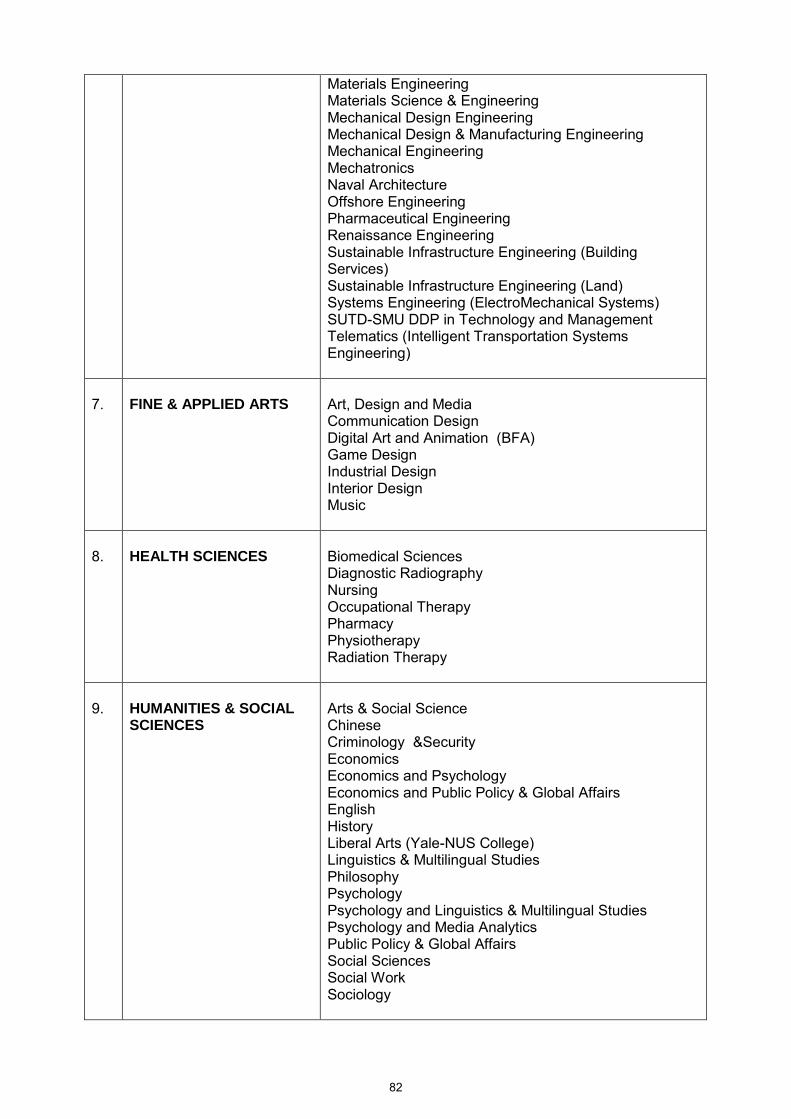
Materials Engineering Materials Science & Engineering Mechanical Design Engineering Mechanical Design & Manufacturing Engineering Mechanical Engineering Mechatronics Naval Architecture Offshore Engineering Pharmaceutical Engineering Renaissance Engineering Sustainable Infrastructure Engineering (Building Services) Sustainable Infrastructure Engineering (Land) Systems Engineering (ElectroMechanical Systems) SUTD-SMU DDP in Technology and Management Telematics (Intelligent Transportation Systems Engineering)
7.
FINE & APPLIED ARTS
Art, Design and Media Communication Design Digital Art and Animation (BFA) Game Design Industrial Design Interior Design Music
8.
HEALTH SCIENCES
Biomedical Sciences Diagnostic Radiography Nursing Occupational Therapy Pharmacy Physiotherapy Radiation Therapy
9.
HUMANITIES & SOCIAL SCIENCES
Arts & Social Science Chinese Criminology &Security Economics Economics and Psychology Economics and Public Policy & Global Affairs English History Liberal Arts (Yale-NUS College) Linguistics & Multilingual Studies Philosophy Psychology Psychology and Linguistics & Multilingual Studies Psychology and Media Analytics Public Policy & Global Affairs Social Sciences Social Work Sociology
82

10.
INFORMATION TECHNOLOGY
Business Analytics Computer Science Computer Science and Game Design Computer Science in Real-Time Interactive Simulation Computing Computing Science Information and Communications Technology (Information Security) Information and Communications Technology (Software Engineering) Information Engineering & Media Information Systems Management
11.
LAW
Graduate LL.B. Programme Law
12.
MASS COMMUNICATION
Communication Studies
13.
MEDICINE
Medicine Bachelor of Medicine & Bachelor of Surgery
14.
NATURAL, PHYSICAL & MATHEMATICAL SCIENCES
Applied Science Biological Sciences Chemistry & Biological Chemistry Environmental Earth Systems Science Environmental Studies (Bio) Environmental Studies (Geog) Food & Human Nutrition Food Technology [Sit - Massey Joint Degree] Mathematics & Economics Mathematical Sciences Physics & Applied Physics Science
15.
SERVICES
Culinary Arts Management Maritime Studies Sport Science & Management
83

Produced byManagement Information Branch
Research and Management Information Division
Ministry of Education Singapore
ISSN 0218-1134