Embed Size (px)
Citation preview

Master thesis in Technology
University of Turku
Department of Biochemistry
Master’s Degree Programme in Food Development
11/2017
Outi Paananen
Effects of Changes in Production on Stability
of Mayonnaise

The originality of this thesis has been checked in accordance with the University of Turku
quality assurance system using the Turnitin OriginalityCheck service.

UNIVERSITY OF TURKU
Department of Biochemistry
PAANANEN, OUTI: Effects of Changes in Production on
Stability of Mayonnaise
Master´s thesis in Technology, 46 p., 0 appendix pages
Food Development
November 2017
___________________________________________________
Effects of Changes in Production on Stability of Mayonnaise
The main aim in this study is to investigate the stability and quality of mayonnaise
products with special emphasis on how the changes in production affect the stability and
quality of mayonnaise products. The main focus is to analyze the mayonnaise samples
with selected analysis to understand effects on the changes in production. Mayonnaises
are produced by Saarioinen Oy in Huittinen. Mayonnaises are analyzed fresh and after
2-week incubation in 37 °C.
The analysis used in this work study the oxidation products: peroxide value, anisidine
value and the acid value, chemical structure of fatty acids: gas chromatography,
physical structure of the samples: rheology measurements: viscosity, thixotropic and
oscillatory measurements. To support the analysis and measurements sensory
evaluations are carried out to link the instrumental analyses to sensory changes.
The main results in this study is that the changes in production did not affect the
mayonnaises much. The biggest difference between the samples were the oxidation
level of the incubated samples compared to fresh samples. The oxidation level in
incubated samples after the changes in production were lower than in the mayonnaises
made before the production changes. In conclusion the mayonnaises can be produced
with different techniques to achieve the nearly same quality mayonnaise.
Keywords: mayonnaise, stability, fatty acids, oxidation, rheology, sensory quality

Contents
1 Introduction.............................................................................................................. 1
1.1 What is mayonnaise? ....................................................................................... 1
1.2 Production of mayonnaise ............................................................................... 3
1.3 Oxidation ......................................................................................................... 5
1.4 Raw materials effecting the stability and quality of mayonnaise .................... 8
1.4.1 Emulsifying and thickening agents ....................................................... 8
1.4.2 Raw materials effecting the stability ................................................... 11
1.5 Rheology ........................................................................................................ 13
1.6 Aim of the practical work .............................................................................. 15
2 Materials and methods ........................................................................................... 16
2.1 Acid, anisidine and peroxide value ................................................................ 16
2.2 Fatty acid composition ................................................................................... 18
2.3 Rheology measurements ................................................................................ 19
2.4 Sensory analysis ............................................................................................. 20
3 Results and Discussion .......................................................................................... 22
3.1 Fatty Acid Composition ................................................................................. 22
3.2 Acid, anisidine and peroxide value ................................................................ 26
3.3 Rheology analysis .......................................................................................... 28
3.4 Sensory analysis ............................................................................................. 34

4 Conclusions ........................................................................................................... 42
Abbreviations
BHA: butylated hydroxy anisole
BHT: butylated hydroxy toluene
BTEM: boron trifluoride-catalyzed esterification method
C: chitosan
C:D: number of carbon atoms and double bonds in fatty acid
E1: emulsion sample 1
E2: emulsion sample 2
E3: emulsion sample 3
E4: emulsion sample 4
E160a: beta carotene
E202: potassium sorbate
E412: guar gum
E415: xanthan gum
EDTA: ethylene diaminotetraacetic acid
EOs: essential oils
F: freshly analyzed mayonnaise
FE: fenugreek extract
GC: gas chromatography
GOX: glucose oxidase

GP: ginger powder
GSE: grape seed extract
L: lactoferrin
LC: lycopene crystals
LM: light mayonnaise
M: mustard
MD: mayonnaise dressing
N: novel technique production line
P: functional production line
PCHE: purple corn husk extract
R: mayonnaise analyzed after incubation
RE: rosemary extracts
SS: sesame sprouts
TBHQ: tertbutylhydroquinon
TE: tansy extracts
TM: traditional mayonnaise
TP: tocopherol
YPM: yellow powder mustard

1
1 Introduction
In this Master thesis, the stability and quality of mayonnaise will be studied through
chemical and physical properties of mayonnaise. The chemical properties study the lipid
structure and the oxidational changes in mayonnaise. Physical properties study the
viscosity and other rheological features of the mayonnaise. This study is interested in the
differences between different types of mayonnaises and how different ingredients affect
the emulsion in mayonnaise and furthermore how the stability and quality will change
during the shelf life. This study consists of three different types of mayonnaises:
traditional and low-fat mayonnaise and mayonnaise dressing made with novel technique
by Saarioinen Oy, Huittinen. Comparison samples are the same mayonnaises made with
functional production line in Saarioinen Oy, Huittinen. Mayonnaises from both processes
are analyzed fresh and after 2 weeks of incubation in 37 °C. This study does not observe
or take a position on the nutritional values of mayonnaise.
1.1 What is mayonnaise?
Mayonnaise is a thick creamy sauce that contains vegetable oil, acidic component (e.g.
acetic acid), egg yolk (contains a natural emulsifier — egg lecithin), sugar, salt and spices
and other emulsifying and thickening agents (modified starch, guar gum and xanthan gum
used most commonly). Mayonnaise contains traditionally 70-80 % fat. Due to the
consumers’ preferences, majority of the mayonnaise products on the market are low-fat
mayonnaises. Low-fat mayonnaises have fat content around 20-40 %. Having
substantially lower fat content fat-replacers also known as emulsifying and thickening
agents are widely used to create the characteristic thick and creamy consistency of
mayonnaise with lower fat. But how the characteristic consistency of the mayonnaise is
possible to achieve? (Depree and Savage 2001; Yildirim, Sumnu, and Sahin 2016; Saarela
et al. 2010)
Mayonnaise is an emulsion, this gives mayonnaise its characteristic consistency, without
emulsion formation the consistency of mayonnaise is impossible to achieve. Mayonnaise,
despite the fact it can have very high oil content, is an oil-in-water emulsion. An oil-in-
water emulsion has two phases: water as continuous phase and oil as dispersed phase. An
oil-in-water emulsion is formed by mixing the emulsifying and thickening agents, acidic
component and flavoring agents together and then slowly blending in the oil. The

2
emulsion formed consists of a closely packed foam of oil droplets. Ideally the emulsion
consists of spherical droplets of dispersed phase packed together in continuous phase.
The dispersed phase can account for a maximum of 74 % of the total volume of the
mayonnaise to keep the shape of the droplets spherical. But in mayonnaise the dispersed
phase may account for 75 % or more of the total volume. This will cause formation of the
honeycomb structure of closely packed and often distortion of the droplets from their
normal spherical shape (Figure.1).
This close packing of the droplets allows them to interact very strongly with one another.
The combination of these interactions gives mayonnaise its high viscosity. In fact, the
viscoelasticity of mayonnaise reaches a maximum very quickly after preparation. This
rapid viscoelasticity is mainly due to the flocculation of adjacent oil droplets. Flocculation
of oil droplets forms a network, basically a weak gel. The strength of these interactions
between the oil droplets depends on the Van der Waals attractions which are balanced to
some extent by electrostatic and steric repulsion. The quality of the emulsion will depend
on the right balance between these forces. If the attraction is too strong it will pull the
droplets together causing the aqueous phase to be squeezed out and promoting
coalescence of the droplets. And if the repulsion is too strong it will allow the droplets to
slip easily past one another. This will produce an emulsion with low viscosity and prone
to “creaming” as the oil droplets settle into their minimum volume allowing the water to
drain out. This basic structure of mayonnaise can be achieved using egg yolk as an
ingredient as egg yolk contains lecithin. Other emulsifiers and thickening agents will help
with the formation of the structure and strengthen it. These are discussed further later.
But eventually mayonnaise will break as oil droplets coalesce and the distribution of oil
droplets changes. There are fewer, larger oil droplets which leads to the separation of the
phases of the mayonnaise. (Depree and Savage 2001; Heertje 2014; Dickinson 2013)

3
Figure 1. Distorted oil droplets in honeycomb structure in mayonnaise by confocal
scanning laser microscopy. (Heertje 2014)
1.2 Production of mayonnaise
Production of mayonnaise consists of two types of processes: batch and continuous
process (Figure 2). These processes can be divided into cold and semi-hot processes. In
cold process the entire process (mixing of ingredients, emulsion formation during
homogenization) and the packing of the product are carried out in cold conditions, at the
most in room temperature. In the semi-hot process, the microbiologically sensitive
ingredients (water, spices) are pasteurized in approximately 80 °C for couple of minutes
and cooled down. The rest of the semi-hot process is like cold process because the
homogenization requires low temperature in order to form stable emulsion. (Saarela et al.
2010)

4
Figure 2. Process charts of mayonnaise production with the semi-hot process. A.
Example of batch process. B. Example of continuous process. A and B similar with cold
process but without the pasteurization. (Saarela et al. 2010)

5
Production of mayonnaise is mostly done by high shear or high-speed mixers. The first
step in mayonnaise production whether it is batch or continuous process is the dissolving
water soluble raw materials (e.g. sugar, salt and food preservatives) to water. In semi-hot
process this mixture is pasteurized before, cold process does not include any heating.
After the possible pasteurization, the lipid phase or egg and other emulsifying and
thickening agents mixed with small amount of oil and are added separately. Next the rest
of the oil is slowly added under vigorous stirring. In this stage the oil-in-water emulsion
is created. Last of the raw materials (e.g. vinegar, mustard and spices) are mixed in the
emulsion. In mayonnaise production, the order of addition of raw materials is reasonably
the same in batch and continuous process. Some differences can be in the order of addition
of raw materials. But significant difference in continuous process compared to batch
process is that it is usually fully automated system. This gives the design stage of the
equipment key role because from start to finish the production is automated to follow the
program set. And therefore, variations cannot be made during the production. The raw
materials are added through feeding pumps automatically. In batch process, some parts
of the process can be automated. Still batch process is normally more flexible since the
raw material can be either pumped automatically or added to the mixing tank before or
after the homogenization. (Kerkhofs et al. 2011; Saarela et al. 2010)
1.3 Oxidation
Lipid oxidation is main cause for food spoilage for all the fat containing foods. It also
causes the generation of off-flavors and off-odors, these are described as rancid. This
causes the quality and stability of mayonnaise to weaken due to spoilage through auto-
oxidation of the unsaturated and polyunsaturated fats in the oil in mayonnaise. There are
three phases to auto-oxidation: initiation, propagation and termination. In the initiation
phase, external energy, e.g. light, acts on the unsaturated fat in presence of catalyst, e.g.
heavy metal ions, to produce free radicals. In the propagation phase the free radicals react
with molecular oxygen to form peroxide radicals, the primary oxidation products. This
leads to formation of more free radicals or decomposition into aldehydes, ketones,
alcohols, hydrocarbons, volatile organic acids and epoxy compounds, the secondary
oxidation products. In the termination phase when the concentration of reactive
compounds reaches a sufficient level they react together to form stable compounds which
give the product its characteristic rancid flavor. Auto-oxidation can be speeded up at high

6
temperature and is more rapid in mayonnaise because the oil in mayonnaise contains
polyunsaturated fatty acids. (Depree and Savage 2001; Ghorbani Gorji et al. 2016;
Campbell-Platt and International Union of Food Science and Technology 2009)
Antioxidants are substances that can retard this oxidation process of lipids. The
antioxidants can be synthetic or natural antioxidants. The synthetic antioxidants such as
butylated hydroxy toluene (BHT), butylated hydroxy anisole (BHA), tert-
butylhydroquinon (TBHQ) and ethylene diaminotetraacetic acid (EDTA) can prevent
rancidity. BHT and BHA are widely used antioxidants. But lately the growing trend is to
utilize antioxidants from natural sources. Some of these natural antioxidants are discussed
and studied in Table 1 by Ghorbani Gorgi et al.: gallic acid, ascorbic acid, tocopherol
(TP), lactoferrin (L), rosemary extracts (RE), phytic acid, mustard (M), lycopene crystals
(LC), ginger powder (GP), fenugreek extract (FE), black glutinous rice, grape seed extract
(GSE), essential oils (EOs) extracted from Carum copticum, chitosan (C), tansy extracts
(TE), clove, anthocyanin extracted from purple corn husk (PCHE), seaweed and glucose
oxidase (GOX). (Campbell-Platt and International Union of Food Science and
Technology 2009; Ghorbani Gorji et al. 2016)

7
Table 1. Antioxidants in different mayonnaises and the effects to the stability and quality
of the mayonnaise. (Ghorbani Gorji et al. 2016)
Product Antioxidant/pro-oxidant
(concentration)
Results
Mayonnaise (soy oil) GOX 450 U/kg: slowed down oxidation
reactions
Dijon mustard mayonnaise EDTA, RE, M Decreased photooxidative volatile
levels.
Mayonnaise (sunflower oil) L, propyl gallate, EDTA Only EDTA had strong antioxidant
effect.
Mayonnaise TBHQ, BHT, FE FE and TBHQ decreased lipid
oxidation. Are more effective than
BHT.
Mayonnaise (rapeseed oil) LC Slowed down the development of
off-flavor, off-odor, and color
changes.
Mayonnaise and salad
dressing (olive oil)
Natural spices and herbs such
as (parsley, ground black
pepper, basil and hot paprika)
and their extracts
With extracts better microbiological
and antioxidative quality.
Mayonnaise (rice bran oil) Oryzanol, Squalene, TP,
Tocotrienols
Enhanced the stability and balanced
fatty acid composition.
Mayonnaise (corn oil) GP Improved the oxidative stability.
Mayonnaise (rapeseed oil) GSE Improved the oxidative stability.
Mayonnaise (corn oil) Juice of basil leaves (JBL),
BHT
JBL reduced the oxidation process
of during 12 weeks of storage.
Mayonnaise (sunflower oil) EOs, BHA, BHT High concentration of EOs can
replace BHA and BHT.
Mayonnaise (soy oil) Yellow powder mustard
(YPM), paste mustard
YPM increased oxidative stability.
Mayonnaise C, EDTA Decreased the lipid oxidation
process of mayonnaises. C slowed
down the lipid oxidation process
during storage.
Mayonnaise (soy oil) TP, TBHQ TP decreased hydroperoxide
formation.
Mayonnaise TE TE increased oxidative stability.
Mayonnaise (soybean oil) PCHE, BHT, EDTA The antioxidative effect of PCHE
was higher than BHT and EDTA.
Mayonnaise Sesame sprouts (SS), EDTA,
BHT
SS powder decreased oxidation
during storage. Not good sensory
perception.
Mayonnaise (soybean oil) Eugenol-lean fraction
isolated from clove buds
Significantly higher antioxidant
activity than mustard mayonnaise.
Stable beyond 6 months.

8
One of the factors affecting lipid oxidation in mayonnaise is the chemical structure of
lipids. The susceptibility of lipid molecule to oxidation depends on the number and
location of the double bonds. Saturated lipids (containing no double bonds) are more
stable to lipid oxidation than unsaturated fats (containing 1 or more double bonds). But
the physical and sensory characteristics of the mayonnaise cannot be achieved by using
only saturated lipids instead of unsaturated lipids. (Ghorbani Gorji et al. 2016)
Lipid oxidation can be detected by sensory analysis as rancid smell and taste. Ghosh et
al. studied the rancid-acid removal by irradiation of virgin coconut oil. Semi-trained
panelists were selected to evaluate the oil samples and reference samples (copra flavor,
octanoic acid). Attributes such as appearance, color, odor, turbidity and homogeneity
were evaluated by using 9-point hedonic scale. This study found that irradiated oil
samples and non-irradiated samples remained both unchanged up to 28 days and had no
difference. Irradiating samples after 28 days it increased the acceptability of the oils. This
study gives some guide lines of oil rancidity. (Ghosh et al. 2016)
1.4 Raw materials effecting the stability and quality of mayonnaise
Raw materials in mayonnaise can have effect on the stability and quality of mayonnaise.
These raw materials can help to form the right balance between the interactions in
mayonnaise. But can also weaken the balance.
1.4.1 Emulsifying and thickening agents
Emulsifiers are small molecules with interfacial and surface physical chemistry
properties. This means that they also possess amphiphilic properties. These amphiphilic
properties are due to coexistence of lipophilic and hydrophilic properties in the same
molecule. Emulsifiers show the affinity to both polar and non-polar substances (Figure
3). Hydrophilic part will form a hydrogen bond with polar solvents such as water.
Simultaneously lipophilic part of emulsifying structure will be attracted to non-polar
surroundings such as hydrocarbon chains of glycerides or non-polar solvents.

9
Figure 3. The working mechanism of emulsifiers in oil-in-water (O/W) and water-in-oil
(W/O) emulsions.
Thickening agents are the most common food additives used to thicken the texture and
increase the viscosity of the food and drink products. Most common thickening agents
are starch and gum-based. (Norn 2014; Emerton and Choi 2008)
1.4.1.1 Egg yolk
Egg yolk has a complex structure. This structure can be divided into two main fractions:
non-soluble protein aggregates (also known as granules) and plasma that contains low-
density lipoproteins including lipovitellin, lipovitellinin and livetin and soluble proteins
(Figure 4). Egg yolk is emulsion itself when in liquid form.
The outstanding properties for forming the emulsion is mainly due to this complex
structure. Egg yolk also gives mayonnaise flocculation properties that improve the texture
of the emulsion. Phospholipid lecithin, proteins and lipoproteins: lipovitellin,

10
lipovitellinin and livetin are thought to be the most essential to the emulsion forming
properties of egg yolk. (Depree and Savage 2001; Anton 2013)
Figure 4. Nano and micro structure of egg yolk. (Anton 2013)
Egg yolk forms mainly used in food industry are pasteurized salted or sugared frozen egg
yolk and dried yolk. Because the superior emulsifying properties of egg yolk are due to
the structure, highly processed egg yolk has inferior properties compared to fresh egg
yolk. The pasteurization of egg yolk does not affect the emulsifying properties to excess,
unlike freezing or freeze-drying egg yolk. Mayonnaise made with egg yolk processed this
way contains larger oil droplets which means that the phases of mayonnaise separate more
easily. The reason for this is that when egg yolk is frozen below −6 °C an irreversible
gelation occurs. The gelation makes the egg yolk difficult to combine with other raw
materials and due to that it limits usefulness of the egg yolk. The most general accepted
method to limit the gelation of egg yolk is addition of 10 % salt or sugar. Frozen sugared
or salted egg yolk is relatively stable. Although freezing extended periods causes changes
in quality and functionality of egg yolk. (Depree and Savage 2001)
Besides the lecithin, the pH of the emulsion has an essential effect on the stability of the
emulsion. The viscoelasticity and stability of the mayonnaise should be highest when the
pH is close to the average isoelectric point of the egg yolk proteins. The viscoelasticity
was found to be highest at the pH of 3.9. (Depree and Savage 2001; Kiosseoglou and
Sherman 1983)
11
1.4.1.2 Other emulsifying and thickening agents
Xanthan gum, modified celluloses and galactomannans (guar and locust bean gum) are
the most commonly used thickeners in food industry. These polysaccharides are firm
polydisperse macromolecules with mainly hydrophilic character. The polysaccharides are
used for thickening and gelling of water phase in emulsion which in mayonnaise is the
continuous phase. The polysaccharides are under the technical label of hydrocolloids. The
physicochemical mechanism of each hydrocolloid is determined by the molecular
structure of the component carbohydrate polymer. (Dickinson 2013)
Xanthan gum is widely used for stabilizing particle suspensions and emulsions due to its
extremely high low-shear viscosity of water phase of low polymer content, approximately
1 g/kg. Xanthan traps and immobilizes oil droplets in the xanthan polymer network, which
forms an effective yield stress that is more than enough to overcome the buoyancy forces
acting on the individual droplets. Besides xanthan also starches are commonly used as
thickeners. Starch can be heat-induced gelatinization where starch granules produce
opaque thermoreversible gel on cooling. In addition, modified starch/cellulose has
capacity to function as emulsifiers due to the ability to absorb in oil-water interface. Also,
guar gum and some types of pectin has these properties. This surface activity has two
possible ways. In the first the nonpolar character of chemical groups attached to the
hydrophilic polysaccharide backbone, typical to hydrophobically modified
starch/cellulose. In the second the presence of a protein moiety the emulsifier is linked
covalently to the carbohydrate polymer, typical to guar gum and sugar beet pectin.
(Dickinson 2013)
1.4.2 Raw materials effecting the stability
Salt improves the quality and stability of the mayonnaise in three diverse ways. Firstly,
salt helps to disperse the egg yolk granules and make more surface-active material
available. Secondly, salt neutralizes any charges on proteins. This allows the lipovitellin
to absorb water and that strengthens the layer on the surface of the oil droplets. So, the
granules swell. Thirdly the neutralization of any charge allows adjacent oil droplets to
interact more strongly (Figure 5.) Earlier it was mentioned that pH 3.9 is the isoelectric
point of the egg yolk proteins. Yet adding salt can compensate the isoelectric point for

12
the pH values different to isoelectric point, but only to some extent. Salt can have
undesirable effects when used in excess. This will cause the egg yolk proteins to aggregate
in continuous phase rather than forming the coating on the oil droplet. (Depree and Savage
2001; Kiosseoglou and Sherman 1983)
Figure 5. Egg yolk components absorbed on adjacent oil droplets when salt is absent and
present. (Depree and Savage 2001)
The type of salt that best suits for these purposes has been studied. The highest effect on
the emulsifying properties is when egg yolk is salted with unionized NaCl. Mayonnaise
made with unionized NaCl salted egg yolk showed higher stability, viscosity and firmer
emulsion when assessed by measuring the tendency to spread under its own weight
compared to ionized NaCl or KCl salted egg yolk. This is due to effect of ions in water
interactions. Small Na+-ions have high electric field that tends to promote interactions
between water molecules to form structures. Also, polyvalent ions affect similarly. This
increases viscosity of emulsions. Unlike large monovalent ions (K+,I−, Cl−) that tend to
disrupt these water interactions. (Harrison and Cunningham 1986; Depree and Savage
2001)

13
Sucrose can weaken the interactions in emulsion. This is probably due to the shielding of
reactive groups. This prevents egg white proteins and charged carbohydrates such as
carboxylmethyl cellulose from interacting with egg white proteins and effectively
forming cross-links between oil droplets. Although Huck-Iriart, Candal and Herrera also
find that sucrose in a presence with sodium caseinate increases the emulsion stability.
Strong protein-sugar of interactions modify the structure of the emulsion by decreasing
the droplet size which then increases the stability of the emulsion. (Depree and Savage
2001; Huck-Iriart, Candal, and Herrera 2011)
Mustard increases the stability of emulsion. The flavor is formed by volatile sulphur
compounds, these compounds are soluble in oil and slightly soluble in water. Therefore,
mustard can act as emulsifying agent. Mustard has also antioxidant effect of mayonnaise.
Studies show that mayonnaise containing mustard has longer shelf-life than mayonnaise
without mustard. This is due to the conjugated dienes. In mayonnaise containing mustard
the number of conjugated dienes was increasing slower and the mayonnaise contains less
conjugated dienes than mayonnaise without mustard. (Depree and Savage 2001; Lagunes-
Galvez et al. 2002; Ghorbani Gorji et al. 2016)
1.5 Rheology
Rheological measurements are useful tools for physical characterization of foods such as
gels and emulsions. Rheological measurements of emulsions provide information about
the physical properties and their behavior under different conditions. Furthermore,
differences in physical properties and behavior of similar products can be analyzed and
compared e.g. traditional mayonnaise and light mayonnaise. According to Tabilo-
Munizaga and Barbosa-Cánovas light mayonnaise has slightly longer viscoelastic regions
under strain in stress sweep analysis. Also, the results of this analysis indicate that
traditional mayonnaise has more stable structure than light mayonnaise even though
traditional mayonnaise can show phase separation during storage. When the mayonnaises
where compared in yield stress analysis, the results suggest that the traditional
mayonnaise can be pumped easier than light mayonnaise. However, the flow behavior in
both mayonnaises indicates a uniformity of the microstructure. The study by Wendin and
Hall indicates that fat content affects the properties of salad dressings the most. Also, the
viscosity of the salad dressings increased when the fat and thickener contents increase.

14
Also, Peressini, Sensidoni and de Cindio studied the rheological differences between four
different emulsions in Table 2 with determined nutritional values.
Table 2. Characteristics of emulsion samples (E1, E2, E3, E4) in previous study by
Peressini, Sensidoni and de Cindio (Peressini, Sensidoni, and de Cindio 1998).
To distinguish differences between the four emulsion samples oscillatory test was
conducted. The results show that emulsion samples with higher fat content (E1, E2) are
more elastic than the samples with lower fat content (E4). Emulsion sample 3 showed
higher elasticity than E2 although it had lower fat content than E2. This was due to higher
carbohydrate content. The reduction of fat was balanced with increasing carbohydrates,
this gives E3 its high elastic behavior. Even though E3 is highly elastic it has also the
highest viscous behavior after mechanical stirring so it is the most sensible to
deformation. The most stable of the samples was sample E1. Emulsifying and thickening
agents also affect the stability of the emulsion. Yildirim, Sumnu and Sahin studied how
the change in emulsifying and thickening agents (sodium caseinate, xanthan gum and
lecithin-whey protein concentrate) affect the stability. They found sodium caseinate to be
the most effective emulsifying and thickening agent. In the presence of sodium caseinate
the stability and viscosity of the double-emulsified mayonnaise increased while its
particle size decreased. This reduction in particle size in known to improve the rheological
properties of double mayonnaise. Rheological measurements can analyze e.g. viscoelastic
Nutritional values E1 E2 E3 E4
Fat
(g per 100 ml)
76.2 68.6 63.4 48.0
Carbohydrate
(g per 100 ml)
0.5 1.0 3.3 8.7
Protein
(g per 100 ml)
1.3 1.3 1.4 1.0
Ash
(g per 100 g)
1.5 1.1 1.1 3.4
Moisture
(g per 100 g)
16.6 24.9 27.9 42.3
Water activity 0.97 0.97 0.97 0.96
pH 3.9 4.0 4.0 3.7

15
properties, structural differences and stability of the emulsions by measuring shear
behavior. (Peressini, Sensidoni, and de Cindio 1998; Wendin and Hall 2001; Tabilo-
Munizaga and Barbosa-Cánovas 2005; Yildirim, Sumnu, and Sahin 2016; Mezger 2011)
1.6 Aim of the practical work
The main aim of the work is to investigate the stability and quality of mayonnaise
products with special emphasis on how the changes in production affect the stability and
quality of mayonnaise products. The goal is to produce nearly identical mayonnaises
regardless of the process. The main focus is to analyze the mayonnaise samples with
selected analysis (fatty acid composition, acid value, peroxide value, anisidine value and
rheological measurements) to understand effects on the changes in production.
Mayonnaises are produced by Saarioinen Oy in Huittinen.

16
2 Materials and methods
Three mayonnaise samples are produced with the novel technique production line (N)
and compared to the same mayonnaises produced with functional production line (P)
which uses different production method in Saarioinen Oy, Huittinen. Mayonnaise
samples are traditional mayonnaise (TM), light mayonnaise (LM) and mayonnaise
dressing (MD). TM contains oil (75 %), water, egg yolk, vinegar, sugar, salt, mustard
powder, thickening agent (E415), preservative (E202) and coloring agent (E160a). LM
contains water, oil (30 %), vinegar, egg yolk, sugar, modified cornstarch, salt, mustard
powder, thickening agents (E415, E412), preservative (E202), citrus aroma and coloring
agent (E160a). MD contains water, oil (27 %), sugar, vinegar, mustard seeds, modified
cornstarch, salt, thickening agents (E415, E412) and preservative (E202). The major
differences between these samples are the amount of oil used and the emulsifying and
thickening agents used (egg yolk versus other emulsifying and thickening agents
modified cornstarch, E415 and E412). After the production of all the mayonnaises, from
both production lines N and P, were analyzed fresh (F) and after 2 weeks of incubation
in 37 °C (R). Together 12 different samples 6 from each process.
For sensory evaluation and rheological measurements mayonnaise samples did not
require any pretreatments and the samples were stored in refrigerator. For the mayonnaise
samples used in chemical analysis, acid, peroxide and anisidine values and fatty acid
composition, the oil was required to be separated from the mayonnaises. The samples
were centrifugated to separate the oil from the mayonnaise. First the mayonnaise samples
were stored in freezer in falcon tubes. The samples were thawed in cold water bath. After
thawing the samples, the mass of the falcon tubes was balanced with the precision of 0.1
g. The samples were centrifuged with Sorvall TC centrifuge for 15 minutes with G-value
of 4 500. The separated oil phase was pipetted into empty falcon tube.
2.1 Acid, anisidine and peroxide value
The acid value was determined according to Nordic Committee on Food Analysis Method
No. 38, 4th Edition 2001 to analyze the free fatty acids in the separated oils. The acid
value is defined as the number of mg of NaOH needed to neutralize 1 g of sample. The
reagent solutions of ethanol (EtaxB) -diethyl ether (Sigma-Aldrich, Diethyl ether, puriss

17
p.a) (1:1, v/v) and 0,1 M NaOH (Sigma-Aldrich, Sodium hydroxide, puriss p.a, opened:
9.12.2013) was made. For the determination of the concentration of NaOH, oxalic acid
was titrated with the NaOH solution. The concentration was calculated. Two parallel
samples from each oil sample were weighed. The weighed amount of oil should require
at least 0.2 ml of NaOH solution to be neutralized, according to this 3 g of F samples was
weighed in Erlenmeyer flasks and 2 g of R samples. Then phenolphthalein (1 %
phenolphthalein in ethanol solution) was added to the ethanol-diethyl ether solution
before neutralizing with NaOH to faint pink color. 50 ml of the freshly neutralized
ethanol-diethyl ether solution was added to the oil samples and then titrated with NaOH
until neutralized (faint pink color is visible for 10 seconds). The acid values of all the oil
samples were calculated. (Nordic Committee on Food Analysis 2001)
The anisidine value was determinated according to IUPAC Method 2.504, 7th Edition
1987 to analyze the number of aldehydes in the oil samples. The p-anisidine value is
defined by convention as 100 times the optical density measured in a 1 cm cell of a
solution containing 1.00 g of the oil in 100 ml of reagents. The reagent solution of 2.5 g/l
p-anisidine (Aldrich, p-anisidine, 99%) in acetic acid (J.T. Baker, Acetic acid, 99-100 %
glacial) was made. Two parallel samples from each oil sample were weighed according
to standard for F samples 4 g and for R samples 2 g in 25 ml volumetric flasks. The
volumetric flasks were diluted to volume with isooctane. 2 ml of each sample solutions
was pipetted into cuvettes (VIS 340-800 nm). The absorbance of all the samples were
measured with spectrophotometer at 350 nm wavelength. The reference cell of the
spectrophotometer was filled with solvent. The 5 ml of each solution was pipetted into
each test tubes and 1 ml p-anisidine solution was added and shaken with test tube agitator
and let to rest for 10 min. Acetic acid- p-anisidine solution reacts with aldehydic
compounds in the oil sample and forms a yellowish color, the intensity of the color
depends on amount of aldehydic compounds and their structure. After 10 min 2 ml of
each sample solution was pipetted into cuvette and the absorbance was measured again
at 350 nm using blank in a reference cell. Blank was prepared in the same way as the
sample but without the oil. One blank was used as reference for 8 samples. (IUPAC 1987)
The peroxide value was determined according to AOCS Official Method Cd 8b-90,
Revised 2003 and Nordic Committee on Food Analysis Method No. 158, 1997 to analyze
the peroxides and other same type of products of oxidation. The peroxide value is a

18
quantity of all substances in the sample expressed in terms of milliequivalents of peroxide
per 1 kg of sample which oxidize potassium iodide. The reagent solutions acetic acid (J.T.
Baker, Acetic acid, 99-100 % glacial)-isooctane (Rathburm, Iso-octane) (3:2, v/v),
saturated potassium iodide, 0.01 M sodium thiosulfate and starch indicator was made.
The determination of sodium thiosulfate with 3 parallel samples was conducted by mixing
25 ml distilled water, 2 ml 4 M H2SO4, 1 ml 0.002 M potassium iodate together then
adding 5 ml saturated potassium iodide and titrating immediately with 0.01 M sodium
thiosulfate solution until faint yellowish-brown color. Then starch indicator was added
and titrating continued until blue color disappears. The concentration of sodium
thiosulfate was calculated. Then the actual peroxide value was analyzed. Two parallel
samples from each oil sample were weighed. The samples were weighed according the
expected peroxide value, according to this 4 g of F samples was weighed in Erlenmeyer
flasks and 2 g of R samples. To the Erlenmeyer flasks 50 ml acetic acid-isooctane solution
and 0.5 ml saturated potassium iodide solution was added and let stand and shaking 3
times during 1 min so that iodine is liberated. After 1 min 30 ml water was added.
Titration was started with 0.01 M sodium thiosulfate and continued until the yellow color
from iodine was faint. Then starch indicator was added and titration continued until blue
color disappears in this point all the iodine has been liberated from the reagent layer. Also,
blank samples were determined. The peroxide values of all the samples were calculated.
(AOCS 2003; Nordic Committee on Food Analysis 1997)
2.2 Fatty acid composition
Fatty acid composition of the oil of the mayonnaises was determined according to
standard procedure to analyze the fatty acid composition of the F samples qualitatively
and quantitatively. In the gas chromatography (GC) analysis, the boron trifluoride-
catalyzed esterification method (BTEM) produces volatile fatty acid methyl esters from
the oil samples. The BTEM esterified fatty acids and free fatty acids. In the analysis 0.5
mg of oil is required, there for each oil sample is weighed with larger amount and the
diluted into known concentration with hexane. Then the amount of solution containing
0.5 mg of oil was pipetted into glass tubes with screw joint caps. Internal standard
(triheptadecanoin, TAG 17:0) was added in all the samples so that the amount is 5 % of
all lipids Then the hexane was evaporated and 100 µl toluene and 500 µl boron trifluoride-
methanol was added. Samples were incubated in 90 °C for 60 min. The chemical reaction

19
of this analysis is shown in Figure 6. When cooled down 800 µl distilled water and 1 ml
hexane was added and the vigorously shaken with test tube agitator for 10 sec. Two
phases appeared, the upper hexane phase contains the fatty acid methyl esters and is
carefully pipetted into auto sampler bottle.
Figure 6. The chemical reaction of the esterification with BTEM.
Samples are the analyzed together with external standards (FAME37 and GLC68D) in
Shimadzu GC-2010 with AOC-20i auto injector and flame ionixation detector (Shimadzu
Corporation, Kyoto, Japan) with wall coated open tubular column DB-23 (60 m x 0.25
mm, liquid film 0.25 µm, Agilent Technologies) with helium as a carrier gas with
injection temperature 270 °C, column temperature 130 °C and detector temperature 280
°C. The injection volume was 0.5 µL. Total amount of fatty acids and their mass
percentages are calculated.
2.3 Rheology measurements
The rheological measurements (flow curve, thixotropy and oscillatory measurements:
amplitude and frequency sweep) were conducted with Anton Paar Modular Compact
Rheometer (MCR 102, Anton Paar, Austria) and analyzed with standard methods by
RheoPlus Software, Anton Paar. For the oscillatory measurements parallel-plate
measuring (Figure 7) system with measuring plate (Anton Paar, PP15, diameter: 14.973
mm) was used and for the flow curve and thixotropy measurements cone-and-plate
measuring system (Figure 7) with measuring cone (Anton Paar, CP50-1, diameter: 49,98
mm, cone angle: 0,997°, truncation: 101 µm) was used.

20
Figure 7. Rheology measurement systems. A. Cone-and-plate system. B. Parallel-plate
system.(Ngwa 2015).
For the measurements mouth-like condition was set. The temperature of the bottom plate
was set to 36 °C, the average temperature of human mouth and the measuring system was
covered with metal cover and little water was added in the bottom of the metal cover to
prevent water evaporation. (Microlife n.d.; Mezger 2011)
2.4 Sensory analysis
The sensory evaluations were conducted to support the results from analysis and
measurements. The sensory evaluations were held in Saarioinen Oy, Huittinen. The panel
consisted of 3 expert panelists. The panelists were employees in Saarioinen Oy, Huittinen
with extensive experience in sensory evaluations and mayonnaise products. The sensory
analysis samples were F and R versions of the TM, LM, MD made with N and P lines.
The samples were randomly numbered, and the order of the samples was randomized
(AB, CD, EF variations, F and R mayonnaises evaluated separately). For the rancidity of
the odor diacetyl (Fluka, Diacetyl (2,3-Butadion), puriss > 99.5 %, opened: 1.9.1980) and
butyric acid (Fluka, Butyric acid, puriss p.a ≥ 99.5 %, opened: 29.6.1998) were used as
comparison samples. The comparison samples for the basic tastes were 2 % sucrose
solution (Alfa Aesar, Sucrose, 99 %), 0.2 % sodium chloride solution (Alfa Aesar,
Sodium Chloride, crystalline powder, 99+ %), 0.07 % caffeine solution (Alfa Aesar,
Caffeine, 99 %), 0.07 % citric acid solution (Alfa Aesar, Citric Acid, 99+ %) and 0.018
% L-glutamic acid solution (Alfa Aesar, L-glutamic acid monosodium salt monohydrate,
98+ %). The sensory evaluation forms consisted of question about appearance (color,
smoothness, air bubbles, solid particles and fat separation), odor (vinegar and rancid

21
odor), taste (sweetness, sourness, saltiness, bitterness, umami, rancid and vinegar taste),
mouthfeel/texture (smoothness, gel-like, foam-like, slimy, oily). Question types were
mainly 5-point hedonic scale (smoothness, air bubbles, solid particles, fat separation,
vinegar odor and taste, rancid odor and taste, foam-like, gel-like, slimy and oily) and 9-
point hedonic scale (sweetness, sourness, saltiness, bitterness and umami). Select one
questions were used to describe whether the sample was comparable to fresh and
merchantable mayonnaise or not and to describe whether rancidity of the odor was closer
to diacetyl or butyric acid. Open questions were used to describe the color, appearance,
odor, taste and mouthfeel/texture of the samples. Also paired comparison test was to
determine whether the N or P sample of the TM, LM and MD had thicker consistency.
The results are statistically analyzed with t-test.

22
3 Results and Discussion
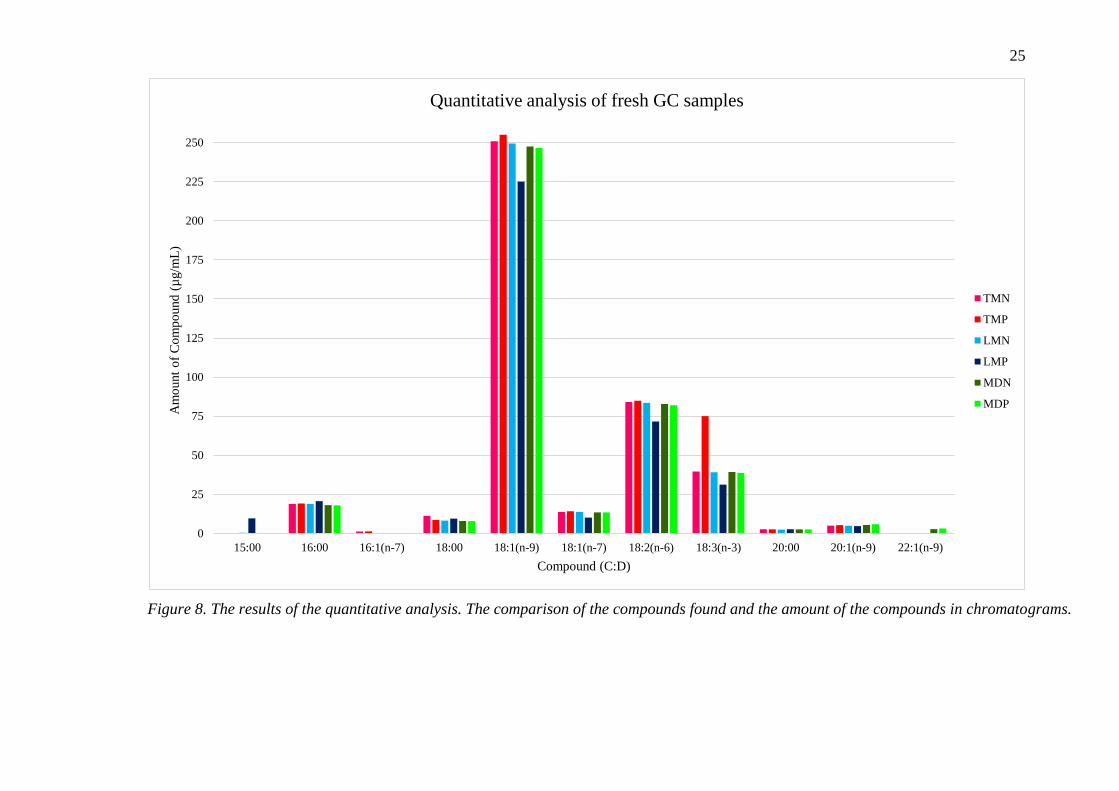
3.1 Fatty Acid Composition
The rapeseed oil contains approximately saturated fatty acids: 16:0 palmitate and 18:0
stearate and unsaturated fatty acids: 16:1 palmitoleate acid, 18:1 oleate acid, vaccinate
acid, 18:2 linoleate acid, 18:3 linolenate acid, 20:0 arachidate acid, 20:1 eicosanoate acid
and 22:1 erucic acid. The GC analysis shows that all the samples contained high amount
of 18:1(n-9) methyl oleate acid, 18:2(n-6) methyl linoleate acid, 18:3(n-3) methyl
linolenate acid, 16:0 methyl palmitate acid, 18:1(n-7) methyl vaccenate acid, 18:0 methyl
stearate acid, 20:1(n-9) methyl 11-eicosanoate acid and 20:0 methyl arachidate acid.
Furthermore, samples also contain small amount of 1.3 µg/mL methyl palmitoleate acid
(TM), 3.0 µg/mL erucic acid methyl ester (MD) and 0.4 µg/mL (LMN) and 9.6 µg/mL
(LMP) pentadecanoic acid methyl ester. These not common fatty acids for rapeseed oil
most likely in the samples due to the other ingredients in the samples. Pentadecanoic acid
methyl ester is most likely contamination during the analysis because it is most common
to find in bovine milk products. The quantitative results of the TM, LM and MD samples
are shown in Table 3 (TM), Table 4 (LM) and Table 5 (MD). The change of the
production line did not have any effect on the amount of compound found. Figure 8
displays the comparison of compounds found in different samples. (Bocianowski,
Mikołajczyk, and Bartkowiak-Broda 2012; “Crambe, Industrial Rapeseed, and Tung
Provide Valuable Oils” 2006; Archer Daniels Midland Company 2015).

23
Table 3. The results of the GC analysis for the TMNF and TMPF samples (compounds
(C:D: number of carbon atoms and double bonds in fatty acid), concentrations,
correction factors and amount of the compounds).
Table 4. The results of the GC analysis for the LMNF and LMPF samples (compounds,
concentrations, correction factors and amount of the compounds).
TMN & TMP TMN TMP
C:D Compound Concentration
(mg/mL)
Correction
factor
Amount of
Compound
(µg/mL)
Concentration
(mg/mL)
Correction
factor
Amount of
Compound
(µg/mL)
16:00 Methyl
Palmitate
0.0194 0.1470 18.9 0.0197 0.1657 19.1
16:1(n-
7)
Methyl
Palmitoleate
0.0012 0.1551 1.3 0.0013 0.1748 1.3
18:00 Methyl Stearate 0.0115 0.2036 11.3 0.0087 0.1672 8.5
18:1(n-
9)
Methyl Oleate 0.2522 0.1505 250.9 0.2564 0.1697 255.1
18:1(n-
7)
Methyl
Vaccenate
0.0146 0.1421 13.7 0.0151 0.1602 14.1
18:2(n-
6)
Methyl
Linoleate
0.0876 0.1451 84.0 0.0885 0.1635 84.8
18:3(n-
3)
Methyl
Linolenate
0.0415 0.1445 39.6 0.0786 0.3025 75.0
20:00 Methyl
Arachidate
0.0027 0.1488 2.6 0.0026 0.1678 2.6
20:1(n-
9)
Methyl 11-
eicosenoate
0.0052 0.1465 5.0 0.0055 0.1652 5.3
LMN & LMP LMN LMP
C:D Compound Concentration
(mg/mL)
Correction
factor
Amount of
Compound
(µg/mL)
Concentration
(mg/mL)
Correction
factor
Amount of
Compound
(µg/mL)
15:00 Pentadecanoic
Acid Methyl
Ester
0.0005 0.1451 0.4 0.0099 0.1630 9.6
16:00 Methyl
Palmitate
0.0194 0.1464 18.9 0.0212 0.1645 20.6
18:00 Methyl Stearate 0.01 0.1477 8.2 0.0097 0.1660 9.5
18:1(n-
9)
Methyl Oleate 0.25 0.1499 249.4 0.2262 0.1631 225.1
18:1(n-
7)
Methyl
Vaccenate
0.01 0.1415 13.8 0.0108 0.1590 10.1
18:2(n-
6)
Methyl
Linoleate
0.09 0.1445 83.5 0.0747 0.1600 71.6
18:3(n-
3)
Methyl
Linolenate
0.04 0.1440 39.1 0.0327 0.1618 31.3
20:00 Methyl
Arachidate
0.00 0.1482 2.5 0.0027 0.1666 2.6
20:1(n-
9)
Methyl 11-
eicosenoate
0.01 0.1459 4.9 0.0049 0.1640 4.7

24
Table 5.The results of the GC analysis for the MDNF and MDPF samples (compounds,
concentrations, correction factors and amount of the compounds).
MDN & MDP MDN MDP
C:D Compound Concentration
(mg/mL)
Correction
factor
Amount of
Compound
(µg/mL)
Concentration
(mg/mL)
Correction
factor
Amount of
Compound
(µg/mL)
16:00 Methyl
Palmitate
0.0186 0.1467 18.1 0.0185 0.1420 18.0
18:00 Methyl
Stearate
0.0082 0.1481 8.0 0.0080 0.1433 7.8
18:1(n-
9)
Methyl
Oleate
0.2488 0.1503 247.5 0.2479 0.1455 246.6
18:1(n-
7)
Methyl
Vaccenate
0.0144 0.1418 13.5 0.0143 0.1373 13.4
18:2(n-
6)
Methyl
Linoleate
0.0863 0.1448 82.8 0.0855 0.1402 82.0
18:3(n-
3)
Methyl
Linolenate
0.0411 0.1443 39.3 0.0405 0.1397 38.7
20:00 Methyl
Arachidate
0.0026 0.1486 2.6 0.0026 0.1438 2.5
20:1(n-
9)
Methyl 11-
eicosenoate
0.0056 0.1463 5.4 0.0060 0.1416 5.8
22:1(n-
9)
Erucic Acid
Methyl Ester
0.0031 0.1375 2.8 0.0035 0.1331 3.2
25
0
25
50
75
100
125
150
175
200
225
250
15:00 16:00 16:1(n-7) 18:00 18:1(n-9) 18:1(n-7) 18:2(n-6) 18:3(n-3) 20:00 20:1(n-9) 22:1(n-9)
Am
ount
of
Co
mp
ound
(µ
g/m
L)
Compound (C:D)
Quantitative analysis of fresh GC samples
TMN
TMP
LMN
LMP
MDN
MDP
Figure 8. The results of the quantitative analysis. The comparison of the compounds found and the amount of the compounds in chromatograms.

26
3.2 Acid, anisidine and peroxide value
The oxidation for the TM (Figure 9.), LM (Figure 10.) and MD (Figure 11.) samples are
highly due to the formation of peroxide radicals (peroxide value) and aldehydes (anisidine
value). The values increase considerably during the 2-week incubation. The acid value
increases only slightly so the free fatty acids have less influence on the oxidation process
during the incubation. The oxidation level of the novel technique production line is
somewhat lower compared to the oxidation level of the functional production line.
0,70 0,60
1,45
0,73
5,08
5,98
0,550,38
1,49
0,80
2,90
4,72
0
1
2
3
4
5
6
Acid value Peroxide value Anisidine value
Traditional mayonnaise
TMPF
TMPR
TMNF
TMNR
Figure 9. The oxidation products of the TM. Comparison of fresh and after 2-week
incubation. Also between the different production lines.

27
0,851,05
1,391,01
5,97
7,99
0,810,55
1,69
0,97
5,27
7,41
0
1
2
3
4
5
6
7
8
Acid value Peroxide value Anisidine value
Mayonnaise dressing
MDPF
MDPR
MDNF
MDNR
1,22
0,49
2,42
1,34
7,99 7,99
1,010,62
2,24
1,29
7,45 7,53
0
1
2
3
4
5
6
7
8
Acid value Peroxide value Anisidine value
Light mayonnaise
LMPF
LMPR
LMNF
LMNR
Figure 10. The oxidation products of the LM. Comparison of fresh and after 2-week
incubation. Also between the different production lines.
Figure 11. The oxidation products of the MD. Comparison of fresh and after 2-week
incubation. Also between the different production lines.

28
3.3 Rheology analysis
The amplitude sweep shows for all the samples that the consistency of the samples is gel-
like because in all the curves the storage modulus greater than the loss modulus. The
curves for the TM are the highest which indicates that the TM has the most gel-like
consistency and respectively MD has the least gel-like consistency when though it has
gel-like consistency (Figure 12). When comparing the F and R samples there are nearly
no difference of the consistency in TM, LM and MD samples. Also, when comparing the
N and P samples only in LM sample they have slight difference between the LMFP,
LMRP and LMFN, LMRN. The gel-like consistency of the LMFP and LMRP samples is
thicker than for LMFN and LMRN but the viscosity difference is slight. All the curves
for all the samples also show the gel point, which is the point where the loss modulus
becomes greater than the storage modulus, so the gel-like consistency becomes liquid-
like. For the TM and LM samples it comes at the end of the curve, showing that the
structure of the samples is stable. For MD samples the gel point comes little bit earlier
which indicates that the structure is slightly less stable. Amplitude sweep determines the
strain amplitude for the frequency sweep.
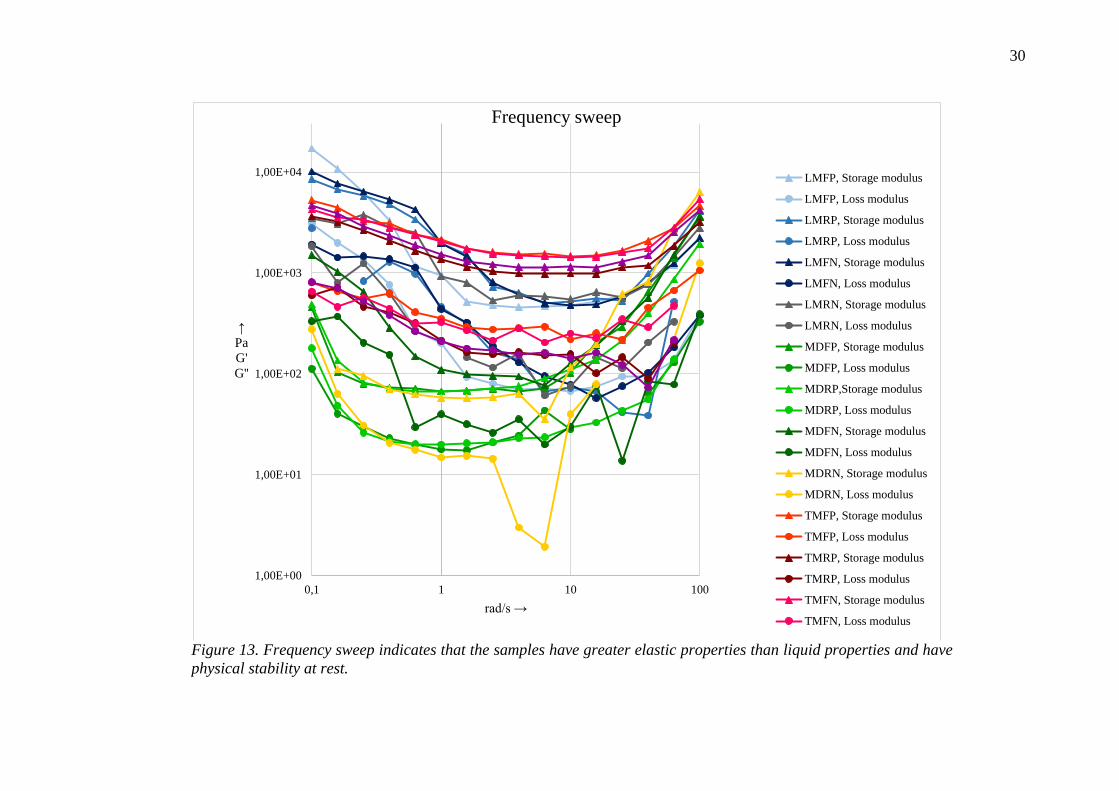
Frequency sweep curves show that in all the samples the elastic behavior dominates the
viscous behavior because also in the frequency sweep the storage modulus curves are
greater than the loss modulus curves (Figure 13). This means that the samples are stable
at rest. TM and LM samples are equally stable but the MD curves show that it is slightly
less stable at rest than the TM and LM samples. MD also have some irregularities in the
curves (peaks) indicate that the MD sample was not smooth but contained e.g. solid
particles.

29
Figure 12. Amplitude sweep with storage and loss modulus curves for all the samples showing the gel-like consistency
and the gel point of the samples.
1,00E+01
1,00E+02
1,00E+03
0,01 0,10 1,00 10,00 100,00
↑
Pa
G'
G''
Strain % →
Amplitude sweep
LMFP, Storage modulus
LMFP, Loss modulus
LMRP, Storage modulus
LMRP, Loss modulus
LMFN, Storage modulus
LMFN, Loss modulus
LMRN, Storage modulus
LMRN, Loss modulus
MDFP, Storage modulus
MDFP, Loss modulus
MDRP, Storage modulus
MDRP, Loss modulus
MDFN, Storage modulus
MDFN, Loss modulus
MDRN, Storage modulus
MDRN, Loss modulus
TMFP, Storage modulus
TMFP, Loss modulus
TMRP, Storage modulus
TMRP, Loss modulus
TMFN, Storage modulus
30
1,00E+00
1,00E+01
1,00E+02
1,00E+03
1,00E+04
0,1 1 10 100
↑
Pa
G'
G''
rad/s →
Frequency sweep
LMFP, Storage modulus
LMFP, Loss modulus
LMRP, Storage modulus
LMRP, Loss modulus
LMFN, Storage modulus
LMFN, Loss modulus
LMRN, Storage modulus
LMRN, Loss modulus
MDFP, Storage modulus
MDFP, Loss modulus
MDRP,Storage modulus
MDRP, Loss modulus
MDFN, Storage modulus
MDFN, Loss modulus
MDRN, Storage modulus
MDRN, Loss modulus
TMFP, Storage modulus
TMFP, Loss modulus
TMRP, Storage modulus
TMRP, Loss modulus
TMFN, Storage modulus
TMFN, Loss modulus
Figure 13. Frequency sweep indicates that the samples have greater elastic properties than liquid properties and have
physical stability at rest.
31
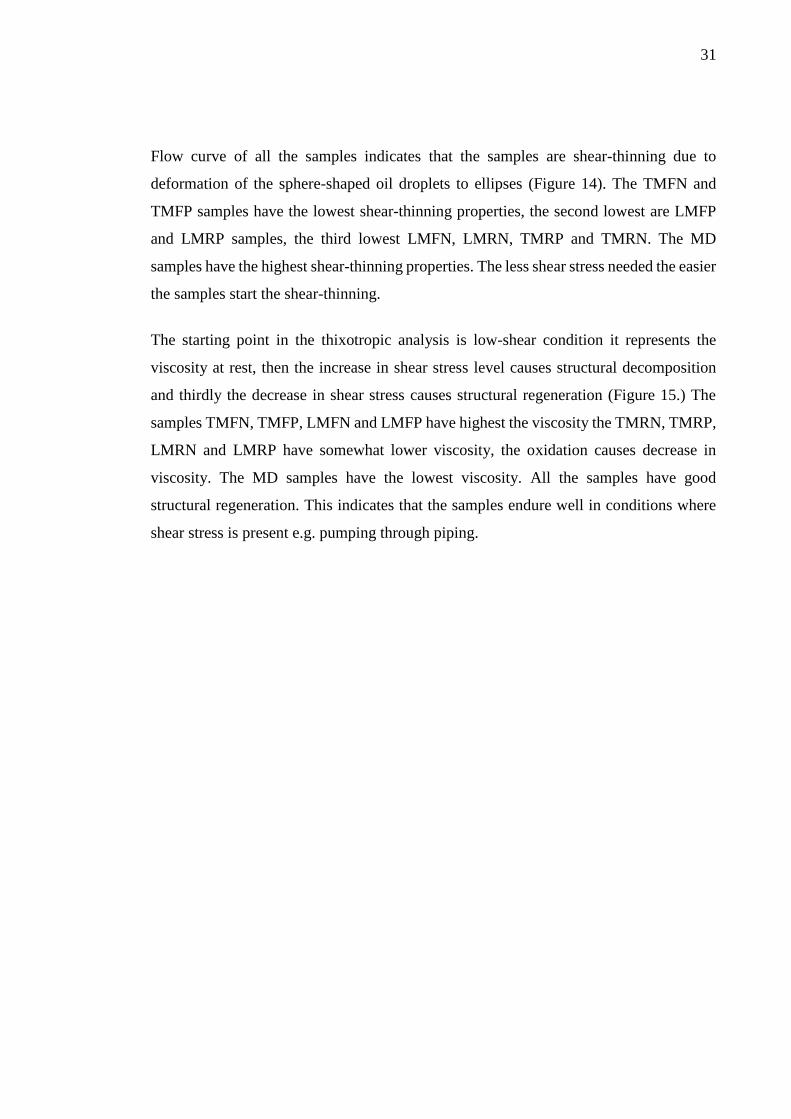
Flow curve of all the samples indicates that the samples are shear-thinning due to
deformation of the sphere-shaped oil droplets to ellipses (Figure 14). The TMFN and
TMFP samples have the lowest shear-thinning properties, the second lowest are LMFP
and LMRP samples, the third lowest LMFN, LMRN, TMRP and TMRN. The MD
samples have the highest shear-thinning properties. The less shear stress needed the easier
the samples start the shear-thinning.
The starting point in the thixotropic analysis is low-shear condition it represents the
viscosity at rest, then the increase in shear stress level causes structural decomposition
and thirdly the decrease in shear stress causes structural regeneration (Figure 15.) The
samples TMFN, TMFP, LMFN and LMFP have highest the viscosity the TMRN, TMRP,
LMRN and LMRP have somewhat lower viscosity, the oxidation causes decrease in
viscosity. The MD samples have the lowest viscosity. All the samples have good
structural regeneration. This indicates that the samples endure well in conditions where
shear stress is present e.g. pumping through piping.

32
0
50
100
150
200
250
300
0 10 20 30 40 50 60 70 80 90 100
↑Shear stress
(Pa)
Shear rate (1/s) →
Flow curve
LMFP
LMRP
LMFN
LMRN
MDFP
MDRP
MDFN
MDRN
TMFP
TMRP
TMFN
TMRN
Figure 14. Flow curve indicates the shear-thinning properties of the samples. The less shear stress needed, the more
shear-thinning the sample.

33
0,1
1
10
100
0 50 100 150 200 250 300 350 400
↑Viscosity
(Pa·s)
Time (s) →
Thixotrophy
LMFP
LMRP
LMFN
LMRN
MDFP
MDRP
MDFN
MDRN
TMFP
TMRP
TMFN
TMRN
Figure 15. The thixotrophy analysis indicates the shear stress durability and the viscosity of the samples.

34
3.4 Sensory analysis
In the sensory analysis the questions for appearance were: smooth: Is it smooth? (scale 1-
5: not at all-extremely), air bobbles: Are there visible air bobbles? (scale 1-5: not at all-
extremely), solid particles: Are there visible solid particles? (scale 1-5: not at all-
extremely), fat separation: Is there visible fat separation? (scale 1-5: not at all-extremely),
likeness: Is the sample comparable to merchantable product? (yes=1, no=2), if not,
quality: Evaluate the quality when compared to merchantable product? (scale 1-5: not
eatable-extremely good) (Figures 16-18). The appearance of all the mayonnaise samples
were smooth, without air bobbles or solid particles, almost all of the samples were
considered to be comparable to merchantable product except TMNR and TMPR, but their
quality was still pretty good. None of the differences between the answers were
statistically significant.
1
2
3
4
5
Smooth Air boobles Solid
particles
Fat
separation
Likeness If not,
quality
Sca
le (
1-5
)
Question
Appearance of TM
TMNF
TMNR
TMPF
TMPR
Figure 16. The results for the appearance of the traditional mayonnaise.

35
Figure 17. The results for the appearance of the light mayonnaise.
Questions for the smell of the samples were: vinegary: Does the sample smell like
vinegar? (scale 1-5: not at all-extremely), rancidity: Does the sample smell rancid? (scale
1-5: not at all-extremely), closeness of the rancidity: Is the rancid smell closer to butyric
acid or diacetyl? (1=butyric acid, 2=diacetyl), likeness: Is the sample comparable to
merchantable product? (yes=1, no=2), if not, quality: Evaluate the quality when compared
to merchantable product? (scale 1-5: not eatable-extremely good) (Figures 19-21). All the
1
2
3
4
5
Smooth Air boobles Solid
particles
Fat
separation
Likeness If not,
quality
Sca
le (
1-5
)
Question
Appearance of LM
LMNF
LMNR
LMPF
LMPR
1
2
3
4
5
Smooth Air boobles Solid
particles
Fat
separation
Likeness If not,
quality
Sca
le (
1-5
)
Question
Appearance of MD
MDNF
MDNR
MDPF
MDPR
Figure 18. The results for the appearance of the mayonnaise dressing.

36
mayonnaises were thought to be slightly vinegar smell, the incubated samples were
thought to be pretty rancid, the rancidity for all the samples were thought to be closer to
the smell of diacetyl than butyric acid. The incubated samples were not comparable to the
merchantable product and the quality compared to merchantable product was satisfying
or bad. The only statistically significant difference was the difference in rancidity between
TMPF (not rancid at all) and TMPR (very rancid).
1
2
3
4
5
Vinegary Rancidity Closeness of
rancidity
Likeness If not, quality
Sca
le (
1-5
)
Question
Smell of TM
TMNF
TMNR
TMPF
TMPR
Figure 19. The results of the smell of the traditional mayonnaise.
1
2
3
4
5
Vinegary Rancidity Closeness of
rancidity
Likeness If not, quality
Sca
le (
1-5
)
Question
Smell of LM
LMNF
LMNR
LMPF
LMPR
Figure 20. The results of the smell of the light mayonnaise.

37
Questions of the taste of the mayonnaises were: sweetness: How sweet is the sample
compared to the standard liquid? (scale 1-9: extremely less- extremely more), saltiness:
How salty is the sample compared to the standard liquid? (scale 1-9: extremely less-
extremely more), bitterness: How bitter is the sample compared to the standard liquid?
(scale 1-9: extremely less- extremely more), sourness: How sour is the sample compared
to the standard liquid? (scale 1-9: extremely less- extremely more), umami: How umami
is the sample compared to the standard liquid? (scale 1-9: extremely less- extremely
more), rancidity: Does the sample taste rancid? (scale 1-5: not at all-extremely), vinegary:
Does the sample smell like vinegar? (scale 1-5: not at all-extremely), likeness: Is the
sample comparable to merchantable product? (yes=1, no=2), if not, quality: Evaluate the
quality when compared to merchantable product? (scale 1-5: not eatable-extremely good)
(Figures 22-24). The sweetness, saltiness, bitterness, sourness, umami flavors were not
production line or incubation depended, more depended on the recipe. The incubated R
samples taste rancid and the quality compared to merchantable products were bad to very
bad. There were no statistical differences between the answers.
1
2
3
4
5
Vinegary Rancidity Closeness of
rancidity
Likeness If not, quality
Sca
le (
1-5
)
Question
Smell of MD
MDNF
MDNR
MDPF
MDPR
Figure 21. The results of the smell of the mayonnaise dressing.

38
Figure 22. The results of the taste of the traditional mayonnaise.
1
2
3
4
5
6
7
8
9
Sca
le (
1-9
)
Question
Taste of LM
LMNF
LMNR
LMPF
LMPR
Figure 23. The results of the taste of the light mayonnaise.
1
2
3
4
5
6
7
8
9
Sca
le (
1-9
)
Question
Taste of TM
TMNF
TMNR
TMPF
TMPR

39
Questions for the texture/mouthfeel of the mayonnaises were: smooth: Is the
texture/mouthfeel smooth? (scale 1-5: not at all-extremely), foamy: Is the
texture/mouthfeel foamy? (scale 1-5: not at all-extremely), gel: Is the texture/mouthfeel
gel-like? (scale 1-5: not at all-extremely), slimy: Is the texture/mouthfeel slimy? (scale 1-
5: not at all-extremely), oily: Is the texture/mouthfeel oily? (scale 1-5: not at all-
extremely), likeness: Is the sample comparable to merchantable product? (yes=1, no=2),
if not, quality: Evaluate the quality when compared to merchantable product? (scale 1-5:
not eatable-extremely good) (Figures 25-27). The texture/mouthfeel of the mayonnaises
are smooth, gel-like and oily, mostly comparable to merchantable product if not the
quality is bad. No statistically significant differences.
1
2
3
4
5
6
7
8
9
Sca
le (
1-9
)
Question
Taste of MD
MDNF
MDNR
MDPF
MDPR
Figure 24. The results of the taste of the mayonnaise dressing.

40
1
2
3
4
5
Smooth Foamy Gel Slimy Oily Likeness If, not
quality
Sca
le (
1-5
)
Question
Texture/mouthfeel of TM
TMNF
TMNR
TMPF
TMPR
Figure 25. The results of the texture/mouthfeel of the traditional
mayonnaises.
1
2
3
4
5
Smooth Foamy Gel Slimy Oily Likeness If, not
quality
Sca
le (
1-5
)
Question
Texture/mouthfeel of LM
LMNF
LMNR
LMPF
LMPR
Figure 26. The results of the texture/mouthfeel of the light mayonnaises.

41
The overall quality of the samples was thought to be similar when comparing the
production lines, but the R samples were thought to have lower quality than the N
samples. When comparing the possible thickness changes between the products made in
different production line the mayonnaise made with functional production line was
thought to be thicker, but the comments were that there is barely any difference between
them (Figure 28).
1
2
3
4
5
Smooth Foamy Gel Slimy Oily Likeness If, not
quality
Sca
le (
1-5
)
Question
Texture/mouthfeel of MD
MDNF
MDNR
MDPF
MDPR
Figure 27. The results of the texture/mouthfeel of the mayonnaise dressings.
1
2
3
4
5
Sca
le (
1-5
)
Samples
Overall quality of samples
Figure 28. The overall quality of different mayonnaise samples.
42
4 Conclusions
The purpose of this study was to compare same products made with different production
lines. The novel production line had different mechanism to produce mayonnaise than the
functional production line. After all the chemical, physical and sensory analysis the
mayonnaises made with different production lines are similar on with slight differences
in how the oxidation affects the mayonnaise, the mayonnaise made with the novel
technique seems to endure incubation better and the quality of the mayonnaise is better.
The stability of the mayonnaise that can endure oxidation more is better. But all in all the
differences are small and both of the techniques are suitable for making these
mayonnaises.

43
References
Anton. Marc. 2013. “Egg Yolk: Structures. Functionalities and Processes: Egg Yolk:
Structures. Functionalities and Processes.” Journal of the Science of Food and
Agriculture 93 (12):2871–80. https://doi.org/10.1002/jsfa.6247.
AOCS. 2003. “AOCS Official Method Cd 8b-90 Peroxide Value. Acetic Acid-Isooctane
Method..”
Archer Daniels Midland Company. 2015. “Rapeseed Oil Specifiactions.” 2015.
http://www.oilio.com/Rapeseedspecs.html.
Bocianowski. Jan. Katarzyna Mikołajczyk. and Iwona Bartkowiak-Broda. 2012.
“Determination of Fatty Acid Composition in Seed Oil of Rapeseed (Brassica Napus L.)
by Mutated Alleles of the FAD3 Desaturase Genes.” Journal of Applied Genetics 53
(1):27–30. https://doi.org/10.1007/s13353-011-0062-0.
Campbell-Platt. Geoffrey. and International Union of Food Science and Technology. eds.
2009. Food Science and Technology. Chichester. West Sussex. U.K. ; Ames. Iowa :
[Oakville. Ont.]: Wiley-Blackwell ; IUFoST.
“Crambe. Industrial Rapeseed. and Tung Provide Valuable Oils.” 2006. October 10.
2006.
https://web.archive.org/web/20061010225533/http://ers.usda.gov/publications/IUS6/ius
6c.pdf.
Depree. J. A. and G. P Savage. 2001. “Physical and Flavour Stability of Mayonnaise.”
Trends in Food Science & Technology 12 (5–6):157–63. https://doi.org/10.1016/S0924-
2244(01)00079-6.
Dickinson. Eric. 2013. “Stabilising Emulsion-Based Colloidal Structures with Mixed
Food Ingredients.” Journal of the Science of Food and Agriculture 93 (4):710–21.
https://doi.org/10.1002/jsfa.6013.

44
Emerton. Victoria. and Eugenia Choi. eds. 2008. Essential Guide to Food Additives. 3rd
ed. Leatherhead. Surrey : Cambridge. U.K: Leatherhead Food International ; Royal
Society of Chemistry.
Ghorbani Gorji. Sara. Heather E. Smyth. Mary Sharma. and Melissa Fitzgerald. 2016.
“Lipid Oxidation in Mayonnaise and the Role of Natural Antioxidants: A Review.”
Trends in Food Science & Technology 56:88–102.
https://doi.org/10.1016/j.tifs.2016.08.002.
Ghosh. Probir Kumar. Sabyasachi Chatterjee. Paramita Bhattacharjee. and Nabarun
Bhattacharyya. 2016. “Removal of Rancid-Acid Odor of Expeller-Pressed Virgin
Coconut Oil by Gamma Irradiation: Evaluation by Sensory and Electronic Nose
Technology.” Food and Bioprocess Technology 9 (10):1724–34.
https://doi.org/10.1007/s11947-016-1752-8.
Harrison. L. J.. and F. E. Cunningham. 1986. “Influence of Salt on Properties of Liquid
Yolk and Functionality in Mayonnaise.” Poultry Science 65 (5):915–21.
https://doi.org/10.3382/ps.0650915.
Heertje. I. 2014. “Structure and Function of Food Products: A Review.” Food Structure
1 (1):3–23. https://doi.org/10.1016/j.foostr.2013.06.001.
Huck-Iriart. Cristián. Roberto Jorge Candal. and María Lidia Herrera. 2011. “Effect of
Processing Conditions and Composition on Sodium Caseinate Emulsions Stability.”
Procedia Food Science 1:116–22. https://doi.org/10.1016/j.profoo.2011.09.019.
IUPAC. 1987. “2.504 Determination of the P-Anisidine Value (P-A.V.). 7 Th Edition.”
Kerkhofs. Stef. Heiko Lipkens. Firmin Velghe. Pieter Verlooy. and Johan A. Martens.
2011. “Mayonnaise Production in Batch and Continuous Process Exploiting
Magnetohydrodynamic Force.” Journal of Food Engineering 106 (1):35–39.
https://doi.org/10.1016/j.jfoodeng.2011.04.003.
Kiosseoglou. V. D.. and P. Sherman. 1983. “Influence of Egg Yolk Lipoproteins on the
Rheology and Stability of O/W Emulsions and Mayonnaise. 1. Viscoelasticity of
45
Groudnut Oil-in Water Emulsions and Mayonnaise.” Journal of Texture Studies 14
(4):397–417. https://doi.org/10.1111/j.1745-4603.1983.tb00358.x.
Lagunes-Galvez. Laura. Marie-Elisabeth Cuvelier. Claire Ordonnaud. and Claudette
Berset. 2002. “Oxidative Stability of Some Mayonnaise Formulations During Storage and
Daylight Irradiation.” Journal of Food Lipids 9 (3):211–24.
https://doi.org/10.1111/j.1745-4522.2002.tb00220.x.
Mezger. Thomas G. 2011. The Rheology Handbook: For Users of Rotational and
Oscillatory Rheometers. 3..rev. ed. European Coatings Tech Files. Hannover: Vincentz
Network.
Microlife. n.d. “Ihmisen Ruumiinlämmön Mittaus.” Accessed June 10. 2017.
https://www.microlife.fi/healthguide/fever/management/.
Ngwa. Asabuwa. 2015. “Rheology Methods.” Technology.
https://www.slideshare.net/asabuwangwa/rheology-methods.
Nordic Committee on Food Analysis. 1997. “No. 158 Peroxide Value. Determination in
Fat and Oil.”
———. 2001. “No. 38 Acid Value/Free Fatty Acid. Determination in Fats. 4th Edition.”
Norn. Viggo. 2014. Emulsifiers in Food Technology. Second edition. Chichester. West
Sussex. UK ; Hoboken. NJ: John Wiley & Sons Inc.
Peressini. Donatella. Alessandro Sensidoni. and Bruno de Cindio. 1998. “Rheological
Characterization of Traditional and Light Mayonnaises.” Journal of Food Engineering
35 (4):409–17. https://doi.org/10.1016/S0260-8774(98)00032-6.
Saarela. Anna-Maria. Paula Hyvönen. Sinikka Määttälä. and Atte Von Wright. 2010.
Elintarvikeprosessit. 3. uudistettu painos. Savonia-ammattikorkeakoulun julkaisusarja.
D5/9/2010. Kuopio: Savonia-ammattikorkeakoulu.
Tabilo-Munizaga. Gipsy. and Gustavo V. Barbosa-Cánovas. 2005. “Rheology for the
Food Industry.” Journal of Food Engineering. IV Iberoamerican Congress of Food

46
Engineering (CIBIA IV). 67 (1–2):147–56.
https://doi.org/10.1016/j.jfoodeng.2004.05.062.
Wendin. Karin. and Gunnar Hall. 2001. “Influences of Fat. Thickener and Emulsifier
Contents on Salad Dressing: Static and Dynamic Sensory and Rheological Analyses.”
LWT - Food Science and Technology 34 (4):222–33.
https://doi.org/10.1006/fstl.2001.0757.
Yildirim. Merve. Gulum Sumnu. and Serpil Sahin. 2016. “Rheology. Particle-Size
Distribution. and Stability of Low-Fat Mayonnaise Produced via Double Emulsions.”
Food Science and Biotechnology 25 (6):1613–18. https://doi.org/10.1007/s10068-016-
0248-7