Embed Size (px)
Citation preview

Effects of Soil pH and Eh on Growth and Nutrient Uptake by Rice in a Flooded Oxisol of
Sitiung Area of Sumatra, Indonesia
William H. Patrick, Jr., Adli Yusuf, and Aroon Jugsujinda
Technical Report No. 2 USAID Grant No. DPE-5542-G-SS-5055-00 (3.F-10)
in cooperation with Sukaranti Research Institute for Food Crops
P. C. Box 103, Padang West Sumatra, Indonesia
and Center for Soil Research
Bogor, Indonesia
Laboratory for Wetland Soils and Sediments Center for Wetland Resources
Louisiana State University Baton Rouge, Louisiana 70803-7511, U.S.A.
December 1987

Table of Contents
List of Figtr s...................................................................................... iii List of Tables.................................................................................... iv Abstract .............................................................................................. I
Introduction ...................................................................................... 2
Materials and Methods ......................................................................... 3 1. Soil Incubation ............................................................................ 4 2. Transplanting of Rice Seedlings ....................................................... 4 3. Controlling of Soil pH and Eh ......................................................... 4 4. Plant Growth and Assimilation Rate ...................................................... 5 5. Soil Analysis ................................................................................ 5
5.1. Water-soluble Fraction ............................................................... 5 5.2. Sodium Acetate Extractable Fraction .............................................. 5 5.3. Sodium-Citrate Dithionite Extractable Fraction ............................... 5
6. Plant Chemical Analysis ................................................................ 6
Results and Discussion 1. Soil Redox Potential (Eh).............................................................. 6 2. Plant Growth and Assimilation Rate .................................................. 7
2.1. Plant Growth ...................................................................... 7 2.2. Assimilation Rate ..................................................................... 8
3. Release of Nutrient Elements in soil, Their Contents in Rice Plants, and Their Relationship in Soil and Plant.......................................................... 9 3.1. Forms of Release in Soil.......................................................... 9
3.1.1. Copper, Zinc, and Molybdenum ........................................ 9 3.1.2. Iron and Manganese ..................................................... 11 3.1.3. Aluminum ........................................................ 12 3.1.4. Calcium and Magnesium .................................................... 12 3.1.5. Phosphorus, Potassium, and Silicon ...................................... 13
3.2. Nutrients Elements Contents hi, the Ric, Plants ............................... 15 3.2. 1. Copper, Zinc, and Molybde.nunL ...................................... 15 3.2.2. Iron and Manganese ..................................................... 15 3.2.3. Aluminum......................................................... 17 3.2.4. Calcium and Magnesium .................................................... 17 3.2.5. Phosphorus, Potassium, and 3ilicon................................... 18
3.3. Relationship Among Selected Nutrient Elements in the Soil and Their Uptake by Rice Plants............................................................ 19
3.3.1. Copper, Zinc, and Molybdenum ........................................ 19 3.3.2. Iron and Manganese ......................................................... 19 3.3.3. Aluminum ............... ...... ................... 20 3.3.4. Calcium and Magnesium............................................... 20 3.3.5. Phosphorus, Potassium, and Silicon......................... 20
Summary and Conclusions ................................................................... 21
References ....................................................................................... 25
ii

List of Figures
Figure 1. The apparatus for incubation of the soil suspension at controlled pH or redox potential conditions.
Figue 2. Diagram of growth set up after transplanting rice (a) and a plexiglass plate (b) designed for use in supporting rice seedlings in controlled system.
Figure 3. Effect of soil pH on average values of redox potential (Eh) of reduced and oxidized soil conditions.
tot11
List of Tables
Table 1. Some soil chemical and physical characteristics of the representative top soil layer(25 cm).
Table 2 Effect of soil pH on leaf discolorations and growth parameters of rice plants grown under reduced and oxidized in a flooded Oxisol.
Table 3. Growth parameters of the rice plants grown in a flooded Oxisol at pH 6.5 and varied Eh level.
Table 4. Average assimilation rates of rice plants grown in a flooded Oxisol under reduced and oxidized conditions at varied pH levels.
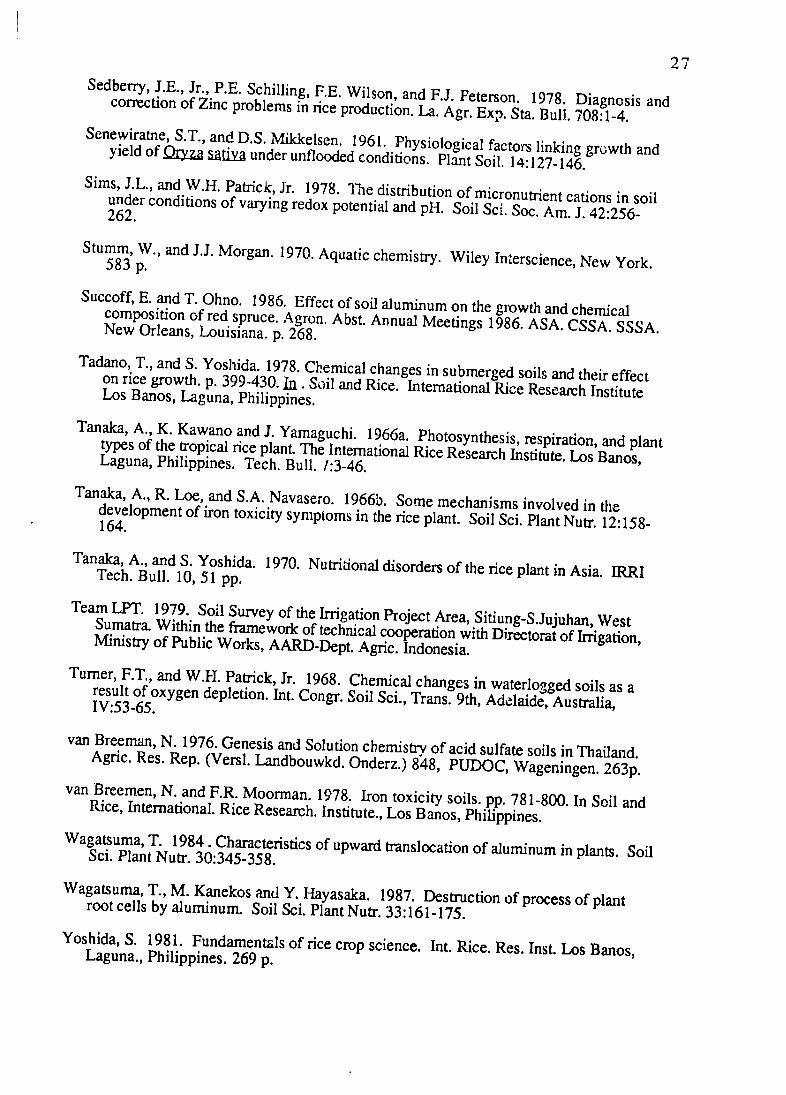
Table 5. Average assimilation rates of rice plants grown in a flooded Oxisol at pH 6.5 and varied Eh level.
Table 6. Average concentrations of water-soluble, sodium acetate extractable, and citrate dithionite extractable forms of Cu, Zn and Mo in a flooded Oxisol under reduced and oxidized conditions at varied pH levels.
Table 7. Average concentrations of water-soluble, sodium acetate extractable, and citrate dithionite extractable forms of Cu, Zn and Mo in a flooded Oxisol at pH 6.5 under varied Eli levels.
Table 8. Average concentrations of water-soluble, sodium acetate extractable, and citrate dithionite extractable forms of Fe and Mn in a flooded Oxisol under reduced and oxidized coaditions at varied pH levels.
Table 9. Average concentrations of water-soluble, sodium acetate extractable, and citrate dithionite extractable forms of Fe and Mn in a flooded Oxisol at pH 6.5 under varied Eh levels.
Table 10. Average concentrations of water-soluble, sodium acetate extractable, and citrate dithionite extractable forms of Al in a flooded Oxisol under reduced and oxidized conditions at varied pH levels.
Table 11. Average concentrations of water-soluble, sodium acetate extractable, and citrate dithionite extractable forms of Al in a flooded Oxisol at pH 6.5 under varied Eh levels.
Table 12. Average concentrations of water-soluble, sodium acetate extractable, and citrate dithionite extractable forms of Ca and Mg in a flooded Oxisol under reduced and oxidized conditions at varied pH levels.
Table 13. Average concentrations of water-soluble, sodium acetate extractable, and citrate dithionite extractable forms of Ca and Mg in a flooded Oxisol at pH 6.5 under varied Eh levels.
Table 14. Average concentrations of water-soluble, sodium acetate extractable, and citrate dithionite extractable forms of P, K, and Si in a flooded Oxisol under reduced and oxidized conditions at varied pH levels.
iv

Table 15. Average concentrations of water-soluble, sodium acetate extractable, and citrate dithionite extractable forms of P, K and Si in a flooded Oxisol at pH 6.5 under varied Eh levels.
Table 16. Average nutrient content of rice shoot grown in a flooded Oxisol under reduced and oxidized conditions at varied pH levels.
Table 17. Average nutrient content in rice shoots grown in a flooded Oxisol under varied redox levels at pH 6.5.
Table 18. Simple correlation coefficients for the relationships between water-soluble nutrients in the soil and nutrient uptake by rice in a flooded Oxisol under reduced and oxidized conditions over all pH levels.
Table 19. Simple correlation coefficients for the relationships between sodium acetate extractable nutrients in the soil and nutrient uptake by ice in a flooded Oxisol under reduced and oxidized conditions over all pH levels.
Table 20. Simple correlation coefficients for the relationships between concentrations of water-soluble nutrients and nutrient uptake by rice grown in a flooded Oxisol at pH 6.5 over all Eh levels.
Table 21. Simple correlation coefficients for the relationships between the concentrations of sodium acetate extractable nutrients and uptake by rice in a flooded Oxisol at pH 6.5 over all Eh levels.
Table 22. Simple correlation coefficients for the relationship between ion activity and nutrient uptake by rice in a flooded Oxisol under reduced and oxidized conditions over all pH levels.
V

Abstract
Rice grown on a flooded Sumatra Oxisol soils frequently exhibits poor growth and
low yield. A study has been made of the effects of pH and redox conditions on growth and
nutrient uptake by rice, and the relationship between nutrient release in the flooded soil and
nutrient uptake by the rice plant. At pH 4.5 rice plants produced low plant height, low root
dry weight, low shoot dry weight, slow relative growth rate, and short root length under
both reducing and oxidizing conditions. Under both soil conditions these growth
parameters tended to increase from pH 4.5 to 6.5 and then decrease at pH 7.5. The rice
plants under reducing conditions showed a significantly higher score of orange leaf
discoloration at pH 4.5 and 5.5 than at pH 6.5, and 7.5. At pH 4.5 the rice plants
absorbed significantly high concentrations of Zn, Fe, Mn, Ca, Mg, and Al under reducing
conditions. However, only the Fe content observed at pH 4.5 and 5.5 under reducing
conditions was above the critical level of toxicity of 300 mg kg- 1, indicating that the rice
plants may have suffered from Fe toxicity at these two pH levels.
Under oxidizing conditions, rice plants showed a significantly higher score of yellow
leaf discoloration at pH 4.5 and 5.5 than at 6.5 and 7.5. Under oxidizing conditions, the
Al content in the rice plants at all pH levels was above the critical level of Al toxicity of 300
mg kg- 1, indicating that the rice plants may have suffered from Al toxicity.
The contents of Cu, Zn, Mn, Ca, Mg, P and K in the rice plants at all pH and redox
conditions were in the normal range except for Si which was found to be below the
threshold deficiency value of 5%. A significant, high positive correlation was measured
for the water-soluble Fe in soil and uptake by the rice plants under reducing conditions (r =
+0.962**). A significant, positive correlation was also measured for the water-soluble Al
in the soil and uptake by the rice plants under oxidizing conditions (r= +0.658*). A
significant correlation was not measured for water-soluble Si in soil and uptake by the rice
plants under both soil redox conditions.

2
In the Sumatra Oxisol soil Fe toxicity in rice appeared to occur under reduced soil
conditions at pH values of 4.5 and 5.5, Al toxicity under oxidized conditions even at pH as
high as 7.5, and Si deficiency under both soil redox conditions regardless of pH.
Introduction
Millions of hectares of soil in Indonesia are very strongly acid with soil pH frequently
below 4.5. Sixty percent of these acid soils are classified as Oxisols (Typic Haplorthox)
and have been utilized under shifting cultivation on semi-permanent subsistence agriculture
(Driessen and Soepraptorahardjo, 1974).
Recently, Oxisols in the Sitiung area of Sumatra, Indonesia are rapidly Ieing cleared
for transmigrant farmers from the over-populated Indonesian islands of Java and Madura.
In 1982 the Indonesian government introduced an irrigation project in these areas (Sitiung I
and II) to support that transmigration program (Team LPT, 1979).
When the soil is flooded, the newly opened paddy field shows new problems for plant
growth. Rice grown on these flooded soils frequently exhibits poor growth and leaf
discolorations and gives low rice yields. This problem has not yet been identified and is
probably due to physiological disorders caused by nutrient toxicity or deficiency as a result
of flooding.
Flooding causes several biological and chemical changes of soil properties that are
important to plant nutrition and growth (Redman and Patrick, 1965; Ponnamperuma, 1972;
Turner and Patrick, 1968). Under reduced or flooded conditions, Fe3+ and Mn4+ ions are
reduced to Fe2+ and Mn2+ (Gotoh and Patrick, 1972, 1974; Meek and Grass, 1975).
Strongly acid soils can build up toxic concentrations of ferrous iron and thereby cause iron
toxicity problems (Reddy and Patrick, 1983).
Under reduced conditions, pH is an important factor that controlling ferric and
manganese concentrations (Gotoh and Patrick, 1972, 1974), but critical iron concentrations
in the soil solution varies with the pH (Tanaka et al., 1966b). Lucas and Kneseck (1972)

3
noted that the availability of manganese is related to pH and increases markedly when the
pH falls below 5.5.
Decreased soil Eh and associated changes in soil pH have important implications to
nutrient transformations in soil solutions (Mahapatra and Patrick, 1969; Reddy and Patrick
1983). Recently, Patrick and Jugsujinda (1986) found that problems in wetland rice grown
on a Sumatra Oxisol may be caused by Fe and Al toxicities Fe and Al and perhaps,
deficiencies of Ca, P, K,and Mg in rice plants. Iron and Al contents in the plant were not
related to those in the soils because the rice leaf samples were taken from plants in the field,
whereas, the soil data were from controlled laboratory studies. Therefore in the present
study, we conducted the experiments where the rice plants were grown under the controlled
pH and Eh of soil suspension in laboratory conditions.
The objective of the present study is to identify adverse factors affecting growth of rice
in Sitiung Transmigration areas of Sumatra, Indonesia, and ultimately contribute to
management practices that will improve the productivity of these soils. Experimental
procedures were designed to study rice growth and the potential for toxicities and
deficiencies of various elements under flooded lowland and upland conditions of these
soils.
Materials and Methods
The soil was collected from Sitiung Trasmigration areas of Sumatra, Indonesia.
These soils were classified as clayey, kaolinitic, isohyperthermic family of Typic
Haplorthox. Some soil chemical and physical characteristics of the representative top soil
layer (25 cm) are given in Table 1. Rice variety of IR-43, known as susceptible to Fe
toxicity, was used as plant indicator for both experiments.
Two experiments were conducted at the Laooratory for Wetland Soils and Sediments.
Each was arranged in a completely randomized design with two replications. Treatments in
experiment I consisted of two levels of redox conditions (reduced and oxidized) controlled

4
under four pH levels: 4.5, 5.5, 6.5, and 7.5. Treatments in experiment 2 consisted of
four levels of soil Eh (-150, 0, +150 and +300 mv) controlled at a pH of 6.5.
1. Soil Incubation.
Glass dessicator bases (Pyrex 412230) were used to contain the soil suspension for
the chemical-availability and plant-uptake studies (Fig. 1). Two hundred and fifty grams of
air-dry soil containing 4g kg-1 finely ground rice straw (to provide an energy source for
microbial activity) and 1750 ml deionized water were placed in and stirred with a magnetic
stirrer. These vessels were used to contain the soil suspension for the chemical availability
and plant uptake studies. In the first experiment, the soil was incubated under oxidizing
and reducing conditions for three weeks by the method of Jugsujinda and Patrick (1977).
In the second experiment, the soil was incubated under conditions of controlled redox
potential and pH by the method of Reddy, Jugsujinda, and Patrick (1976).
2. Transplanting of Rice Seedlings.
At the end of the three-week incubation period a plexiglass plate with ten 30-day old
rice seedlings, prepared as described by Jugsujinda and Patrick (1977), was transferred
onto each vessel and sealed, as shown in figure 2. Nitrogen as urea, phosphorus as
NaH 2PO 4 and potassium as KC1 at rates of 100, 100 and 50 ppm, respectively, were
added at transplanting. Deionized water was added to the soil suspensions every 1 or 2
days to replace the water lost by transpiration. The rice seedlings were allowed to grow
under controlled pH and Eh for three weeks.
3. Controlling of Soil pH and Eh
After transplanting of rice seedlings, the pH of the soil suspension in both experiments
was controlled at the desired pH values by adding either 1N HC1 or 1 N NaOH manually
twice daily through the serum cap according to the treatments. In the: first experiment, soil
Eh was recorded after controling of the soil pHLIn the second experiment, soil Eh was
automatically controlled at the desired Eh values by the system as described by Reddy,
Jugsujinda, and Patrick (1976).

5
4. Plant Growth and Assimilation Rate.
Plant growth parameters measured were: maximum root length, plant height, shoot
and root dry weight, relative growth rate and assimilation rate. The assimilation rate of rice
plants was measured with an ADC LCA-2 Portable Infrared Gas Analyzer at 0, 10, 15 and
20 days after transplanting.
5. Soil Analysis.
Samples of soil solutions were taken at harvesting (3 weeks after growing the rice
plants). The samples were transferred to preweighed centrifuge bottles and immediately
purged with N2 gas for the samples to maintain reducing conditions, then centrifuged at
7000 rpm for 20 minutes. Fractionation for water-soluble, sodium acetate extractable, and
citrate dithionite extractable or reducible forms of nutrients was performed successively by
the following methods.
5.1. Water-soluble Fraction. After centrifuging, supernatants were filtered through
0.45 p.m membrane filters under an inert atmosphere (Patrick and Henderson, 1980;
Delaune et al., 1985). Subsamples of supernatants were acidified to pH 2 by adding 12 N
HC1 and stored for analysis. The remaining aliquot was used to determine electrical
conductivity.
5.2. Sodium Acetate Extractable Fraction. One hundred ml of 0 2.free 1 N sodium
acetate (pH 4.0) was then added to the residual moist soil from water-soluble fractions
while maintaining reducing conditions. This mixture was shaken for 1 hour on mechanical
shaker and centrifuged at 7000 rpm for 20 minutes. The supernatants were filtered
through 0.45 .m membrane filters as described previously and the aliquots stored for
analysis.
5.3. Sodium-Citrate Dithionite Extractable Fraction. Sodium-citrate dithionite
solutions (20%) were prepared just prior to each extraction as sodium-citrate dithionite
loses reducing power with time. After sodium acetate extraction, a mixture of 10 g sodium
citrate and 0.5 g sodium dithionite in 120 ml distilled deionized water was added to residual

6
soils in the centrifuge bottles. The bottles were then shaken for 18 hours and centrifuged
and filtered as before. The mixture was centrifuged for 20 minutes at 7000 rpm. The
supernatants were filtered through a 0.45 p.n membrane filter and the aliquot stored for
analysis.
Ion concentrations of all fractions were determined by Inductively Coupled Argon
Plasma (ICAP) atomic emission spectrometer. Ion activities were calculated by the method
of Lindsay (1979). Electrical conductivity (EC) of the water-soluble extract of the soil was
measured with a Fisher Model 152 Conductivity Meter.
6. Plant Chemical Analysis.
At the end of the three-week experiment period, the shoots and roots of rice plants
were harvested and dried separately at 70'C for 48 hours. The rice shoots and roots were
weighed and chopped into fine pieces. One half gram subsamples were digested with 5 ml
of high-purity nitric acid. Extracts were analyzed on the ICAP to determine the nutrient
content of the shoots.
Results and Discussion
1. Soil Redox Potential (Eh).
The effect of soil pH on avereage values of redox potential of reduced and oxidized
soil conditions (Experiment 1)are shown in Figure 3.When pH levels were controlled, the
redox potential under reduced and oxidized soil conditions was shifted to more or less
constant values at each pH level. Redox potential was constant at about +155, +55, -200,
and -290 mv at pH 4.5, 5.5, 6.5, and 7.5, respectively under reducing conditions. In
contrast, under oxidizing conditions, the redox potentials were constant at about +667,
+616, +587, and +519 my at pH 4.4, 5.5, 6.5, and 7.5, respectively.A redox potential
value of +300 mv at pH 5.0 is ordinarily considered to be a boundary between oxidized
and reduced conditions (Gotoh and Patrick, 1974). The results showed the difference in
the potential values between pH 4.5 and 5.5 (one pH unit) was about 100 mv under

7
reducing conditions and 50 mv under oxidizing conditions. The theoretical value used to
correct Eh data to pH 7.0 is 60 mv.
2. Plant Growth and Assimilation Rate.
2.1. PlantLGrwth. The effect of soil pH on rice growth under reducing and
oxidizing conditions are shown in Table 2. All plants showed chlorotic symptoms, both
those grown at pH 4.5 and 5.5 had leaf discoloration scores twice as high as those grown
at pH 7.5. Under reducing cond.tioais rice leaf blades showed oranging symptoms, roots
had a heavy orange-brown coating on the tip and were blackened at the base. Average root
length, root dry weight and shoot dry weight at pH 4.5 were significantly lower than at
higher pH levels. Under oxidizing conditions, leaf blades showed yellowing symptoms
and roots were reddish-brown at all pH levels. At pH 7.5 root length was significantly
lower than at lower pH levels.
Shoot dry weight was high at pH 6.5 under both reducing and oxidizing conditions,
3.0 and 3.5 g/pot, significantly higher than at other pH levels. Plant height and relative
growth rate of rice under oxidizing conditions were not significantly affected by soil pH.
Und;er reducing conditions, however, these two growth parameters were affected by soil
pH. At pH 4.5 plant height and relative growth rate were lowest, 31.8 cm and 0.3
g/pot/week. As soil pH increased, plant height and relative growth rate were significantly
increased. The maximum plant height (35.4 cm) and relative growth rate (0.5 g/pot/week)
were obtained at pH 6.5 (Table 2).
In experiment 2, where rice plants were grown under controlled soil Eh and pH, the
chlorotic symptoms scores were less than one. Shoot-root ratio, shoot dry weight and
relative growth rate were not affected by soil redox conditions, with the average values of
3.65, 5.32 g/pot and 0.41 g/pot/week, respectively (Table 3). Soil redox conditions did
have a slight effect on root length, plant height and root dry weight. In this experiment,
plant height, root dry weight and shoot dry weight were higher than in the first experiment.

8
The leaf discoloration and poor growth of rice plants that were observed in the first
experiment may have been due to toxicity caused by a high intake of Fe in plant tissue
under reducing conditions at pH 4.5 and 5.5 and by Al toxicity under oxidizing conditions
at all pH levels.
A similar result for Fe toxicity was reported by Jugsujinda and Patrick (1977). Within
a few weeks after transplanting, the impaired plants were retarded in growth, developed
reduced numbers of tillers, produced sterile spikelets, roots are poorly developed and
become black rather than red-brown. Except for an excessive content of Fe, all iron-toxic
plants revealed low or deficient amounts of K and P, often of Zn, and sometimes of Ca and
Mg. Iron toxicity is ascribed to a multiple nutritional soil stress (insufficient supply of K,
P, Ca and Mg), rather than to high levels of active Fe under acid conditions (Ottow et al.,
1983).
2.2. Assimilation Rate. The effects of soil pH on assimilations rate of rice grown
under reducing and oxidizing conditions are shown in Table 4. Under reducing conditions
the assimilation rates were not significantly different at all pH levels after 10 days.
Maximum assimilation rates under all treatments were measured at 15 days. At 15 and 20
days, assimilations rates were significantly lower at pH 4.5 than at higher pH levels.
Under oxidizing conditions, assimilations rates at 15 and 20 days were not significantly
different. In experiment 2, the trend of assimilation rates was generally the same as in the
first experiment (Table 5). Maximum assimilation rates were also found at 15 days after
transplanting, but there was no significant difference among Eh levels.
Decreases in the assimilation rates at 20 days after transplanting were caused by
development of chlorosis of leaves, which limited the regeneration of new leaves in the first
experiment and affected by mutual shading of leaves in the second experiment. When a
population experiences mutual shading for a long period, protein in the lower leaves
decomposes dii to a deficiency in energy source, and amide and amino acid content
increases leading eventually to the production of ammonia. Under such conditions the

9
leaves lose their photosynthesizing capacity and die (Tanaka et al., 1966a). The life of
leaves is therefore shorter if the population ismutually shaded, and even less or limited in
root development, nutrient uptake and translocation through the shoot or leaves. Long and
Hallgren (1985) reported that the highest assimilation rates by C4 plants in the field are 32
66 umol C0 2/m2/sec under full sunlight and favorable conditons. Assimilation rates by
rice in our laboratory conditions are 15-24 umol C02/m2/sec, however.
3. Releases of Nutrient Elements in Soil, Their Contents in Rice Plants,
and Their Relationships in Soil and Plant.
3.1. Forms of Release in Soil. Release of water-soluble (ws), sodium acetate
extractable (ext), and citrate-dithionite extractable or reducible (red) forms of some selected
nutrient elements in soil at different pH levels (Experiment 1), and at different Eh levels
(Experiment 2) are shown in Tables 6-15.
3.1.1. Copper.Zinc, and Molybdenum. In the first experiment, the concentrations
of ws-forms of Cu and Zn were affected by soil pH under both soil conditions.
Concentrations of ws, ext and red-forms of Cu, Zn and Mo were higher under oxidizing
than under reducing conditions at the same soil pH levels (Table 6).
Water-soluble Cu significantly increased with increasing soil pH, to a maximum of
4.7 mg/kg under reducing and 2.32 mg/kg under oxidizing conditions. But, concentrations
of ext-Cu were significantly decreased with an increase of soil pH under reducing
conditions.
Under reducing conditions, ws-Zn significantly decreased from 4.10 to 1.5 mg/kg
with increasing soil pH. Under oxidizing conditions, however, ws-Zn increased to a high
of 8.3 mg/kg at pH 7.5 with an increase of soil pl-. Extractable Zn and red-Zn forms were
not significantly affected by soil pH under either soil condition.
Under reducing conditions, soil pH had little effect on ws-Mo and ext-Mo, and no
effect on red-Mo forms. Under oxidizing conditions these forms were slightly affected by
soil pH, and the ws-Mo tended to increase with increasing soil pH.

10
Concentrations of extractable forms of Cu, Zn, and Mo under both soil conditions
were higher than the water-soluble forms when comparison was made at the same pH
levels.
In a recent study, Patrick and Jugsujinda (1986) also found that, after 60 days of
flooding, concentrations of extractable forms of Cu, Zn, and Mo were higher than their
water-soluble forms
The high concentrations of all forms of Cu, Zni, and Mo in the soils under oxidizing
conditions indicates that submergence resulted in decreases in the concentrations of Cu, Zn,
and Mo in the soil solution. These results are in agreement with the fir.dings of other
workers (Reddy and Patiick, 1977, and Gambrell et al., 1980). Reddy and Patrick (1977)
reported that chelated Cu, Zn, and Mo solution decreased with decreasing Eh from +500
mv (oxidized) to -200 mv (reduced). The instability of Zn and Cu chelates was attributed
to chemical fixation (possibly with sulfide) of added Zn and Cu, ind not due to chemical or
microbial breakdown of metal chelate complex (Reddy and Patrick, 1983). Some of these
metallic cations may be less mobile under reducing conditions because of possible
precipitation with sulfide (Engler and Patrick, 1975). Under reducing conditions, Cu, Zn,
and Mo were complexed by organic matter and also got adsorbed on exchange and organic
sites (Sims and Patrick, 1978). This may explain why, in our study, high concentrations
of all forms of Cu, Zn, and Mo were obtained under oxidixing conditions as compared to
reducing conditions.
In experiment 2, except Mo, the concentrations of water-soluble, extractable and
reducible forms of Cu, and Zn were not affected by soil Eh (Table 7). It may be explained
that the range of soil Eh was narrow and it was not low enough to induce chemical fixation
of Cu, Zn, and Mo.
In general, copper and Zn are subject to various chemical reactions which may increase
or decrease solubility. Patrick, Mikkelsen and Wells (1985) reported that as a consequence
of flooding, Cu and Zn availability is quite pH dependent, and their concentrations decrease

in solubility about 100 times per increase of one pH unit. Reddy and Patrick (1983) also
reported that micro nutrients such as Zn, Cu, Mo, Co, and B were not readily involved in
soil redox conditions. but their solubility and availability were affected by poor aeration.
3.1.2. Ir nd g&±z . The concentrations of all forms of Fe and Mn were
higher under reducing than under oxidizing conditions but pH had only a slight effect on
reducible Fe and Mn forms under oxidizing conditions (Table 8). Under reducing
conditions the concentration of all forms were significantly affected by soil pH under
reducing conditions.
Under reducing conditions, concentrations of ws-Fe and ws-Mn forms were
significantly decreased with increasing soil pH (1,231 to 220 mg/kg for Fe, and 111.5 to
4.45 mg/kg for Mn). Under the same conditions, concentrations of ext-Fe and ext-Mn
were significantly increased with increasing of the soil pH. In this experiment, we also
found that ext-Fe and ext-Mn forms were markedly higher than their water-soluble forms,
especially under reducing conditions.
The decrease in Eh associated with flooding was responsible for the increase in ext-Fe
and ext-Mn at the expense of their water-soluble forms (Gotoh and Patrick, 1974). Results
reported by Patrick and Jugsujinda (1986) suggest that ws-Fe and ws-Mn were largely
adsorbed on the exchange and organic sites in the soil, and only a small amount of Fe
remained in water-soluble forms. Water-solub!. Fe and Mn, which bond weakly to
exchange and organic sites, are reported to be more available to rice plants (Sims and
Patrick, 1978). Iron-toxicity, however, occum when excessive soluble Fe accumulates in
highly reduced soils (Patrick et al., 1985). Our results also indicate that potentially high
levels of ext-Fe and red-Fe extracted from the soil might cause Fe-toxicity to rice plants,
especially under reducing conditions and low pH.
In experiment 2, the concentrations of ws-Fe were significantly decreased when soil
Eh was raised from 0 mv to +150 and +300 my (51 and 18 mg/kg). Soil Eh had slight
effect on ext-Fe, but had no effect on red-Fe (Table 9).

12
Soil Eh had a significant effect on ws-Mn and a slight effect on ext-Mn forms as both
forms of Mn decreased throughout the Eh range of the experiment. Increasing soil Eh
caused a significant increase in red-Mn. In our study, where soil pH was controlled at 6.5,
Eh appeared to have marked effect on Fe and Mn. Gotoh and Patrick (1972, 1974),
likewise, reported that both water-soluble and exchangeable Fe and Mn increased with a
decrease in Eh and pH. At pH 5, the effect of Eh was minimal on Mn 2+ solubility, while
between pH 6 and 8 the conversions of insoluble Mn 4+ to Mn+ 2 was dependent on both
Eh and pH. Reducible Fe became unstable when Eh was between +300 and +100 mv at
pH 6 and 7, and -100 mv at pH 8.
3.1.3. A uminum. The concentration of all forms of Al were significantly affected
by soil pH under oxidizing conditions, and higher than under reducing conditions (Table
10). Under oxidizing conditions the concentration of ws-Al was siguificantly decreased
when soil pH was increased above 5.5. Under reducing conditions, the concentration of
ws-AI was very low and was not affected by soil pH.
The high concentration of Al in the soil, especially under oxidizing conditions
indicated that this soil has potential to cause Al-toxicity, regardless of soil pH. Hargrove
(1986), who measured A] concentrations after oxidation, reported that Al-organic matter
solubilized in the range of pH 5 to 7 and may be subject to plant uptake. This same
mechanism may explain Al uptake and plant growth depression at near neutral soil pH
values in this study.
Under controlled Eh in experiment 2, the concentration of Al in both ws and ext forms
were significantly affected by soil Eh conditions, but soil Eh have no effect on red-Al
forms. At Eh-150 my, ws-Al was significantly lower than ws-AI at higher Eh levels (Tatle
11).
3.1.4. Calcium and Magne.ium. In experiment 1 soil pH had little or no effect on
the concentration of Ca and Mg forms under reducing and oxidizing conditions (Table 12).
In general, concentrations of ws-Ca and ws-Mg under reducing conditions were higher

13
than under oxidizing conditions. The same results were observed in experiment 2 (Table
i3).
Our results are similar to those of Patrick and Jugsujinda (1986) who found that
extractable Ca and Mg were slightly higher than water-soluble Ca and Mg after flooding.
Apparently, flooding had a little effect on distribution and concentration of Ca and Mg.
This was expected because Ca and Mg do not undergo oxidation-reduction reaction like Fe
and Mn.
Although Ca and Mg are not directly involved in soil redox conditions, their
concentrations in the water-soluble form have been found to increase following flooding
(Ponnamperuma, 1972, van Breeman, 1976).
3.1.5. Phosphorus. PotassiumandSilicon. Concentrations of all forms of P were
higher under oxidizing than reducing conditions. Extractable P was about 10-fold higher
under oxidizing than under reducing conditions. The decrease in P with flooding (reduced)
may be explained by adsorption-desorption processes which controlled its concentration in
soil solution. Soil pH had a little effect on ws-P and ext-P and no effect at all on red-P
under both conditions (Table 14). Concentration of ws-P under reducing conditions was
significantly lower at pH 4.5 (2.05 mg/kg) and significantly increased with increasing soil
pH.
Under oxidizing condition, soil pH had a significant effect on the all P forms. At pH
4.5 ws-P was 6.8 mg/kg and significantly lower than at higher pH levels. Water-soluble P
gradually increases to 13.6 mg/kg at pH 7.5. An increase in ws-P with increasing soil pH,
considered without regard to redox conditions, was found by other workers. Increasing
soil pH increases the solubility of ferric phosphate and aluminum phosphate, but decreases
the solubility of calcium phosphate (Lindsay and Morreno, 1960), and a decrease in pH
favors the solubility of calcium phosphate as well as that of ferrous and manganous
phosphate (Stumm and Morgan, 1970). Brady (1974) found that the maximum solubility
of P in the soil occurs at the pH range of 6 to 7.

14
Patrick and Khalid (1974) reported that in Crowley silt loam soil (Typic Albaqualf)
more P was adsorbed under reducing than under oxidizing conditions when P
concentration in the soil was high. They attributed differences in behavior of phosphate
under reducing and oxidizing conditions to changes brought about in ferric oxyhydroxide
concentrations by soil reduction.
Like P, concentrations of all forms of K were lower under reducing than under
oxidizing conditions (Table 14). Under reducing conditions, concentration of ws-K was
not affected by soil pH, while concentration of ext-K was significantly increased at soil pH
above 5.5. Under oxidizing conditions, each form of K was significantly affected by soil
pH, and tended to increase with increasing soil pH up to 6.5. The ws-K and ext-K forms
were higher under oxidizing than under reducing conditions. In a recent study, Patrick and
Jugsujinda (1986) found that after flooding, however, water-soluble K was decreased by
seven fold as compared to extractable form.
The concentrations of all Si forms were significantly affected by soil pH under both
reducing and oxidizing conditions. Under reducing conditions concentration of Si was
significantly lower at pH 7.5 as compared to pH 4.5, but under oxidizing conditions it
increased significantly. Extractable Si forms were higher under oxidizing than under
reducing conditions (Table 14). In experiment 2, where both soil Eh and pH were
controlled ext-Si concentrations were significantly higher at Eh -150 and 0 my (96.5 and
83.5 mg/kg) than at Eh +150 and 300 mv (47.5 and 24.5 mg/kg). Concentrations of ws-Si
were lower at low Eh than at high Eh levels (Table 15).
In general, flooding increases the concentration of Si. Increases in soluble Si are
associated with decreased pH, and the reduction of amorphous Al and ferric hydroxide
forms in flooded soils (Patrick et al., 1985). Precipitation of iron causes a decrease in
soluble Si0 2 concentration, and the reduction of ferri-silica complexes liberates silica.
Therefore, reversible changes in the solubility of silica appear to be associated with the
oxidation-reduction iron (Ponnamperuma, 1965). It has also been reported that the readily

15
soluble Si in soil is either adsorbed on exchange sites or combined with amorphous
aluminum and ferrous hydroxide (Yoshida, 1981).
3.2. Nutrient Elements Contents in Rice Plants. Selected nutrient elements
contents in the rice plants at the controlled pH levels of experiment 1 are shown in Table 16
and those at the controlled Eh levels of experiment 2 in Table 17.
3.2.1. Copper. Zinc. and Molybdenum. The content of Cu and Zn in the rice
shoots tended to decrease with increasing pH under both reducing and oxidizing
conditions, but stayed within the normal range. While Mo contents in the shoots were not
affected by pH under reducing conditions it was significantly increased under oxidizing
conditions (Table 16).
The critical levels for Zn deficiency and toxicity, 10-15 mg/kg and 1500 mg/kg are
reported (Sedberry et al., 1971; 1978) and the critical levels for Cu in deficiency and
toxicity are <6 mg/kg and 30 mg/kg (Yoshida 1981).
The Mo content under reducing conditions at all pH levels was less than 1.0 mg/kg,
but under oxidizing conditions it ranged from 6.38 mg/kg at pH 4.5 to 9.58 mg/kg at pH
7.5. The critical levels for Mo deficiency and toxicity in the rice shoot have not been
defined, but Patrick et al. (1985) suggest that the concentrations of Mo less than 2 mg/kg
can be toxic to rice plants.
In experiment 2, the content of Cu, Zn, and Mo in the rice shoots significantly
decreased with increasing Eh values (Table 17).
It has been reported that soil reduction depresses both the concentrations of Zn in the
solution of flooded soils and Zn uptake by rice plants (TRRI, 1970). Decreased Zn uptake
by rice plants may also be due to formation of sulfide and possibly production of organic
complexing agents brought on by soil reduction as suggested by Ponnamperuma (1972).
3.2.2. Iron and Manganese. The content of Fe was higher under reducing than
oxidizing conditions. Under both conditions the content of Fe decreased significantly as

16
the soil pH was raised from 4.5 to 6.5, and thereafter remained insignificant decrease
(Table 16).
Increased concentration of Fe in the soil caused by intense reduction and low pH
appear to increase Fe uptake by rice plants. Gotoh and Patrick (1974) also found that the
content of Fe was highly pH dependent. Poor growth of plants which was observed
especially at pH 4.5 and 5.5 under reducing conditions may have been due to the high
amount of Fe in the rice shoots (5,304 and 674 mg/kg). At these two pH levels the plants
may have suffered from Fe toxicity, as the Fe content is higher than threshold toxicity level
of 300 mg/kg as reported by Yoshida (1981). Ponnamperuma (1972), and van Breeman
and Morman (1978) reported that the combination of high concentrations of soluble Fe and
low pH cause Fe toxicity to plants. Iron content above 300 mg/kg in the leaf blade has also
been reported to be toxic to the rice plants (Tanaka et al., 1966b; IRRI, 1969).
The content of Mn in the rice shoot was significantly higher at pH 4.5 than at higher
pH levels under both soil conditions and tended to decrease with increasing pH levels
(Table 16). The Mn content in the rice shoots was well below the critical levels for Mn
toxicity of 2,500 mg/kg (Yoshida, 1981). Tadano and Yoshida (1978) suggested that a
high manganese content in the rice tissue is frequently associated with high yields. In this
study, however, pH 4.5 gave the highest Mn contents, but shoot dry weights were very
low. This may have been due to the high content of Fe and Al in the rice plants.
Studies conducted on Mn availability to rice have often been contradictory. Some
investigators (Clark et al., i957; Chaundry and McLean,1963; Jugsujinda and Patrick,
1977; and Patrick and Jugsujinda, 1986) have reported that flooding a soil greatly increased
Mn uptake by rice while others (Sinewirante and Mikkelsen, 1961) reported that it caused a
decrease in uptake. Patrick and Fontenot (1976) found that flooding had little or no effect
on Mn uptake by rice.
In experiment 2, Soil Eh had a significant effect on Fe content (Table 17), but Fe
content in the shoots was below the critical level for Fe-toxicity. The symptoms of Fe

17
toxicity therefore did not occur. it may be that the level of soil pH controlled at 6.5 was not
low enough to induce Fe-toxicity. Soil Eh did not affect on Mn content in the shoots.
3.2.3. Aluminum. The content of Al was higher under oxidizing than under
reducing conditions. The Al content in the rice shoots under oxidizing ,onditions
decreased from 709 mg/kg at pH 4.5 to 655 mg/kg at pH 7.5 (Table 16). Since these
values are higher than threshold toxicity level of 300 mg/kg reported by Yoshida (1981),
the rice plants may have suffered Al-toxicity at all pH levels under oxidizing conditions.
Wagatsuma (1984) found direct relationship between Al-uptake and Al in the medium,
but others have found no relationship (Succoff and Ohno, 1986 and Jugsujinda et al.,
1985). In experiment 2, peculiarly, although soil Eh was controlled and pH maintained at
6.5, Al content in the shoots at all Eh levels was still higher than threshold level for Al
toxicity. The average Al content ranged from 693 mg/kg at -150 mv to 713 mg/kg at +150
mv (Table 17). These high Al ccncentrations in the soil may have enhanced the release of
Al to the soil solution.
3.2.4. Calcium and Magnesium. Calcium content ranged from 1,816 to 5,297
mg/kg (0.18 to 0.53 %) under reducing conditions and from 1,768 to 2,990 mg/kg (0.18
to 0.30 %) under oxidizing conditions. Magnesium content ranged from 2,905 to 3,867
mg/kg (0.29 to 0.39 %) under reducing conditions and from 2,177 to 3,221 mg/kg (0.22
to 0.32 %) under oxidizing conditions (Table 16). Both Ca and Mg contents were above
the critical levels (0.15 % and 0.10 %) for deficiencies of these nutrients (Tanaka and
Yoshida,1970 and Yoshida,1981). Calcium and Mg are displaced from cation exchange
sites during flooding, which increases their concentration in the solution (Patrick et al.,
1985). Moreover, Ca and Mg deficiencies seldom occur in flooded rice because wetland
soils and irrigation water are usually well-supplied with these elements.
In experiment 2, soil Eh had little effect on Ca and Mg content and their uptake by rice
plants. The Ca content in the shoots ranged from 1,924 to 3,581 mg/kg (0.19 to 0.36%),
and Mg content from 2,524 to 3,888 mg/kg (0.25 to 0.39%) (Table 17).

18
3.2.5. Phosphorus.Potassium,andSlico. Phosphorus content in the rice shoots
under reducing and oxidizing conditions were not affected by soil pH, but P content in the
shoots were higher under reducing than under oxidizing conditions, with average values of
4,157 mg/kg (0.42%) and 2,449 mg/kg (0.25%), respectively (Table 16). These values
were above the threshold deficiency levels of 0.1% as reported by Tanaka and Yoshida
(1970).
Ottow et al. (1983) observed that the P content of rice leaves with clear symptoms of
Fe toxicity ranged from 0.1 to 0.2%. In the present study, the shoot P apparently was
adequate. This may be due to release of P during incubation period. Patrick et al. (1985)
reported that saturating the soil with water increases the availability of P to rice crops.
Soil pH significantly affects the content of K in rice shoots under oxidizing, but not
under reducing conditions. The content of K in the rice shoots under reducing and
oxidizing conditions was about equal when compared at the same pH level, indicating that
oxidation-reduction conditions have no effect on K content in rice shoots. The K content
recorded under reducing conditions ranged from 25,261 mg/kg (2.5 %) at pH 4.5 to
19,004 mg/kg (1.9 %) at pH 7.5; while under oxidizing conditions it ranged from 25,211
mg/kg (2.5 %) at pH 4.5 to i6,685 mg/kg (1.7 %) at pH 7.5. These values were above
the 1.0% critical levels of K deficiency (Tanaka and Yoshida, 1970).
The content of Si in the rice shoots was not affected by soil pH under either soil
condition (Table 16). These contents are below the 5% threshold deficiency level (Tanaka
and Yoshida, 1970). Yoshida (1981) reported that the application of silicates in the field
was beneficial for rice growth when silica content of straw residue was below 11 %, but in
solution culture the addition of silicon had little effect on vegetative growth when silica
content in the leaves was as low as 0.07% (Yoshida, 1981) and applications of Si had no
effect on rice growth and yield when its content in green leaves was above 1.25%
(Yoshida, 1981).

19
In experiment 2, the contents of P, K, and Si in the rice shoots were not affected by
soil Eh (Table 17). Their contents were 3,730 mg/kg (0.37 %),2,284 mg/kg (0.23 %),
and 336 mg/kg (0.037 %),respectively. The content of Si was still lower than threshold
deficiency levels, and therefore the rice plants may have been suffering from Si deficiency
in both experiments. The results reported by Patrick and Jugsujinda (1986) also indicate
that rice grown in Sumatra Oxisol was Si-deficient.
3.3. Relationship Among Selected Nutrient Elements in the Soil and Their Uptake
by Rice Plants,
3.3.1. opper. Zinc. and Molybdenum. Concentrations of water-soluble Cu in the
soil were negatively correlated with uptake by rice plants under both reducing and oxidizing
conditions under oxidizing conditions (Table 18). Extractable Cu, however, were
positively correlated with their rice uptake (Table 19). No relationships between Mo
uptake and ws-Mo, or between ext-Mo and Mo uptake were observed under reducing conditions, but both forms were positively correlated with Mo uptake under oxidizing
conditions (Tables 18 and 19). In experiment 2, there was no relationship between water
soluble and extractable Cu and Zn and their uptake by rice. Uptake of Cu and Zn were
positively correlated with ws-Fe and Mn and negatively correlated with ws-Mo, Si, P and
Al. Uptake of Mo was positively correlated with ws-Fe, ws-Mn and ext-Mo, and
negatively correlated with ws-Si, P and Al (Tables 20 and 21).
3.3.2. Iron and manganese The uptake of Fe was significantly related to ws-Fe
concentrations (r= +0.962**) and Fe2+ activity (r= +0.976**) under reducing, but not
under oxidizing conditions (Tables 18 and 22). There was no relationship between ws-
Mn, ext-Mn, or Mn2+ activity and Mn uptake under reducing conditions, whereas under
oxidizing conditions Mn uptake was significantly related to ws-Mn (r= +0.99**) and
Mn 2+ activity (r= +0.934**) (Table 18, 19 and 22).

20
In experiment 2, there were no correlations between ws-Mn and Mn-uptake, or
between ext-Mn and Mn-uptake by rice. Water-soluble and extractable Fe, were positively
correlated with Fe uptake by rice (r= +0.873**, +0.864**) (Tables 20 and 21).
3.3.3. Aluminum. Aluminum uptake by rice plants was positively correlated with
ws-Al (r= +0.658*), but had no relationships to A13+ activity under oxidizing conditions.
Also, no relationships between Al uptake and ws-Al, of between Al-uptake and A13 +
activity were observed under reducing conditions. In experiment 2, water-soluble Al and
ext-Al were not correlated to Al uptake by rice (Tables 20 and 21).
3.3.4. Calcium and Magnesitiu. Under oxidizing conditions, ws-Ca and Ca2 +
activity were negatively correlated with Ca uptake (r= -0.881** and -0.692*). No
relationship was observed between ws-Ca, ext-Ca or Ca 2+ activity in the soil to Ca uptake
by rice plants grown under reducing conditions. Also, no relationship between ws-Mg,
ext-Mg or Mg2+ activity to Mg uptake was observed under either conditions (Tables 18, 19 and 22). In experiment 2, water-soluble and extractable Ca and Mg had no relationship
with their uptake by rice plants (Tables 20 and 21).
3.3.5. Phosphorus. Potassium,and Silicon. The phosphorus uptake by rice plants
under reducing conditions was positively correlated with ws-P and negatively correlated
with water-soluble forms of Zn, Fe, Mn, Ca, Mo and Si (Table 18). Under reducing
conditions, P uptake was negatively correlated with activities of Z12+, Fe2+, and Mn2+,
but positively correlated with Ca 2 + activity (Table 22). Under oxidizing conditions, only
the activity of Ca 2+ was negatively correlated to P uptake.
No relationships between K uptake and ws-K, and between K uptake and ext-K in the
soil were observed under either soil condition. K uptake was negatively correlated with
ws-P under reducing conditions. The uptake of K under oxidizing conditions was
negatively correlated with water-soluble forms of Cu, Zn, Ca, Si and P. Activities of Zn2 +
and Ca 2 + were negatively and ws-Al and A13 + activity were positively correlated with K

21
uptake. Also, no relationships between Si uptake and ws-Si, ext-Si, and Si4+ activities
was observed under either soil condition (Tables 18, 19 and 22).
In experiment 2, no relationships between P, K, and Si uptake by rice plants and their
water-soluble forms were observed. Extractable P, Si, Mo, Mg, Fe, and Zn was positively
correlated with P uptake, while K uptake was positively correlated with ext-Zn and ext-Fe
(Tables 20 and 21).
Summary and Conclusions
To study metals and nutrients release and their uptake by rice in a flooded Oxisol of
Sitiung Transmigration area of Sumatra, we conducted two laboratory experiments. In the
first experiment, rice plants were grown in reduced and oxidized soil suspensions with pH
levels controlled at 4.5, 5.5, 6.5, or 7.5. In the second experiment, rice plants were
grown on the soil suspension with pH was controlled at 6.5 and the Eh controlled at -150,
0, +150, and +300 mv.
In the first experiment, at pH 4.5 the reduced soil released significantly higher
amounts of water-soluble Zn, Fe, Mn, and Mo concentrations into the soil solution than at
pH 5.5, 6.5, and 7.5. Under reducing conditions and at pH 4.5, the rice plants also
absorbed significantly higher concentrations of Zn, Fe, and Mn as well as Ca, Mg, and Al.
The contents of Fe observed at pH 4.5 was 5304 mg/kg, and at pH 5.5 was 674 mg/kg
under reducing conditions, both were above the critical level of Fe toxicity of 300 mg/kg,
indicating that the rice plants may have suffered from Fe toxicity at these two pH levels.
Under oxidizing conditions the soil released significantly higher amounts of water
soluble Al and Mn at pH 4.5 than at other pH levels. The content of Al in the rice plants
ranged from 709 mg/kg at pH 4.5 to 655 mg/kg at pH 7.5 and both were above the critical
level of Al toxicity of 300 mg/kg. Therefore, iice plants may also have suffered from Al
toxicity at all pH levels under the oxidizing conditions.
22
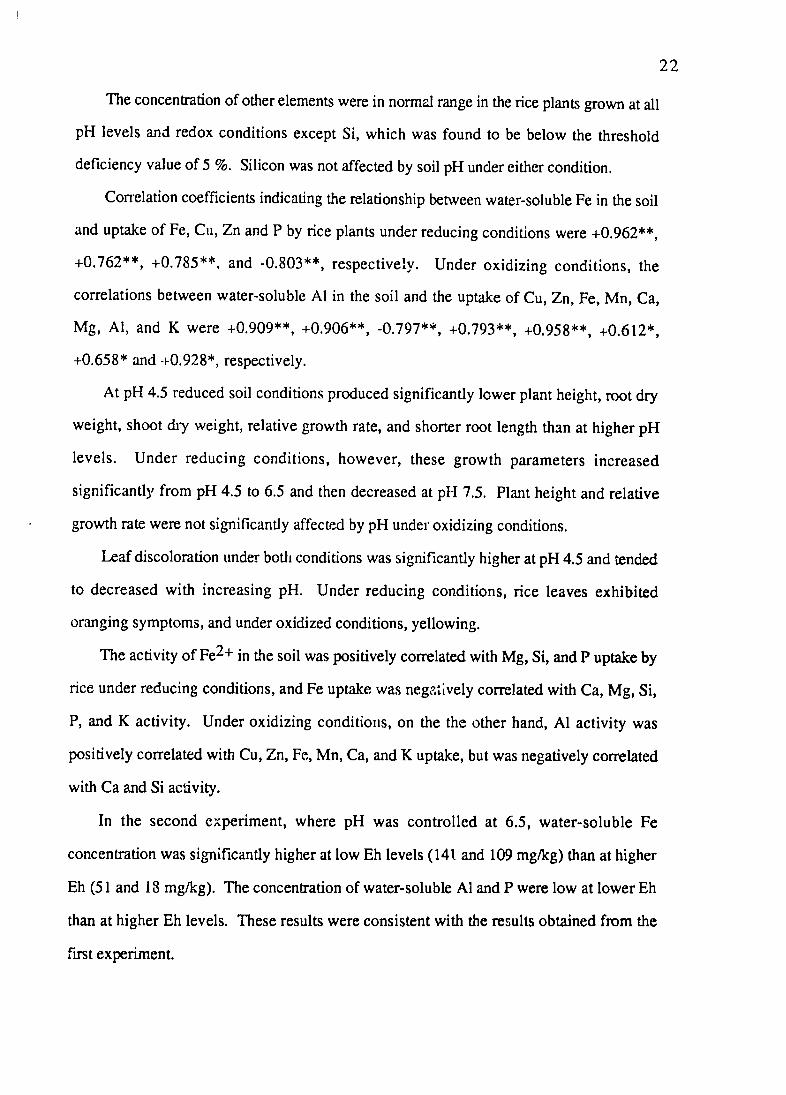
The concentration of other elements were in normal range in the rice plants grown at all
pH levels and redox conditions except Si, which was found to be below the threshold
deficiency value of 5 %. Silicon was not affected by soil pH under either condition.
Correlation coefficients indicating the relationship between water-soluble Fe in the soil
and uptake of Fe, Cu, Zn and P by rice plants under reducing conditions were +0.962**,
+0.762**, +0.785**, and -0.803**, respectively. Under oxidizing conditions, the
correlations between water-soluble Al in the soil and the uptake of Cu, Zn, Fe, Mn, Ca,
Mg, Al, and K were +0.909**, +0.906**, -0.797**, +0.793**, +0.958**, +0.612*,
+0.658* and +0.928*, respectively.
At pH 4.5 reduced soil conditions produced significantly lower plant height, root dry
weight, shoot diy weight, relative growth rate, and shorter root length than at higher pH
levels. Under reducing conditions, however, these growth parameters increased
significantly from pH 4.5 to 6.5 and then decreased at pH1 7.5. Plant height and relative
growth rate were not significantly affected by pH under oxidizing conditions.
Leaf discoloration under both conditions was significantly higher at pH 4.5 and tended
to decreased with increasing pH. Under reducing conditions, rice leaves exhibited
oranging symptoms, and under oxidized conditions, yellowing.
The activity of Fe2+ in the soil was positively correlated with Mg, Si, and P uptake by
rice under reducing conditions, and Fe uptake was negatively correlated with Ca, Mg, Si,
P, and K activity. Under oxidizing conditions, on the the other hand, Al activity was
positively correlated with Cu, Zn, Fe, Mn, Ca, and K uptake, but was negatively correlated
with Ca and Si activity.
In the second experiment, where pH was controlled at 6.5, water-soluble Fe
concentration was significantly higher at low Eh levels (141 and 109 mg/kg) than at higher
Eh (51 and IS mg/kg). The concentration of water-soluble Al and P were low at lower Eh
than at higher Eh levels. These results were consistent with the results obtained from the
first experiment.

23
The content of the various elements in the rice shoots was in the normal range, except
Al which was also found to be higher than the critical level for toxicity, and Si which was
lower than the critical level for deficiency at all Eh levels. The content of Cu, Zn, Fe, Ca,
Mg, Mo, and Al were affected by Eh, but Mn, Si, P, and K were not. In this experiment
there was no Fe toxicity recorded because the soil pH was not low enough to cause the
toxicity.
The shoot dry weight, relative growth rate, and shoot root ratio were not affected by
soil Eh levels studied. Root length, however, was significantly increased whereas plant
height, and root dry weight were significantly decreased at Eh of 0 mv. Plants grown at Eh
+150 and +300 mv showed significantly higher assimilation rates at 15 and 20 days after
transplanting than at lower Eh values.
Leaf discoloration appeared to be more pronounced at pH 4.5 and 5.5 than at higher
pH levels under both soil conditions. Water-soluble Fe was negatively correlated with P
uptake and positively correlated with Fe uptake. Iron uptake by rice was positively
correlated with leaf discoloration under reducing conditions.
The findings of the present study identify problems of Fe toxicity in lowland (reducing
conditions), Al toxicity in upland soils (oxidizing conditions), and Si deficiency for rice
under both soil conditions in the flooded Sumatra Oxisol. It may be concluded from the
foregoing results that factors limiting growth of rice appeared to be Fe toxicity at pH 4.5
and 5.5 under reducing conditions and Al toxicity at all pH levels under oxidizing
conditions. Si deficiency was observed in both experiments regardless of soil conditions
and pH levels studied.
It is suggested that future research be directed towards alleviating the Fe toxicity in
lowland, Al toxicity in upland, and Si deficiency in both soils of the Sitiung Transmigration
Areas of Sumatra, Indonesia. More specifically, research project- should be conducted in
the field to evaluate: (i) water management practices; drained versus undrained, (ii) kinds

24
of soil amendments and fertilizers; chemical versus organic matter additions, and (iii) Fe
tolerant rice varieties.

25
References Brady, N. C. 1974. Nature and properties of soils. 8th ed. MacMillan, New York. 639
P.
Chaundry, M. S., and E. 0. McLean. 1963. Comparative effects of flooded and unflooded soil conditions and nitrogen applic.tin on growth and nutrient uptake by rice plants. Agron. J. 55:565-567.
Clark, F., D. C. Nearpass, and A. W. Sprecht. 1957. Influence of organic additions and flooding on iron and manganese uptake by rice. Agron. J. 48:586-589.
Driessen, P. M., and M. Soepraptorahardjo. 1974. Soils for Agricultural Expansion in Indonesia. Soil Res. Ints. Bogor. Bull. No. 1:1-63.
Engler, R. M., and W. H. Patrick, Jr. 1975. Stability of sulfides of manganese, iron, zinc, copper, and mercury in flooded and nonflooded soils. Soil Sci. 119:217-221.
Gambrell, R. P., R. A. Khalid, and W. H. Patrick, Jr. 1980. Chemical availability of mercury, lead, and zinc in Mobile Bay sediment suspensions as affected by pH and oxidation-reduction conditions. Environ. Sci. Tech. 14:431-436.
Gotoh, S., and W. H. Patrick, Jr. 1972. Transformation of manganese in a waterloggedsoil as influenced by redox potential and pH. Soil Sci. Soc. Am. Proc. 36:738-742.
Gotoh, S., and W. H. Patrick, Jr. 1974. Transformation of iron in a waterloged soil as influenced by redox potential and pH. Soil Sci. Soc. Am. Proc. 38:66-71.
Hargrove, W. L. 1986. The solubility of aluminum-organic matter and its implication in plant uptake of aluminum. Soil Sci. 142(3):179-181.
IRRI. 1969. Annual Report. International Rice Research Institute. Los Banos, Philippines. 266 p.
IRRI. 1970. Annual Report. International Rice Research Institute. Los Banos, Philippines. 263 p.
Jugsujinda, A., and W. H. Patrick, Jr. 1977. Growth and nutrient uptake by rice in a flooded soil under controlled aerobic-anaerobic and pH conditions. Agron. J. 69:705710.
Jugsujinda, A., A. Syarifuddin, K., and W. H. Patrick, Jr. 1985. Some management practices for lowland rice production in a Sitiung newly opened area of Sumatra. Agronomy Abstracts, 1985 Annual Meetings. ASA, CSSA, SSSA. Chicago, Illinois. pp. 175.
Lindsay, W. L., and E. C. Moreno. 1960. Phosphate phase equilibria in soils. Soil Sci. Soc. Am. Proc. 24:177-182.
Lindsay, W. L. 1979. Chemical equilibria in soils. John Wiley & Sons, New York. 449 p.
Long, S. P., and J. E. Hallgren. 1985. Measurement of CO 2 assimilation by plants in the field and the laboratory. pp. 62-94. In J. Coombs et al. ed. Techniques in Bioproductivity and Photosynthesis. 2nd edition Pergamon Press.

26
Lucas, R. E., and B. D. Kneseck. 1972. Climatic and soil conditions promoting soil m,':ronutrient deficiency in plants. Micronutrients in Agriculture. SSSA. pp: 265283.
Mahapatra, I. C., and W. H. Patrick, Jr. 1969. Inorganic phosphate transformation in waterlogged soils. Soil. Sci. 107:281-288.
Meek, B. D., and L. B. Grass. 1975. Redox potential in irrigated desert soils as an indicator of aeration status. Soil Sci. Soc. Am. Proc. 39:870-875.
Ottow, J. C. G., G. Benckiser, I. Watanabe, and S. Santiago. 1983. Multiple nutritional soil stress as the prerequisite for iron toxicity of wetland rice (Qrjz ali~ L.). Trop.Agric. (Trinidad) 60:102-105.
Patrick, W. H., Jr., and R. A. Khalid. 1974. Phosphate release and sorption by soils and sediments. Science 186:53-55.
Patrick, W. H., Jr., and W. J. Fontenot. 1976. Growth and mineral .omposition of rice at various soil moisture tensions and oxygen levels. Agron. J. 68-325-329.
Patrick, W. H., Jr., D. S. Mikkelsen, and B. R. Wells. 1985. Plant nutrient behavior in flooded soil. p 197-227. In Fertilizer Technology and Use (3rd Edition). Soil Sci. Soc. Am., Madison, WI.
Patrick, W. H., Jr. and A. Jugsujinda. 1986. Redox and pth chemistry and nutrient uptake by rice in flooded oxisols of Sitiung area of Sumatra, Indonesia. A Technical Report No. 1. USAID Grant in Cooperation with The Center for Soil Research, Bogor and The Sukarami Research Institute for Food Crops, Padang, West Sumatra. Unpublish: 50 p.
Ponnamperuma, F. N. 1965. Dynamic aspects of flooded soils and the nutrition of the rice plant. p. 295-328 In F.N. Ponnamperuma (ed.) The Mineral Nutrition of Rice Plants. John Hopkins Press, Baltimore, MD.
Ponnamperuma, F. N. 1972. The chemistry of submerged soils. Adv. Agron. 24:29-96.
Redman F. H. and W. H. Patrick, Jr. 1965. Effect of submergence on several biological and chemical soil properties. Louisiana Agr. Exp. Sta. Bull. 592.
Reddy, C.N., A. Jugsujinda, and W. H. Patrick, Jr. 1976. System for growing plants under controlled redox potential-pH conditions. Agron. J. 68:987-989.
Reddy, C. N. and W. H. Patrick, Jr. 1977. Effect of redox rotential on the stability of zinc and copper chelates in flooded soils. Soil Sci. Soc. Am. J. 41:729-732.
Reddy, K.R. and W.H. Patrick, Jr. 1983. Effects of aeration on reactivity and mobility of soil constituents. pp. 11-33. In Chemical Mobility and Reactivity in Soil System. ASA, SSSA, Madison, WI.
Sedberry, J.E., Jr., F.J. Peterson, E. Wilson, A.L. Nugent, R.M. Engler, and R.H. Brupbacher. 197 1. Effects of Zinc and other elements on the yield of rice and nutrient content of rice plants. Louisiana Agr. Exp. Sta. Bull, 653.
27 Sedberry, J.E., Jr., P.E. Schilling, F.E. Wilson, and F.J. Peterson. 1978. Diagnosis andcorrection of Zinc problems in rice production. La. Agr. Exp. Sta. Bull. 708:1-4. Senewiratne, S.T., and D.S. Mikkelsen. 1961. Physiological factors linking growth andyield of Q z. sti under unflooded conditions. Plant Soil. 14:127-146. Sims, J.L., and W.H. Patrick, Jr. 1978. The distribution of micronutrient cations in soilunder conditions of varying redox potential and pH. Soil Sci. Soc. Am. J. 42:256
262.
Stumm, W., and J.J. Morgan. 1970. Aquatic chemistry. Wiley Interscience, New York.583 p.
Succoff, E. and T. Ohno. 1986. Effect of soil aluminum on the growth and chemicalcomposition of red spruce. Agron. Abst. Annual Meetings 1986. ASA. CSSA. SSSA.New Orleans, Louisiana. p. 268. Tadano, T., and S. Yoshida. 1978. Chemical changes in submerged soils and their effecton rice growth. p. 399-430. In. Soil and Rice. International Rice Research InstituteLos Banos, Laguna, Philippines. Tanaka, A., K. Kawano and J. Yamaguchi. 1966a. Photosynthesis, respiration, and planttypes of the tropical rice plant. The International Rice Research Institute. Los Banos,Laguna, Philippines. Tech. Bull. 1:3-46. Tanaka, A., R. Loe, and S.A. Navasero. 1966b. Some mechanisms involved in thedevelopment of iron toxicity symptoms in the rice plant. Soil Sci. Plant Nutr. 12:158164.
Tanaka, A., and S. Yoshida. 1970. Nutritional disorders of the rice plant in Asia. IRRITech. Bull. 10, 51 pp. Team LPT. 1979. Soil Survey of the Irrigation Project Area, Sitiung-S.Jujuhan, WestSumatra. Within the framework of technical cooperation with Directorat of Irrigation,Ministry of Public Works, AARD-Dept. Agric. Indonesia. Turner, F.T., and W.H. Patrick, Jr. 1968. Chemical changes in waterlogged soils as aresult of oxygen depletion. Int. Congr. Soil Sci., Trans. 9th, Adelaide, Australia,
IV:53-65.
van Breeman, N. 1976. Genesis and Solution cbemistry of acid sulfate soils in Thailand.Agric. Res. Rep. (Versl. Landbouwkd. Onderz.) 848, PUDOC, Wageningen. 2 63p. van Breemen, N. and F.R. Moorman. 1978. Iron toxicity soils. pp. 781-800. In Soil andRice, International. Rice Research. Institute., Los Banos, Philippines. Wagatsuma, T. 1984. Characteristics of upward translocation of aluminum in plants. SoilSci. Plant Nutr. 30:345-358. Wagatsuma, T., M. Kanekos and Y. Hayasaka. 1987. Destruction of process of plantroot cells by aluminum. Soil Sci. Plant Nutr. 33:161-175. Yoshida, S. 1981. Fundamentals of rice crop science. Int. Rice. Res. Inst. Los Banos,Laguna., Philippines. 269 p.

46
I-7
35
1. Gas Inlet 7. Serum Cap 2. Desiccator Base 8. Plexiglass Plate3. Soil Suspension 9. Plastic Rubber Seal
4. Platinum Electrodes 10. Distilled Water 5. Gas Outlet i11. Gas Pipe6. Rubber Stopper
Fig. i. The apparatus for incubation of the soil suspion on at controlled phI or redox potential conditions.

(a)
Permagum seal
Rubber stopper Platinum electrode
inle Gas
j-Serum cap
Gas outlet
Plexiglass Plastic-rubber seal
Desiccator Distilled base water
Soil suspension ar
Magnetic Strrer
(b)
Gas inletPlatinum elect-ode PltPlainum lectode
Opening for plant(6ramDia.) ....
I" 1 (2ramopening)
Gas outlet
Rubber .. stopper Serum cap
sOpening for pH elect-ode
Fig. 2. Diagram of growth set up after transplanting rice (a) and a plexiglass plate (b)designed for use in suDooring rice seedlings in controlled system

800
600
E m 400w
* 200
0
Oxidized
-4004.5 5.5 6.5 7.5
pH
Figure 3. Effect of soil pH on average values of redox potential (Eh) of reduced and oxidized soil conditions.

---------------------------------------------------------------
-----------------------------------------------------------------
- - - - - - - - - - - - - - - - - - - - - - - - - - - - - - - - -
Table 1. Some soil chemical and physical characteristics of the representative top soil layer (25 cm).
Soil characteristics Value
pH (1:1 soil:water ratio) 4.1 Organic matter 2.3 % C/N ratio 10.3 CEC-clay 15.5 me/100 g Extractable Ca (IN NH4OAc, pH 4.0) 0.6 me/100 g Extractable Mg (IN NH4OAc, pH 4.0) 0.9 me/100 g Extractable K (IN NH4OAc, pH 4.0) 0.3 me/100 g Extractable Na (iN NH4OAc, pH 4.0) 0.1 me/100 g Extractable Al (IN NH4OAc, pH 4.0) 3.1 me/100 g Extractable Fe (DPTA-TEA) 69.0 mg/kg Extractable Mn (DPTA-TEA) 36.0 mg/kg Extractable Zn (DPTA-TEA) 0.6 mg/kg Extractable Cu (DPTA-TEA) 0.8 mg/kg Sand 31.9 % Silt 11.9 % Clay 56.2 %

Table 2. Effect of soil pH on leaf discolorations and growth parameters of rice plants grown under reduced and,oxidized soil conditions in a flooded Oxisol.*
pH Red Ox Red Ox Red Ox
Leaf ** Root Plant discoloration lenght height
score (cm) (cm)
4.5 2.4 a 2.4 a 15.5 c 15.4 c 31.8 c 33.0 a 5.5 2.1 b 2.1 b 18.9 b 18.5 b 32.8 bc 35.0 a 6.5 1.3 c 1.2 c 21.0 a 20.4 a 35.4 a 37.4 a 7.5 1.1 c 1.1 c 22.0 a 14.5 d 34.8 ab 34.4 a
root Shoot dry weight dry weight Shoot/ (g/pot) (g/pot) root
ratio
4.5 0.8 d 0.7 b 1.8 d 2.7 b 2.3 a 3.8 d 5.5 1.0 c 0.7 b 2.4 c 3.4 a 2.4 a 4.8 a 6.5 5.3 a 0.8 a 3.0 a 3.5 a 2.4 a 4.6 b 7.5. 1. b 0.7 b 2.5 b 2.4 c 3.3 a 3.4 c
Relative growth rate (g/pot/week)
4.5 0.3 b 0.5 a 5.5 0.4 a 0.6 a 6.5 0.5 a 0.6 a 7.5 0.5 a 0.5 a
* Mean separation in a column by Duncan Multiple Range Test at 5% level. ** Leaf discoloration rating: 0 = normal, 1 = 25%, 3 = 50%, 5 = 75%, and 7 = 100% leaf discolration, respectively.
q-Z

--------------------------------------------------------------
---------------------------------------------------------
--------------------------------------------------------------
--------------------------------------------------------------
Table 3. Growth arameters of the rice plants grown in a flooded Oxisol at pH 6.5 and varied Eh level.*
Eh Growth parametrs
(mV) Root Shoot/ plant Root shoot Relative lenght root height dry wt. dry wt. growth rate (cm) ratio (cm) (g/pot) (g/pot) (g/pot/week)
-150 18.6 b 3.57 a 51.3 a 1.61 a 5.75 a 0.43 a 0 21.2 a 3.95 a 48.6 b 1.29 b 5.09 a 0.39 a
+150 18.9 b 3.59 a 52.3 a 1.48 a 5.29 a 0.41 a +300 19.6 ab 3.48 a 52.6 a 1.49 a 5.15 a 0.39 a
• Mean separation in a column by Duncan Multiple Range Test at 5% level different.

---------------------------------------------------------------
Table 4. Average assimilation rates of rice plants grown in a flooded oxisol under reduced and oxidized conditions at varied pH levels.*
Days after transplanting**
pH 10 15 20
--- C02 umol/m2/sec.---
Red Ox Red Ox Red Ox
4.5 8.9 a 10.7 c 15.6 b 19.6 b 12.5 b 18.2 b 5.5 9.5 a 12.5 c 21.0 a 22.0 a 20.4 a 17.6 b 6.5 12.4 a 19.0 a 22.5 a 24.2 a 20.4 a 22.9 a 7.5 10.8 a 15.6 b 21.7 a 18.0 b 19.9 a 18.6 b
* Means separation in a column by Duncan Multiple Range Test
at 5% level different.
** Assimilation rate at 0 days after transplanting = 11.1 C02 umol/m2/sec.
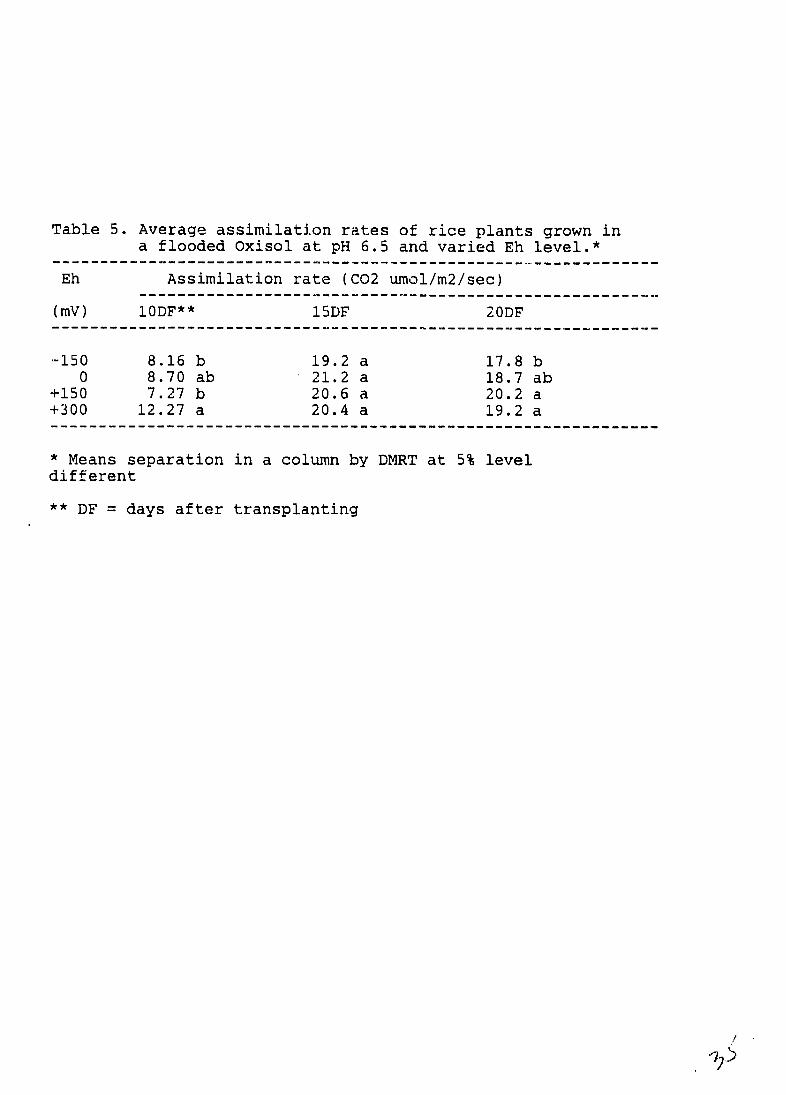
Table 5. Average assimilation rates of rice plants grown in
a flooded Oxisol at pH 6.5 and varied Eh level.*
Eh Assimilation rate (C02 umol/m2/sec)
(mY) 10DF** 15DF 20DF
-150 8.16 b 19.2 a 17.8 b 0 8.70 ab 21.2 a 18.7 ab
+150 7.27 b 20.6 a 20.2 a +300 12.27 a 20.4 a 19.2 a
* Means separation in a column by DMRT at 5% level different
** DF = days after transplanting

-------------------------------------------------------------------------------------
----------------------------------------------------------------------
--------------------------------------------------------------
Table 6. Average concentrations of water-soluble, sodium acetate extractable, and citrate dithionite extractable forms of Cu,Zn, and Mo in a flooded Oxisol under reduced and oxidized conditions at varied pH levels. *
pH Water-soluble Sodium acetate Citrate dithionite extractable extractable
Red Ox Red Ox Red Ox
Copper, mg/kg
4.5 0.20 c 3.95 bc 4.9 a 26.4 ab 0.57 a 45.5 a5.5 0.70 b 3.45 c 1.8 b 26.3 a 0.67 a 35.6 a6.5 0.80 b 4.45 ab 1.2 bc 32.9 a 0.60 a 35.6 a7.5 2.35 a 4.70 a 0.6 c 21.2 b 0.67 a 29.5 a
Zinc, mg/kg
4.5 4.10 a 2.40 d 18.6 a 25.0 a 15.8 a 18.5 a5.5 2.70 b 3.70 c 20.5 a 27.2 a 16.7 a 12.5 b6.5 0.70 d 6.30 b 14.5 a 25.9 a 17.9 a 23.2 a7.5 1.50 c 8.30 a 22.4 a 22.2 a 18.4 a 21.0 a
Molybdenum, mg/kg
4.5 0.26 a 0.94 b 0.7 b 21.8 c 4.2 a 24.1 b5.5 0.09 b 1.15 a 0.7 b 26.2 ab 3.9 a 28.6 a6.5 0.06 b 1.27 a 0.7 b 28.0 a 3.1 a 30.1 a7.5 0.05 b 1.09 ab 0.9 a 23.1 bc 3.6 a 24.2 b
* Mean separation in a column for each nutrient element by Duncan Multiple Range Test et 5% level different.

Table 7. Average concentrations of water-soluble, sodium acetate extractable, and citrate dithionite extractable forms of Cu, Zn and Mo in a flooded Oxisol at pH 6.5 under varied Eh levels.*
Eh Water-soluble (mY)
-150 2.30 a 0 2.79 a
+150 1.78 a +300 2.36 a
-150 2.25 a 0 3.46 a
+150 2.53 a +300 2.67 a
-150 0.05 b 0 0.10 b
+150 0.22 a +300 0.12 b
Sodium acetate extractable
Copper, mg/kg
8.5 a 5.76 a
14.66 a 5.52 a
Zinc, mg/kg
21.3 a 15.6 a 18.1 a 14.2 a
Molybdenum, mg/kg
1.66 a 1.51 a 0.51 b 0.49 b
Citrate dithionite extractable
12.3 a 8.6 a
13.3 a 8.7 a
9.88 a 7.83 a
13.15 a 8.84 a
4.10 a 3.44 a 1.46 b 1.39 b
* Means separation in a column for each nutrient element by Duncan Multiple Range Test at 5% level different.
~2

Table 8. Average concentrations of water-soluble, sodium acetate extractable, and citrate dithionite extractable forms of Fe, and Mn in a flooded Oxisol under reduced and oxidized conditions at varied pH levels. *
pH Water-soluble Sodium acetate Citrate dithionite extractable extractable
Red Ox Red Ox Red Ox
Iron, mg/kg
4.5 1231 a 1.85 b 747.5 d 102.0 bc 11510 a 4913 a 5.5 586 b 5.25 a 1068.5 c 119.0 a 10448 ab 4422 a 6.5 244 c 6.15 a 1479.5 b 112.0 ab 9008 b 4699 a 7.5 220 c 6.65 a 1715.5 a 90.5 c 8651 b 3825 b
Manganese, mg/kg
4.5 111.15 a 2.70 a 53.1 b 26.5 b 24.1 ab 110.3 a 5.5 41.65 b 1.05 c 67.6 b 26.0 b 27.5 a 112.5 a 6.5 16.25 c 1.35 b 97.8 a 28.9 ab 22.8 b 100.1 ab 7.5 4.45 d 1.15 bc 116.1 a 32.0 a 22.9 ab 86.8 b
* Mean separation in a column for each nutrient element by Duncan Multiple Range Test at 5% level different.

Table 9. Average concentrations of water-soluble, sodium acetate extractable, and citrate dithionite extractable forms of Fe and Mn in a flooded Oxisol at pH 6.5 under varied Eh levels.*
Eh Water-soluble Sodium acetate Citrate dithionite (mV) extractable extractable
Iron, mg/kg
-150 141 a 1123 a 864 a 0 109 a 556 b 1310 a
+150 51 b 138 c 1170 a +300 18 b 173 bc 940 a
Manganese, mg/kg
-150 3.90 a 31.7 a 2.76 c 0 2.71 ab 24.5 a 2.84 c
+150 1.70 ab 38.2 a 15.68 a +300 0.76 b 13.8 a 10.22 b
Means separation in a column for each nutrient element by Duncan Multiple Range Test at 5% level different.

---------------------------------------------------------------------
---------------------------------------------------------------------
--------------------------------------------------------------------
Table 10. Average concentrations of water-soluble, sodium acetate extractable, and citrate dithionite extractable forms of Al in a flooded Oxisol under reduced and oxidized conditions at varied pH levels. *
pH Water-soluble Sodium acetate Citrate dithionite extractable extractable
Red Ox Red Ox Red Ox
Aluminum, mg/kg
4.5 3.99 ab 25.3 a 499 a 691 a 2954 a 1309 b 5.5 3.55 b 23.6 a 338 b 693 a 2630 ab 1582 a 6.5 3.76 b 19.9 b 330 b 647 a 2475 b 1485 ab 7.5 5.46 a 11.2 c 477 a 519 b 2273 b 1020 c
* Mean separation in a column by Duncan Multiple Range Test at 5% level different.

----------------------------------------------------------------
---------------------------------------------------------------------
--------------------------------------------------------------------
Table 11. Average concentrations of water-soluble, sodium acetateextractable, and citrate dithionite extractable forms of Alin a flooded Oxisol at pH 6.5 under varied Eh levels.*
Eh Water-soluble Sodium acetate Citrate dithionite(mY) extractable extractable
Aluminum, mg/kg
-150 17.8 c 596 a 508 a 0 72.7 b 541 a 530 a
+150 167.5 a 286 b 660 a+300 116.1 ab 246 b 673 a
* Means separation in a column by Duncan Multiple Range Test at 5% level different.
Table 12. Average concentrations of water-soluble, sodium acetate extractable, and citrate dithionite extractable forms of Ca, and Mg in a flooded Oxisol under reduced and oxidized conditions at varied pH levels. *
pH Water-soluble Sodium acetate Citrate dithionite extractable extractable
Red Ox Red Ox Red Ox
Calcium, mg/kg
4.5 35.90 b 17.98 bc 290 c 590 c 94.5 b 170 b 5.5 51.39 a 14.35 c 431 b 820 a 115.5 a 199 a 6.5 54.28 a 24.85 ab 499 b 796 a 96.0 ab 195 ab 7.5 53.48 a 30.72 a 594 a 714 b 97.0 ab 167 b
Magnesium, mg/kg
4.5 12.34 a 2.66 a 52.5 c 87 b 18.3 a 16.4 a 5.5 23.28 a 2.60 a 80.0 b 112 a 16.0 a 18.3 a 6.5 24.67 a 4.16 a 95.5 b 123 a 16.1 a 19.5 a 7.5 24.98 a 4.44 a 122.5 a 110 a 17.5 a 20.3 a
• Mean separation in a column for each nutrient element by Duncan Multiple Range Test at 5% level different.

Table 13. Average concentrations of water-soluble, sodium acetate extractable, and citrate dithionite extractable forms of Ca and Mg in a flooded Oxisol at pH 6.5 under varied Eh levels.*
Eh Water-soluble
(mY)
-150 22.5 a 0 21.5 a
+150 22.0 a +300 33.0 a
-150 3.30 a 0 1.99 a
+150 4.37 a +300 2.67 a
Sodium acetate
extractable
Calcium, mg/kg
380 a 348 a 531 a 394 a
Magnesium, mg/kg
48 a 44 a 49 a 45 a
Citrate dithionite
extractable
142 ab 157 a 124 ab 75 b
23.5 ab 27.0 a 16.5 ab 10.0 b
* Means separation in a column for each nutrient element by Duncan Multiple Range Test at 5% level different.

Table 14. Average concentrations of water-soluble, sodium acetate extractable, and citrate dithionite extractable forms of P, K, and Si in a flooded Oxisol under reduced and oxidized conditions at varied pH levels. *
pH Water-soluble Sodium acetate Citrate dithionite extractable extractable
Red Ox Red Ox Red Ox
Phosphorus, mg/kg
4.5 2.05 d 6.8 d 13.5 b 158 b 199 a 186 b 5.5 5.05 c 9.0 c 11.5 b 193 a 179 a 319 a 6.5 9.50 a 11.9 b 11.5 b 201 a 168 a 330 a 7.5 7.20 b 13.6 a 17.5 a 168 b 169 a 266 b
Potassium, mg/kg
4.5 13.4 a 48.7 c 44.2 c 1071 c nd** 1168 b 5.5 20.6 a 61.2 b 69.7 c 1325 ab nd 1392 a 6.5 19.0 a 70.3 a 125.1 b 1388 a nd 1470 a 7.5 19.0 a 60.2 b 209.4 a 1185 bc nd 1195 b
Silicon, mg/kg
4.5 45.9 a 33.5 b 39.5 b 122 c 395 a 348 b 5.5 26.5 b 39.0 b 51.0 b 145 bc 379 ab 395 Ab 6.5 20.5 c 47.0 a 56.0 b 173 b 336 b 416 a 7.5 17.9 c 52.0 a 127.5 a 244 a 107 c 367 ab
* Mean separation in a column for each nutrient element by Duncan Multiple Range Test at 5% level different.
nd = non detectable.
4it

------------------------------------------------------------------------
Table 15. Average concentrations of water-soluble, sodium acetate extractable, and citrate dithionite extractable forms of P, K, and Si in a flooded Oxisol at pH 6.5 under varied Eh levels.*
Eh Water-soluble (mV)
-150 1.19 b 0 2.21 b
+150 5.44 a +300 4.12 ab
-150 53.5 b 0 95.6 ab
+150 128.2 a +300 120.8 a
-150 41 c 0 61 bc
+150 117 a +300 83 b
Sodium acetate extractable
Phosphorus, mg/kg
19.5 a 17.5 ab 10.5 b 10.0 b
Potassium, mg/kg
126.5 b 237.5 b 546.0 a 30.0 b
Silicon, mg/kg
96.5 a 83.5 a 47.5 b 24.5 c
Citrate dithionite extractable
74.3 a 84.8 a 73.7 a 57.9 a
121.5 a 158.5 a 28.0 b 28.5 b
449 a 531 a 249 b 197 b
* Means separation in a column for each nutrient element by Duncan Multiple Range Test at 5% level different.

Table 16.Average nutrient content of rice shoot grown in a flooded oxisol under reduced and oxidized conditions at varied pH levels.
pH Nutrient concentration, mg/kg
Red Ox Red Ox Red Ox
Cu Zn Fe
4.5 20.5 a 20.3 a 110.8 a 65.9 a 5304 a 106 a 5.5 16.1 b 17.4 b 59.5 b 44.0 b 674 b 95 b 6.5 9.3 c 15.7 c 51.2 c 24.9 c 208 c 91 c 7.5 9.6 c 16.0 c 38.7 d 22.7 c 144 c 90 c
Mn Ca Mg
4.5 809 a 916 a 5297 a 2990 a 3867 a 2792 ab 5.5 640 b 315 b 3721 b 2367 b 3352 ab 3221 a 6.5 630 b 184 c 3202 bc 2094 b. 2913 b 2587 bc 7.5 491 c 109 d 1816 c 1768 c 2905 b 2177 c
Mo Si P
4.5 0.30 a 6.38 d 125 a 513 a 4016 a 2362 a 5.5 0.04 a 7.41 c 206 a 507 a 4220 a 2643 a 6.5 0.79 a 8.16 b 205 a 518 a 4295 a 2488 a 7.5 0.35 a 9.58 a 187 a 464 a 4097 a 2302 a
Al K
4.5 183 a 709 a 25261 a 25211 a 5.5 118 b 688 ab 18176 b 21485 b 6.5 101 b 680 ab 26091 a 19032 c 7.5 104 b 655 b 19004 b 16685 d
* Means separation in a column for each nutrient element by Duncan Multiple Range Test at 5% level different.

Table 17.Average nutrient content in rice shoots grown in a flooded Oxisol under varied redox levels at pH 6.5.*
Eh Nutrient content, mg/kg (my)
Cu Zn Fe Mn Ca Mg
-150 17.9 a 72.3 a 250 a 894 a 3581 a 3888 a 0 18.5 a 55.7 ab 232 ab 1227 a 3315 ab 3610 a
+150 8.1 b 26.7 b 146 bc 880 a 1924 b 2524 b +300 10.2 ab 30.1 b 141 c 859 a 2644 ab 2963 ab
Mo Si P Al K
-150 1.18 a 359 a 4292 a 693 b 24649 a 0 1.51 a 347 a 4051 a 682 b 22696 a
+150 0.81 b 390 a 3255 a 713 a 21264 a +300 0.78 b 369 a 3321 a 689 b 22764 a
* Means separation in a column for each nutrient element by Duncan Multiple Range Test at 5% level different.

Table 18.Simple correlation coefficients for the relationships between water-soluble nutrients in the soil and nutrient uptake by rice in a flooded Oxisol under reduced and oxidized conditions over all pH
levels.
Water- Nutrient uptake
soluble ----------- ----- ------------ ------- ------ ------ ------ ----------- --------- --------- ----------------
nutrient Cu Zn Fe Mn Ca Mg Mo Si P Al K
Reduced Cu -0.737** -0.898** -0.643* ns -0.828*' ns ns ns ns ns ns Zn +0.798** ns +0.876** ns ns ns -0.622* ns -0.852** ns -0.710** Fe +0.762** +0.785** +0.9621* ns ns ns ns ns -0.803ic* ns ns Mn +0.762** +0.843**c +0.976** ns +0.643* ns ns ns -0.750** ns ns Ca ns -0.71lidt -0.934** ns ns +0.644* ns ns -0.850* ns ns Mg ns ns -0.680* ns ns ns ns ns ns ns ns
Mo +0.668* +0.833** -0.978** ns +0.629* ns ns ns -0.746** ns ns Si +0.733** +0.670* -0.875** ns ns ns ns ns +0.726** ns ns P -0.803** ns -0.868** ns ns ns ns ns +0.809f* ns +0.670*
AL ns ns ns -0.686* ns ns ns ns ns ns ns K ns ns -0.651* ns +0.720ft ns ns ns ns ns ns
Oxidized
Cu -0.750** -0.815** -0.684* ns -0.778** -0.757** ns ns ns ns -0.774** Zn -0.786** -0.985** -0.626* -0.897-V -0.867** ns ns ns ns ns -0.820** Fe ns -0.836** ns -0.957** ns ns +0.785** ns ns ns ns Mn ns +0.625* ns +0.999** ns ns -0.832** ns ns ns ns Ca -0.838** -0.877** -0.753** -0.635* -0.881** +0.787** ns ns ns ns -0.854 *
Mg ns +0.665* ns ns -0.629* ns ns ns ns ns ns Mo ns -0.630* ns -0.797* ns ns +0.961* ns ns ns ns Si -0.738** -0.947** ns -0.906** -0.764** ns ns ns ns ns -0.745** P -0.715.* -0.987** ns -0.943** -0.804** ns ns ns ns ns -0.744**
AL +0.909** +0.906** -0.797** +0.793** +0.958** +0.612* ns ns ns 0.658* +0.928** K ns -0.622* ns -0.771ft ns ns +0.925** ns ns ns ns
*,** Significance at the 0.05 and 0.01 levels of probability, respectively.
ns = not significant.

------------------------------------------------------------------------------------------------------------
-------------------------------------------------------------------------------------------------------
Table 19.Simple correlation coefficients for the relationships between NaOAc extractable nutrients in the
soil and nutrient uptake by rice in a flooded Oxisol under reduced and oxidized conditions
over all pH Levels.
NaOAc Nutrient uptake
extract.- ...................................................................................................
nutrient Cu Zn Fe Mn Ca Mg Mo Si P Al K ............................................................................................................
Reduced
Cu +0.695* +0.865* +0.986w' ns +0.638* ns ns ns -0.754ft ns ns
Zn ns ns ns -0.783(* ns ns -0.630* ns ns ns -0.653*
Fe -0.861** -0.802** -0.844** ns -0.659* ns ns ns -0.701* ns ns
Mn -0.846** -0.750** -0.773** ns ns ns ns ns +0.716* ns ns
Ca -0.797ec -0.88e'dc -0.88(,- ns -0.755*' ns ns ns +0.622* ns ns
Mg -0.798* -0.883** -0.835)' ns -0.782* ns ns ns ns ns ns
Mo ns -0.628* ns -0.794** ns ns ns ns ns ns ns wSi -0.697* -0.845) t ns ns -0.811** ns ns ns ns ns ns
P ns ns ns -0.738** ns ns ns ns ns ns ns
AL ns ns ns -0.653* ns ns ns ns ns ns ns
K ns -0.807 ns -0.785* -0.803' ns ns as ns ns ns
Oxidized
Cu +0.808*' ns +0.879** ns +0.669* +0.910** ns +0.828** +0.854* +0.873** +0.767*
Zn +0.754** ns +0.793** ns +0.711* +0.761** ns +0.690* +0.677* +0.758** +0.758**
Fe +0.865** ns +0.931* ns +0.79,** +0.977** ns +0.893** +0.918** +0.944** +0.855**
Mn -0.849* -0.832** -0.718* -0.718* -0.809** ns ns ns ns ns -0.824*7\
Ca ns ns ns -0.683* ns ns +0.912** ns +0.708k ns ns
Mg ns -0.637* ns -0.827** ns ns +0.946** ns ns ns ns
Mo ns ns ns ns ns +0.624* +0.848** +0.749** +0.783** +0.733** ns
Si +0.891** -0.924** -0.772* -0.830** -0.935** +0.644* ns ns ns ns -0.908w'
P ns ns ns ns ns +0.688* +0.879** +0.791** +0.832** +0.778* ns
AL +0.910*' +0.833** +0.853** +0.681* +0.964** +0.777** ns +0.638* ns +0.745** +0.942*
K ns ns ns ns ns ns +0.910** +0.649* +0.750** +0.683* ns
*,(* Significance at the 0.05 and 0.01 levels of probability, respectively.
ns = not significant.

Table 20. Simple correlation coefficient for the relationship between concentrations of water-soluble nutrients and uptake by rice in a flooded Oxisol at pH 6.5 over all Eh levels.
Watersoluble Nutrient uptake nutrient
Cu Zn Fe Mn Ca Mg
Cu ns ns ns ns ns ns Zn ns ns ns ns ns ns Fe +0.775** +0.864** +0.873** ns +0.670* +0.765* Mn +0.622* +0.932** +0.865** ns +0.684* +0.694* Ca ns ns ns ns ns ns Mg ns nis ns ns -0.635* ns Mo -0.638* -0.689* ns ns -0.672* -0.708** Si -0.818** -0.750** -0.730* ns -0.785** -0.844** P -0.832** -0.727** -0.830** ns -0.919** -0.873** Al -0.832** -0.795** -0.787** ns -0.779** -0.862** K ns ns ns ns ns ns
MC Si P Al K
Cu ns -0.706* ns ns ns Zn ns ns ns -0.628* ns Fe +0.779** ns +0.762** ns ns Mn +0.700* ns ns ns ns Ca ns ns ns ns ns Mg ns ns ns ns ns Mo ns ns ns ns ns Si -0.696* ns ns ns ns P -0.678* ns ns ns ns Al -0.722** ns +0.699* ns -0.666* K ns ns ns ns ns
*,** Significance at the 0.05 and 0.01 levels of probability, respectively.
ns = not significant

Table 21.Simple correlation coefficients for the relationships between the concentration of NaOAc extractable nutrients and nutrient uptake by rice grcwn in a flooded Oxisol at pH 6.5 over all Eh levels.
NaOAc extract. Nutrient uptake nutrient
Cu Zn Fe Mn Ca Mg
Cu ns ns ns ns ns ns Zn ns ns +0.685* ns ns +0.627* Fe +0.837** +0.829** +0.864** ns +0.802** +0.907** Mn ns ns ns ns ns ns Ca -0.705* ns -0.666* ns -0.821** -0.703* Mg -0.622* +0.889** ns ns -0.766** -0.641* Mo +0.931** +0.834** +0.909** +0.626* +0.842** +0.883** Si +0.794** +0.816** +0.809** ns +0.629* +0.738** P +0.862** +0.868** +0.832** +0.633* +0.815** +0.845**
AL +0.824** ns +0.861** ns +0.709* +0•790** K ns ns ns ns ns ns
Mo Si P Al K
Cu ns ns ns ns ns Zn ns ns +0.823** ns +0.779** Fe +0.637* ns +0.823** ns +0.666* Mn ns ns ns ns ns Ca ns ns ns Ds ns Mg ns ns +0.772** ns ns Mo +0.931** ns +0.791** ns ns Si +0.847** ns +0.705* ns ns P +0.798** ns +0.702* ns ns
AL +0.851** ns ns ns ns K ns ns ns ns ns
* *Significance at the 0.05 and 0.01 levels of probability, respectively.
ns = not significant.

Table 22.Simple correlation coefficients for the relationships between ion activity and nutrient uptake in a flooded Oxisol under reduced and oxidized conditions over all pH levels.
Ion Nutrient uptake (mg/pot) activity -------------------------------------------------------------------------------------------------
(mole/L) Cu Zn Fe Mn Ca Mg Mo Si P Al K ............................................................................................................
Reduced
Zn +0.689* ns +0.863c** ns ns ns -0.626* ns -0.891* ns -0.758** Fe +0.716** +0.768** +0.976** ns ns ns ns ns -0.827w' ns ns Mn +0.743** +0.846** +0.982** ns +0.644* ns ns ns -0.753** ns ns Ca -0.838** -0.867** -0.840f* ns -0.717** ns ns ns +0.614* ns ns Mg -0.819** -0.8731* -0.847** ns -0.762** ns ns ns ns -0.622* ns Si ns +0.719f +0.954** ns ns ns ns ns -0.782** ns ns
P -0.939ydC -0.695* -0.799** ns ns ns ns ns ns ns ns Al -0.788** -0.718C* ns ns -0.713** ns ns ns ns ns ns K ns -0.617* -0.625* ns ns ns ns ns ns -0.670* ns
Oxidized
Zn -0.831** -0.932** -0.710ft -0.848** -0.932** ns ns ns ns ns -0.876** Fe ns -0.742** ns -0,899** -0.620* ns +0.713** ns ns ns ns Mn ns +0.710* ns +0.934** ns ns -0.835** ns ns ns ns Ca -0.900** -0.790** -0.868** ns -0.951** -0.882** ns -0.668* -0.670* -0.782** -0.923** Mg ns ns ns ns -0.682* ns ns ns ns ns ns
Si ns -0.752** ns -0.885** -0.699** ns ns ns ns ns ns nP -0.708* -0.902* ns -0.912** -0.872** ns ns ns ns ns -0.766*
*Al +0.835** +0.867** +0.724*fc +0.692* +0.782 +0.630* ns ns ns ns +0.828** K ns ns ns -0.768** ns ns +0.660* ns ns ns ns
*,** Significance at the 0.05 and 0.01 levels of probability, respectively.
ns = not significant.
ii