Embed Size (px)
Citation preview
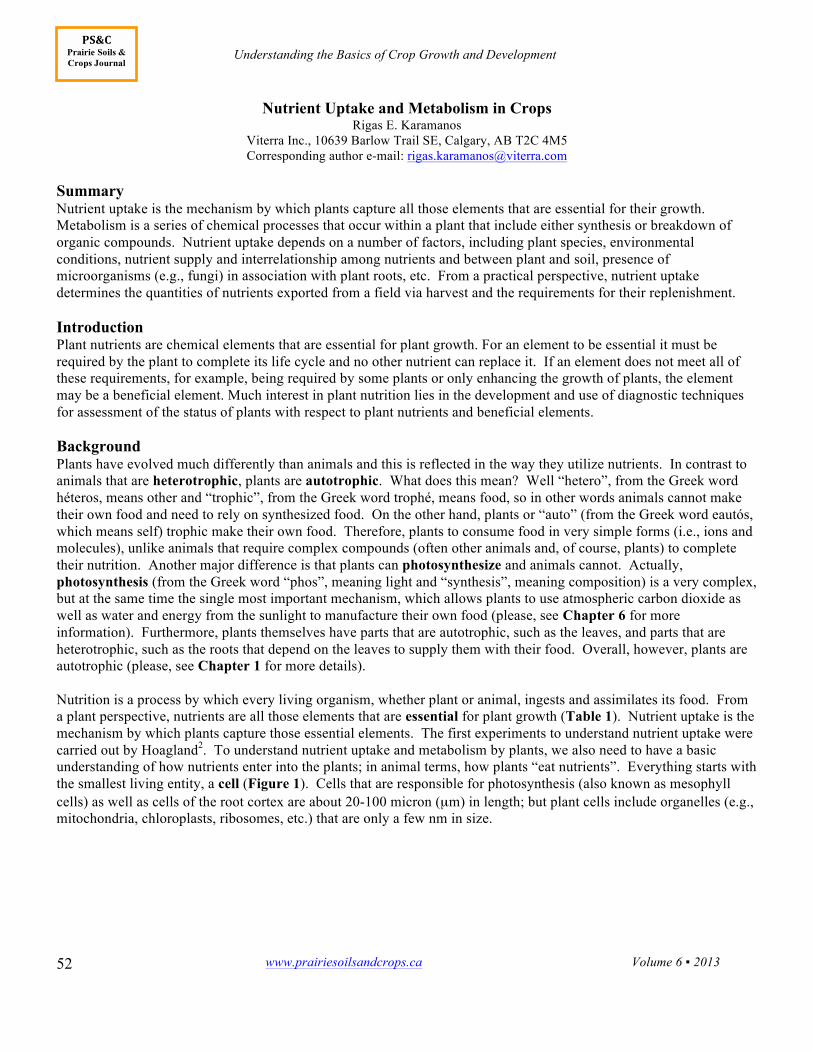
Understanding the Basics of Crop Growth and Development
www.prairiesoilsandcrops.ca Volume 6 ▪ 2013
52
PS&C Prairie Soils & Crops Journal
Nutrient Uptake and Metabolism in Crops Rigas E. Karamanos
Viterra Inc., 10639 Barlow Trail SE, Calgary, AB T2C 4M5 Corresponding author e-mail: [email protected]
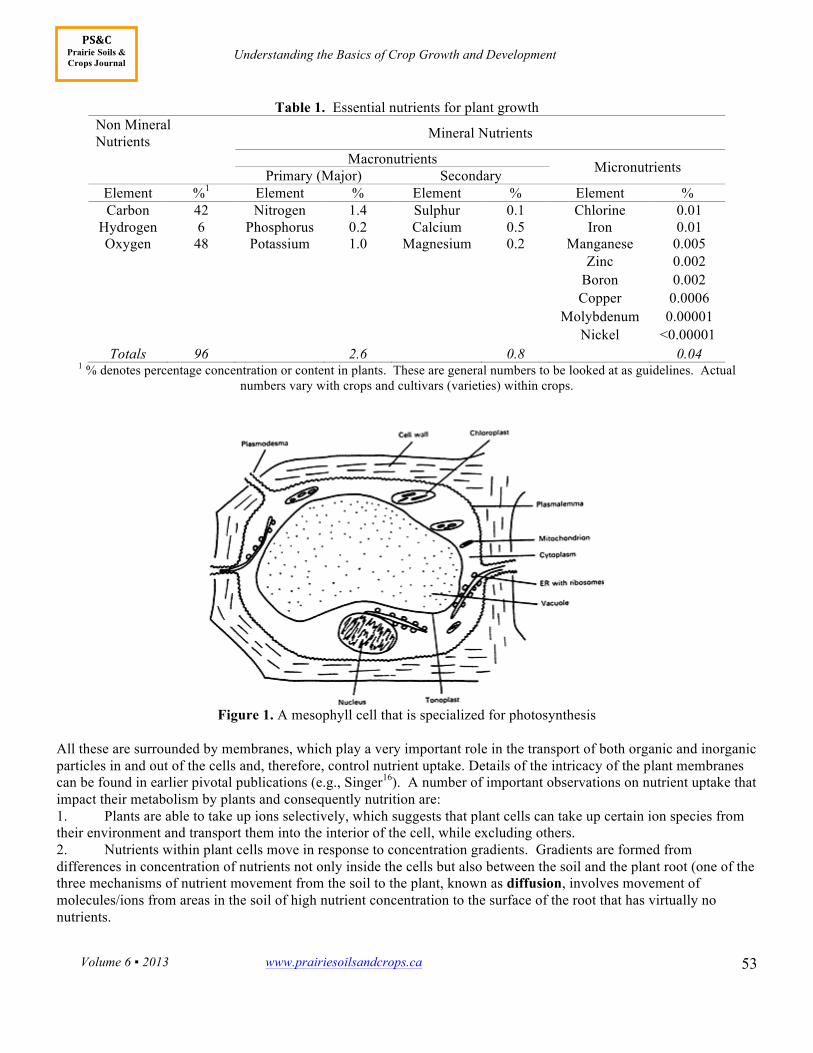
Summary Nutrient uptake is the mechanism by which plants capture all those elements that are essential for their growth. Metabolism is a series of chemical processes that occur within a plant that include either synthesis or breakdown of organic compounds. Nutrient uptake depends on a number of factors, including plant species, environmental conditions, nutrient supply and interrelationship among nutrients and between plant and soil, presence of microorganisms (e.g., fungi) in association with plant roots, etc. From a practical perspective, nutrient uptake determines the quantities of nutrients exported from a field via harvest and the requirements for their replenishment. Introduction Plant nutrients are chemical elements that are essential for plant growth. For an element to be essential it must be required by the plant to complete its life cycle and no other nutrient can replace it. If an element does not meet all of these requirements, for example, being required by some plants or only enhancing the growth of plants, the element may be a beneficial element. Much interest in plant nutrition lies in the development and use of diagnostic techniques for assessment of the status of plants with respect to plant nutrients and beneficial elements. Background Plants have evolved much differently than animals and this is reflected in the way they utilize nutrients. In contrast to animals that are heterotrophic, plants are autotrophic. What does this mean? Well “hetero”, from the Greek word héteros, means other and “trophic”, from the Greek word trophé, means food, so in other words animals cannot make their own food and need to rely on synthesized food. On the other hand, plants or “auto” (from the Greek word eautós, which means self) trophic make their own food. Therefore, plants to consume food in very simple forms (i.e., ions and molecules), unlike animals that require complex compounds (often other animals and, of course, plants) to complete their nutrition. Another major difference is that plants can photosynthesize and animals cannot. Actually, photosynthesis (from the Greek word “phos”, meaning light and “synthesis”, meaning composition) is a very complex, but at the same time the single most important mechanism, which allows plants to use atmospheric carbon dioxide as well as water and energy from the sunlight to manufacture their own food (please, see Chapter 6 for more information). Furthermore, plants themselves have parts that are autotrophic, such as the leaves, and parts that are heterotrophic, such as the roots that depend on the leaves to supply them with their food. Overall, however, plants are autotrophic (please, see Chapter 1 for more details). Nutrition is a process by which every living organism, whether plant or animal, ingests and assimilates its food. From a plant perspective, nutrients are all those elements that are essential for plant growth (Table 1). Nutrient uptake is the mechanism by which plants capture those essential elements. The first experiments to understand nutrient uptake were carried out by Hoagland2. To understand nutrient uptake and metabolism by plants, we also need to have a basic understanding of how nutrients enter into the plants; in animal terms, how plants “eat nutrients”. Everything starts with the smallest living entity, a cell (Figure 1). Cells that are responsible for photosynthesis (also known as mesophyll cells) as well as cells of the root cortex are about 20-100 micron (µm) in length; but plant cells include organelles (e.g., mitochondria, chloroplasts, ribosomes, etc.) that are only a few nm in size.
Understanding the Basics of Crop Growth and Development
Volume 6 ▪ 2013 www.prairiesoilsandcrops.ca
53
PS&C Prairie Soils & Crops Journal
Table 1. Essential nutrients for plant growth Non Mineral Nutrients Mineral Nutrients
Macronutrients Micronutrients Primary (Major) Secondary Element %1 Element % Element % Element % Carbon 42 Nitrogen 1.4 Sulphur 0.1 Chlorine 0.01
Hydrogen 6 Phosphorus 0.2 Calcium 0.5 Iron 0.01 Oxygen 48 Potassium 1.0 Magnesium 0.2 Manganese 0.005
Zinc 0.002 Boron 0.002 Copper 0.0006 Molybdenum 0.00001 Nickel <0.00001
Totals 96 2.6 0.8 0.04 1 % denotes percentage concentration or content in plants. These are general numbers to be looked at as guidelines. Actual
numbers vary with crops and cultivars (varieties) within crops.
Figure 1. A mesophyll cell that is specialized for photosynthesis
All these are surrounded by membranes, which play a very important role in the transport of both organic and inorganic particles in and out of the cells and, therefore, control nutrient uptake. Details of the intricacy of the plant membranes can be found in earlier pivotal publications (e.g., Singer16). A number of important observations on nutrient uptake that impact their metabolism by plants and consequently nutrition are: 1. Plants are able to take up ions selectively, which suggests that plant cells can take up certain ion species from their environment and transport them into the interior of the cell, while excluding others. 2. Nutrients within plant cells move in response to concentration gradients. Gradients are formed from differences in concentration of nutrients not only inside the cells but also between the soil and the plant root (one of the three mechanisms of nutrient movement from the soil to the plant, known as diffusion, involves movement of molecules/ions from areas in the soil of high nutrient concentration to the surface of the root that has virtually no nutrients.
Understanding the Basics of Crop Growth and Development
www.prairiesoilsandcrops.ca Volume 6 ▪ 2013
54
PS&C Prairie Soils & Crops Journal
3. Nutrient uptake requires energy. That is where metabolism comes into play. Metabolism (from the Greek word “metabolismos”, which means change in movement/form) is a series of chemical processes that occur within an organism, which include either synthesis (anabolism) or breakdown (catabolism) of organic compounds. Whereas anabolism is the set of metabolic pathways that construct molecules from smaller units, catabolism is the set of metabolic pathways that break down molecules into smaller units and release energy. These two mechanisms are interrelated, as anabolism requires energy from catabolism that links ion transport with electron flow in the respiration chain. In aerobic organisms (i.e., organisms that need oxygen to survive, in other words organisms that respire) respiration is directly related to ion uptake3,14. In practice, what this means is that the greater the oxygen tension (the more oxygen in other words), the greater the nutrient uptake by plant roots. Crops differ in their individual nutrient needs and relationships between plant and soil are very complex. If one adds the complexity of the assimilatory pathways and cycling of nutrients within plants, the study of nutrient uptake and metabolism becomes extremely difficult. This has prompted some scientists to develop models to aid our understanding of the acquisition and uptake of nutrients by plants1,10. To complicate things further, interactions among or between nutrients influences their uptake by a number of plant species. The first step in nutrient uptake is their entrance into the plant roots. Before that, a nutrient needs to reach the root surface within the soil. There are three mechanisms by which nutrients move from the soil to the surface of the plant root, namely, mass flow, diffusion and root interception. Mass Flow is essentially movement of nutrients by water. In other words, dissolved nutrients “along for the ride”
in water are taken up by roots; and it is primarily responsible for nutrients such as nitrogen and sulphur. Diffusion, as we have already mentioned, is movement along concentration gradients (that is from points of high to
points of low concentration) and is responsible for nutrients such as phosphorus and potassium. Root Interception - is when plant roots themselves come into contact with nutrients in the soil and absorb them.
All three processes are in constant operation during plant growth. Independently of the mechanism whereby a nutrient has reached the plant root, it now has to enter through the root “skin”, known as the epidermis, and move to the upper parts of the plant (Figure 1). Actual uptake of a nutrient at the root surface may be passive (i.e. nutrient enters root with water that is being absorbed) or due to an active process where the nutrient is moved into the root by another molecule or ion called a carrier. This function is often aided by microorganisms that live in association with plant roots. For example, mycorrhizae, which are fungi that live in association with plant roots, can extend the phosphorus uptake range by four times or more1, since a plant may have mycorrhizal hyphae (filaments) that are 100 to 1000 times longer than its roots. However, not all plants are mycorrhizal. For example, canola does not establish a mycorrhizal association. Once a nutrient enters the plant through the root, it will be subject to translocation within the plant. Nutrient uptake by field crops means that a portion of the nutrient will be removed in the harvested part(s) of the crop (see examples in Table 2; or the crop removal/uptake charts for western Canada at: http://www.cfi.ca/_documents/uploads/elibrary/d161_NU_W_01[1].pdf.).
1(https://www.ipni.net/ppiweb/agbrief.nsf/5a4b8be72a35cd46852568d9001a18da/9161f81419741d648525690a0068c8d7!OpenDocument)
Understanding the Basics of Crop Growth and Development
Volume 6 ▪ 2013 www.prairiesoilsandcrops.ca
55
PS&C Prairie Soils & Crops Journal
Table 2. Nutrient uptake in the straw and grain portion of crops commonly grown in western Canada.
Crop (Yield) Plant Part
Typical Nutrient Uptake (lb/ac) Nitrogen
(N) Phosphorus
(P2O5) Potassium
(K2O) Sulphur
(S) Spring Wheat Seed 60 23 17 4 (40 bu/ac) Straw 25 9 55 5 Total 85 32 71 9 Barley Seed 78 34 25 7 (80 bu/ac) Straw 28 9 68 5 Total 106 43 93 12 Canola Seed 68 41 21 12 (35 bu/ac) Straw 44 17 72 10 Total 112 58 93 22
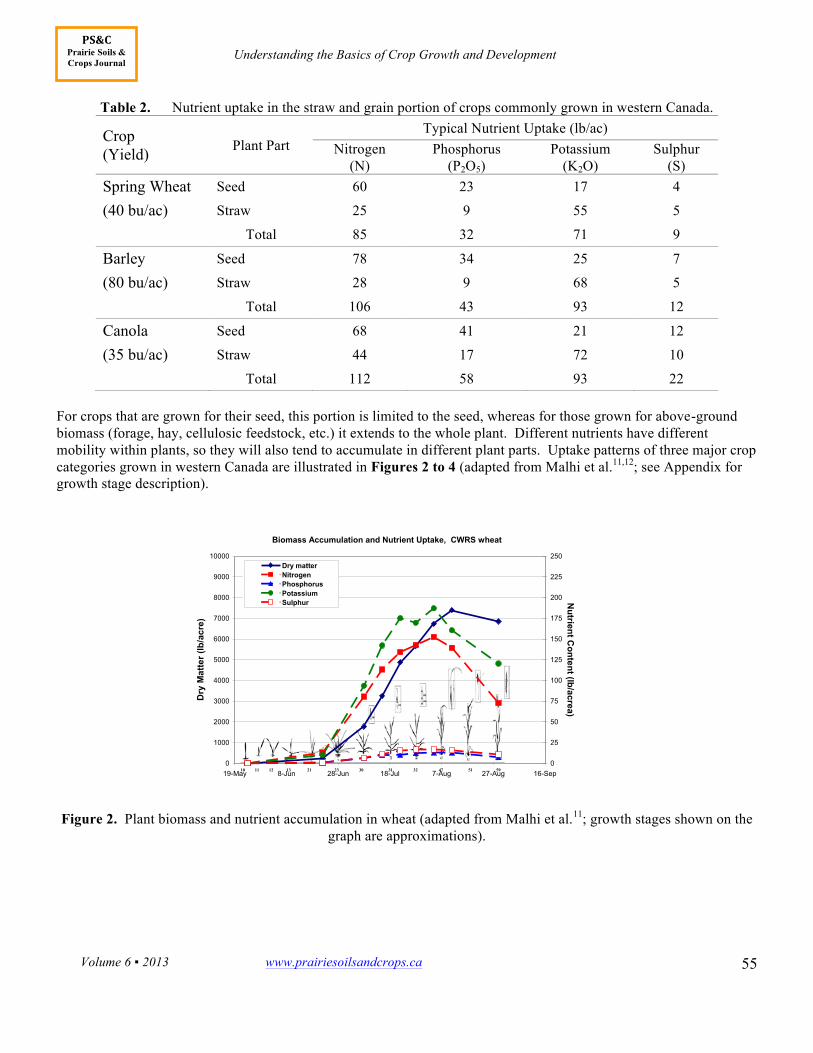
For crops that are grown for their seed, this portion is limited to the seed, whereas for those grown for above-ground biomass (forage, hay, cellulosic feedstock, etc.) it extends to the whole plant. Different nutrients have different mobility within plants, so they will also tend to accumulate in different plant parts. Uptake patterns of three major crop categories grown in western Canada are illustrated in Figures 2 to 4 (adapted from Malhi et al.11,12; see Appendix for growth stage description).
Figure 2. Plant biomass and nutrient accumulation in wheat (adapted from Malhi et al.11; growth stages shown on the
graph are approximations).
10 11 12 13 21 23 30 31 32 47 51 59
Biomass Accumulation and Nutrient Uptake, CWRS wheat
0
1000
2000
3000
4000
5000
6000
7000
8000
9000
10000
19-May 8-Jun 28-Jun 18-Jul 7-Aug 27-Aug 16-Sep
Dry
Mat
ter (
lb/a
cre)
0
25
50
75
100
125
150
175
200
225
250
Nutrient C
ontent (lb/acrea)
Dry matterNitrogenPhosphorusPotassiumSulphur
Understanding the Basics of Crop Growth and Development
www.prairiesoilsandcrops.ca Volume 6 ▪ 2013
56
PS&C Prairie Soils & Crops Journal
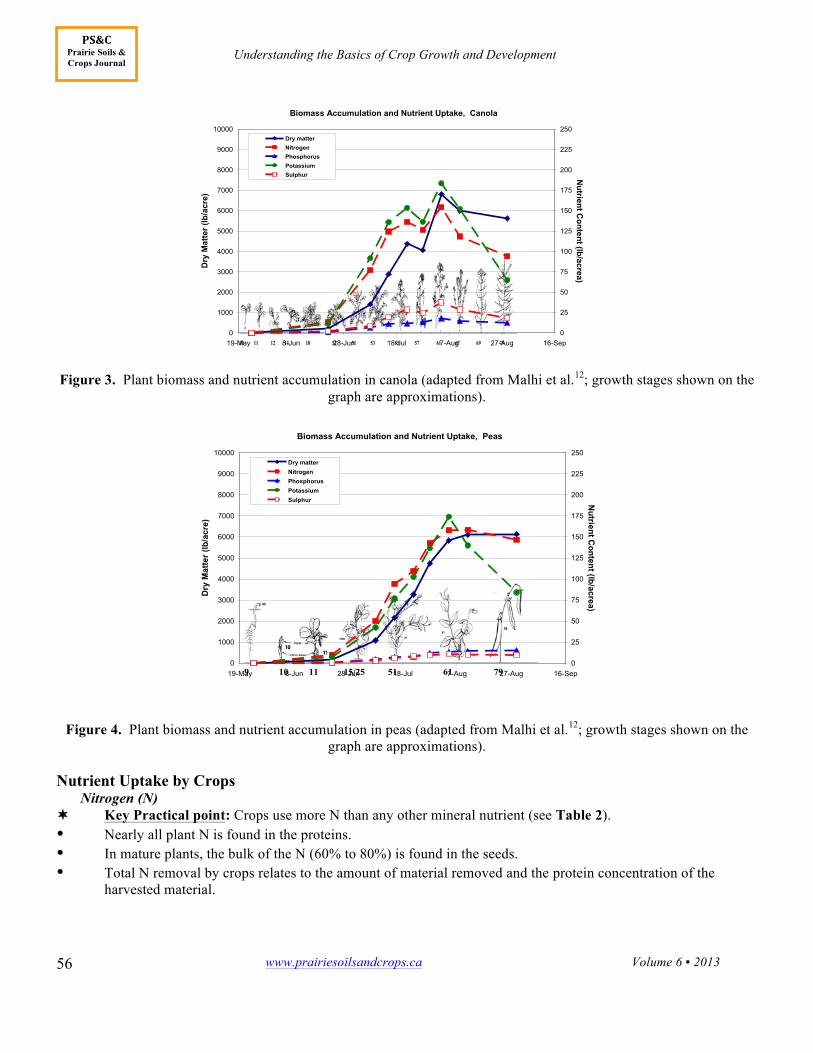
Figure 3. Plant biomass and nutrient accumulation in canola (adapted from Malhi et al.12; growth stages shown on the
graph are approximations).
Figure 4. Plant biomass and nutrient accumulation in peas (adapted from Malhi et al.12; growth stages shown on the graph are approximations).
Nutrient Uptake by Crops
Nitrogen (N) ¬¬ Key Practical point: Crops use more N than any other mineral nutrient (see Table 2). Nearly all plant N is found in the proteins. In mature plants, the bulk of the N (60% to 80%) is found in the seeds. Total N removal by crops relates to the amount of material removed and the protein concentration of the
harvested material.
10 11 12 13 18 32 51 53 55 57 61 67 69 79
Biomass Accumulation and Nutrient Uptake, Canola
0
1000
2000
3000
4000
5000
6000
7000
8000
9000
10000
19-May 8-Jun 28-Jun 18-Jul 7-Aug 27-Aug 16-Sep
Dry
Mat
ter (
lb/a
cre)
0
25
50
75
100
125
150
175
200
225
250
Nutrient C
ontent (lb/acrea)
Dry matterNitrogenPhosphorusPotassiumSulphur
9 10 11 15/25 51 61 79
Biomass Accumulation and Nutrient Uptake, Peas
0
1000
2000
3000
4000
5000
6000
7000
8000
9000
10000
19-May 8-Jun 28-Jun 18-Jul 7-Aug 27-Aug 16-Sep
Dry
Mat
ter (
lb/a
cre)
0
25
50
75
100
125
150
175
200
225
250
Nutrient C
ontent (lb/acrea)
Dry matterNitrogenPhosphorusPotassiumSulphur
Understanding the Basics of Crop Growth and Development
Volume 6 ▪ 2013 www.prairiesoilsandcrops.ca
57
PS&C Prairie Soils & Crops Journal
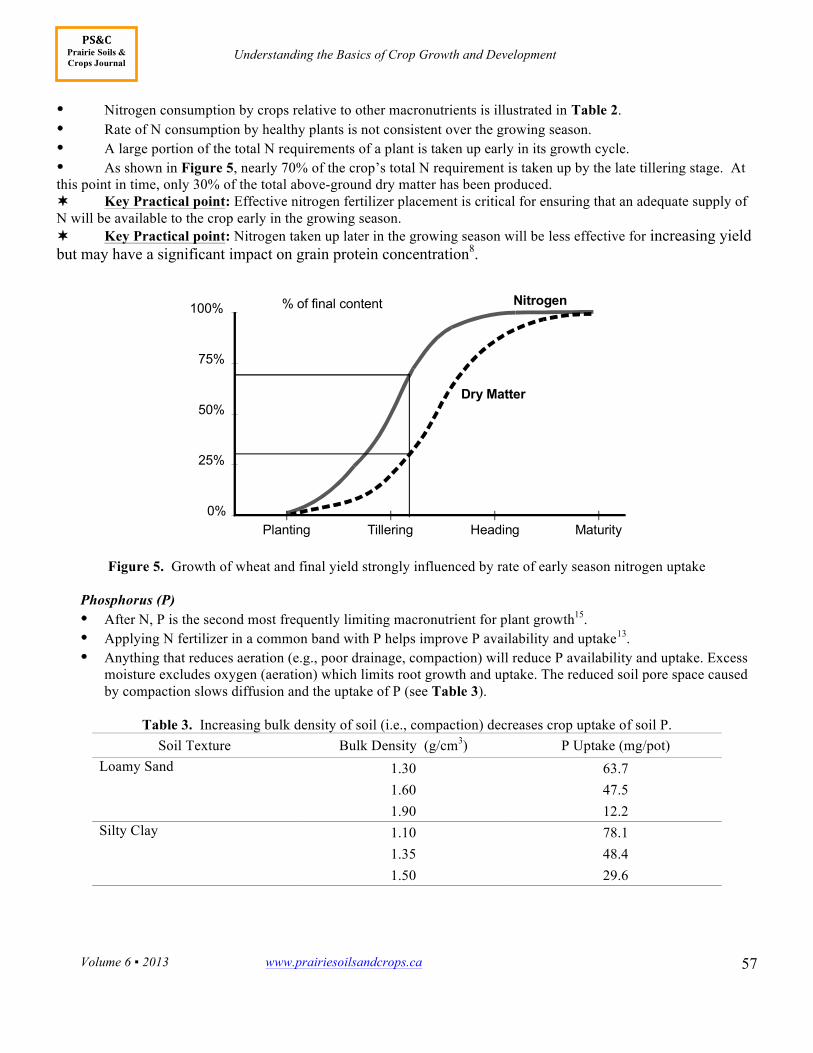
Nitrogen consumption by crops relative to other macronutrients is illustrated in Table 2. Rate of N consumption by healthy plants is not consistent over the growing season. A large portion of the total N requirements of a plant is taken up early in its growth cycle. As shown in Figure 5, nearly 70% of the crop’s total N requirement is taken up by the late tillering stage. At
this point in time, only 30% of the total above-ground dry matter has been produced. ¬¬ Key Practical point: Effective nitrogen fertilizer placement is critical for ensuring that an adequate supply of N will be available to the crop early in the growing season. ¬¬ Key Practical point: Nitrogen taken up later in the growing season will be less effective for increasing yield but may have a significant impact on grain protein concentration8.
Figure 5. Growth of wheat and final yield strongly influenced by rate of early season nitrogen uptake
Phosphorus (P) After N, P is the second most frequently limiting macronutrient for plant growth15. Applying N fertilizer in a common band with P helps improve P availability and uptake13. Anything that reduces aeration (e.g., poor drainage, compaction) will reduce P availability and uptake. Excess
moisture excludes oxygen (aeration) which limits root growth and uptake. The reduced soil pore space caused by compaction slows diffusion and the uptake of P (see Table 3).
Table 3. Increasing bulk density of soil (i.e., compaction) decreases crop uptake of soil P.
Soil Texture Bulk Density (g/cm3) P Uptake (mg/pot) Loamy Sand 1.30 63.7
1.60 47.5 1.90 12.2
Silty Clay 1.10 78.1 1.35 48.4 1.50 29.6
0%
25%
50%
75%
100%
Dry Matter
% of final content
Planting Tillering Heading Maturity
Nitrogen
Understanding the Basics of Crop Growth and Development
www.prairiesoilsandcrops.ca Volume 6 ▪ 2013
58
PS&C Prairie Soils & Crops Journal
¬¬ Key Practical point: Cool temperatures slow diffusion (mechanism of P uptake by plants) which could create a P deficiency. Presence of small amounts of P fertilizer at or near the seed depending on the sensitivity of crops to P, even on P sufficient soils, ensure that plants have adequate supply of P at the start of their growth by taking advantage of the well know “pop-up” effect, i.e., temporary solubilization of P fertilizer in cool soils.
Fungi can also compete for available P supply, but in some cases fungi can act as an extension of the rooting system and increase P uptake (e.g., mycorrhizae fungi).
¬¬ Key Practical point: Since P fertilizers are more rapidly modified (i.e., made less available for plant uptake) when thoroughly mixed with the soil, some types of band application (seedrow, deep-band, side-band) are usually most effective.
Root proliferation in the area of band results in higher uptake of both P and N. ¬¬ Key Practical point: Fertilizer P application at the time of seeding approximately 1½″ below and 1½″ to the side of the seedrow, or applied 1/3 in the seedrow and 2/3 in a shallow band, thereby ensuring early crop uptake, while providing protection against the risk of germination damage associated with seedrow P, has been shown to be very effective9. Sulphur (S)
In small grains, S uptake is most rapid up to the flowering stage. In canola, maximum S uptake and accumulation occurs between 5 and 6 weeks after seeding7.
Potassium (K)
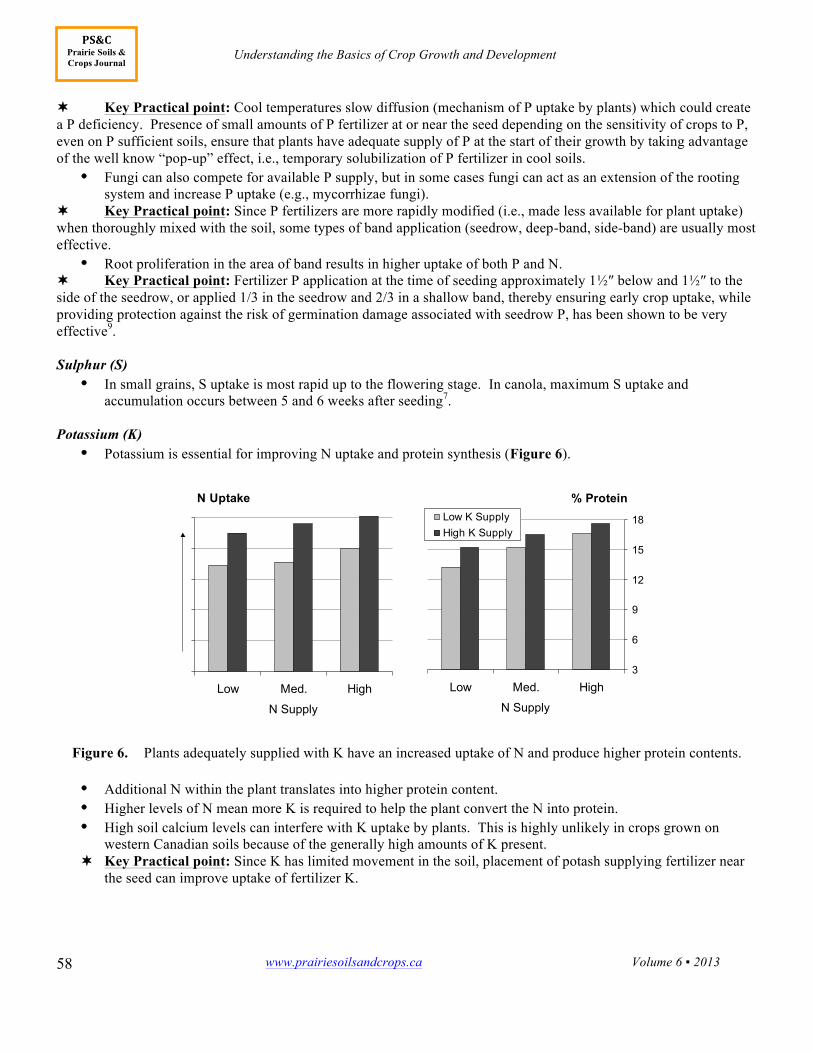
Potassium is essential for improving N uptake and protein synthesis (Figure 6).
Figure 6. Plants adequately supplied with K have an increased uptake of N and produce higher protein contents.
Additional N within the plant translates into higher protein content. Higher levels of N mean more K is required to help the plant convert the N into protein. High soil calcium levels can interfere with K uptake by plants. This is highly unlikely in crops grown on
western Canadian soils because of the generally high amounts of K present. ¬¬ Key Practical point: Since K has limited movement in the soil, placement of potash supplying fertilizer near
the seed can improve uptake of fertilizer K.
% Protein
3
6
9
12
15
18
Low Med. High
N Supply
Low K SupplyHigh K Supply
N Uptake
0
1
2
3
4
5
Low Med. High
N Supply
Understanding the Basics of Crop Growth and Development
Volume 6 ▪ 2013 www.prairiesoilsandcrops.ca
59
PS&C Prairie Soils & Crops Journal
Secondary Nutrients and Micronutrients Micronutrients can react with other nutrients to form insoluble compounds (i.e., become unavailable) for plant
uptake. High soil P can depress zinc (Zn) uptake. Singh et al.17 attributed this effect in cereals to suppression of
mycorrhizae that live in association with plant roots in the presence of high levels of P. The same authors attributed the same phenomenon in peas to plant dilution effects and reduced translocation of Zn from roots to tops18.
Excess K can reduce the uptake of magnesium (Mg), if grasses are being grazed by livestock. Low soil temperatures and plenty of soil moisture in the presence of only moderate amounts of K can result in
higher K uptake compared to Mg and the development of tetany-prone forage grasses. Manganese (Mn) is involved in metabolism by influencing uptake and assimilation of other nutrients.
Karamanos et al.4,5,6 demonstrated a manganese × copper interaction in wheat and barley. Heavy P applications increase molybdenum (Mo) uptake by plants. Heavy S applications decrease Mo uptake by plants. This interaction was assessed in a study by Karamanos et
al.5, who showed that lowering Mo levels in canola by heavy S application eliminated a molybdenum × copper antagonism and led to alleviation of a copper deficiency.
Molybdenum enhances the uptake of N, K and calcium (Ca). Chloride (Cl) may compete with nitrate uptake, tending to promote the use of ammonium-N rather than nitrate-
N; this has been observed with winter wheat. References 1. Caassen, N. and Barber, S. A. 1976. Simulation model for nutrient uptake from soil by a growing plant root system.
Agron. J. 68: 961-964. 2. Hoagland, D.R. 1948. Lectures on the inorganic nutrition of plants p. 48-71. Chronica Botanica Company, Waltham,
Mass., USA. 3. Hopkins, H.T. 1956. Absorption of ionic species of orthophosphate by barley roots: effects of 2,4-dinitrophenol and
oxygen tension. Plant Physiol. 31: 155-161. 4. Karamanos, R.E., Fradette, J.G. and Gerwing, P.D. 1985. Evaluation of copper and manganese nutrition of spring wheat
grown on organic soils. Can. J. Soil Sci. 65: 133-148. 5. Karamanos, R.E., Hodge, N. and Stewart, J.W.B. 1989. The effect of sulphur on the manganese and copper nutrition of
canola. Can. J. Soil Sci. 69: 119-125. 6. Karamanos, R.E., Kruger, G.A. and Singh, J.P. 1991. Manganese and copper interaction in barley grown on organic soils.
Comm. Soil Sci. Plant Anal. 22: 1397-1408. 7. Karamanos, R.E., Poisson, D.P. and Goh, T.B. 2004. Biomass and nutrient accumulation in hybrid canola. In Proc. Soils
and Crops 2004. Extension Division, University of Saskatchewan, Saskatoon, SK. 8. Karamanos, R. E., Flore N. A. and Harapiak, J. T. 2005. Effect of post-emergence nitrogen application on the yield and
protein content of wheat. Can. J. Plant Sci. 85: 327–342. 9. Karamanos, R. E., Harapiak, J. T. and Flore, N. A. 2008. Long-term effect of placement of fertilizer nitrogen and
phosphorus on barley yields. Can. J. Plant Sci. 88: 285-290. 10. Le Bot, J., Adamowicz. S. and Robin, P. 1998. Modelling plant nutrition of horticultural crops: A review. Sci. Hortic. 74:
47–82. 11. Malhi, S. S., Johnston, A. M., Schoenau, J. J., Wang, Z. H. and Vera, C. L. 2006. Seasonal biomass accumulation and
nutrient uptake of Canola, Mustard, and Flax on a Black Chernozem Soil in Saskatchewan. Can. J. Plant Sci. 86: 1005–1014.
12. Malhi, S. S., Johnston, A. M., Schoenau, J. J., Wang, Z. H. and Vera, C. L. 2007. Seasonal biomass accumulation and nutrient uptake of wheat, barley and oat on a Black Chernozem soil in Saskatchewan. J. Plant Nutr. 30: 641-658.
13. Manitoba Agriculture, Food and Rural Initiatives. 2013. Soil Fertility Guide - Phosphorus (P) Online: https://www.gov.mb.ca/agriculture/soilwater/nutrient/fbd02s03.html. Accessed: May 3, 2013.
Understanding the Basics of Crop Growth and Development
www.prairiesoilsandcrops.ca Volume 6 ▪ 2013
60
PS&C Prairie Soils & Crops Journal
14. Mengel, K, and Kirkby, E.A. 1979. Principles of plant nutrition. International Potash Institute, Worblaufen-Bern,
Switzerland. 15. Schachtman , P., Reid, R. J. and Ayling, S.M. 1998. Phosphorus uptake by plants: From soil to cell. Plant Physiol.116:
447–453. 16. Singer, S.J. 1972. A fluid lipid-globular protein mosaic model of membrane structure. Ann. N.Y. Acad. Sci. 195: 16-23. 17. Singh, J.P., Karamanos, R.E. and Stewart, J.W.B. 1986. P-induced Zn deficiency in wheat on residual P plots. Agron. J.
78: 668-675. 18. Singh, J.P., Karamanos, R.E. and Stewart, J.W.B. 1988. The mechanism of phosphorus-induced zinc deficiency in beans
(Phaseolus vulgaris L.). Can. J. Soil Sci. 68: 345-358.
Understanding the Basics of Crop Growth and Development
Volume 6 ▪ 2013 www.prairiesoilsandcrops.ca
61
PS&C Prairie Soils & Crops Journal
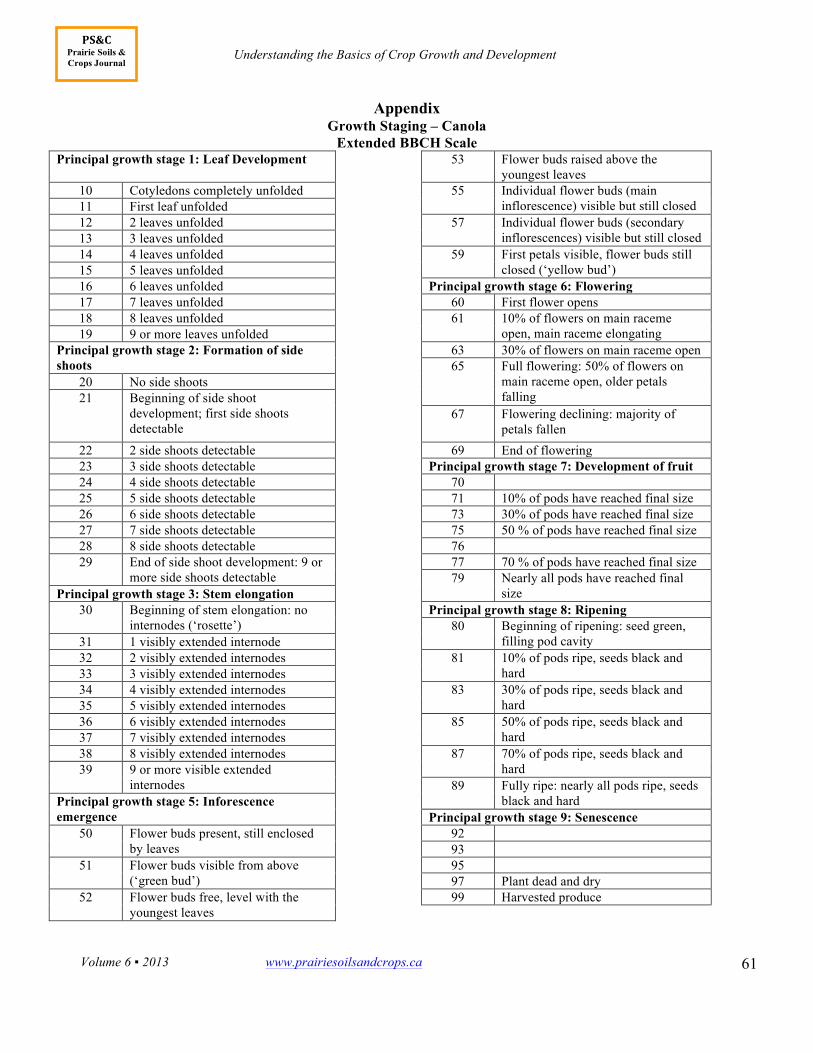
Appendix Growth Staging – Canola
Extended BBCH Scale Principal growth stage 1: Leaf Development 53 Flower buds raised above the
youngest leaves 10 Cotyledons completely unfolded 55 Individual flower buds (main
inflorescence) visible but still closed 11 First leaf unfolded 12 2 leaves unfolded 57 Individual flower buds (secondary
inflorescences) visible but still closed 13 3 leaves unfolded 14 4 leaves unfolded 59 First petals visible, flower buds still
closed (‘yellow bud’) 15 5 leaves unfolded 16 6 leaves unfolded Principal growth stage 6: Flowering 17 7 leaves unfolded 60 First flower opens 18 8 leaves unfolded 61 10% of flowers on main raceme
open, main raceme elongating 19 9 or more leaves unfolded Principal growth stage 2: Formation of side shoots
63 30% of flowers on main raceme open 65 Full flowering: 50% of flowers on
main raceme open, older petals falling
20 No side shoots 21 Beginning of side shoot
development; first side shoots detectable
67 Flowering declining: majority of
petals fallen 22 2 side shoots detectable 69 End of flowering 23 3 side shoots detectable Principal growth stage 7: Development of fruit 24 4 side shoots detectable 70 25 5 side shoots detectable 71 10% of pods have reached final size 26 6 side shoots detectable 73 30% of pods have reached final size 27 7 side shoots detectable 75 50 % of pods have reached final size 28 8 side shoots detectable 76 29 End of side shoot development: 9 or
more side shoots detectable 77 70 % of pods have reached final size
79 Nearly all pods have reached final size Principal growth stage 3: Stem elongation
30 Beginning of stem elongation: no internodes (‘rosette’)
Principal growth stage 8: Ripening 80 Beginning of ripening: seed green,
filling pod cavity 31 1 visibly extended internode 32 2 visibly extended internodes 81 10% of pods ripe, seeds black and
hard 33 3 visibly extended internodes 34 4 visibly extended internodes 83 30% of pods ripe, seeds black and
hard 35 5 visibly extended internodes 36 6 visibly extended internodes 85 50% of pods ripe, seeds black and
hard 37 7 visibly extended internodes 38 8 visibly extended internodes 87 70% of pods ripe, seeds black and
hard 39 9 or more visible extended internodes
89 Fully ripe: nearly all pods ripe, seeds
black and hard Principal growth stage 5: Inforescence emergence
Principal growth stage 9: Senescence
50 Flower buds present, still enclosed by leaves
92 93
51 Flower buds visible from above (‘green bud’)
95 97 Plant dead and dry
52 Flower buds free, level with the youngest leaves
99 Harvested produce
Understanding the Basics of Crop Growth and Development
www.prairiesoilsandcrops.ca Volume 6 ▪ 2013
62
PS&C Prairie Soils & Crops Journal
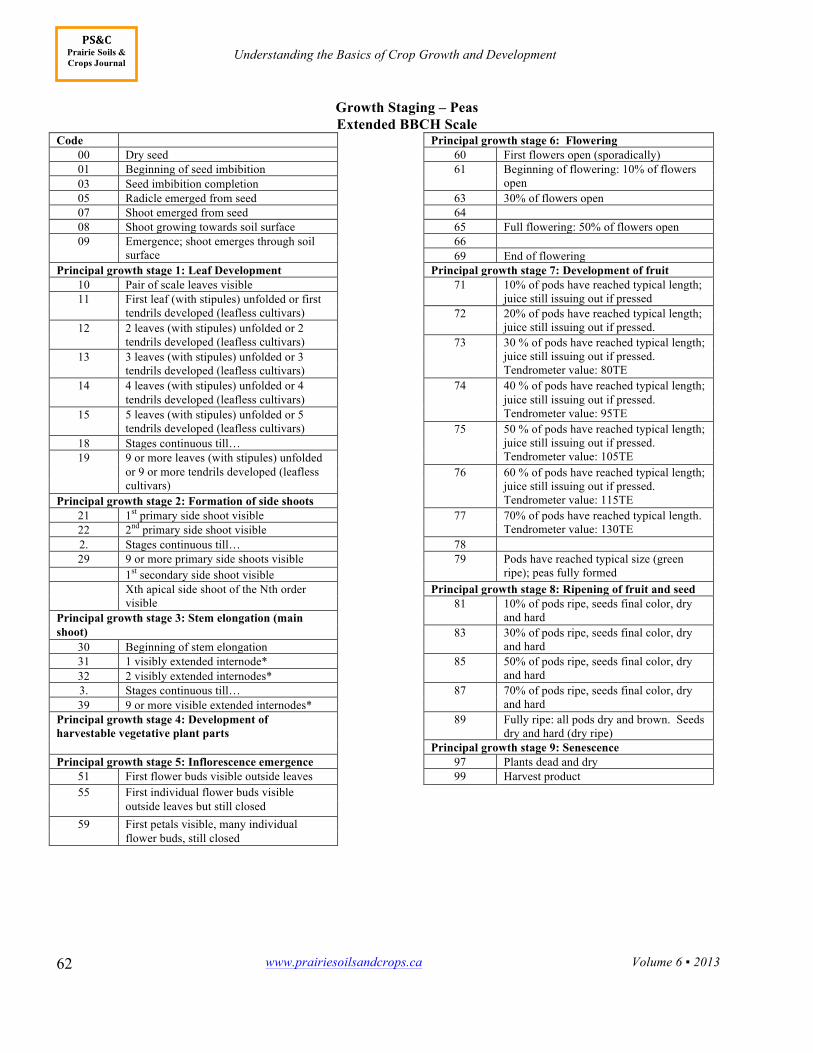
Growth Staging – Peas Extended BBCH Scale
Code Principal growth stage 6: Flowering 00 Dry seed 60 First flowers open (sporadically) 01 Beginning of seed imbibition 61 Beginning of flowering: 10% of flowers
open 03 Seed imbibition completion 05 Radicle emerged from seed 63 30% of flowers open 07 Shoot emerged from seed 64 08 Shoot growing towards soil surface 65 Full flowering: 50% of flowers open 09 Emergence; shoot emerges through soil
surface 66
69 End of flowering Principal growth stage 1: Leaf Development Principal growth stage 7: Development of fruit
10 Pair of scale leaves visible 71 10% of pods have reached typical length; juice still issuing out if pressed 11 First leaf (with stipules) unfolded or first
tendrils developed (leafless cultivars)
72 20% of pods have reached typical length; juice still issuing out if pressed. 12 2 leaves (with stipules) unfolded or 2
tendrils developed (leafless cultivars)
73 30 % of pods have reached typical length; juice still issuing out if pressed. Tendrometer value: 80TE
13 3 leaves (with stipules) unfolded or 3 tendrils developed (leafless cultivars)
14 4 leaves (with stipules) unfolded or 4 tendrils developed (leafless cultivars)
74 40 % of pods have reached typical length; juice still issuing out if pressed. Tendrometer value: 95TE 15 5 leaves (with stipules) unfolded or 5
tendrils developed (leafless cultivars) 75 50 % of pods have reached typical length; juice still issuing out if pressed. Tendrometer value: 105TE
18 Stages continuous till… 19 9 or more leaves (with stipules) unfolded
or 9 or more tendrils developed (leafless cultivars)
76 60 % of pods have reached typical length;
juice still issuing out if pressed. Tendrometer value: 115TE
Principal growth stage 2: Formation of side shoots
21 1st primary side shoot visible 77 70% of pods have reached typical length. Tendrometer value: 130TE 22 2nd primary side shoot visible
2. Stages continuous till… 78 29 9 or more primary side shoots visible 79 Pods have reached typical size (green
ripe); peas fully formed 1st secondary side shoot visible Xth apical side shoot of the Nth order
visible Principal growth stage 8: Ripening of fruit and seed
81 10% of pods ripe, seeds final color, dry and hard Principal growth stage 3: Stem elongation (main
shoot)
83 30% of pods ripe, seeds final color, dry and hard 30 Beginning of stem elongation
31 1 visibly extended internode* 85 50% of pods ripe, seeds final color, dry and hard 32 2 visibly extended internodes*
3. Stages continuous till… 87 70% of pods ripe, seeds final color, dry and hard 39 9 or more visible extended internodes*
Principal growth stage 4: Development of harvestable vegetative plant parts
89 Fully ripe: all pods dry and brown. Seeds dry and hard (dry ripe)
Principal growth stage 9: Senescence Principal growth stage 5: Inflorescence emergence 97 Plants dead and dry
51 First flower buds visible outside leaves 99 Harvest product 55 First individual flower buds visible
outside leaves but still closed
59 First petals visible, many individual
flower buds, still closed
Understanding the Basics of Crop Growth and Development
Volume 6 ▪ 2013 www.prairiesoilsandcrops.ca
63
PS&C Prairie Soils & Crops Journal
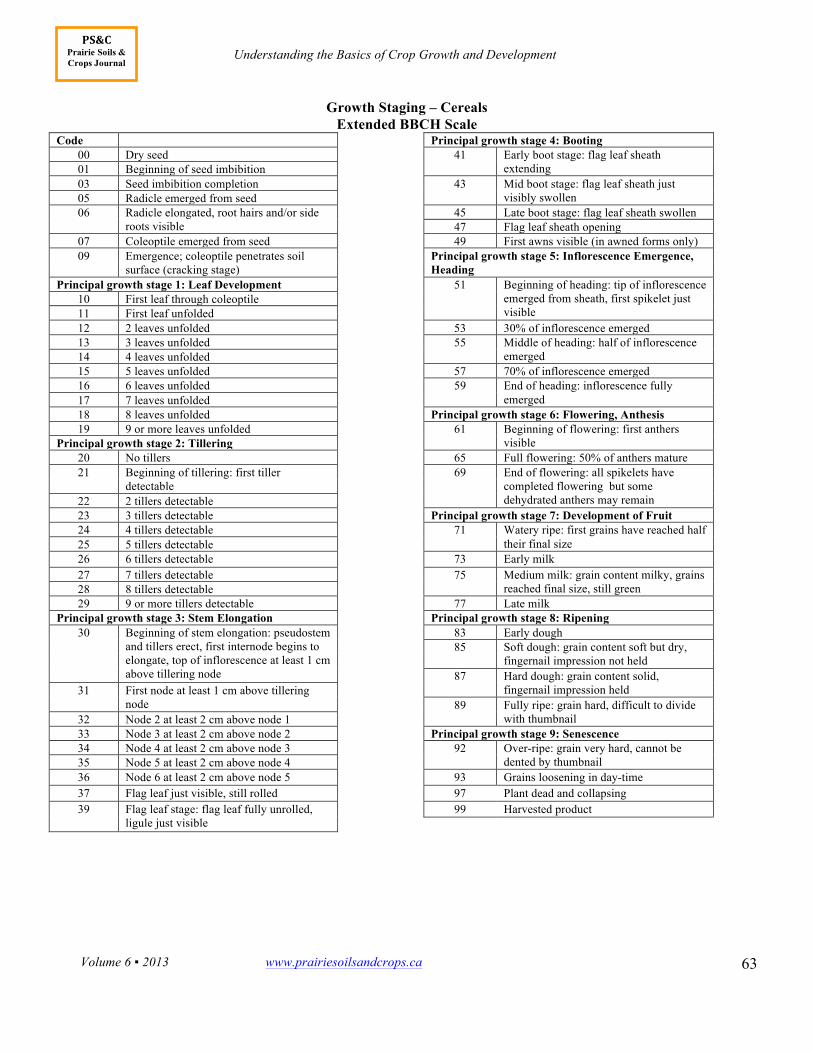
Growth Staging – Cereals Extended BBCH Scale
Code Principal growth stage 4: Booting 00 Dry seed 41 Early boot stage: flag leaf sheath
extending 01 Beginning of seed imbibition 03 Seed imbibition completion 43 Mid boot stage: flag leaf sheath just
visibly swollen 05 Radicle emerged from seed 06 Radicle elongated, root hairs and/or side
roots visible 45 Late boot stage: flag leaf sheath swollen 47 Flag leaf sheath opening
07 Coleoptile emerged from seed 49 First awns visible (in awned forms only) 09 Emergence; coleoptile penetrates soil
surface (cracking stage) Principal growth stage 5: Inflorescence Emergence, Heading
Principal growth stage 1: Leaf Development 51 Beginning of heading: tip of inflorescence emerged from sheath, first spikelet just visible
10 First leaf through coleoptile 11 First leaf unfolded 12 2 leaves unfolded 53 30% of inflorescence emerged 13 3 leaves unfolded 55 Middle of heading: half of inflorescence
emerged 14 4 leaves unfolded 15 5 leaves unfolded 57 70% of inflorescence emerged 16 6 leaves unfolded 59 End of heading: inflorescence fully
emerged 17 7 leaves unfolded 18 8 leaves unfolded Principal growth stage 6: Flowering, Anthesis 19 9 or more leaves unfolded 61 Beginning of flowering: first anthers
visible Principal growth stage 2: Tillering 20 No tillers 65 Full flowering: 50% of anthers mature 21 Beginning of tillering: first tiller
detectable 69 End of flowering: all spikelets have
completed flowering but some dehydrated anthers may remain
22 2 tillers detectable 23 3 tillers detectable Principal growth stage 7: Development of Fruit 24 4 tillers detectable 71 Watery ripe: first grains have reached half
their final size 25 5 tillers detectable 26 6 tillers detectable 73 Early milk 27 7 tillers detectable 75 Medium milk: grain content milky, grains
reached final size, still green 28 8 tillers detectable 29 9 or more tillers detectable 77 Late milk
Principal growth stage 3: Stem Elongation Principal growth stage 8: Ripening 30 Beginning of stem elongation: pseudostem
and tillers erect, first internode begins to elongate, top of inflorescence at least 1 cm above tillering node
83 Early dough 85 Soft dough: grain content soft but dry,
fingernail impression not held 87 Hard dough: grain content solid,
fingernail impression held 31 First node at least 1 cm above tillering node
89 Fully ripe: grain hard, difficult to divide
with thumbnail 32 Node 2 at least 2 cm above node 1 33 Node 3 at least 2 cm above node 2 Principal growth stage 9: Senescence 34 Node 4 at least 2 cm above node 3 92 Over-ripe: grain very hard, cannot be
dented by thumbnail 35 Node 5 at least 2 cm above node 4 36 Node 6 at least 2 cm above node 5 93 Grains loosening in day-time 37 Flag leaf just visible, still rolled 97 Plant dead and collapsing 39 Flag leaf stage: flag leaf fully unrolled,
ligule just visible 99 Harvested product