Embed Size (px)
Citation preview

EFFICIENT HYDROGEN PRODUCTION USING ENZYMES OFTHE PENTOSE PHOSPHATE CYCLE
Narinder I. Heyer and Jonathan WoodwardOak Ridge National Laboratory
Oak Ridge, TN 37831-6194
Abstract
Increase in the production of hydrogen from biomass-derived glucose and attainment of themaximum molar yield of H2, can be achieved through the enzymes of the pentose phosphatecycle in conjunction with a hyperthermophilic hydrogenase. This process centers on threeNADP+ dependent enzymes, glucose-6 phosphate dehydrogenase (G6PDH), 6-phosphogluconatedehydrogenase (6PGDH) and hydrogenase from Pyrococcus furiosus. The dehydrogenases arecurrently obtained from mesophilic sources. However, in order to increase the rates andsustainability of hydrogen production, work has been carried out to isolate the genes for theseenzymes from thermophilic sources. Success has been achieved through the isolation and cloningof both genes from the bacterial species Thermotoga maritima.
Individual characterization of both mesophilic enzymes has revealed that the first enzymeG6PDH, has a 20-fold greater turnover number than that of the second enzyme. However, thesecond enzyme 6PGDH, is far more thermostable, possessing a t50% of 130 mins at 60oC. Themaximum yield of hydrogen from glucose using only the oxidative portion of the pentosephosphate pathway (two moles per mole of glucose 6-phosphate) has been achieved usingmesophilic sources of these enzymes in conjunction with a hyperthermophilic hydrogenase at40oC. Additional monitoring of CO2 evolution confirmed the stoichiometry of H2 to CO2 to be2:1. Variation of the components and conditions of the system show that 6-PGDH is the rate-limiting step in the pathway and is required in over 20-fold greater amounts to prevent the buildup of the intermediate 6-phosphogluconic acid.

Introduction
Significance and Background
The inevitable consumption of all our supplies of fossil fuels requires the development ofalternative sources of energy for the future. Introduction of a hydrogen economy will gaingreater importance due to the promise of using hydrogen over fossil fuels. These advantagesinclude its limitless abundance and also its ability to burn without generating any toxic by-products, where the only by-product of hydrogen combustion is water.
At present hydrogen is widely used in petroleum refining and chemical processes, metalprocessing operation, in the electronics industry and more famously as rocket fuel. In addition, itis now gaining more acclaim as an alternative fuel for transportation (Leslie, 1997).
Hydrogen is currently produced by several methods, including steam/methane reforming (Wilsonand Newall, 1970), dissociation of ammonia, and by-product streams from chemicalmanufacturing and petroleum reforming. However, despite all the promise of this potential newfuel, much controversy is being made about these methods of manufacturing hydrogen. This isdue to the absence of a practical natural source of hydrogen. Therefore, it must be made bytransforming some other energy source at a cost. Even electrolysis of sea water, a vast reserve ofhydrogen, would require the use of electricity. Additionally, the manufacture of hydrogen frompetroleum and methane eventually leads to the release of carbon dioxide, thus creating a cost tothe environment. Consequently this has led to the discovery of hydrogen manufacture fromrenewable, less costly and non-polluting sources.
Alternative method of hydrogen production
The enzymatic conversion of cellulosic waste to H2 via an in vitro enzymatic pathway(Woodward et. al., 1996; Woodward and Orr, 1998; Inoue et al., 1999; Woodward et al., 2000)involves the conversion of potential glucose sources such as cellulose by cellulases, and plantsap (i.e. sucrose) by invertase and glucose isomerase to glucose. Glucose, the sugar produced byphotosynthesis, is also renewable, unlike fossil fuels such as oil. The glucose substrate is thenoxidized and the cofactor, NADP+ is simultaneously reduced. The presence of a pyridine-dependent-hydrogenase in this system (Egerer et al., 1982; Bryant and Adams, 1989), causes theregeneration and recycling of NAD(P)+ with the concomitant production of molecular hydrogen.
Pentose Phosphate Pathway (PPP)
The pentose phosphate pathway is primarily an anabolic pathway that utilizes the 6 carbons ofglucose to generate 5 carbon sugars and reducing equivalents (Fig. 1). However, this pathwaydoes oxidize glucose and under certain conditions can completely oxidize glucose to CO2 andwater. The pentose phosphate pathway has both an oxidative and non-oxidative arm.

Fig. 1 The pentose phosphate pathway
Oxidative Branch of the Pentose Phosphate Pathway
The oxidation steps, utilizing glucose-6-phosphate (G6P) as the substrate, occur at the beginningof the pathway and are the reactions that generate NADPH. The reactions catalyzed by glucose-6-phosphate dehydrogenase and 6-phosphogluconate dehydrogenase generate two moles ofNADPH for every mole of glucose-6-phosphate (G6P) that enters the PPP. The first step is rate-limiting and is essentially irreversible due to the spontaneous hydrolysis of the intermediate 6-
6 Glucose-6-phosphate
6NADP+
6NADP+
6NADPH
6NADPH
6 6PG
6 Ru5P
G6P Dehydrogenase
6PG Dehydrogenase
6 CO2
2 R5P2 X5P
2 S7P2 G3P
R5P Isomerase
2 X5P
2 E4P 2 F6P
2 F6P
2 G3P
G3PDHAP
FDP
F6P
G6P
4 G6P
Ru5P 3-epimerase
Hydrogenase
Transketolase
Transketolase
Transaldolase
Phosphohexoseisomerase
G6P
G3P
R5P
DHAP
6PG
E4P
X5P
FDP
Ru5P
F6P
S7P
Pi
Glucose-6-phosphate
Glyceraldehyde-3-phosphate
Ribose-5-phosphate
Dihydroxyacetone Phosphate
6-Phosphogluconate
Erythrose-4-phosphate
Xylulose-5-phosphate
Fructose Diphosphate
Ribulose-5-phosphate
Fructose-6-phosphate
Sedoheptulose-7-phosphate
Inorganic Phosphate
Key:
Phosphohexoseisomerase
Phosphohexose isomerase
P1
Triose phosphate isomerase
FDP Aldolase
FDPhosphatase
12 H1 cycle ofpathway)
2

phosphogluconolactone into 6-phosphogluconic acid. It is regulated by the NADP+/NADPHratio through substrate competition.
Non-oxidative Branch of the Pentose Phosphate Pathway
The non-oxidative reactions of the PPP are primarily designed to generate ribose-5-phosphate(R5P) for the synthesis of nucleotides and nucleic acids. Equally important reactions of the PPPare the conversion of dietary 5 carbon sugars into both 6- (fructose-6-phosphate) and 3-(glyceraldehyde-3-phosphate) carbon sugars, which can then be utilized by the pathways ofglycolysis. The 6-carbon sugars can be recycled into the pathway in the form of G6P, generatingmore NADPH.
Thermostable Enzymes
With the exclusion of phylogenetic variations, thermostable enzymes are found to be very similarto their mesophilic counterparts in terms of their amino acid sequence (Vielle et al., 1995;Burdette et al., 1996) and three-dimensional structures and catalytic mechanisms (Fujinaga et al.,1993; Russel et al., 1997). In addition to enhanced stability at elevated temperatures,thermophilic enzymes also possess a greater resistance to chemical denaturation than theirmesophilic counterparts (Lebbink et al., 1995).
Three Domains of Life
The evolutionary history of life is provided by sequence comparisons of small subunit rRNA dueto its strictly conserved function and its non-transfer between species. Comparison of thesesequences proposes a tripartite division of the living world into the following domains, Eukarya,Eubacteria and Archaea (Fig. 2) (Woese and Fox, 1977; Woese et al., 1990).
Bacteria Archaea Eucarya
Thermotogales
FlavobacteriaCyanobacteria
PurpleBacteria
GramPositives
GreenNon-sulfurBacteria
ThermoproteusPyrodictium T.celer
Methan-ococcus
Methano-bacterium
MethanosarcinaHalophiles
Entamoebae SlimeMolds
Animals
Fungi
Plants
Cillates
Flagellates
Trichomonads
MicrosporidiaDiplomonads
Cren-archaeota
Euryarchaeota
Fig. 2 The Universal phylogenetic tree, constructed from rRNA sequencecomparisons, according to Woese et al. (1990).
Sulfolobus
Sulfolobus solfataricus
Sulfolobus solfataricus is an aerobic hyperthermophilic archaebacteria able to grow at 87oC andpH 3.5 (Zillig et al., 1980). Sulfolobus solfataricus belongs to the kingdom of Crenarchaeotawithin the domain of Archaea (Fig. 2). Various strains of Sulfolobus solfataricus have beenisolated from a number of geographically distant, aquatic and terrestrial solfatara fields (Brock etal., 1972; De Rosa et al., 1974; De Rosa et al., 1975; Zillig et al., 1980; Segerer and Stetter,1991; Zillig et al., 1994). It is able to grow on various complex organic substrates, as well assimple sugars and amino acids (Brock et al., 1972; Segerer and Stetter, 1991). Its centralmetabolism is thought to occur via non-phosphorylated intermediates through a pathway calledthe non-phosphorylated Entner-Doudoroff (ED) pathway. However, further analysis by Selig etal. (1997) revealed that a variety of hyperthermophiles, and particularly the anaerobic archaea,were able to degrade sugar to pyruvate using modified Embden-Meyerhof (EM) and EDpathways or a combination of both.
Thermotoga maritima
Thermotoga maritima is an anaerobic hyperthermophilic eubacterium with an optimum growthtemperature of 80oC, that has been isolated from geothermally-heated sea floors in Italy and theAzores (Huber et al., 1986). T. maritima is able to grow on many simple and complexcarbohydrates including glucose, sucrose, starch, cellulose and xylan (Huber et al., 1986; Huberet al., 1992).
T. maritima type strain, MSB8 was cloned, sequenced and assembled by The Institute forGenomic Research (TIGR) from a culture derived from a single cell provided by R. Huber(Nelson et al., 1999). Small subunit ribosomal RNA (SSU rRNA) phylogeny places thisbacterium as one of the deepest and most slowly evolving lineages in the Eubacteria(Achenbach-Richter et al., 1987). In addition, conservation of gene order between T. maritimaand the Archaea in many of the clustered regions suggests that lateral gene transfer may haveoccurred between thermophilic Eubacteria and Archaea. Complete genome sequencing revealedthe presence of the enzymes constituting the pentose phosphate pathway. However, initialinvestigations did not find all the expected enzyme activities for this pathway (Nelson et al.,1999). Metabolism of sugar in T. maritima is thought to occur via the EM, ED and the pentosephosphate pathways (Nelson et al., 1999; Selig et al., 1997).
Oxidative pentose phosphate enzymes from T. maritima genome project
The gene coding for G6PDH is located at 1,170,072 � 1,168,555 bp at locus TM1155 and codesfor a protein 496 amino acids in length (Fig. 3). At a remote location in the T. maritima genomeof 459,482 � 460,888 bp, locus TM04308 is the gene coding for 6PGDH. This gene codes for aprotein of length 469 aa (Fig. 3).

1 MKCSLGLEKC.PDDTLRCFPK.IEQPFGIVIF.GASGDLTKRK.LIPALNRLFE.AGILPERFFV 61 GAARTKMDD.KKFRSRFDAN.PDFLEHCSYI.SVDYQDPESF.KQLKNTIETL.IKRIDSSNLV121 FYLAVPPDLY IPILENLSKT GLNEKPARVV IEKPFGKDLE SARRLEDTLQ KYFQEDQIFR181 IDHYLGKETV QNILVFRFAN FIFEEIWNNK FVDHVQITMA EDIGVEHRAG YFENVGLLRD241 IFQNHMLQIL ALIAMEPPSS FNGENFRNER VKLLRSIRPF PVEELESWIV RGQYGRGVVN301 GKEVPAYREE PGVAKDSNVE TFVAMKLFID NWRWSGVPFY LRSGKRLPKK ITEVAVVFKK361 IPHSIFAGVP SDELEPNTIV FTLQPNEGIS LEFQVKRPCP GMFPQLLSMD FRYEDYFGVK421 LPDAYERLLL DVILGDPTLF MRRDDLEVSW ELLDPVLKAW ENDPVRFSPY VYPAGTWGPR481 EADLLIERDG RKWRKL
1 MKSHIGLIGL AVMGQNLALN IARKGYKVSV YNRTAQRTEE FVKNRVTNEE IEPHYDIESF 61 VKSLERPRKI ILMVKAGKPV DDTISQLLPH LEPGDLIIDG GNSHYMDTER RFKELSEKGI 121 LFLGMGVSGG EYGALHGPSL MPGGSREAYN LVEEILLEIA AKTEDGPCCT YVGERSAGHF 181 VKMVHNGIEY AIMQAIAEVY HIMRDVLSLS SEEMSSIFEE WNRGELSSFL VEITYKILRK 241 KDEETGKPMV DVILDKAEQK GTGKWTSQAA LDLGIPTPSI NLAVVERVIS HFKDIRTRLS 301 KLYNKRRSAT QGSEEFLRDL RNSLFFAMFM AFSQGMWLIA EASKEFGYGV SLSEVLRIWK 361 GGCIIRAKLI DTLRRYISNE NAYLLENEEV MNLLKGKIDS LKNILKASIE NEIPVPVLSS 421 SYNYFMSLTE ERLPANLIQA QRDFFGAHTF ERVDREGVFH INWEEGEIG
Fig. 3. Amino acid sequences of G6PDH and 6PGDH from T. martima ,respectively.
Aim
The overall aim is to increase the production of hydrogen from biomass-derived glucose andachieve the maximum molar yield of H2 by employing the enzymes of the pentose phosphatepathway in conjunction with the hydrogenase from Pyrococcus furiosus. This will also requirethe future development of an immobilized enzyme bioreactor for efficient hydrogen productionat high theoretical yields. If this could be achieved practically, this would represent a majorinnovation that would advance our abilities to develop an efficient and practical system for bio-hydrogen production. The main advantage over hydrogen production by fermentation is thatclose-to-theoretical yields of hydrogen from sugar would be possible.
The initial objective is to characterize the mesophilic enzymes of the oxidative branch of thepentose phosphate pathway, with a view to identifying the rate-limiting steps and optimizing thesystem. This process centers on three NADP+ dependent enzymes, glucose-6-phosphatedehydrogenase (G6PDH), 6-phosphogluconate dehydrogenase (6PGDH) and hydrogenase (Fig.4). The dehydrogenases are currently obtained from commercial mesophilic sources, fromLeuconostoc mesenteroides and Torula yeast, respectively. However, in order to increase therate of hydrogen production, it is necessary to isolate the genes coding for G6PDH and 6PGDHfrom Thermotoga maritima. The final objective is to express these genes as recombinantenzymes in a mesophilic host and incorporate them into an entirely hyperthermophilic in vitroenzymatic H2 production system.

Hydrogenase Hydrogenase
H2 + H2 + NADP NADPH NADP NADPHGlucose-6- 6-Phosphgluconic Ribulose � 5Phosphate acid (6-PG) phosphate (G-6-P) CO2 (Ru-5-P)
Fig. 4 In vitro enzymatic pathway to produce molecular hydrogen
Results
Characterization of the Mesophilic Oxidative Branch of the Pentose PhosphatePathway
Characterization Studies
Temperature and pH optima
The optimal temperature and pH for the G6PDH from Leuconostoc mesenteroides are 30oC andpH 7.8, and for 6PGDH from Torula yeast are pH 7.6 and 50oC. The optimal pH of the two-enzyme pathway was also determined to be approximately pH 8 (Fig.5).
0
0.05
0.1
0.15
0.2
0.25
0.3
0.35
0.4
0.45
5 5.5 6 6.5 7 7.5 8 8.5 9
pH
Rat
e of
NA
DPH
pro
duce
d (u
mol
es/m
in)
NaP
HEPES
MES
Figure 5. The effect of pH on the activity of the mesophilicoxidative branch of the pentose phosphate pathway.

Thermal inactivation
Thermal inactivation studies of the mesophilic enzymes (Fig. 6) have revealed that G6PDH and6PGDH posses t50% at 60oC of 2.88 min and 126.8 min, respectively. Co-incubation of both ofthe enzymes at a final concentration of 1 mg/mL reveals that the higher protein concentration ofthe 6PGDH enzyme has not influenced its thermal stability in comparison to the G6PDHenzyme.
0
1
2
3
4
5
6
0 2 4 6 8 10 12 14
Time (min)
In %
Res
idua
l Act
ivity
G-6-PDH6-PGDHG-6-PDH + 6PGDH
Figure 6. Thermal inactivation studies of 6PGDH and G6PDH at 60oC. Proteinconcentrations of incubation reactions were the following: 6PGDH at 2 mg/mL,G6PDH at 0.045mg/mL and mixture at 1 mg/mL.
Kinetic parameters
The two individual enzymes were characterized to determine their kinetic parameters (Table 1).
Table 1. Kinetic data for mesophilic pentose phosphate enzyme
Glucose 6-phosphate dehydrogenase enzyme from Leuconstoc mesenteroidesSubstrate Km (mM) Vmax (µmoles/min) Turnover number (min-1)
glucose 6-phosphate 1.15 0.415NADP+ 0.060 0.35 4 x 10 4
6-Phosphogluconate dehydrogenase Type IV from Torula YeastSubstrate Km (mM) Vmax (µmoles/min) Turnover number (min-1)
6-phosphogluconic acid 1.65 0.22NADP+ 0.12 0.23 1.9 x 10³

Product inhibition
6-Phosphogluconic acid inhibition assays These were carried out at 40oC in 0.2 M sodiumphosphate buffer, pH 7.5 using 0.1U of G6PDH, 1 mM of NADP+ and 5 mM of Glucose-6-phosphate. No inhibition was observed at 10 mM concentrations of 6-phosphogluconic acid.
Ribulose-5-phosphate inhibition assays These were carried out at 40oC in 0.2 M sodiumphosphate buffer, pH 7.5 using 0.1U of each enzyme, 1 mM of NADP+ and 5 mM of Glucose-6-phosphate and 6-phosphogluonic acid, respectively (Table 2).
Table 2. Effect of Ru5P concentration on G6PDH and 6PGDH activity
Concentration of Ribulose-5-Phosphate (mM) 0 2.5 10Glucose-6-phosphate dehydrogenase activity (Units) 2.02 2.1 1.7546-Phosphogluconate dehydrogenase activity (Units) 0.41 0.39 0.28
In Vitro Hydrogen Production Studies
A continuous flow system was constructed to measure hydrogen and carbon dioxide productionbased on the system as shown and described in Woodward et al. (1996) and Greenbaum, (1984). Amodification was made with the inclusion of a CO2 analyzer in-line prior to the H2 sensor. Themaximum yield of hydrogen from glucose using only the oxidative portion of the pentosephosphate pathway (two moles per mole of glucose 6-phosphate) has been achieved usingmesophilic sources of these enzymes at 1 unit concentrations in conjunction with 68 units ofhyperthermophilic hydrogenase, at 40oC with 2.5 mM initial glucose 6-phosphate concentration.
Effect of pH
0 5 10 15 20 25 30 35 40 45 50 55 60 65 70 75-200
0
200
400
600
800
1000
1200
1400
1600
1800
2000
2200
pH 8.0 = 139 % yield
pH 7.5 = 118 % yield
pH 7.0 = 54 % yield
pH 6.0 = 57 % yield
nmol
s H
2/h
Time (h)
0 5 10 15 20 25 30-200
0
200
400
600
800
1000
1200
1400pH 6.0 = 60.36 % yield
pH 7.0 = 76.6 % yield
pH 7.5 = 83.22 % yield
pH 8.0 = 127.58 % yield
nmols
CO
2/h
Time (h)
Fig. 7. Effect of pH on the rate and yield of H2 and CO2 production.Using 2.5 mM G6P initial concentration, 2.0 mM NADP+, 1 Unit of eachPPP enzyme, 68U Hydrogenase in 0.2 M Sodium phosphate buffer at 40oC.

Subjecting the complete hydrogen system to pH values of pH 7.5 and 8.0 have also resulted inthe maximal percentage yields of H2 and CO2 from 2.5 mM G6P.
Effect of Temperature
Fig. 8. Effect of temperature on the rate and yield of H2 and CO2 production.Using 2.5 mM G6P initial concentration, 2.0 mM NADP+ 1 Unit of each PPPenzyme, 68 U Hydrogenase in 0.2 M Sodium phosphate buffer pH 7.5
Maximal theoretical yields of H2 and CO2 were achieved at 30 and 40oC. However, increasingthe temperature to 50oC led to the decrease in the yields of these two gases.
Effect of NADPH Concentration
0 5 10 15 20 25 30-200
0
200
400
600
800
1000
1200
1400
1600
2 mM NADPH = 100 %
4 mM NADPH = 91 %
0 mM NADPH = 86 %
nmol
s H
2/h
Time (h)
0 5 10 15 20 25 30
0
500
1000
1500
2000
2500
3000
4 mM NADPH = 235 % yield
2 mM NADPH = 136 % yield
0 mM NADPH = 83 %
nmol
s C
O2/h
Time (h)
Fig. 9. Effect of NADPH on the rate and yield of H2 and CO2 production.Using 2.5 mM G6P initial concentration, 1 Unit of each PPP enzyme, 68 UHydrogenase in 0.2 M Sodium phosphate buffer, pH 7.5 at 40oC
0 5 10 15 20 25 30 35 40 45 50 55 60 65 70
0
200
400
600
800
1000
1200
1400
1600
1800
40oC = 100 %
50oC = 54 %
30oC = 100 % nmole
s H2/h
Time (h)0 5 10 15 20 25 30 35 40 45 50 55 60 65 70
0
200
400
600
800
1000
40oC = 83 %
50oC = 73 %
30oC = 108 %
nmol
s CO
2/hTime (h)

Supplementing the reaction with additional reduced cofactor led to the expected increase in H2and CO2 production.
Adding increasing amounts of 6PGa from 0 � 10 mM, to the reaction system resulted in thereduction of H2 and CO2 that can be obtained from G6P at an initial concentration of 2.5 mM.
Effect of 6-Phosphogluconic Acid Concentration
Fig.10. Effect of 6-phosphogluconic acid on rate & yield of H2 and CO2 production.Using 2.5 mM G6P initial concentration, 2.0 mM NADP+ 1 Unit of each PPPenzyme, 68 U Hydrogenase in 0.2 M Sodium phosphate buffer, pH 7.5 at 40oC.
A 20-fold increase in the concentration of 6PGDH has brought about the increase in yields of H2and CO2 from an initial concentration of 10 mM G6P.
Effect of Ratio of the Two Pentose Phosphate Enzymes
Fig. 11. Effect of enzyme ratio on the rate and yield of H2 and CO2 production.Using 10.0 mM G6P initial concentration, 2 mM NADP+, 68 U Hydrogenase in 0.2 MSodium phosphate buffer, pH 7.5 at 40oC.
-2 0 2 4 6 8 10 12 14 16 18 20 22 24 26 28 30
0
500
1000
1500
2000
2500 10.0 mM = 66 %
2.5 m M = 53 %
0 mM = 87 %
nmol
s H 2/h
T ime (h)-2 0 2 4 6 8 10 12 14 16 18 20 22 24 26
-100
0
100
200
300
400
500
600
700
800
10.0 mM = 19 %
0 mM = 93 %
2.5 mM = 51 %
nmol
s C
O 2/h
T ime (h)
0 10 20 30 40 50
0
500
1000
1500
2000
2500
3000 G6PDH : 6PGDH
1 : 1 1 : 20 65 % 73 %
nmol
s H
2/h
Time (h)
0 10 20 30 40 50
0
200
400
600
800
1000
1200
G6PDH : 6PGDH
1 : 1 1 : 20 22 % 47 %
nmol
s C
O2/h
Time (h)

Isolation of a Thermophilic Oxidative Branch of the Pentose Phosphate Pathway
Approach with Sulfolobus solfataricus
Growth of Sulfolobus solfataricus
The hyperthermophilic counterpart of this system was being established using enzymes isolatedfrom the Archaeon Sulfolobus solfataricus. The culture was grown in ATCC medium #1304 at70oC for approximately 2 days. Cultures were grown as 5 mL cultures statically in test tubes oras 500 mL cultures in specifically designed vessels that allow continuous aeration (Fig. 12).After this time the cells were harvested and cell pellets were stored at �20oC. Genomic DNA wasisolated according to �Current Protocols in Molecular Biology� (1990).
Fig. 12. Diagrammatic depiction of vessel used for large scale culturing of S.solfataricus.
Large Scale Growth of Sulfolobus solfataricus culture 500 mL of aerated cultures were grownin medium A - standard ATCC Medium (# 1304) with 0.1% Casamino acids and 0.2% yeastextract as the carbon sources - and in medium B, with the addition of 0.5% Glucose and 0.5%Casamino acids and 1.0% yeast extract (Table 3).
Cell breakage Cell pellets were lysed in detergent (0.1% Triton-X100), lysozyme and DNase at37oC for 60 min
Cell Activity Assays These were carried out with lysed cell extracts at 70oC in sodium phosphatebuffer, pH 7.5 with 1 mM NADP+, 10 mM glucose, 1 mM glucose-6-phosphate and 2.5 mM 6-
70oCwaterbath
AIRLINE
0.2 µM filter
;�;�;�;�;��;�;

phosphogluconic acid. The enzyme activities of glucose dehydrogenase, G6PDH and 6PGDHwere determined, respectively (Table 4).
Table 3. S. solfataricus cell culture growth measured as absorbance at 600 nm
Time (hr) Cell density � measured as absorbance at OD600Standard medium Enhanced medium
0 0 07.5 0.035 0.0098.5 0.03 0.00824 0.19 0.15
Table 4. Determination of enzyme activities from S. sulfolobus cell extracts grownin standard and enhance media.
Enzyme activity Mediumtype
TotalActivityin 5 mL(Units)
Specific activity(U/mg of protein)
Specific activity(U/g of cells)
Glucose dehydrogenase Standard 2.9 0.13 5.18Glucose dehydrogenase Enhanced 2.1 0.07 1.52
G6PDH Standard N.O. - -G6PDH Enhanced 0.4 0.013 0.296PGDH Standard N.O. - -6PGDH Enhanced 0.4 0.013 0.29
N.O. = no activity observed
Semi-purification of 6PGDH
Purification of the 6PGDH from S. solfataricus cell pastes revealed a protein with approximatemolecular weight of 48 kDa. The following N-terminal sequence was obtained for this protein �MKIGLIGLGIMGYRIAANLAKANKLNLVYDRTQE. This sequence has been found to alignwith a number of 6PGDHs from other species as shown in Fig. 13, compiled according toThompson et al., (1994). This alignment also includes a putative 6PGDH from an alternativestrain of S. solfataricus, P2, obtained from the P2 genome project(http://www.cbr.nrc.ca/magpie/sulfolobus/sulfolobus.html).
First PCR Approach
The first requirement was to create a suitably sized gene fragment to act as a probe for the6PGDH gene in hybridization experiments with the S. solfataricus genome. An alignment of avariety of 6PGDHs from Eukarya and Eubacteria revealed a highly conserved region atapproximately 175-200bp (Fig. 14). Therefore, on assuming the exact conservation of this

region in the 6PGDH from S. solfataricus, degenerate primers were designed with in the N-terminus and the highly conserved region that was expected to generate a PCR product of 125-175 bp in length. The PCR reaction was optimized in terms of template DNA concentration,primer concentration, MgCl2 concentration and annealing temperature. Several PCR productswere obtained at 3 mM MgCl2 and 40oC annealing temperature. However, subsequent cloning,sequencing and database searching of those products revealed that they only gave matches withcatalase and a SocE regulatory protein. Another alignment of 6PGDHs including the recentlyreleased putative 6PGDH sequence from S. solfataricus strain P2(http://www.cbr.nrc.ca/magpie/sulfolobus/sulfolobus.html), revealed that the putative 6PGDHfrom S. solfataricus strain P2 does not possess the highly conserved region possessed by all theother enzymes (Fig. 14). Thus, this indicates that if the P2 sequence is in fact a 6PGDH then thehighly conserved may also be absent from the 6PGDH present in the P1 strain being used in thiswork.
%S.solf. P1 ----MKIGLIGLGIMGYRIAANLAKANKLNLVYDRTQEKIER 33S.solf. P2 ----MKVGFIGLGIMGFPMASNLLKAGYDLTVYNRTIEKAEK 34 58E.coli MS-KQQIGVVGMAVMGRNLALNIESRGYTVSVFNRSREKTEE 40 38S.typhimurium MS-KQQIGVVGMAVMGRNLALNIESRGYTVSVFNRSREKTEE 40 32Synechococcus MA-LQQFGLIGLAVMGENLALNIERNGFSLTVYNRTAEKTEA 40 44T.maritima -M-KSHIGLIGLAVMGQNLALNIARKGYKVSVYNRTAQRTEE 39 45D.melanogaster MSGQADIALIGLAVMGQNLILNMDEKGFVVCAYNRTVAKVKE 42 31S.cerevisiae MS--ADFGLIGLAVMGQNLILNAADHGFTVCAYNRTQSKVDH 40 38A.aeolicus ---MKTLFLIGLGRMGSALAYRLKNRGWEIYGYSRTQTTRER 38 44
. .:*:. ** : . . :.*: .
Fig. 13. N-terminal Alignment of 6-Phosphogluconate Dehydrogenases From AllThree Domains of Life. Arrow indicates the N-terminal sequence of 6PGDH fromS. solfataricus. Amino acid length and percentage identities to P1 N-terminalsequence are shown.
E.coli 175 ADGAGHYVKMVHNGIEYGDMQLIAEA 200S.typhimurium 174 ADGAGHYVKMVHNGIEYGDMQLIAEA 199Synechococcus 175 PGGSGHYVKMVHNGIEYGDMQLIAEA 200D.melanogaster 172 DGGAGHFVKMVHNGIEYGDMQLICEA 197Homo sapien 176 DEGAGHFVKMVHNGIEYGDMQLICEA 201S.cerevisiae 174 PAGAGHYVKMVHNGIEYGDMQLICEA 199T.maritima 174 ERSAGHFVKMVHNGIEYAIMQAIAEV 199A.aeolicus 164 SSGAGHFAKMVHNGIEYGIMEAIAEG 189S. solf. P2 162 DVGSGQALKLCNQVVVALNMVSVVEG 187
.:*: *: :: : * : *
Fig. 14. Alignment of 6PGDH �conserved region� From All Three Domains of Life
Second PCR Approach
Degenerate primers were designed immediately within the N-terminal sequence. A PCRfragment of expected approximate length of 100bp from genomic DNA was generated. This wasintended for use as a probe in hybridization experiments. The tandem positioning of the 6PGDH

and the G6PDH genes in the genome of the extremophilic and ancient eubacteria Aquifexaeolicus (Deckert et al., 1998), it is expected that sequencing of the hybridized clone may reveala glucose 6-phosphate dehydrogenase in its flanking regions. However, further searches of theDNA databases revealed the recent release of the sequence previously deemed to be the 6PGDHfrom S. solfataricus P2. However, it was now assigned the function of a 3-hydroxyisobutyratedehydrogenase. Another alignment of the P1 N-terminal sequence with several 3-hydroxyisobutyrate dehydrogenases was compiled to compare the relative sequence identities(Fig. 15).
% S.solf.P1 -MK-IGLIGLGIMGYRIAANLAKANKLNLVYDRTQEKIER38S.solf.P2 -MK-VGFIGLGIMGFPMASNLLKAGYDLTVYNRTIEKAEK 3857E.coli -MK-VGFIGLGIMGKPMSKNLLKAGYSLVVADRNPEAI—3652L.lactis MSK-IAFIGTGVMGAAMAGHLMDAGHDLIVYNRTKSKTD- 3841B.subtilis MKKTIGFIGLGVMGKSMASHILNDGHPVLVYTRTKEKAE- 39 48 * :.:**
*:** :: :: . . * *. .
Fig. 15. N-terminal alignment of 3-hydroxyisobutyrate dehydrogenases from allthree domains of life. Amino acid length and percentage identities to N-terminalsequence are shown.
Approach with Thermotoga maritima
100 mL cultures were grown in standard ATCC medium (#2114) under 100% N2 atmosphere forapproximately 2 days at 70oC. After this period the cells were harvested and stored as cell pelletsat �20oC. Genomic DNA isolation from T. maritima was carried out according to �CurrentProtocols in Molecular Biology� (1990)
Design of PCR Primers
PCR is employed to amplify the gene fragments from genomic DNA (Fig.16). Each set ofprimers allowed for the incorporation of the ribosome binding sites (Shine-Delgarno sequences)(Shine and Delgarno, 1974, 1975), which may aid future expression work (Table 4).
REVERSE PRIMER 3� 5� 5� 3� 3� 5� 5� 3� FORWARD PRIMER
Fig. 16. Mechanism of PCR amplification

Table 4. Primer sets used to generate amplified genes of 6PGDH and G6PDH.Shine-Delgarno sequences are shown underlined.
Name Sequence Length(bp)
Meltingtemp. (Tm)
6PGDH-F 5� GCT TTA CAT CGA AGG TAA AGC TCT 3� 24 59.36PGDH-RA 5� GTA GAC CTT CGT TCT CAC GAG G 3� 22 62.1G6PDH-F 5� CAA CGT ACC CAT CTT CGA GCA GG 3� 23 64.2
G6PDH-RA 5� GGC AGG TGA GAT CAT GAA GTG CAG TC 3� 26 66.4PCR from T. maritima
Carried out using �hot-start� method to prevent non-specific binding, with 600 ng (template)gDNA, 1µM of primers, 1.5 - 2.5 mM MgCl2 and at an annealing temperature of 55oC, 1.5 KbPCR fragments were obtained for both reactions, which is the desired size of each gene product.
Cloning & Transformation
The generated PCR fragments were directly ligated to the cloning vector pCR2.1 using standardTA cloning sites. The recombinant vectors were subsequently transformed into Eschericia colistrain TOP10F� (non-expression host). Colonies were selected by ampicillin resistance andblue/white screening (successful insertion into the multiple cloning site of pCR2.1 causes theinterruption of the lacZ gene coding for the α peptide of β-galactosidase and results in the failureto convert substrates such as X-Gal to a colored product and produce blue colonies). Plasmidmini preps were employed to extract the recombinant plasmid DNA from selected cultures.Restriction digests were then carried out to excise the 1.5 Kb gene inserts using restrictionenzyme EcoRI. This would confirm the successfulness of the cloning procedure. Both sets ofvectors contained the 1.5 Kb inserts.
Sequencing
Partial sequence of the gene coding for G6PDH was obtained (Fig. 17). This sequence includedthe downstream primer and 1/3 of the gene sequence in the reverse orientation. Partial sequencewas also obtained of the gene coding for 6PGDH (Fig. 18). This sequence included the upstreamprimer and 1/3 of the gene sequence in the correct orientation.
Confirmatory restriction digest
To confirm the initial restriction digest and sequence data, both gene-containing vectors weredigested with EcoRI and HindIII to produce fragments of specific sizes (Table 5).
All the expected fragments were obtained on digestion, thus confirming the presence of the geneinserts.

GTGCTTCCATGTNNGNCGAATAAGGGCCCTCTANATGCATGCTCGAGCGGCCGCCAGTGTGATGGATATTTGCAGAATTCNGCTTGCTTTACATCCGAAGGTAAAGCTNTGCTGAANTAAAATANGGAGGTGACNCCGGTGAAATCTCATATTGGTCTCATCGGTCTTGCTGTGATGGGTCAGAATCTTGCNCTGAACATTGCGAGGAAAGGCTACAAAGTTTCGGTTTACAACAGAACAGCACATANAACGGAGGAATTTGTGAAAAATCGTGTAACTGAATGAAGAGATAGAACCTCATTNCCGATATCCNAANGCTTCNTGAAGTCTCTCGANAGACCAANAAAGATAATCTTAATGGTAAAGGCANGAAAACCCGTGGATGATNCNATTTCTCAGCTTCTTCCTCACCTCGAACCANGTGATTTGATAATAGACGGTGGTNATTCCCNTTACATGGATACCGANAGACGCTNCNAGGAACTCTCTTGANAAGGGAATACTTTTCCTCCGTATGGNNAGTAATTGGTGGTGNGTACNGGGCTCTTCACGGGCCTTCTNTCCTGCCTGGGGGANNTANNNACGCGTNTAACCTGGTTGNGGANANCCTTTTGGNAAATCCCAGCCNNACCCAGNATGNGNCCCTTCTGNCATACNTTTGGTNAACCGATCNNCTGNCCNCTTTTTNNCCATGGNTCACACCNGCATTNGAANCCNCTTTNTGNNNGCCCAAACCGGGAANTTATCCNCATCNNTNNNANGNTGTCCTGCGCCCATCNTNTGNAANAAAATTGTCCCNTNTCTTCTCAACCNGNGGGCNCTNNNNGAACAACTTTCNCTTAGCTCCCTTGGTGNGNGANCCCCCTNCCCACNATTTTGCGNACACCAGCTNNTNCACCCTCCGCTTNACCTGNTGGNNACTATGTGTNCNCNTCTTGGCANANNGTNTGGAAACACNNAGGGNGATCTCGGTAAACNTGCCACANTCNCNACNNTCGCTNCATNNTNNCATCCGTANANTCTTAAACCCTTTTCTGTAAANTNTCTNCNGCNTNGNCNATTNACAAGGGNGNCAACATGTCCNTTTTCTCANACACANNANNCAAAAACTCGGGNTNTTCTCCNCGCCCCTCTCNTCNANACGNANATACACNCTCCTCACTCTCGCGGTCNCNCGCNNTCANTCNCTCGCG
Fig. 17. Partial gene sequence of 6PGDH in vector pCR2.1. Sequenced using T7promoter primer. EcoRI site is underlined. Forward PCR primer (6PGDH-F) is inbold and gene start codon is underlined and in bold.
CNCACNNCACNTCTNNCCNGCTATNTNNNTTNNTAANNNANNNATNGNNCGGNNNCGACNTANNCTNNTNATACNCNNNCGTNCCNNNGCTTGCCTTNCTTAATNCACCCCNCTNNTCGTTNTCTACCCNTNTNNANANNNNCTNNNCACTNTCNCNNCCCCNCCNCCCCTGTGGTTTNCNTATTNGTACGGCGANNAGGGCCCNCTAGCANGCATGCTCGAGCGGNCNNCAGTGTGATGGATNTTTGCAGAATTCNGCTTGGCNGGTGACATTCATGATGTGCACNNTGGGATNGGAGAAANGTCCAGATGATACCNTCCGGTGTTATCCAAAGATCGNACNACCTTTCNGAATTGNGATCTTNNGCGCTTCNTGGTGACCTNACAAAAAGAAAGCTNATTCCCGCTTTTGAACAGGATGNTACGAGGCAGGANAAACAAGCCCGAACGCTTTANCNGNTCTCGGCGCGGCACNAACGAAAATGGACTNTNANAAATCTCANATGCCACATTNCANGCCAACCCTGNTTTTTTTGNAACATTGCAGTTACATACACCGNGGATCTATCNNGNTCCTGATAGCTTCNANCANACANAAAAACACTCNTCNANACNTCNCATAACAACGGATCTNANTCCNGCAATCGTGGTCTTTCATNTNAACNNTGNNACCNTCCCGGANTCNTNCCACNNCCCTCTTCTTNTGNAAAANCANCNNTNNANACTGNNNTTGGAACAAANNACCTGCTGNACTGNTNATNANNNCAANANCCCANNTNGGNAAAANAANCATNNAATTCTGCCAGANNTANCTGNCANCACACTCTTTCACNAAATANTTANTCCGGAAATGCATCCNCTCTCCNNGANNNTNCACCATTNCCNTTNGGCNAAGCAAACCNATCCGANNCATTACNTGGGTGNTTTTATGNNNNNCCCACCATCCGTTANCTCCCGGGNAANACCTGCGACCNCGCNNGTTCNTGTGGGATTNCTANACAAAANTNCACAACGGGNCGTNNNCNCTTTCNCGCCGNACCCCTGGNCGTGGNTNTTNCTAAAANCCNNTGCATCNCCNCAGGNGTNCCTTTCTACAANTACNNTNCTNNCTCNNTTTCTCCNNTNCNACANNTGANCCCATCNCTTANTTTCCTGTCAAAAANTANNCAAGCNGTNGNTNNNANTTTATAAANAACAGNNCGTTACNTGCNGCNNTATNTCANACTACANGTCNCNNGNCCCTNNGNNAGGGACATNACNNANNACANGTGCNCGCNCTNNATAAANACTANTNNGNNNNCCGTNCCCTGCANCTNTCATCGNACNTANATCNNTCNNCN
Fig. 18. Partial gene sequence of G6PDH in vector pCR2.1 in reverse orientation.Sequenced using M13 reverse primer. EcoRI site is underlined. Forward PCRprimer (6PGDH-F) is in bold and gene start codon is underlined and in bold.

Table 5. Restriction digestion of cloned PCR gene fragments to confirm theinclusion of the complete fragments.
Recombinant vector Expected fragment sizespCR2.1 + G-6-PDH 3.9, 824 and 683 bppCR2.1 + 6-PGDH 3.9, 1231, 184 bp
Growth of non-expression host
Cultures of E. coli strain TOP 10F� transformed with the recombinant vector pCR2.1 containingtheir respective PPP gene, were grown. The inclusion of ribosome binding sites upstream of thegene inserts would allow for expression to take place. 250 mL cultures were grown in Luriabroth media with 100µg/mL ampicillin at 37oC until they reached a cell density of OD600 = 0.5.0.4 mM of the inducing agent IPTG was then added and the cells were grown for a further 20hours. Cell breakage was carried out with detergent 0.1% Triton X-100, DNase and lysozymeand followed by a 25-min heat step at 80oC. The resulting cell extracts were then analysed forPPP enzyme activity (Table 6).
Table 6. PPP enzyme activities from non-expression transformed E. coli cultures.
Specific ActivitySample
Weightof cells
(g)
Volume(mL)
TotalActivity
(U)
TotalProtein
(mg)Per mg of
proteinPer g of
cellsG6PDH 0.9 12 2.4 48 0.05 2.66PGDH 0.7 12 4.8 72 0.067 6.86
As can be seen from the level of enzymic activity for G6PDH and 6PGDH, the expression levelsare very low and will require further cloning into an expression vector.
PCR to introduce restriction sites for cloning into an expression vector
Primers were designed to introduce suitable restriction sites on either side of the PPP genes tofacilitate their cloning in the correct orientation into the cloning vector pET-15b (Table 7). Thegenes were initially analyzed using a restriction enzyme analysis program,(http://darwin.bio.geneseo.edu/~yin/WebGene/RE.html) to determine all the restriction sites thatdo not cut within the gene sequence.
Restriction digestion of PPP genes and pET-15b.
Following PCR, the completed reactions were precipitated with ethanol in order to denature theDNA polymerase. The reactions were then resuspended in 100 µL of nanopure water. Restrictiondigestion of the PCR fragments and also the expression vector pET-15b were then carried outusing the respective restriction enzymes at 37oC for 4 � 16 h. All the digested fragments were

separated by agarose gel electrophoresis in order to prevent re-ligation in subsequent steps. Allthe restricted fragments were purified to remove the agarose.
Table 7. Primers including the site mutations used to incorporate the desiredrestrictions sites.
Restrictionsite
RestrictionSite
SequencePrimer sequence
G6PDHUpstream Nde I CATATG 5� GGC AGG TGA GCA TAT GAA GTG CAG TC 3�
G6PDHDownstream Bam H I GGATCC 5� CGA CTA CAA AAT CAA GGA TCC CAT C 3�
6PGDHUpstream Nco I CCATGG 5 � GGT GAC GCC CAT GGA ATC TC 3�
6PGDHDownstream Bam H I GGATCC 5� CTC ACG GGA TCC ACT TCG 3�
Ligation and transformation of PPP genes and pET-15b
The purified PCR and vector fragments were ligated together. The resulting recombinant vectorswere transformed into E.coli strain JM109. Colonies were selected by ampicillin resistance. Nocolonies were obtained for the 6PGDH gene insert indicating the failure of the ligation reaction.Plasmid mini preps were employed to extract the recombinant plasmid DNA from culturesgrown from single selected colonies. Restriction digests were then carried out to excise the 1.5Kb gene inserts using restriction enzymes indicated in Table 9. This would confirm the successof the cloning procedure. However, none of the plasmids from the selected colonies appear toposses the 1.5 Kb gene inserts.
Discussion
Characterization of the Mesophilic Oxidative Branch of the Pentose PhosphatePathway
Assay characterization
The rate of turnover of the final products, H2 and CO2, shows that 6PGDH is the rate-limitingstep in the pathway. In terms of the life-time of the mesophilic pathway, the first enzymeG6PDH is rate-limiting and posses a t50% of only 3 min at 60oC. However, the t50% possessed byboth of the mesophilic enzymes is far inferior to that of the hydrogenase from P. furiosus, whichhas a t50% of 21 h at 80oC (Bryant and Adams, 1989). The pH optima of the mesophilic pathwayenzymes are in agreement with that of the hydrogenase and the components of the H2 productionsystem.
In vitro hydrogen production studies
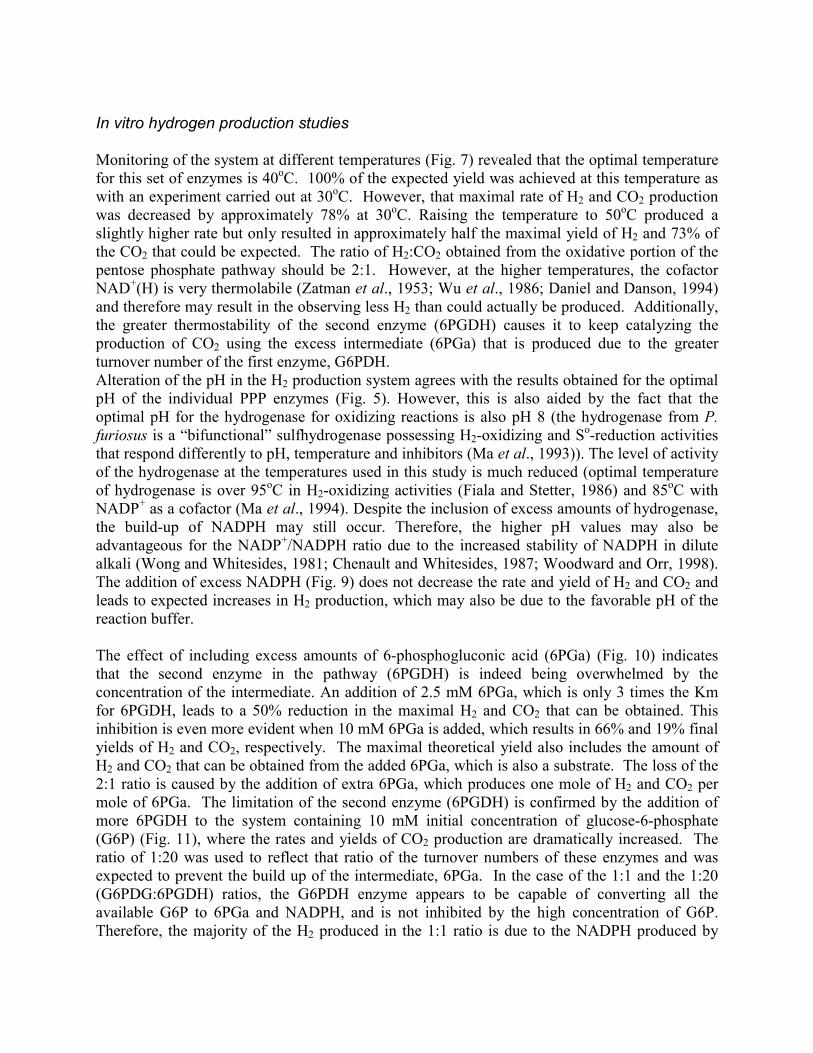
Monitoring of the system at different temperatures (Fig. 7) revealed that the optimal temperaturefor this set of enzymes is 40oC. 100% of the expected yield was achieved at this temperature aswith an experiment carried out at 30oC. However, that maximal rate of H2 and CO2 productionwas decreased by approximately 78% at 30oC. Raising the temperature to 50oC produced aslightly higher rate but only resulted in approximately half the maximal yield of H2 and 73% ofthe CO2 that could be expected. The ratio of H2:CO2 obtained from the oxidative portion of thepentose phosphate pathway should be 2:1. However, at the higher temperatures, the cofactorNAD+(H) is very thermolabile (Zatman et al., 1953; Wu et al., 1986; Daniel and Danson, 1994)and therefore may result in the observing less H2 than could actually be produced. Additionally,the greater thermostability of the second enzyme (6PGDH) causes it to keep catalyzing theproduction of CO2 using the excess intermediate (6PGa) that is produced due to the greaterturnover number of the first enzyme, G6PDH.Alteration of the pH in the H2 production system agrees with the results obtained for the optimalpH of the individual PPP enzymes (Fig. 5). However, this is also aided by the fact that theoptimal pH for the hydrogenase for oxidizing reactions is also pH 8 (the hydrogenase from P.furiosus is a �bifunctional� sulfhydrogenase possessing H2-oxidizing and So-reduction activitiesthat respond differently to pH, temperature and inhibitors (Ma et al., 1993)). The level of activityof the hydrogenase at the temperatures used in this study is much reduced (optimal temperatureof hydrogenase is over 95oC in H2-oxidizing activities (Fiala and Stetter, 1986) and 85oC withNADP+ as a cofactor (Ma et al., 1994). Despite the inclusion of excess amounts of hydrogenase,the build-up of NADPH may still occur. Therefore, the higher pH values may also beadvantageous for the NADP+/NADPH ratio due to the increased stability of NADPH in dilutealkali (Wong and Whitesides, 1981; Chenault and Whitesides, 1987; Woodward and Orr, 1998).The addition of excess NADPH (Fig. 9) does not decrease the rate and yield of H2 and CO2 andleads to expected increases in H2 production, which may also be due to the favorable pH of thereaction buffer.
The effect of including excess amounts of 6-phosphogluconic acid (6PGa) (Fig. 10) indicatesthat the second enzyme in the pathway (6PGDH) is indeed being overwhelmed by theconcentration of the intermediate. An addition of 2.5 mM 6PGa, which is only 3 times the Kmfor 6PGDH, leads to a 50% reduction in the maximal H2 and CO2 that can be obtained. Thisinhibition is even more evident when 10 mM 6PGa is added, which results in 66% and 19% finalyields of H2 and CO2, respectively. The maximal theoretical yield also includes the amount ofH2 and CO2 that can be obtained from the added 6PGa, which is also a substrate. The loss of the2:1 ratio is caused by the addition of extra 6PGa, which produces one mole of H2 and CO2 permole of 6PGa. The limitation of the second enzyme (6PGDH) is confirmed by the addition ofmore 6PGDH to the system containing 10 mM initial concentration of glucose-6-phosphate(G6P) (Fig. 11), where the rates and yields of CO2 production are dramatically increased. Theratio of 1:20 was used to reflect that ratio of the turnover numbers of these enzymes and wasexpected to prevent the build up of the intermediate, 6PGa. In the case of the 1:1 and the 1:20(G6PDG:6PGDH) ratios, the G6PDH enzyme appears to be capable of converting all theavailable G6P to 6PGa and NADPH, and is not inhibited by the high concentration of G6P.Therefore, the majority of the H2 produced in the 1:1 ratio is due to the NADPH produced by

G6PDH. Increasing the concentration of 6PGDH leads to a 10% increase in the yield of H2 thatcan be obtained from 10 mM G6P, but also causes a 25% increase in the theoretical yield of CO2.The rate of CO2 production is also increased by 80% on increasing the level of 6PGDH in thereaction system. Despite the observed improvement of H2 and CO2 yields, the ratio did not leadto the maximal yields of gases expected from the use of this ratio.
Isolation of a Thermophilic Oxidative Branch of the Pentose Phosphate Pathway
Approach with Sulfolobus solfataricus
The N-terminus MKIGLIGLGIMGYRIAANLAKANKLNLVYDRTQE was obtained for a 48kDa protein partially purified using affinity chromatography along with the enzyme glucosedehydrogenase (GDH) (41 kDa). Sequence comparison analysis revealed this protein N-terminus to match with a variety of 6-phosphogluconate dehydrogenases. Despite the reportedabsence of central metabolic pathways employing phosphoryated intermediates in this species(De Rosa et al., 1984), very low levels of activity for both the PPP enzymes could be detected incell cultures grown in enhanced media. The enhanced media contained higher concentrations ofcarbon sources and this may have influenced the expression of these enzymes. However, the fargreater specific activity obtained for the GDH suggests that this is the dominant pathway for thedegradation of glucose in S. solfataricus.
Despite originating from the same species, the sequences of the 6PGDHs from the two strains ofS. solfataricus P1 and P2, surprisingly only share 57% sequence identity and 72% sequencesimilarity. However, the assigning of a function for the P2 gene appears to be based purely onsequence identity and may, in fact, be incorrect. This has since been established by the assigningof a new function of a 3-hydroxybutyrate dehydrogenase.
Approach with Thermotoga maritima
Both genes coding for the enzymes of the oxidative branch of the pentose phosphate pathwayhave been successfully isolated and cloned from the species T. maritima into the cloning vectorpCR2.1. However, the failure to obtain fully transformed colonies of JM109 cells i.e. thosecontaining recombinant PPP genes, has required that several trouble-shooting procedures be putin place to determine the specific step that led to the failure of successful ligation. The restrictionenzymes are required to be tested to determine their efficiency for excising the DNA at thecorrect sites. Therefore, the colonies observed growing on ampicillin-containing plates couldcontain fully-functional non-recombinant pET-15b plasmids. Or it may be possible that theinitial restriction digest (and subsequent ligation) were successful and that the resulting plasmidsobtained from the E. coli strain JM109 colonies do contain the gene inserts, but that the secondrestriction digest to determine this has not been successful. This work is still in progress.

Conclusions
Characterization of the Mesophilic Oxidative Branch of the Pentose PhosphatePathway
The system has been optimized in terms of the reaction buffer, pH and temperature. The ratio ofG6PDH:6PGDH of 1:20, which reflects the respective turnover numbers of these enzymes, stilldoes not result in the complete conversion of 10 mM G6P to H2 and CO2.
Isolation of a Thermophilic Oxidative Branch of the Pentose Phosphate Pathway
Even with the less complex method of growing S. solfataricus, the N-terminus that gives 31 �58% matches with other 6PGDHs, and the observation of low level activity for the PPP enzymes,it appears that it may not be a suitable host for obtaining all the enzymes of the complete pentosephosphate pathway. Both genes coding for the enzymes of the oxidative branch of the pentosephosphate pathway have been successfully isolated and cloned from the species T. maritima andexpression work is still in progress.
Future Work
! Optimize the expression and purification of recombinant thermophilic oxidative PentosePhosphate enzymes.
! Purify and characterize the native wild-type enzymes from T. maritima.! Compare hydrogen production by mesophilic and thermophilic G6PDH and 6PGDH.! Establish that thermophilic enzymes will offer advantage over mesophilic enzymes for H2
production.
This work will result in new knowledge showing the advantage of using thermophilic enzymesfor the generation of molecular hydrogen from renewable energy.
Acknowledgements
I would like to thank Dr. Hugh O�Neill, Dr. Barbara Evans, Dr. Steve Blankinship and Dr. EliasGreenbaum from our group at ORNL for help and advice in carrying out the research. Dr. FrankLarimer and Mrs. Shen Lu at ORNL for carrying out the sequencing and also Prof. MichaelDanson and Dr. David Hough for providing the N-terminal sequence. I would also like to thankthe Hydrogen Program of the U.S. Department of Energy for funding this work. Oak RidgeNational Laboratory is managed by UT-Battelle, LLC for the U.S. Department of Energy undercontract DE-ACO5-00OR22725.

References
Aachenbach-Richter, L., Gupta, R., Stetter, K. O. and Woese, C. R. (1987) Syst. Appl. Microbiol.9, 34 � 39.
Ausubel, F. M. (1990) Current Protocols in Molecular Biology. Published by Greene Pub.Associates and Wiley-Interscience : J. Wiley, New York.
Brock, T.D., Brock, K.M., Belly, R.T., & Weiss, R.L. (1972) Arch. Microbiol. 84, 54 � 68.Sulfolobus � A New Genus of Sulfur-Oxidizing Bacteria Living at Low pH and HighTemperature.
Bryant, F. O. & Adams, M.W.W. (1989) J. Biol. Chem. 264, 9, 5070 - -5079. Characterization ofHydrogenase from the hyperthermophilic Archaebacterium, Pyrococcus furiosus.
Burdette, D.S., Vielle, C., & Zeikus, J.S. (1996) Biochem. J. 316, 115 - 122. Cloning andexpression of the gene encoding the Thermoanaerobacter ethanolicus 39E secondary-alcoholdehydrogenase and biochemical characterization of the enzyme.Chenault, H.K. & Whitesides, G.M. (1987) Appl. Biochem. Biotech. 14, 2, 147 � 197.Regeneration of nicotinamide cofactors for use in organic synthesis.
Daniel, R.M. & Danson, M.J. (1995) J. Mol. Evol. 40, 559 - 563. Did primitive micro-organismsuse nonhem iron proteins in place of NAD/P?
Deckert, G., Warren, P. V., Gaasterland, T., Young, W. G. Lenox, A. L. Graham, D. E.,Overbeek, R., Snead, M. A., Keller, M., Aujay, M., Hubert, R., Feldman, R. A., Short, J. A.,Olsen, G. J. and Swanson, R. V. (1998) Nature 222, 392 (6674) 353 � 358. The completegenome of the hyperthermophilic bacterium Aquifex aeolicus.
De Rosa, M., Gambacorta, A., Millonig, G., & Bu�Lock, J.D. (1974) Experientia 30, 866 - 868.Convergent characters of extremely thermophilic acidophilic bacteria.
De Rosa, M., Gambacorta, A., & Bu�Lock, J.D. (1975) J. Gen. Microbiol. 86, 156 � 164.Extremely Thermophilic Acidophilic Bacteria Convergent with Sulfolobus acidocaldarius.
De Rosa, M., Gambacorta, A., Nicolaus, B., Giardina, P., Poerio, E., & Buonocore, V. (1984)Biochem. J. 224, 407 � 414. Glucose metabolism in the extreme thermoacidophilicarchaebacterium Sulfolobus solfataricus.
Egerer, P., Günter, H., & Simon, H. (1982) Biochim. Biophys Acta 703, 149 - 157. On thehydrogen-deuterium exchange reaction catalyzed by the soluble hydrogenase from Alcaligeneseutrophus H16 in the free and immobilized state.
Entner, N.& Doudoroff, M. (1951) J. Biol. Chem. 196, 853 � 863. Glucose and gluconic acidoxidation of Pseudomonas saccharophila.

Fiala, G. & Stetter, K.O. (1986) Arch. Microbiol. 145, 56 - 61. Pyrococcus furiosus sp. nov.represents a novel genus of marine heterotrophic archaebacteria growing optimally at 100°C.
Fujinaga, M., Berthet-Colominas, C., Yaremchuk, A.D., Tukalo, M.A., & Cusack, S. (1993) J.Mol. Biol. 234, 222 - 233. Refined crystal structure of the seryl-tRNA synthetase from Thermusthermophilus at 2.5 Å resolution.
Greenbaum, E. (1984) Photobiochem. Photophys. 8, 323 - 332. Biophotolysis of water: the lightsaturation curves.
Huber, R., Langworthy, T. A., König, H., Thomm, M., Woese, C. R., Sleytyr, U. B. and Stetter,K. O. (1986) Arch. Microbiol. 144, 324 � 333. Thermotoga maritima sp. nov. represents a newgenus of unique extremely thermophilic eubacteria growing up to 90oC.
Huber, R., and Stetter, K. O. (1992) in The Prokaryotes (eds Balows, A., et al.) 3809 � 3815.Springer, Berlin, Heidelberg, New York.Inoue, T., Kumar, S.N., Kamachi, T., & Okura, I. (1999) Chem. Lett. 2, 147 - 148. Hydrogenevolution from glucose with the combination of Glucose dehydrogenase and Hydrogenase fromA. eutrophus H16.
Lebbink, J.H.G., Eggen, R.I.L., Geerling, A.C.M., Consalvi, V., Chiaraluce, R., Scandurra, R., &DeVos, W.M. (1995) Prot. Eng. 8, 1287 - 1994. Exchange of domains of glutamatedehydrogenase from the hyperthermophilic archaeon Pyrococcus furiosus and the mesophilicbacterium Clostridium difficile : effects on catalysis, thermoactivity and stability.
Leslie, J. (1997) Wired Oct., 1 -2. Dawn of the hydrogen age. (see appendices)
Ma, K., Schicho, R.N., Kelley, R.M. & Adams, M.W.W. (1993) Proc. Natl. Acad. Sci. USA 90,5341 - 5344. Hydrogenase of the hyperthermophile Pyrococcus furiosus is an elemental sulfurreductase or sulfhydrogenase: Evidence for a sulfur-reducing hydrogenase ancestor.
Ma, K., Zhou, Z. H., & Adams, M.W.W. (1994) FEMS Microbiol. Lett. 122, 245 - 250.Hydrogen production from pyruvate by enzymes purified from the hyperthermophilic archaeon,Pyrococcus furiosus: A key role for NADPH.
Nelson, K. E., Clayton, R. A., Gill, S. R., Gwinn, M. L., Dodson, R. J., Haft, D. H., Hickey, E.K., Peterson, J. D., Nelson, W. C., Ketchum, K. A., McDonald, L., Utterback, T. R., Malek, J.A., Linher, K. D., Garrett, M. M., Stewart, A. M., Cotton, M. D., Pratt, M. S., Phillips, C. A.,Richardson, D., Heidelberg, J., Sutton, G. G., Fleischman, R. D., Eisen, J. A., White, O.,Salzberg, S. L., Smith, H. O., Venter, C. J. and Fraser, C. M. (1999) Nature 399, 323 � 329.Evidence for lateral gene transfer between Archaea and Bacteria from genome sequence ofThermotoga maritima.
Pearson, W.R. & Lipman, D.J. (1988) Proc. Natl. Acad. Sci. USA 85, 2444 - 2448. Improvedtools for biological sequence comparison.

Russel, R.J.M., Ferguson, J. M.C., Hough, D.W., Danson, M.J., & Taylor, G.L. (1997)Biochemistry 36, 9983 � 9994. The Crystal Structure of Citrate Synthase from theHyperthermophilic Archaeon Pyrococcus furiosus at 1.9 Å Resolution.
Segerer, A.H. & Stetter, K.O. (1991) The Prokaryotes, 1, 2nd. edn., Springer Verlag, Ed.Belows, A. The Order Sulfolobales.
Selig, M., Xavier, K.B., Santos, H., & Schönheit, P. (1997) Arch. Microbiol. 167, 217 � 232.Comparative analysis of Embden-Meyerhof and Entner-Doudoroff glycolytic pathways inhyperthermophilic archaea and the bacterium Thermotoga.
Shine, J. & Delgarno, L. (1974) Proc. Natl. Acad. Sci. USA 71, 4, 1342 - 1346. The 3�-TerminalSequence of Escherichia coli 16S Ribosomal RNA: Complementarity to Nonsense Triplets andRibosome Binding Sites.
Shine, J. & Delgarno, L. (1975) Nature 254, 34 - 37. Determinant of cistron specificity inbacterial ribosomes.
Stetter, K.O., Segerer, A., Zillig, W., Huber, G., Fiala, G., Huber, R., & König, H. (1986)System. Appl. Microbiol. 7, 393 - 397. Extremely thermophilic sulfur-metabolizingArchaebacteria.
Vielle, C., Hess, J.M., Kelly, R.M., & Zeikus, J.G. (1995) Appl. Environ. Microbiol. 61, 1867 -1875. xylA cloning and sequencing and biochemical characterization of xylose isomerase fromThermotoga neapolitana.
Wilson, J.G. & Newall, A.B. (1970) General and inorganic chemistry, second ed., Cambridge-Uni. Press, Cambridge.
Woodward, J., Mattingly, S.M., Danson, M., Hough, D., Ward, N., & Adams, M. (1996) NatureBiotech. 14, 872 � 874. In vitro hydrogen production by glucose dehydrogenase andhydrogenase.
Woodward, J. & Orr, M. (1998) Biotechnol. Prog. 14, 897 � 902. Enzymatic Conversion ofSucrose to Hydrogen.
Woodward, J., Orr, M., Cordray, K. and Greenbaum, E. (2000) Nature 405, 1014 � 1015.Enzymatic production of biohydrogen.
Wong, C-H. & Whitesides, G.M. (1981) J. Amer. Chem.Soc. 103, 4890 - 4899. Enzyme-catalyzed organic-synthesis - NAD(P)H cofactor regeneration by using glucose-6-phosphate andthe glucose-6-phosphate dehydrogenase from Leuconostoc mesenteroides.
Woese, C.R & Fox, G.E. (1977) Proc. Natl. Acad. Sci. USA 74, 11, 5088 - 5090. Phylogeneticstructure of the prokaryotic domain: the primary kingdoms.

Woese, C.R., Pace, N.P., & Olsen, G.J. (1986) Nature 320, 401 - 402. Are arguments againstarchaebacteria valid?
Woese, C.R., Kandler, O., & Wheelis, M.L. (1990) Proc. Natl. Acad. Sci. USA 87, 4576 - 4579.Towards a natural system of organisms: Proposal for the domains Archaea, Bacteria, andEukarya
Wu, J.T., Wu, L.H., & Knight, J.A. (1986) Clin. Chem. 32, 2, 314 - 319. Stability of NADPH:effect of various factors on the kinetics of degradation.
Zatman, L.J., Kaplan, N.O., & Colowick, S.P. (1953) J. Biol. Chem. 200, 127 - 212. Inhibition ofspleen Diphosphopyridine nucleotidase by Nicotinamide, an exchange reaction.
Zillig, W., Stetter, K.O., Wunderl, S., Schulz, W., Prier, H. and Scholz, I. (1980) Arch.Microbiol. 125, 259 �269 .Zillig, W., Kletzin, A., Schleper, C., Holz, I., Janekovic, D., Hain, J., Lanzendörfer, M., &Kristjansson, J.B. (1994) System. Appl. Microbiol. 16, 609 - 628. Screening for Sulfolobales,their plasmids and their viruses in Icelandic Solfataras.