Embed Size (px)
Citation preview
EFI Index
A New Quantitative Parameter in Planning of Sustainable
Land Management in High Risk Erosion Areas
Chief Emmanuel O. Efiong-Fuller
Senior Lecturer, Department of Geography andRegional Planning,University of Calabar, Calabar, Nigeria.
1. Abstract
For many years erosion and land degradation have posed a serious threat to lives and propertyin South Eastern Nigeria; and indeed in some areas have reached alarming proportions.Recognizing the severity and magnitude of this problem, the Federal Government of Nigeria, forand on behalf of the states affected, requested assistance from the United NationsDevelopment Program (UNDP) under its 4th Country Program for Environment and NaturalResources Management. Against this background, the UNDP in May, 1995 commissioned fiveConsultants (including the author) to carry out baseline studies and design a program to combaterosion, landslide, and other forms of land degradation in four of the affected States, namely:Abia, Akwa Ibom, Cross River, and Imo. EFI-Index was developed by the present author, andused for the first time in that baseline study.
The EFI-Index is a numerical parameter to characterize the intensity of erosion and thetopographic texture in a given area. The formula for computing the EFI-Index is derived from thebasic properties and elements of erosional features, such as length, depth, and width, bycombining the methods of Mekel (1977) and Faniran (1969). The EFI-Index gives the “erosionfrequency and intensity” within a specific area in numerical terms; however the numerical valuescan be classed into intervals, and characterized in descriptive terms. Thus an EFI Index of lessthan five (5) indicates slight erosion intensity; 5-10 moderate, 10-15 high, and above fifteen (15)severe erosion intensity.
The EFI-Index provides a more comprehensive quantitative or semi-quantitativecharacterization of erosion within a given area than has hitherto been developed. The EFI-Indexcan be applied to administrative areas (political units) as well as hydrophysical areas on theterrain. Furthermore the EFI-Index is proportional to the total quantity of material removed fromthe area by erosion. It is therefore very useful for obtaining earthwork volumes in planningrehabilitation or reclamation work particularly in high-risk erosion areas. Finally EFI-Index canbe used to obtain quantitative estimates in environmental impact assessment, as regardserosion and land degradation.
2. Introduction
For many years, accelerated erosion, landslide and general land degradation have ravagedmany parts of South Eastern Nigeria. Lives and property have been lost; people have beenforced to desert their ancestral homes. Schools and colleges have been devastated, and evenUniversity campuses are not spared the menace of these hazards. Beautiful landscapes and
fertile agricultural lands have been completely lost; such loss of fertile agricultural land hasinevitably led to lower food production.
The Governments of the states most affected (namely: Abia, Akwa Ibom, Cross River, and Imo)recognizing the serious threat erosion posed to human existence in the area sent proposals tothe United Nations Development Program (UNDP) for assistance in this area. This requestcame under the 4th Country Program for Environment and Natural Resources Management,which the Federal Government of Nigeria had requested the UNDP to support activity in thesestates.
Against this background the UNDP in May 1995 commissioned five consultants (including theauthor) to carry out baseline studies and design a program to combat erosion, landslide andother forms of land degradation in the affected states. The EFI - Index was developed by thepresent author and used for the first time in that baseline study. The development andformulation of the EFI-index arose out of the necessity to uniquely characterize the severity oferosion within the different terrain mapping units (in this case the Local Government Areas), soas to enable comprehensive evaluation and design of combat measures.
3. The Study Area
3.1 Location and Extent
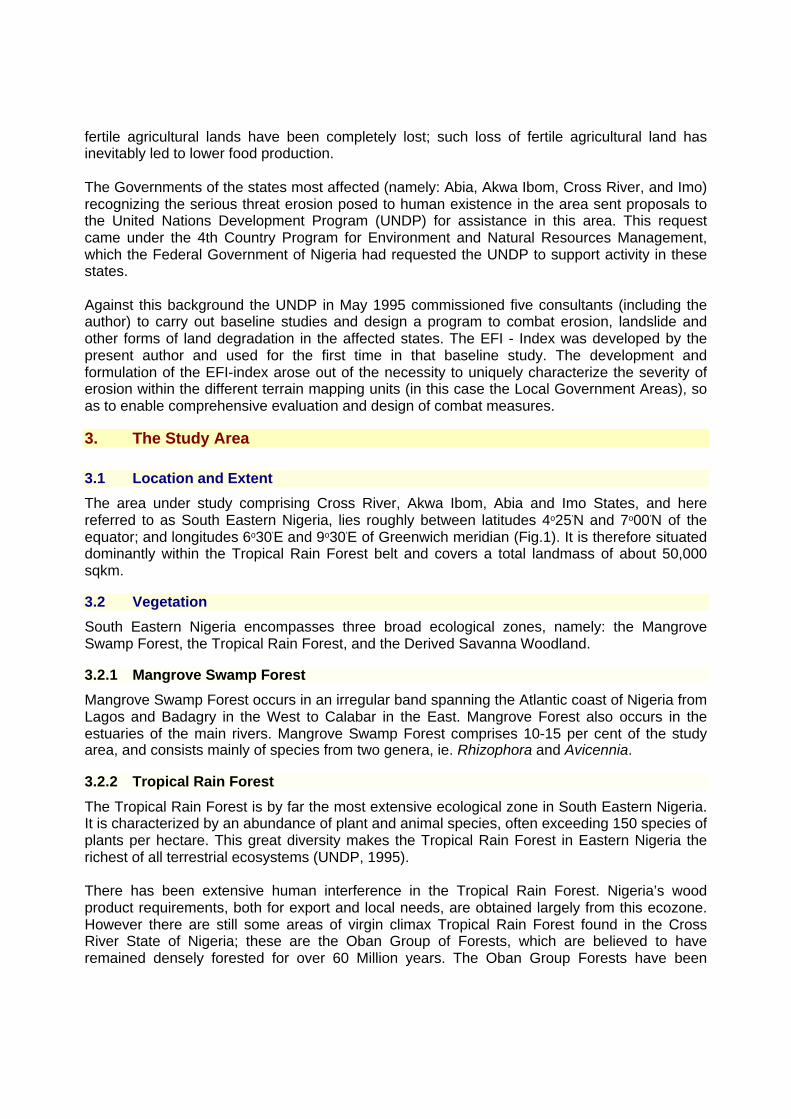
The area under study comprising Cross River, Akwa Ibom, Abia and Imo States, and herereferred to as South Eastern Nigeria, lies roughly between latitudes 4o25'N and 7o00'N of theequator; and longitudes 6o30'E and 9o30'E of Greenwich meridian (Fig.1). It is therefore situateddominantly within the Tropical Rain Forest belt and covers a total landmass of about 50,000sqkm.
3.2 Vegetation
South Eastern Nigeria encompasses three broad ecological zones, namely: the MangroveSwamp Forest, the Tropical Rain Forest, and the Derived Savanna Woodland.
3.2.1 Mangrove Swamp Forest
Mangrove Swamp Forest occurs in an irregular band spanning the Atlantic coast of Nigeria fromLagos and Badagry in the West to Calabar in the East. Mangrove Forest also occurs in theestuaries of the main rivers. Mangrove Swamp Forest comprises 10-15 per cent of the studyarea, and consists mainly of species from two genera, ie. Rhizophora and Avicennia.
3.2.2 Tropical Rain Forest
The Tropical Rain Forest is by far the most extensive ecological zone in South Eastern Nigeria.It is characterized by an abundance of plant and animal species, often exceeding 150 species ofplants per hectare. This great diversity makes the Tropical Rain Forest in Eastern Nigeria therichest of all terrestrial ecosystems (UNDP, 1995).
There has been extensive human interference in the Tropical Rain Forest. Nigeria’s woodproduct requirements, both for export and local needs, are obtained largely from this ecozone.However there are still some areas of virgin climax Tropical Rain Forest found in the CrossRiver State of Nigeria; these are the Oban Group of Forests, which are believed to haveremained densely forested for over 60 Million years. The Oban Group Forests have been
declared a National Park and protected through the joint efforts of the Cross River StateGovernment, the Federal Government, and the World Wide Fund for Nature (WWF).
Figure1. Location of South East Nigeria.
3.2.3 Derived Savanna Woodland
Due to persistent human interference, by way of cultivation and grazing, several parts of thestudy area have been transformed into what is generally termed “Derived Savanna Woodland”.The Derived Savanna Woodland is characterized by the presence of tropical rainforest treespecies in association with grassland species typical of the Savanna of Northern Nigeria. Insome places up to 60% of the vegetation cover is grass. On the Obudu Plateau in Cross RiverState is a type of semi-tropical grassland caused by the moderating effect of the height of theland.
3.3 Geology
South Eastern Nigeria presents an interesting geology dating from the Precambrian period. Oneof the most spectacular events in geologic history started in the Middle Jurassic (about 160million years ago) and by early Cretaceous times culminated in the break-up of the super-continent of Gondwanaland; this is the Continental Drift. Due to continental drift the SouthAmerican Plate separated from the African Plate resulting in the opening of the South Atlantic
Ocean. The opening of the South Atlantic Ocean initiated tectonism in the region of SouthernNigeria and led to the development of the Benue Trough (Wright, 1966; Nyong, 1995,14). Thedevelopment of the Benue Trough provided the main structural control and framework forsubsequent geologic evolution of South Eastern Nigeria.
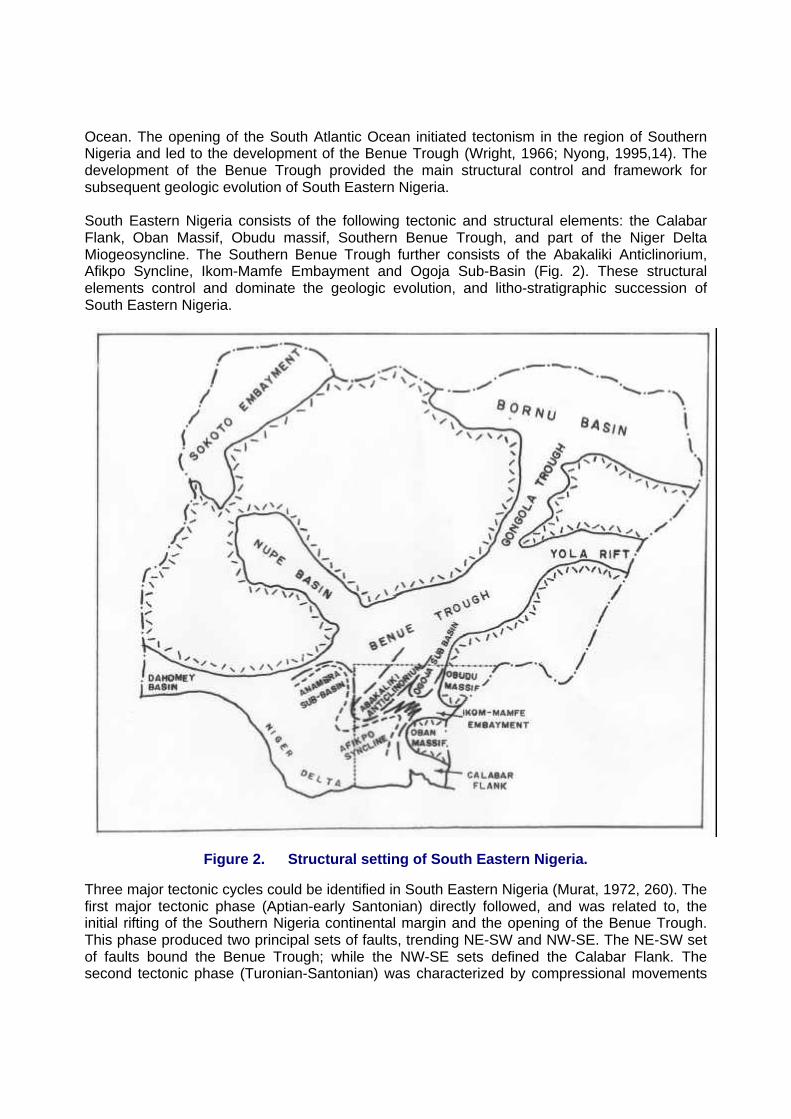
South Eastern Nigeria consists of the following tectonic and structural elements: the CalabarFlank, Oban Massif, Obudu massif, Southern Benue Trough, and part of the Niger DeltaMiogeosyncline. The Southern Benue Trough further consists of the Abakaliki Anticlinorium,Afikpo Syncline, Ikom-Mamfe Embayment and Ogoja Sub-Basin (Fig. 2). These structuralelements control and dominate the geologic evolution, and litho-stratigraphic succession ofSouth Eastern Nigeria.
Figure 2. Structural setting of South Eastern Nigeria.
Three major tectonic cycles could be identified in South Eastern Nigeria (Murat, 1972, 260). Thefirst major tectonic phase (Aptian-early Santonian) directly followed, and was related to, theinitial rifting of the Southern Nigeria continental margin and the opening of the Benue Trough.This phase produced two principal sets of faults, trending NE-SW and NW-SE. The NE-SW setof faults bound the Benue Trough; while the NW-SE sets defined the Calabar Flank. Thesecond tectonic phase (Turonian-Santonian) was characterized by compressional movements
resulting in the folding of the Abakaliki Anticlinorium and the complementary Afikpo Syncline.The third phase (Late Campanian - Middle Eocene) involved rapid subsidence and uplift inalternation, with subsequent progradation of a delta.
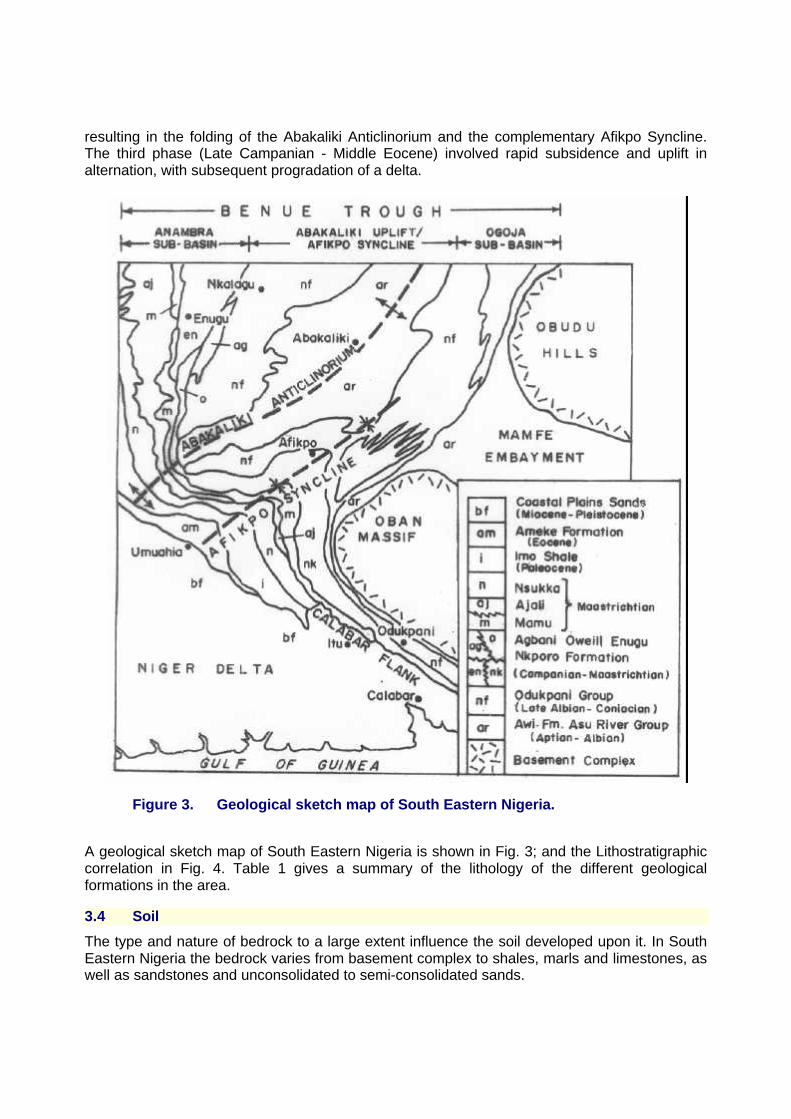
Figure 3. Geological sketch map of South Eastern Nigeria.
A geological sketch map of South Eastern Nigeria is shown in Fig. 3; and the Lithostratigraphiccorrelation in Fig. 4. Table 1 gives a summary of the lithology of the different geologicalformations in the area.
3.4 Soil
The type and nature of bedrock to a large extent influence the soil developed upon it. In SouthEastern Nigeria the bedrock varies from basement complex to shales, marls and limestones, aswell as sandstones and unconsolidated to semi-consolidated sands.
The soils formed on Coastal Plains Sands range from Dystric Nitosol and Dystric Cambisol, toDystric Acrisol. Texturally these include sands, loamy sands and sandy loam topsoils with sandyclay loam to sandy clay subsoils. The soils are generally very deep and well drained.
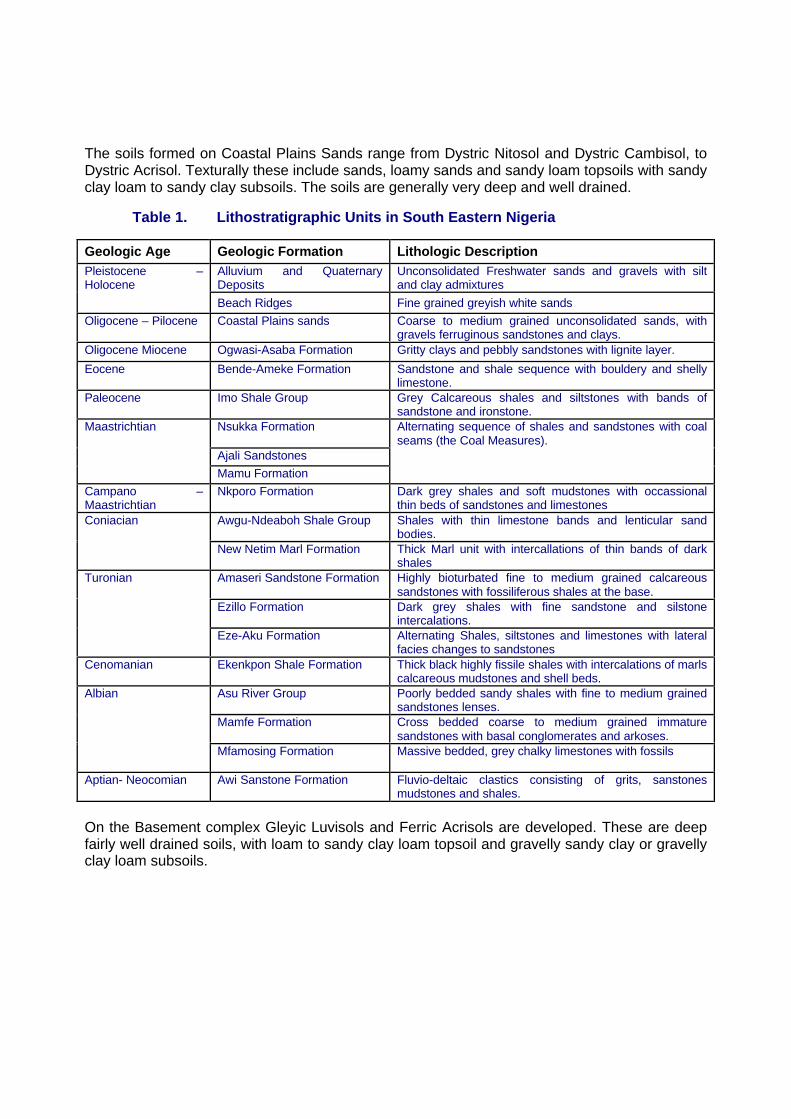
Table 1. Lithostratigraphic Units in South Eastern Nigeria
Geologic Age Geologic Formation Lithologic DescriptionAlluvium and QuaternaryDeposits
Unconsolidated Freshwater sands and gravels with siltand clay admixtures
Pleistocene –Holocene
Beach Ridges Fine grained greyish white sands
Oligocene – Pilocene Coastal Plains sands Coarse to medium grained unconsolidated sands, withgravels ferruginous sandstones and clays.
Oligocene Miocene Ogwasi-Asaba Formation Gritty clays and pebbly sandstones with lignite layer.
Eocene Bende-Ameke Formation Sandstone and shale sequence with bouldery and shellylimestone.
Paleocene Imo Shale Group Grey Calcareous shales and siltstones with bands ofsandstone and ironstone.
Nsukka Formation
Ajali Sandstones
Maastrichtian
Mamu Formation
Alternating sequence of shales and sandstones with coalseams (the Coal Measures).
Campano –Maastrichtian
Nkporo Formation Dark grey shales and soft mudstones with occassionalthin beds of sandstones and limestones
Awgu-Ndeaboh Shale Group Shales with thin limestone bands and lenticular sandbodies.
Coniacian
New Netim Marl Formation Thick Marl unit with intercallations of thin bands of darkshales
Amaseri Sandstone Formation Highly bioturbated fine to medium grained calcareoussandstones with fossiliferous shales at the base.
Ezillo Formation Dark grey shales with fine sandstone and silstoneintercalations.
Turonian
Eze-Aku Formation Alternating Shales, siltstones and limestones with lateralfacies changes to sandstones
Cenomanian Ekenkpon Shale Formation Thick black highly fissile shales with intercalations of marlscalcareous mudstones and shell beds.
Asu River Group Poorly bedded sandy shales with fine to medium grainedsandstones lenses.
Mamfe Formation Cross bedded coarse to medium grained immaturesandstones with basal conglomerates and arkoses.
Albian
Mfamosing Formation Massive bedded, grey chalky limestones with fossils
Aptian- Neocomian Awi Sanstone Formation Fluvio-deltaic clastics consisting of grits, sanstonesmudstones and shales.
On the Basement complex Gleyic Luvisols and Ferric Acrisols are developed. These are deepfairly well drained soils, with loam to sandy clay loam topsoil and gravelly sandy clay or gravellyclay loam subsoils.
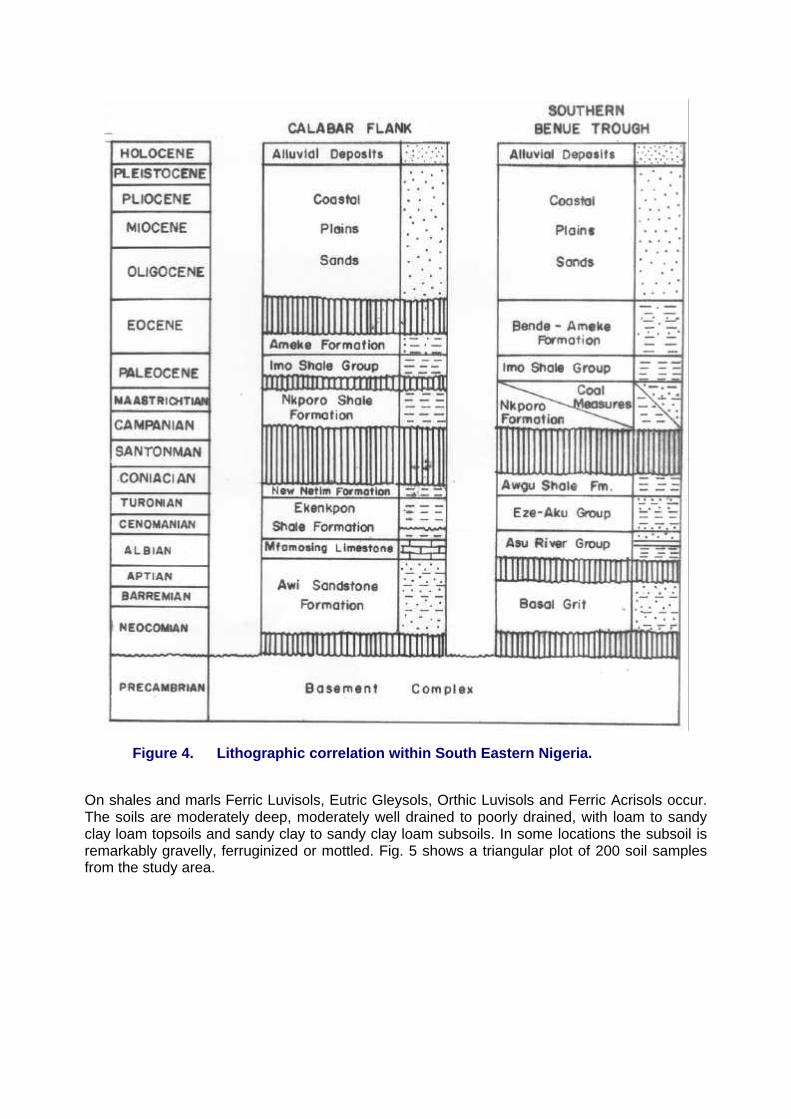
Figure 4. Lithographic correlation within South Eastern Nigeria.
On shales and marls Ferric Luvisols, Eutric Gleysols, Orthic Luvisols and Ferric Acrisols occur.The soils are moderately deep, moderately well drained to poorly drained, with loam to sandyclay loam topsoils and sandy clay to sandy clay loam subsoils. In some locations the subsoil isremarkably gravelly, ferruginized or mottled. Fig. 5 shows a triangular plot of 200 soil samplesfrom the study area.
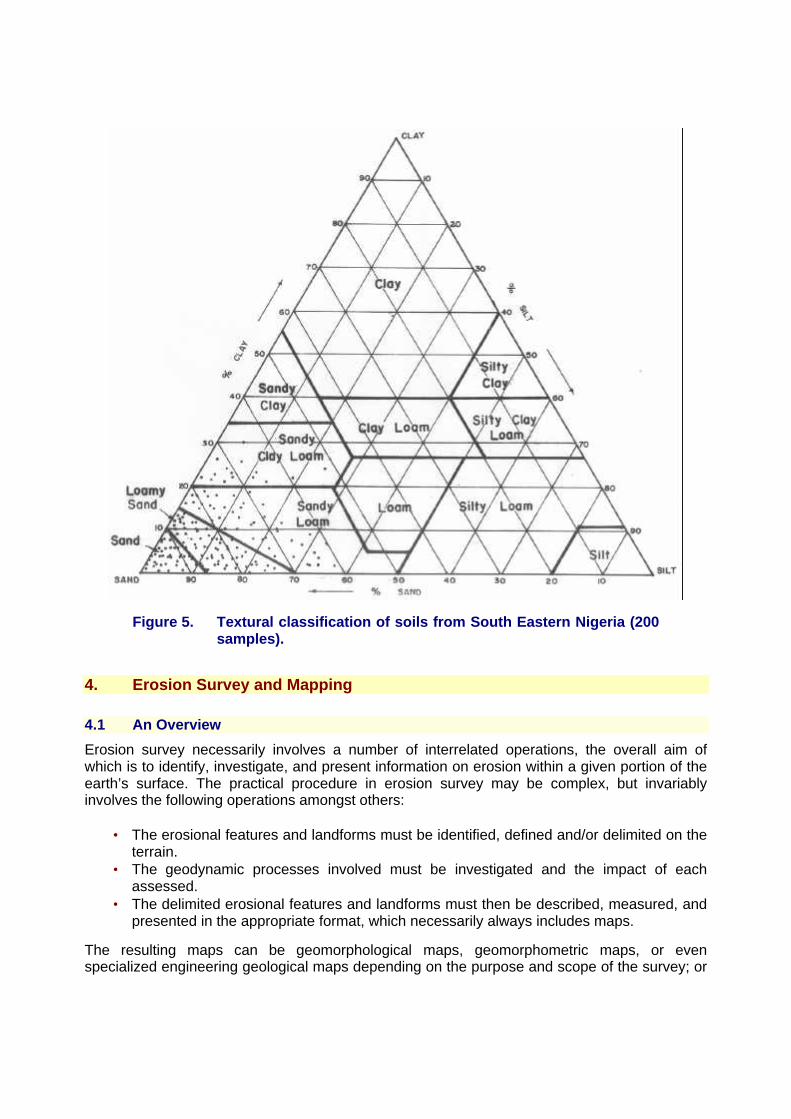
Figure 5. Textural classification of soils from South Eastern Nigeria (200samples).
4. Erosion Survey and Mapping
4.1 An Overview
Erosion survey necessarily involves a number of interrelated operations, the overall aim ofwhich is to identify, investigate, and present information on erosion within a given portion of theearth’s surface. The practical procedure in erosion survey may be complex, but invariablyinvolves the following operations amongst others:
• The erosional features and landforms must be identified, defined and/or delimited on theterrain.
• The geodynamic processes involved must be investigated and the impact of eachassessed.
• The delimited erosional features and landforms must then be described, measured, andpresented in the appropriate format, which necessarily always includes maps.
The resulting maps can be geomorphological maps, geomorphometric maps, or evenspecialized engineering geological maps depending on the purpose and scope of the survey; or
they may simply be called “Erosion Maps”. An important problem in erosion survey is how tocharacterize the severity or intensity of erosion in various parts of the mapped area. From suchcharacterization it would be possible to assess the impact on the landscape and hence the totalenvironment. This forms the thrust of the present paper.
4.2 Characterizing Erosion
Erosion (Latin, erred, to gnaw away) is a comprehensive term applied to the wearing away andremoval of the earth’s surface material by geomorphic agents. A geomorphic agent is anynatural medium capable of securing and transporting earth material; thus running water,including both unconcentrated and concentrated runoff, is a geomorphic agent.Both geological erosion and accelerated erosion could be distinguished. Geological erosioninvolves the gradual removal of the surface soil and rock material; and constitutes the normalgeologic process of landmass denudation. Accelerated erosion or induced erosion is the typethat has been speeded up by man’s activities or rare natural factors, so that the soil material isremoved much faster than it can be formed. Accelerated erosion has been responsible for thegapping erosion gullies, otherwise known as ravines, in the landscape of South Eastern Nigeria.The ravines deviate sharply from the general landscape of the area and pose immenseenvironmental problems.
Erosion can be divided into as potential erosion and actual erosion. Potential erosion gives anindication of the likelihood and possible intensity of erosion that could occur under givenphysical and climatic conditions in an area. It also expresses the susceptibility of an area toerosion. Potential erosion could therefore be regarded as “that which is likely to be”. Actualerosion gives the existing forms and intensity of erosion in an area under the prevailing physicalfactors and climatic conditions. Actual erosion therefore is “that which is in existence”.
The most fundamental way of characterizing erosion is in terms of the basic properties andelements of the erosional features, such as length, depth, width, side slopes etc; these could bedetermined by precise survey measurements. Erosion can also be characterized by the rates ofthe erosional processes, and the various factors influencing them in time and space. This leadsto the concepts of erodibility and erosivity. A new method of characterizing erosion by the EFIindex is proposed in this paper.
4.2.1 Erodibility
Erodibility of the soil or rock material is a measure of its susceptibility to erosion; it is therefore aproperty or characteristic of the material being eroded. Knowledge of erodibility is important inthe preparation of erodibility maps, soil loss predictions in erosion control, and in planning landconservation practices. Erodibility may be determined by direct measurements in the field, orcalculated using the erodibility equation, which is also referred to as the “nomograph method”.Direct measurement of erodibility is very costly and time consuming, and has been feasible onlyin a few locations in Nigeria (Usoro et al, 1989, 333); in fact there is no such location within thestudy area. Nevertheless it should be noted that erodibility represents the combined effects ofall properties of the soil or rock that significantly influence the ease with which it can be erodedby rain drops and runoff if not protected.
4.2.2 Erosivity
Erosivity is the potential ability of rainwater or rainstorm to cause erosion. Erosivity is a functionof the storm type, raindrop size distribution, terminal velocity of raindrops, and rainfall intensity;it is therefore a property or characteristic of the agent causing erosion. Many indices have been
developed for the determination of rainfall erosivity, but the EI30 developed by Wischmeier andSmith (1978) is the most commonly used (Usoro et al., 1989, 333). By definition the value of EI30
for a given storm equals the product of the total storm energy (E) and the maximum 30 minuteintensity (I30). Technically EI30 indicates how particle detachment is combined with the transportcapacity of runoff to cause soil erosion. Computation of erosivity values requires painstakingprocessing of long-term records of rainfall from individual synoptic stations.
EI30 erosivity values have been computed for 16 locations in Akwa Ibom State (within the studyarea) by Usoro et al (1989, 342) who remarked as follows:“The general trend is such that erosivity values decreased with decrease in rainfall from theSouth to the North. But in contrast the extent and severity of erosion decreased from the Northto the South. This might be interpreted to mean that areas of lower erosivity are more vulnerableto soil erosion than those with higher erosivity. This contradiction is related to the topography,pressure on the land, and unwise land use”.
From the foregoing it is clear that while erosivity values might provide adequate characterizationof potential erosion in an area, the actual erosion can seriously be misrepresented.
4.3 The EFI Index
The EFI Index provides a more comprehensive quantitative or semi-quantitative characterizationof erosion within a given area than has hitherto been developed and is based on thecharacteristic parameters of the erosional features. The EFI Index therefore relates to the actualerosion as exists on the ground.
4.3.1 Theoretical Considerations
From the hydrological perspective, it is known that a considerable proportion of all waterreaching the land part of the earth’s surface as rain is returned to the seas and oceans througha multitude of surface channels, which include rivers, streams and gullies. This network ofsurface channels constitutes the drainage of an area. Rainwater first prevails on the groundsurface moving bodily in a form of “sheet flow”, thereby causing sheet wash or sheet erosion.Due to irregularities on the ground surface sheetflow cannot occur over a long distance, and thewater thus becomes concentrated in tiny preferred channels called “rills”, thereby resulting in rillerosion. The rills integrate to form larger channels called gullies, in which the bulk of erosiveactivity is concentrated; this is gully erosion.
Field evidence has shown that erosion gullies are intricately related to stream channels; andthat gullies are in fact located at valley heads or stream source points (Usoro et al, 1989, 310).Besides, the mechanisms involved in gully erosion are similar to those in stream channels; thehydrodynamics in both cases can be analyzed in terms of the theory of “flow in erodible openchannels” (Dake, 1983, 213). In fact streams can be regarded as large “gullies” that perenniallycontain water, whereas gullies contain water only during and immediately after rains. Gulliescan therefore be analyzed using the same mathematical laws as for stream channels.
Furthermore, there is a mathematical relationship between cumulative channel length and thedrainage basin area. The ground area necessary on the average to maintain a unit length ofdrainage channel is called the “constant of channel maintenance” (Haggett and Chorley; 1969,76). For any erosion gully therefore a definite ground area is necessary for its maintenance; andthis invariably encompasses the zones of sheet wash and rill erosion. Thus the erosional activity
in an area can be comprehensively analyzed and quantified by considering only the gullies. TheEFI Index has been derived by analyzing only the gullies accordingly.
4.3.2 Derivation and Formulation of The EFI Index
The characteristic parameters of erosional gullies include length, width, depth, and side-slope;the total ground area affected is also useful. These parameters influence the topographictexture of the landscape. One of the earliest definitions of topographic texture is by Johnson(Johnson, 1933; Ajaegbu and Faniran, 1973, 24). Horton (1945) expressed it by the streamfrequency and drainage density. Strahler (1952) modified Horton’s original system butmaintained the same basic concept; however Faniran (1969) combined the stream frequencyand drainage density to obtain the index of drainage intensity (Ajaegbu and Faniran, 1973, 24).Mekel (1977) obtained a dimensionless “ruggedness number” as the product of the drainagedensity and relief (Rengers, 1981, 65). The ruggedness number is a convenient way to expressthe overall terrain configuration in a semi-quantitative manner. By combining the methods ofMekel (1977) and Faniran (1969) the present author has formulated the “EFI-Index” tocharacterize the topographic texture and intensity of erosion in a given area. The EFI Index iscomputed from the following formula consisting of three terms, namely: Erosion Frequency,Erosion Channel Density, and Average Depth.
EFI Index = N . ΣL . DA A
Erosion Channel Frequency (F)The first term in the formula is the Erosion Channel Frequency, which is a measure of thenumber of erosion channels per unit ground area. The erosion channel frequency is analogousto the stream frequency as used by Horton (1945) and Faniran (1969). It is expressed asnumber per sqkm, and has the dimension L-2
F = NA
Where N = Total number of erosion channelsA = Total ground area (L2)
Erosion Channel Density (Cd)
The second term in the formula is the Erosion Channel Density. This is defined as the averagelength of erosion channel per unit ground area. It is an analogous term with the drainage densityas used by Horton (1945), Faniram (1969), and Mekel (1977). Erosion channel density could beexpressed in km per sq.km or meters per square meter or even meters per sq.km;dimensionally it is L-1.
Cd = ΣL A
Where ΣL = Total (cumulative) length of all erosion channelsA = Total ground area (L2)
Average Depth (D)The third term in the formula is the average depth of erosion in the area. It is obtained bydividing the cumulative of all erosion channels depth by the total number of erosion channels
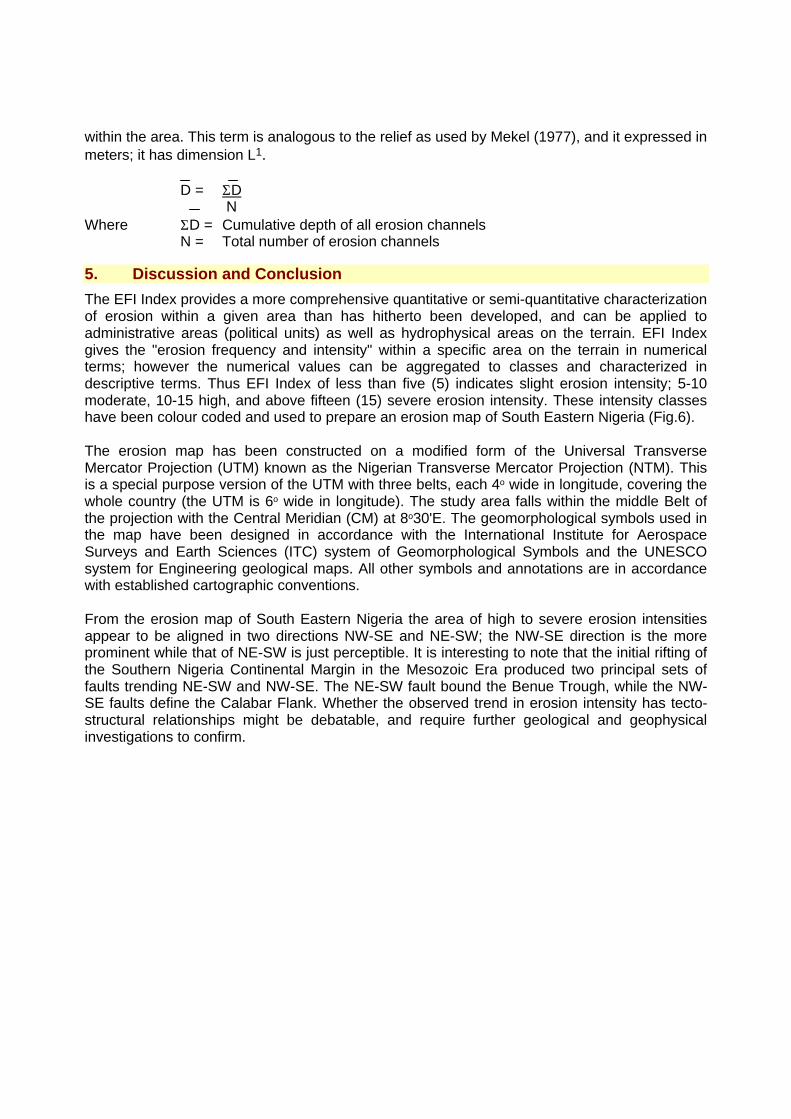
within the area. This term is analogous to the relief as used by Mekel (1977), and it expressed inmeters; it has dimension L1.
D = ΣD N
Where ΣD = Cumulative depth of all erosion channelsN = Total number of erosion channels
5. Discussion and Conclusion
The EFI Index provides a more comprehensive quantitative or semi-quantitative characterizationof erosion within a given area than has hitherto been developed, and can be applied toadministrative areas (political units) as well as hydrophysical areas on the terrain. EFI Indexgives the "erosion frequency and intensity" within a specific area on the terrain in numericalterms; however the numerical values can be aggregated to classes and characterized indescriptive terms. Thus EFI Index of less than five (5) indicates slight erosion intensity; 5-10moderate, 10-15 high, and above fifteen (15) severe erosion intensity. These intensity classeshave been colour coded and used to prepare an erosion map of South Eastern Nigeria (Fig.6).
The erosion map has been constructed on a modified form of the Universal TransverseMercator Projection (UTM) known as the Nigerian Transverse Mercator Projection (NTM). Thisis a special purpose version of the UTM with three belts, each 4o wide in longitude, covering thewhole country (the UTM is 6o wide in longitude). The study area falls within the middle Belt ofthe projection with the Central Meridian (CM) at 8o30'E. The geomorphological symbols used inthe map have been designed in accordance with the International Institute for AerospaceSurveys and Earth Sciences (ITC) system of Geomorphological Symbols and the UNESCOsystem for Engineering geological maps. All other symbols and annotations are in accordancewith established cartographic conventions.
From the erosion map of South Eastern Nigeria the area of high to severe erosion intensitiesappear to be aligned in two directions NW-SE and NE-SW; the NW-SE direction is the moreprominent while that of NE-SW is just perceptible. It is interesting to note that the initial rifting ofthe Southern Nigeria Continental Margin in the Mesozoic Era produced two principal sets offaults trending NE-SW and NW-SE. The NE-SW fault bound the Benue Trough, while the NW-SE faults define the Calabar Flank. Whether the observed trend in erosion intensity has tecto-structural relationships might be debatable, and require further geological and geophysicalinvestigations to confirm.
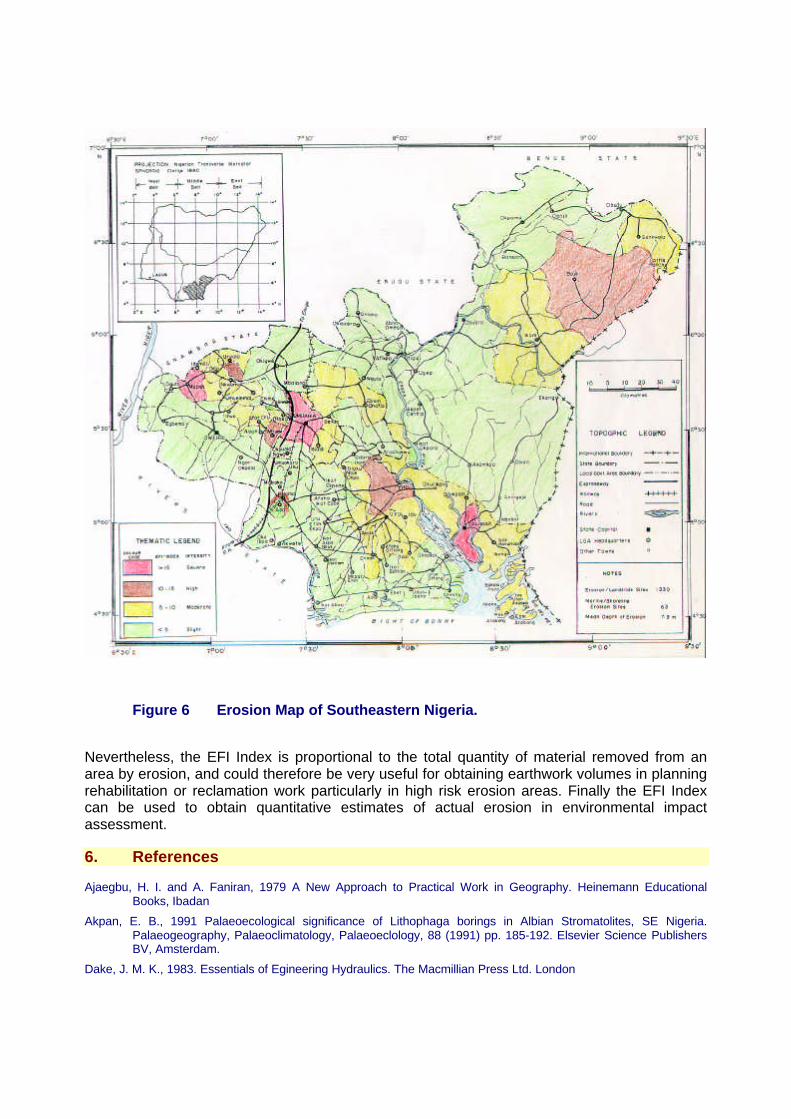
Figure 6 Erosion Map of Southeastern Nigeria.
Nevertheless, the EFI Index is proportional to the total quantity of material removed from anarea by erosion, and could therefore be very useful for obtaining earthwork volumes in planningrehabilitation or reclamation work particularly in high risk erosion areas. Finally the EFI Indexcan be used to obtain quantitative estimates of actual erosion in environmental impactassessment.
6. References
Ajaegbu, H. I. and A. Faniran, 1979 A New Approach to Practical Work in Geography. Heinemann EducationalBooks, Ibadan
Akpan, E. B., 1991 Palaeoecological significance of Lithophaga borings in Albian Stromatolites, SE Nigeria.Palaeogeography, Palaeoclimatology, Palaeoeclology, 88 (1991) pp. 185-192. Elsevier Science PublishersBV, Amsterdam.
Dake, J. M. K., 1983. Essentials of Egineering Hydraulics. The Macmillian Press Ltd. London
Ekwueme, B. N., 1995. The Precambrian Geology of Oban Massif South Eastern Nigeria. In Geological ExcursionGuide Book. Published in commemoration of the 31st Annual Conference of the Nigerian Minning andGeosciences Society, March, 1995.
Haggett, P and R. J. Chorley, 1969. Network Analysis in Geography (pp 74 - 76) Edward Arnold Publishers Ltd.London.
Mekel, J. F. M., 1977. The use of Aerial Photographs and other Images in Geological Mapping. ITC Textbook ofPhotointerpretation ITC, Enschede, The Netherlands.
Nyong, E. E., 1995. Cretaceous Sediments in the Calabar Flank. In Geological Excursion Guidebook. Published incommemoration of the 31st Annual Conference of the Nigerian Mining and Geosciences Society; March1995.
Petters, S. W., 1995. South Eastern Benue Trough and Ikom-Mamfe Embayment. 74 In Geological Excursion GuideBook. Published in commemoration of the 31st Annual Conference of the Nigerian Mining and GeosciencesSociety; March 1995.
Rengers, Niek, 1981. Special Application of Photographs in Engineering Geology. International Institute forAerospace Surveys and Earth Science (ITC) Pamphlet Gol. 11 pp 51-70.
UNESCO, 1976 Engineering Geological Maps. A Guide to their preparation The Unesco Press, Paris 1976.
United Nations Development Programme (UNDP), 1995. Studies on Erosion, Flood and Landslide in Abia, AkwaIbom, Cross River and Imo States. Baseline Report prepared by Team of UNDP National Consultants Vols. I- IV.
Usoro E. J. et al., 1989. Akwa Ibom State. Physical Background, Soils and Land Use, and Ecological Problems.Technical Report of the Task Force on Soils and Land Use Survey of Akwa Ibom State.
Wischmeier, W. H. and O. D. Smith, 1978 Predicting Rainfall Erosion - A Guide to Conservation Planning. USDAAgricultural Handbook No. 573.
Wright, J. B., 1966. South Atlantic Continental Drift and the Benue Trough. Tectonophysics, Vol. 6. p. 301-310.