Embed Size (px)
Citation preview
Endwall Heat Transfer and Shear Stress for a Nozzle Guide Vane with Fillets and a Leakage Interface
Stephen P. Lynch
Thesis submitted to the Faculty of Virginia Polytechnic Institute and State University
in partial fulfillment of the requirements for the degree of
Master of Science in
Mechanical Engineering
Dr. Karen Thole, Chair Dr. Wing Ng
Dr. Brian Vick
April 18, 2007 Blacksburg, VA
Keywords: gas turbines, vane endwalls, film-cooling, fillets
Endwall Heat Transfer and Shear Stress for a Nozzle Guide Vane with Fillets and a Leakage Interface
Stephen P. Lynch
Abstract
Increasing the combustion temperatures in a gas turbine engine to achieve higher
efficiency and power output also results in high heat loads to turbine components downstream of
the combustor. The challenge of adequately cooling the nozzle guide vane directly downstream
of the combustor is compounded by a complex vortical secondary flow at the junction of the
endwall and the airfoil. This flow tends to increase local heat transfer rates and sweep coolant
away from component surfaces, as well as decrease the turbine aerodynamic efficiency. Past
research has shown that a large fillet at the endwall-airfoil junction can reduce or eliminate the
secondary flow. Also, leakage flow from the interface gap between the combustor and the
turbine can provide some cooling to the endwall. This study examines the individual and
combined effects of a large fillet and realistic combustor-turbine interface gap leakage flow for a
nozzle guide vane. The first study focuses on the effect of leakage flow from the interface gap
on the endwall upstream of the vane. The second study addresses the influence of large fillets at
the endwall-airfoil junction, with and without upstream leakage flow. Both studies were
performed in a large low-speed wind tunnel with the same vane geometry. Endwall shear stress
measurements were obtained for various endwall-airfoil junction geometries without upstream
leakage flow. Endwall heat transfer and cooling effectiveness were measured for various
leakage flow rates and leakage gap widths, with a variety of endwall-airfoil junction geometries.
Results from these studies indicate that the secondary flow has a large influence on the
coverage area of the leakage coolant. Increased leakage flow rates resulted in better cooling
effectiveness and coverage, but also higher heat transfer rates. The two fillet geometries tested
affected coolant coverage by displacing coolant around the base of the fillet, which could result
in undesirably high gradients in endwall temperature. The addition of a large fillet to the
endwall-airfoil junction, however, reduced heat transfer, even when upstream leakage flow was
present.
iii
Attribution
The co-author for Paper 1, entitled, “The Effect of Combustor-Turbine Interface Gap
Leakage on the Endwall Heat Transfer for a Nozzle Guide Vane”, is Dr. Karen Thole. Dr. Thole
is affiliated with the Mechanical and Nuclear Engineering Department at The Pennsylvania State
University in University Park, PA. Her contribution to the work presented in Paper 1 included
general advising on the experimental setup and data analysis, as well as editing of the
manuscript.
Dr. Karen Thole is also a co-author for Paper 2, entitled, “Heat Transfer and Shear Stress
for a Nozzle Guide Vane Endwall with Fillets and Combustor-Turbine Gap Leakage Flow”. Her
contribution to the work presented in Paper 2 included manuscript editing, and advice with the
design of the experiment and analysis of the results.

iv
Acknowledgments
I would like to sincerely thank all who have helped me achieve this milestone in my life.
First and foremost is my rock, Jesus Christ, who gives me joy for the good times, and strength
for the hard times. All of my blessings and achievements are from Him, and although the road
can be hard to follow, I know He has a plan. I would like to thank my family, beginning with the
best thing that has ever happened to me: my wife Becca. I will never be able to tell you how
much you mean to me. The fact that we have created life together is the best expression of my
love for you. I would also like to thank my parents Pat and Cathy, and my siblings Liz, Kevin,
Michelle, and Brian. Without their love, encouragement, and constant teasing (!), I would not be
the person I am today. I am blessed to be in the company of such good people.
Many, many thanks are due to my advisor, Karen Thole. You have provided me with
many opportunities and challenges, but more importantly, you have believed in my abilities. I
very much appreciate your guidance and patience as I have grown in my professional life, and I
am looking forward to the next chapter in our time together. You are a role model for me and I
hope that someday I can give my graduate students the types of opportunities that you have given
to me.
My labmates are last here but certainly not least. All of the good people who have come
and gone from VTExCCL have left an impression on me that I will not forget. My life has been
changed forever by your friendship, and thanks are not enough. All of my memories of you are
fond ones: LabCathlon, Music Night, the white t-shirt mob all sleeping in class, Princess
Chicken, noontime basketball, lunch at El Rod’s/Rivermill/Hunan/any other seedy but cheap
food place, and many others…thanks to all of you, and God bless you all.

v
Table of Contents Abstract ........................................................................................................................................... ii Attribution...................................................................................................................................... iii Acknowledgments.......................................................................................................................... iv List of Tables ................................................................................................................................ vii List of Figures .............................................................................................................................. viii Preface............................................................................................................................................ xi Paper 1: The Effect of Combustor-Turbine Interface Gap Leakage on the Endwall Heat
Transfer for a Nozzle Guide Vane ...........................................................................1 Abstract ..............................................................................................................1 Introduction........................................................................................................2 Relevant Past Studies.........................................................................................2 Experimental Facility and Methodology ...........................................................4 i. Endwall Friction Coefficient Measurements ..........................................6 ii. Adiabatic Effectiveness Measurements..................................................8 iii. Heat Transfer Measurements..................................................................9 Discussion of Results.......................................................................................10 i. Friction Coefficients without an Upstream Slot ...................................10 ii. Adiabatic Effectiveness Levels from an Upstream Slot .......................11 iii. Heat Transfer Coefficients for an Upstream Slot .................................14 iv. Net Heat Flux Reduction for an Upstream Slot....................................15 Conclusions......................................................................................................17 Acknowledgments............................................................................................18 Nomenclature...................................................................................................18 References........................................................................................................19
Paper 2: Heat Transfer and Shear Stress for a Nozzle Guide Vane Endwall with Fillets and Combustor-Turbine Gap Leakage Flow ................................................................31
Abstract ............................................................................................................31 Introduction......................................................................................................32 Relevant Past Studies.......................................................................................33 Experimental Facility and Methodology .........................................................35 i. Combustor-Turbine Interface Geometry ..............................................36 ii. Endwall-Airfoil Fillet Designs .............................................................37 iii. Shear Stress Measurements ..................................................................37 iv. Heat Transfer Coefficient Measurements .............................................39 v. Adiabatic Effectiveness Measurements ................................................40 Discussion of Results.......................................................................................41 i. Wall Shear Stress without an Upstream Slot ........................................41 ii. Heat Transfer Coefficients without an Upstream Slot..........................42 iii. Heat Transfer Coefficients with Upstream Slot Flow ..........................44 iv. Adiabatic Effectiveness Levels from an Upstream Slot .......................46
vi
Conclusions......................................................................................................48 Acknowledgments............................................................................................49 Nomenclature...................................................................................................49 References........................................................................................................50
vii
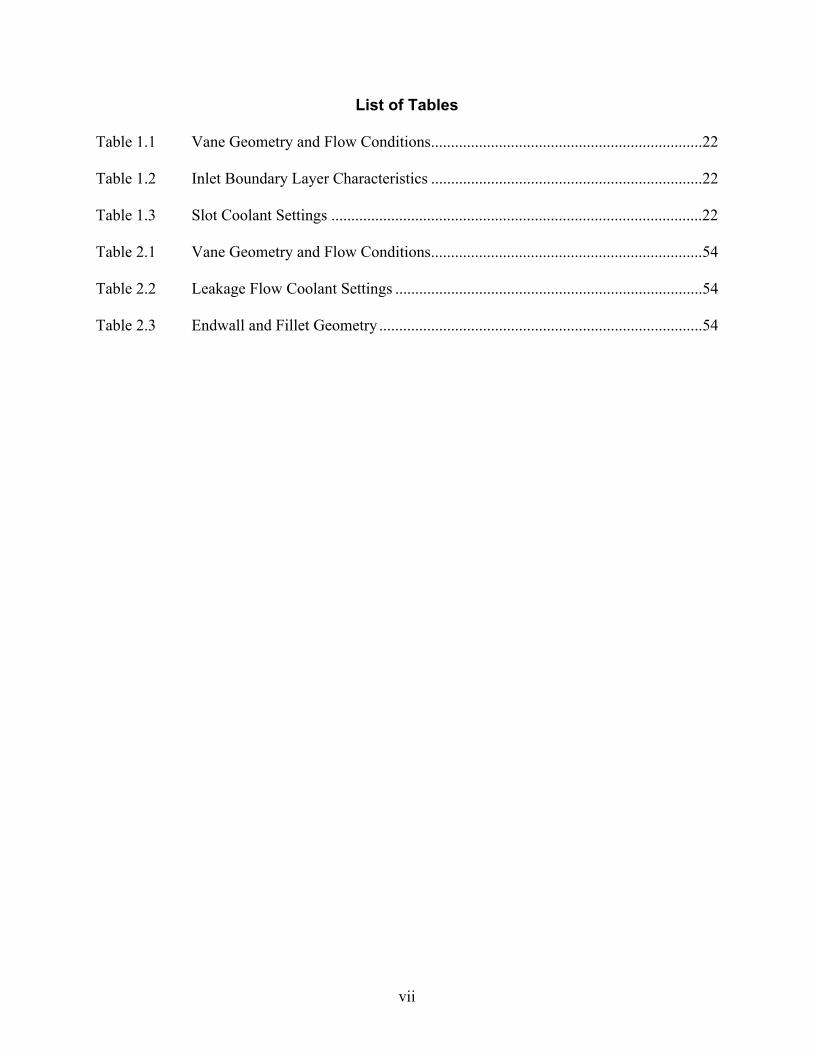
List of Tables Table 1.1 Vane Geometry and Flow Conditions....................................................................22 Table 1.2 Inlet Boundary Layer Characteristics ....................................................................22 Table 1.3 Slot Coolant Settings .............................................................................................22 Table 2.1 Vane Geometry and Flow Conditions....................................................................54 Table 2.2 Leakage Flow Coolant Settings .............................................................................54 Table 2.3 Endwall and Fillet Geometry .................................................................................54
viii
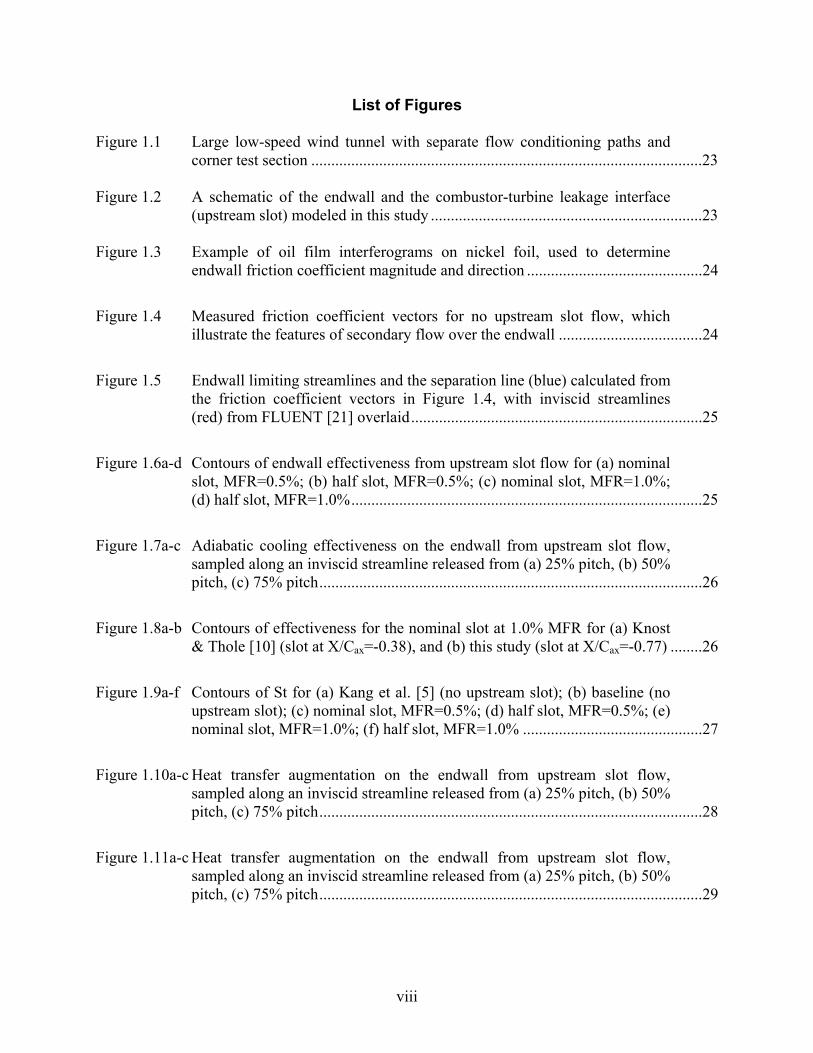
List of Figures
Figure 1.1 Large low-speed wind tunnel with separate flow conditioning paths and corner test section ..................................................................................................23
Figure 1.2 A schematic of the endwall and the combustor-turbine leakage interface
(upstream slot) modeled in this study ....................................................................23 Figure 1.3 Example of oil film interferograms on nickel foil, used to determine
endwall friction coefficient magnitude and direction ............................................24
Figure 1.4 Measured friction coefficient vectors for no upstream slot flow, which illustrate the features of secondary flow over the endwall ....................................24
Figure 1.5 Endwall limiting streamlines and the separation line (blue) calculated from the friction coefficient vectors in Figure 1.4, with inviscid streamlines (red) from FLUENT [21] overlaid.........................................................................25
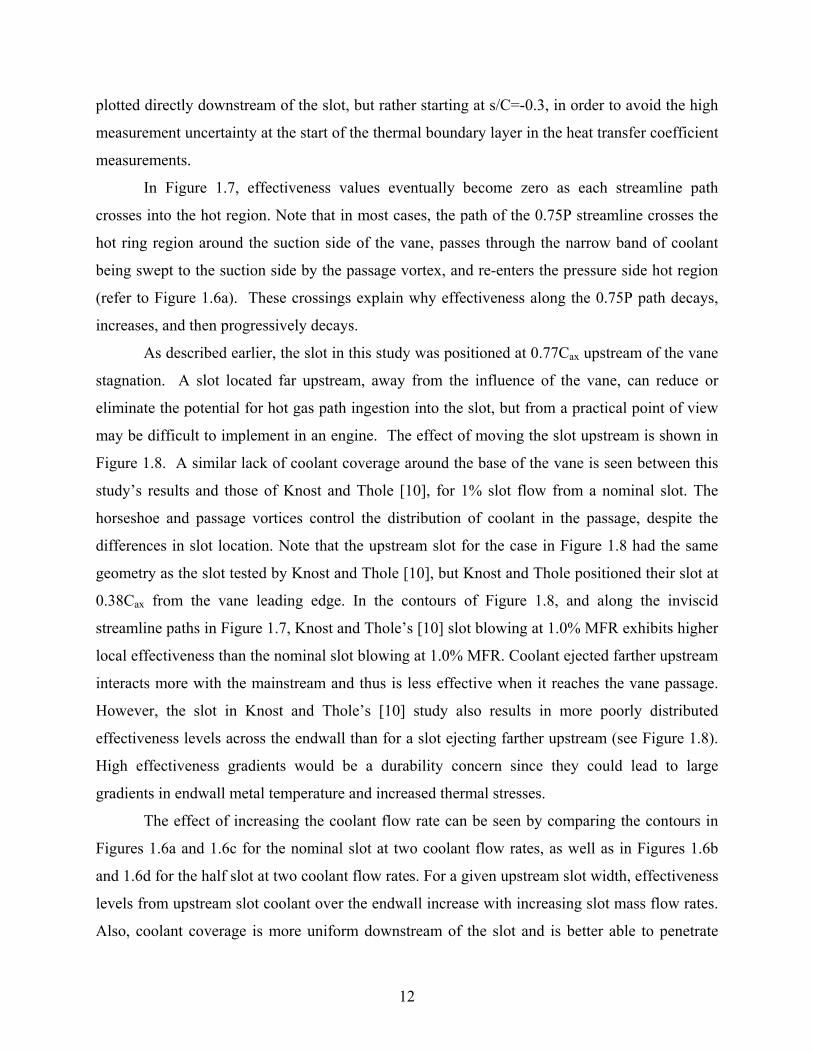
Figure 1.6a-d Contours of endwall effectiveness from upstream slot flow for (a) nominal slot, MFR=0.5%; (b) half slot, MFR=0.5%; (c) nominal slot, MFR=1.0%; (d) half slot, MFR=1.0%........................................................................................25
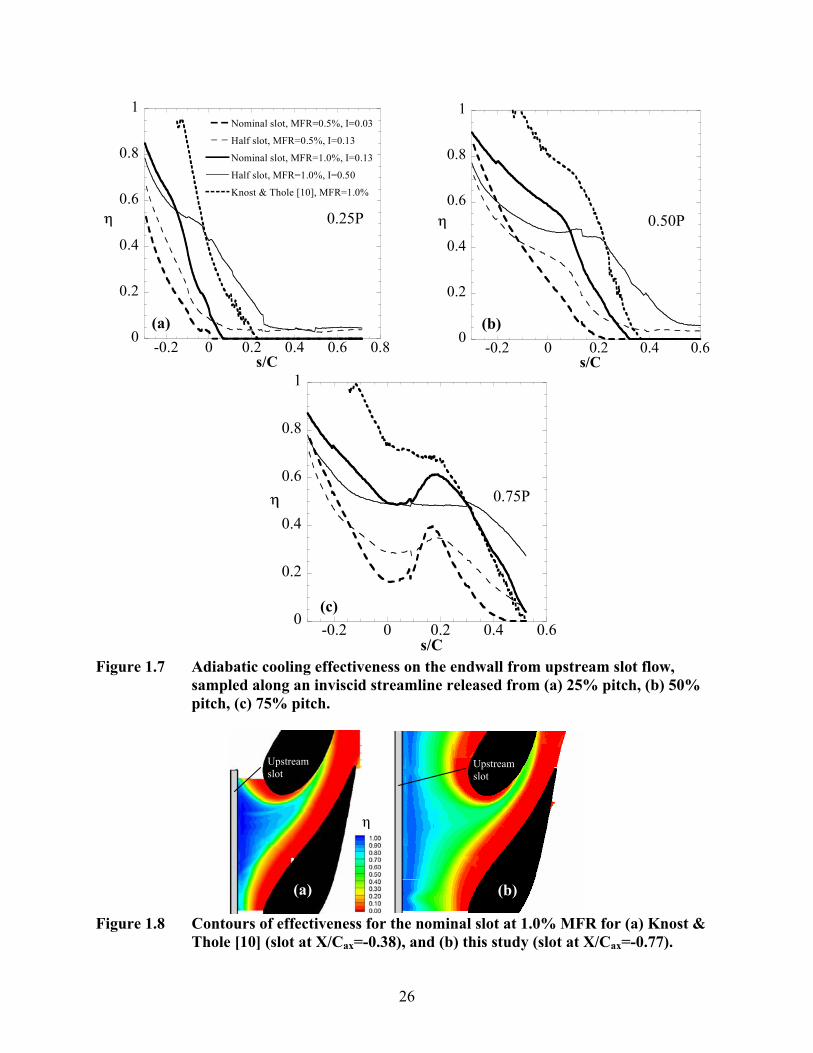
Figure 1.7a-c Adiabatic cooling effectiveness on the endwall from upstream slot flow, sampled along an inviscid streamline released from (a) 25% pitch, (b) 50% pitch, (c) 75% pitch................................................................................................26
Figure 1.8a-b Contours of effectiveness for the nominal slot at 1.0% MFR for (a) Knost & Thole [10] (slot at X/Cax=-0.38), and (b) this study (slot at X/Cax=-0.77) ........26
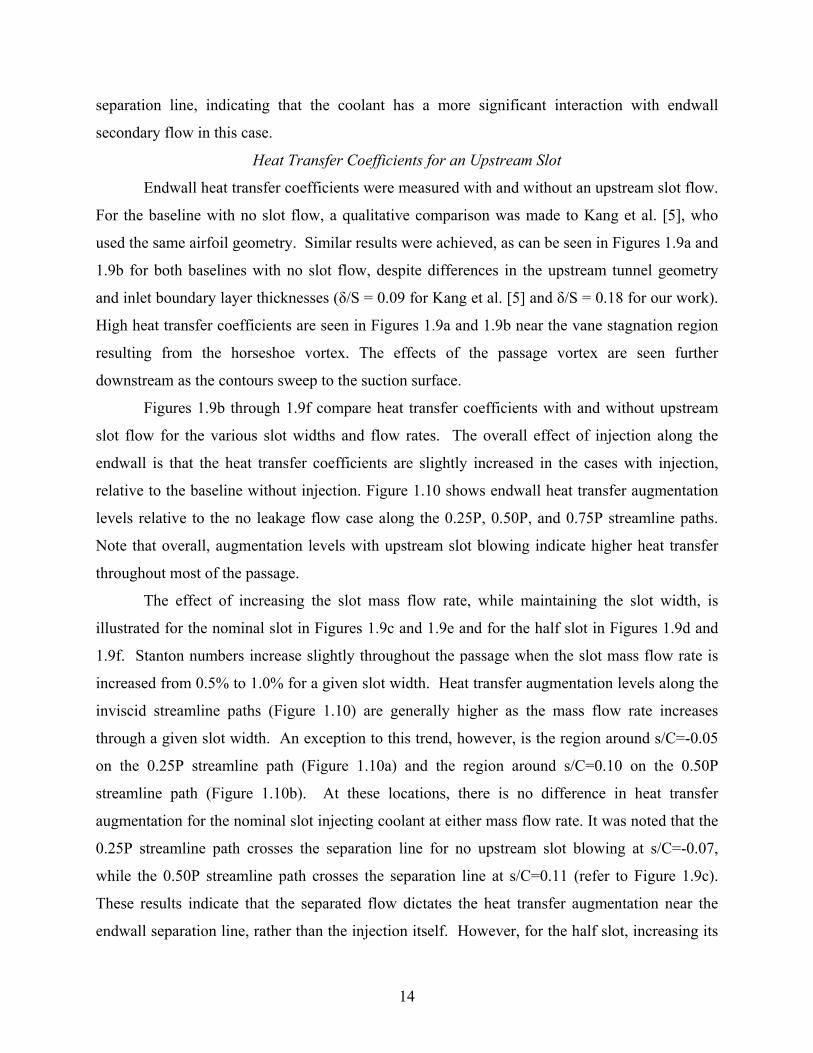
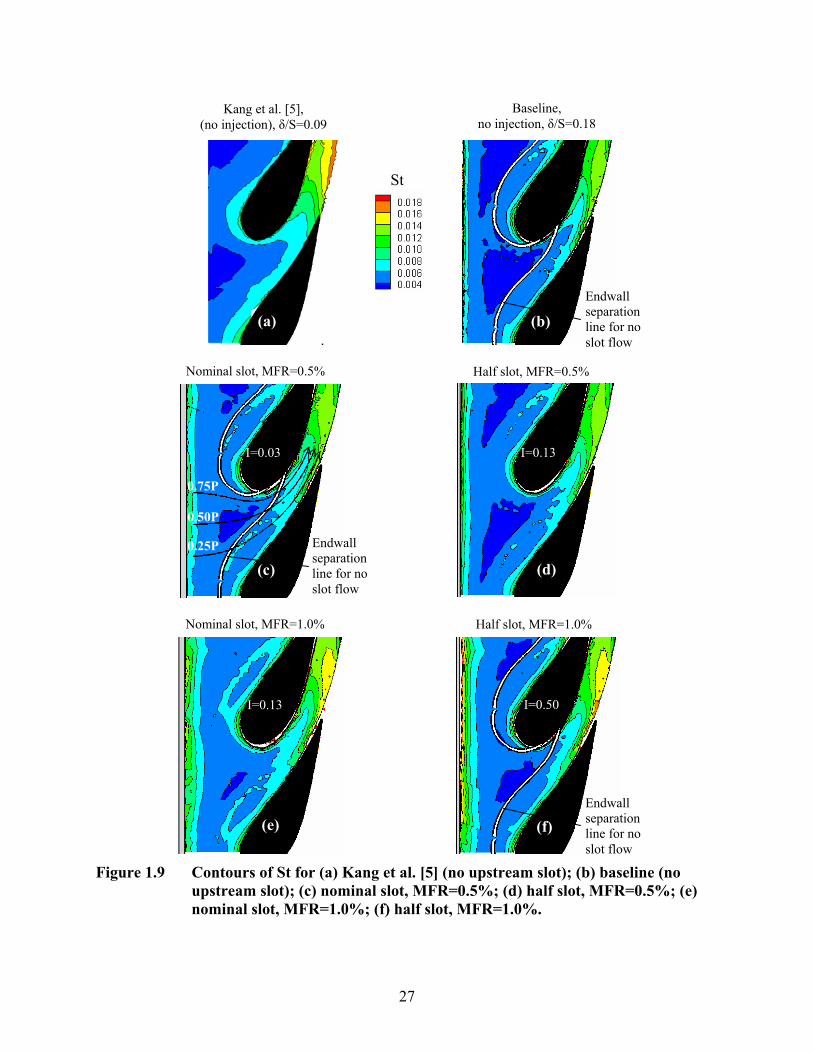
Figure 1.9a-f Contours of St for (a) Kang et al. [5] (no upstream slot); (b) baseline (no upstream slot); (c) nominal slot, MFR=0.5%; (d) half slot, MFR=0.5%; (e) nominal slot, MFR=1.0%; (f) half slot, MFR=1.0% .............................................27
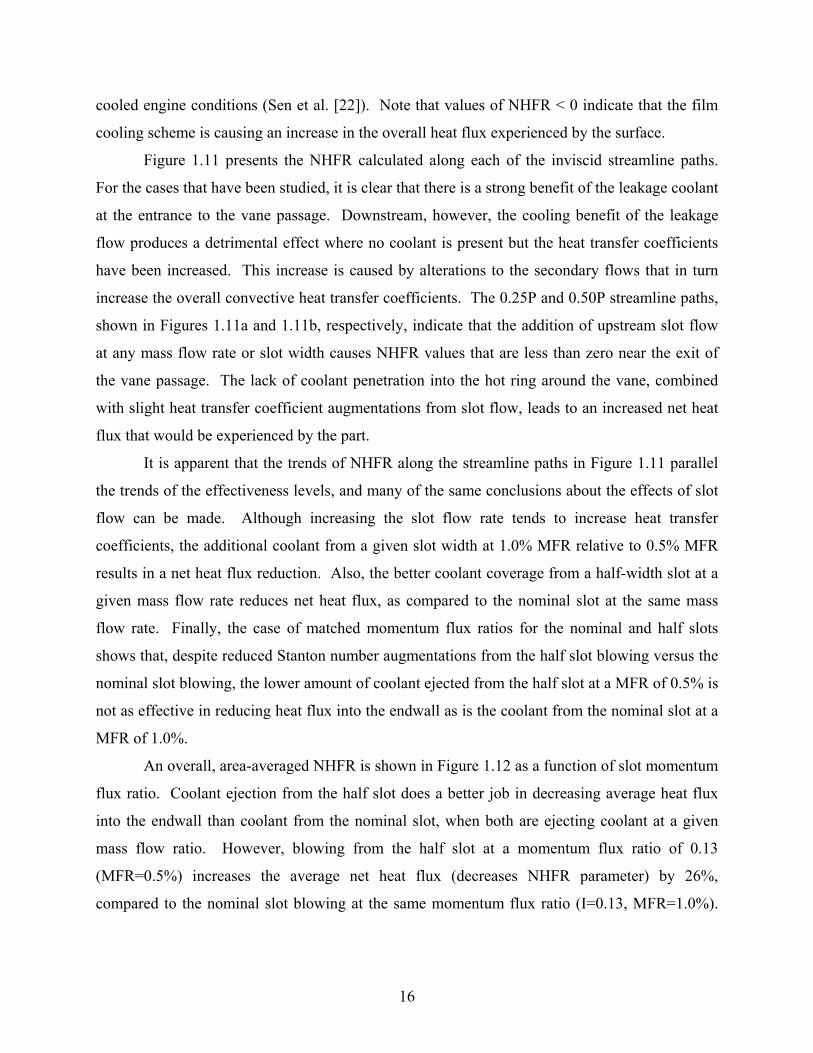
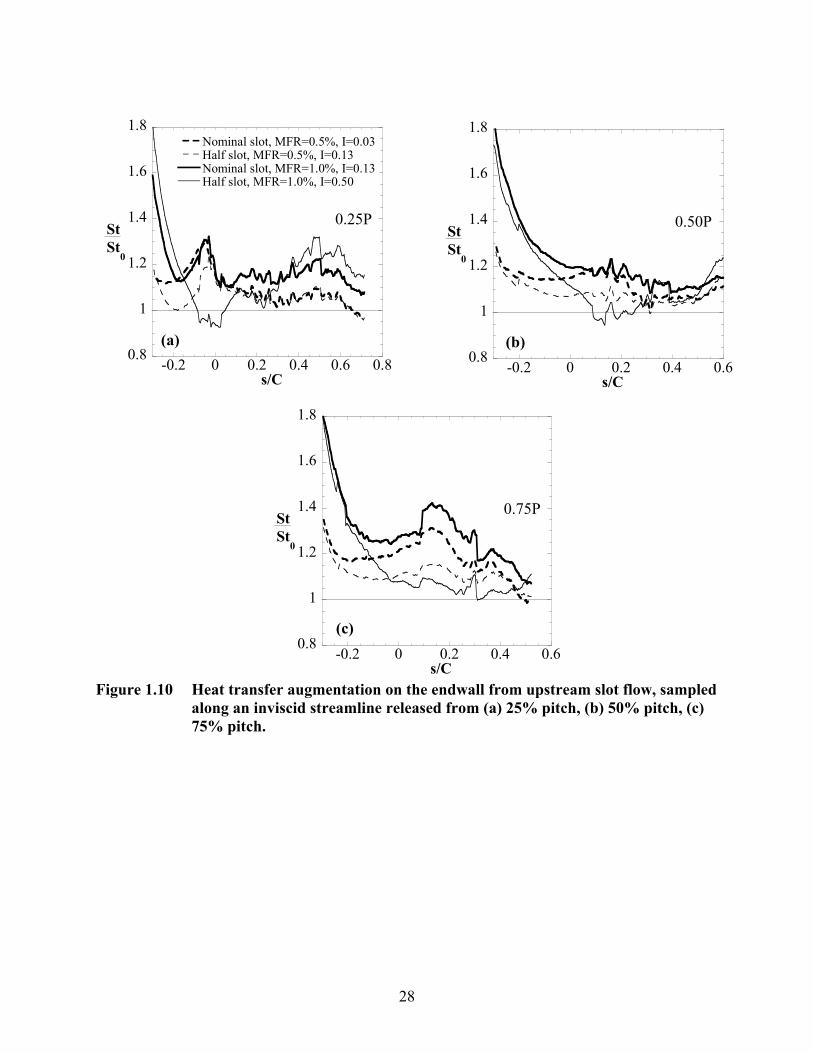
Figure 1.10a-c Heat transfer augmentation on the endwall from upstream slot flow, sampled along an inviscid streamline released from (a) 25% pitch, (b) 50% pitch, (c) 75% pitch................................................................................................28
Figure 1.11a-c Heat transfer augmentation on the endwall from upstream slot flow, sampled along an inviscid streamline released from (a) 25% pitch, (b) 50% pitch, (c) 75% pitch................................................................................................29
ix
Figure 1.12 Area-averaged net heat flux reduction (NHFR) to the endwall, as a function of upstream slot momentum flux ratio ....................................................30
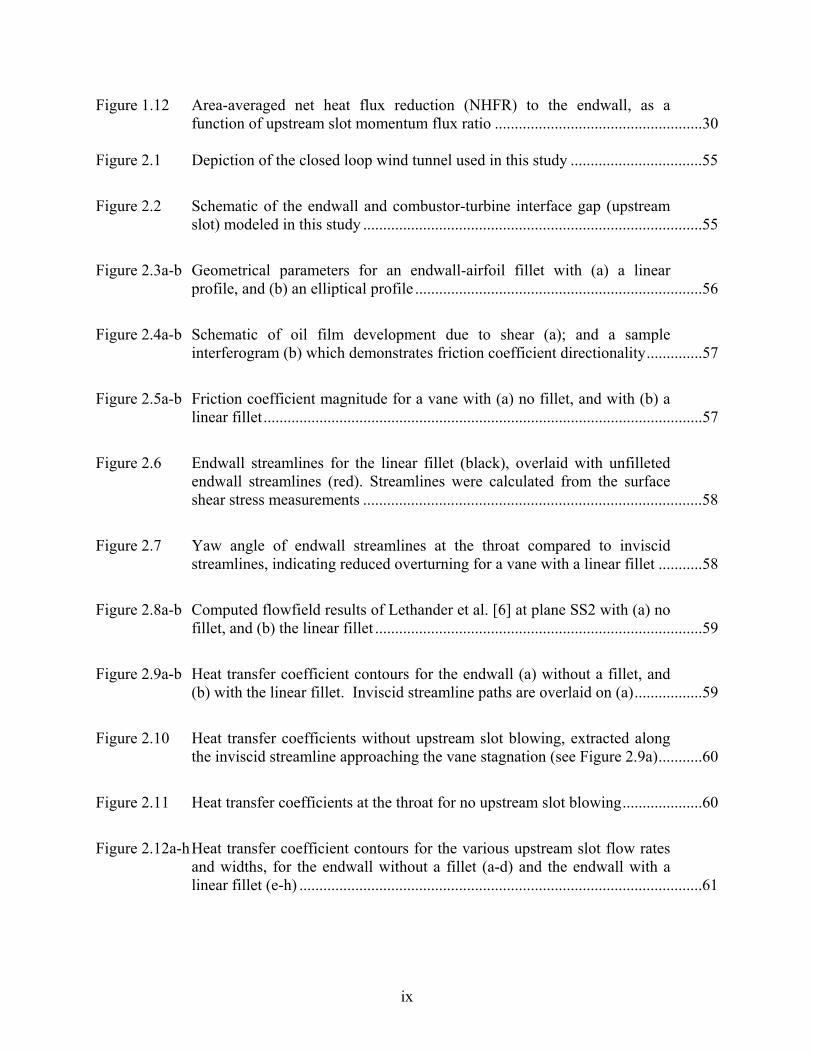
Figure 2.1 Depiction of the closed loop wind tunnel used in this study .................................55
Figure 2.2 Schematic of the endwall and combustor-turbine interface gap (upstream slot) modeled in this study .....................................................................................55
Figure 2.3a-b Geometrical parameters for an endwall-airfoil fillet with (a) a linear profile, and (b) an elliptical profile ........................................................................56
Figure 2.4a-b Schematic of oil film development due to shear (a); and a sample interferogram (b) which demonstrates friction coefficient directionality..............57
Figure 2.5a-b Friction coefficient magnitude for a vane with (a) no fillet, and with (b) a linear fillet..............................................................................................................57
Figure 2.6 Endwall streamlines for the linear fillet (black), overlaid with unfilleted endwall streamlines (red). Streamlines were calculated from the surface shear stress measurements .....................................................................................58
Figure 2.7 Yaw angle of endwall streamlines at the throat compared to inviscid streamlines, indicating reduced overturning for a vane with a linear fillet ...........58
Figure 2.8a-b Computed flowfield results of Lethander et al. [6] at plane SS2 with (a) no fillet, and (b) the linear fillet ..................................................................................59
Figure 2.9a-b Heat transfer coefficient contours for the endwall (a) without a fillet, and (b) with the linear fillet. Inviscid streamline paths are overlaid on (a).................59
Figure 2.10 Heat transfer coefficients without upstream slot blowing, extracted along the inviscid streamline approaching the vane stagnation (see Figure 2.9a)...........60
Figure 2.11 Heat transfer coefficients at the throat for no upstream slot blowing....................60
Figure 2.12a-h Heat transfer coefficient contours for the various upstream slot flow rates and widths, for the endwall without a fillet (a-d) and the endwall with a linear fillet (e-h) .....................................................................................................61
x
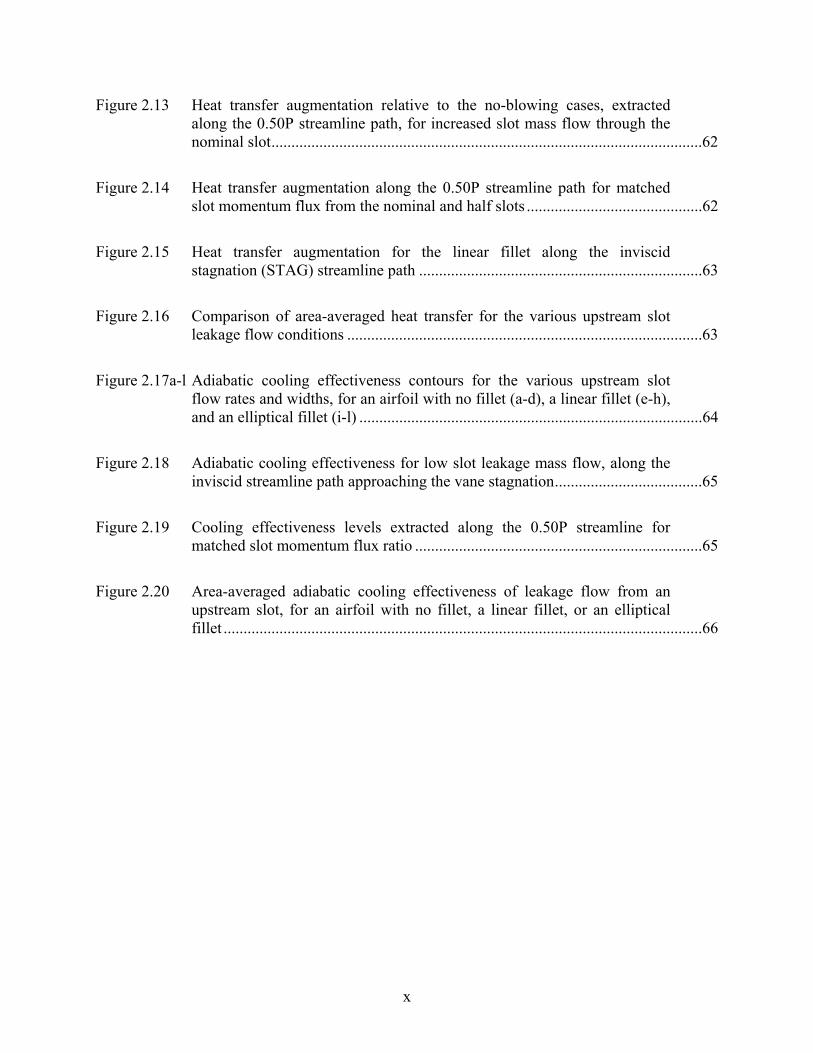
Figure 2.13 Heat transfer augmentation relative to the no-blowing cases, extracted along the 0.50P streamline path, for increased slot mass flow through the nominal slot............................................................................................................62
Figure 2.14 Heat transfer augmentation along the 0.50P streamline path for matched slot momentum flux from the nominal and half slots ............................................62
Figure 2.15 Heat transfer augmentation for the linear fillet along the inviscid stagnation (STAG) streamline path .......................................................................63
Figure 2.16 Comparison of area-averaged heat transfer for the various upstream slot leakage flow conditions .........................................................................................63
Figure 2.17a-l Adiabatic cooling effectiveness contours for the various upstream slot flow rates and widths, for an airfoil with no fillet (a-d), a linear fillet (e-h), and an elliptical fillet (i-l) ......................................................................................64
Figure 2.18 Adiabatic cooling effectiveness for low slot leakage mass flow, along the inviscid streamline path approaching the vane stagnation.....................................65
Figure 2.19 Cooling effectiveness levels extracted along the 0.50P streamline for matched slot momentum flux ratio ........................................................................65
Figure 2.20 Area-averaged adiabatic cooling effectiveness of leakage flow from an upstream slot, for an airfoil with no fillet, a linear fillet, or an elliptical fillet ........................................................................................................................66
xi
Preface
Turbine efficiency and power output are directly related to an increase in the temperature
entering the turbine section. However, turbine component durability is adversely affected by
increased temperatures. Advanced cooling schemes are necessary for part survival, but require
the use of high-pressure air bypassed from the compressor section. This reduces engine
efficiency, and minimal use of the bypass air is desirable. One such use of the bypass air is
leakage through interface gaps between turbine components, to prevent hot gas ingestion.
Leakage flow from the gap between the combustor and the turbine can also provide some
cooling to the endwall of the nozzle guide vane; however, the endwall cooling is complicated by
a vortical secondary flow at the endwall-airfoil junction, which can sweep coolant away from the
endwall and increase heat transfer. A large leading edge fillet at the endwall-airfoil junction has
been shown to mitigate the effect of the secondary flow, but the combined effect of gap leakage
flow and the fillet has not been studied. It is hypothesized that the fillet will reduce endwall heat
transfer, even in the presence of leakage flow, because of its effect on the secondary flow.
Included are two papers which analyze the individual and combined effects of upstream leakage
flow and large leading-edge endwall-airfoil fillet designs.
The first paper is entitled, “The Effect of Combustor-Turbine Interface Gap Leakage on
the Endwall Heat Transfer for a Nozzle Guide Vane”. Measurements of endwall shear stress,
heat transfer, and cooling effectiveness were presented for a nozzle guide vane with leakage flow
from a realistic combustor-turbine interface gap upstream of the vanes. The gap location was
moved much farther upstream than in other studies, which negatively impacted cooling
effectiveness levels in the passage but resulted in more uniform coverage upstream of the vane.
The endwall streamline topology without leakage flow correlated well with the leakage coolant
coverage pattern, suggesting that the vortical secondary flow at the endwall-airfoil junction
strongly influences the coolant trajectory through the passage. A reduction in the leakage gap
width, simulating engine axial thermal expansion, resulted in lower cooling effectiveness but
also lower heat transfer.
The second paper is entitled, “Heat Transfer and Shear Stress for a Nozzle Guide Vane
Endwall with Fillets and Combustor-Turbine Gap Leakage Flow”. This study examined the
individual and combined effects of large leading-edge endwall-airfoil fillets and combustor-
xii
turbine interface gap leakage flow through measurements of endwall shear stress, heat transfer,
and leakage flow cooling effectiveness for a nozzle guide vane. The addition of a fillet to the
endwall-airfoil junction increased endwall shear stress and heat transfer at the throat of the vane
cascade, but also reduced overall average heat transfer to the endwall relative to an unfilleted
endwall. This benefit of reduced endwall heat transfer with a fillet was also apparent when
upstream leakage flow was present. Unfortunately, both the linear and elliptical fillet geometries
tested resulted in decreased coolant coverage and effectiveness levels compared to an unfilleted
endwall.
*Co-author: Dr. Karen A. Thole, Mechanical and Nuclear Engineering Department, The Pennsylvania State University
1
Paper 1:
THE EFFECT OF COMBUSTOR-TURBINE INTERFACE GAP LEAKAGE ON THE ENDWALL HEAT TRANSFER FOR A NOZZLE GUIDE VANE
Accepted to the 2007 IGTI Conference*
Recommended for publication in the Journal of Turbomachinery*
Abstract
To enable turbine components to withstand high combustion temperatures, they are
cooled by air routed from the compressor, which can leak through gaps between components.
These gaps vary in size from thermal expansions that take place. The leakage flow between the
interface of the combustor and the turbine, in particular, interacts with the flowfield along the
endwall.
This study presents measurements of adiabatic cooling effectiveness and heat transfer
coefficients on the endwall of a first vane, with the presence of leakage flow through a flush slot
upstream of the vane. The effect of axial contraction of the slot width due to thermal expansion
of the engine was tested for two blowing rates. Contracting the slot width, while maintaining the
slot mass flow, resulted in a larger coolant coverage area and higher effectiveness values, as well
as slightly lower heat transfer coefficients. Matching the momentum flux ratio of the leakage
flow from the nominal and contracted slot widths lowered both cooling effectiveness and heat
transfer coefficients for the contracted slot flow. Comparison of the coolant coverage pattern to
the measured endwall shear stress topology indicated that the trajectory of the slot coolant was
dictated by the complex endwall flow.
2
Introduction To achieve high efficiency and maximum power output, the temperature of the
combustion gases entering the turbine section of a gas turbine engine must be as high as possible,
while acknowledging the limitations of material strength and durability. This subjects the
turbine section components to high heat loads which must be managed by cooling, since turbine
inlet temperatures are generally well above the melting point of the metal. Relatively cool air is
bled from the compressor and routed to the turbine components, where it provides internal and
external cooling. Cooling is particularly important on the endwall of a turbine vane or blade,
since the complex flow in that region results in high heat transfer rates, and also tends to sweep
coolant away from the endwall surface.
Assembly of individual turbine components inherently results in gaps between parts. The
large operational range of a gas turbine results in significant thermal expansion, making these
gaps difficult to seal. Furthermore, the temperature profile exiting the combustor may not be
uniform, leading to additional thermal expansion issues. Since leakage of the hot combustion
gases into the gaps is detrimental to engine durability, high-pressure compressor bleed air is
purged through the gaps. Purge flow, however, results in a loss in turbine efficiency since it does
no useful work, and it is desirable to minimize this flow.
One gap that must be considered is between the combustor and the first stage of the
turbine section. In addition to preventing hot gas ingestion, purge flow through the combustor-
turbine interface gap can provide some cooling to the endwall of the turbine vane. However, the
trajectory of this coolant is influenced by the complex endwall flowfield. Thermal expansion of
the combustor-turbine interface gap during engine operational cycling also influences purge flow
and changes the heat transfer experienced by the endwall.
This paper discusses the effects of leakage flow on turbine vane endwall heat transfer, for
a combustor-turbine interface gap with axial thermal expansion. Also considered is the effect of
moving the interface far upstream of the turbine vanes.
Relevant Past Studies
The endwall flowfield of a first stage turbine vane consists of unique features that
contribute to high heat transfer and aerodynamic losses. Although there are slight differences in
detail, flowfield studies by Langston et al. [1], Sharma and Butler [2], Goldstein and Spores [3],
3
and others concur on the dominant structures in the endwall region for an approach flow that is
uniform with a two-dimensional boundary layer. The incoming boundary layer on the endwall
rolls up into a horseshoe vortex at the leading edge of the vane. The horseshoe vortex splits into
suction and pressure side legs where the pressure side leg develops into a passage vortex. These
vortical structures and their interaction (generally termed “secondary flows”) are sources of
aerodynamic loss in the cascade; furthermore, they sweep coolant from the endwall and increase
endwall heat transfer coefficients.
Graziani et al. [4], Kang et al. [5], and Ames et al. [6] presented results of endwall heat
transfer influenced by secondary flows. Measurements of heat transfer coefficients indicated
regions of high heat transfer at the blade leading edge, and adjacent to the suction side of the
airfoil downstream of the passage throat. All of the investigators attributed the high heat transfer
coefficients to the effects of the horseshoe and passage vortices. Goldstein and Spores [3] used
naphthalene mass transfer to infer heat transfer coefficients and deduced the existence of
additional corner vortices along the suction side of the vane.
Coolant leakage was investigated by Blair [7] who presented endwall heat transfer from
flow through a two-dimensional slot upstream of a linear cascade. Measured endwall heat
transfer coefficients were similar with and without the additional slot flow. However,
measurements of adiabatic effectiveness over a range of blowing ratios revealed that coolant
accumulated along the suction side of the vane in the passage. Granser and Schulenberg [8] and
Knost and Thole [9] reported similar trends of coolant accumulation. Computational predictions
by Knost and Thole [10] indicated that streamline paths near the endwall became increasingly
more directed toward the pressure side of the vane passage as flow rates increased through their
upstream slot configuration.
Studies have been completed with upstream leakage in a contoured endwall vane
cascade, where the contour serves to accelerate the flow and thin the boundary layer with the aim
of reducing secondary flows. Burd et al. [11] found that coolant effectiveness levels and coolant
coverage were increased for higher coolant ejection rates from an upstream flush slot on their
contoured endwall. They conjectured that the momentum of the slot coolant at higher flow rates
enabled it to avoid being entrained into the secondary flow vortices.
The only known study of thermal expansion of the combustor-turbine gap in the axial
direction is Cardwell et al. [12]. Cardwell et al. found that adiabatic cooling effectiveness
4
coverage area was a function of slot momentum flux ratio, but effectiveness levels were
dependent on the slot mass flow ratio.
The axial location of an upstream slot has also been shown to be important in the
interaction of slot flow with secondary vortices. Kost and Nicklas [13] and Nicklas [14]
presented aerodynamic and heat transfer measurements for upstream slot and passage discrete
hole film cooling in a transonic cascade. For slot coolant ejection at 1.3% of the core flow rate
and no passage film cooling, they found that the slot flow intensified the horseshoe vortex and
increased heat transfer coefficients by nearly three times that of no slot flow. They attributed
this dramatic increase to the fact that their slot, at 0.2Cax upstream of the vane, was intensifying
the horseshoe vortex by injecting at the separation location on the endwall. Kost and Mullaert
[15] studied the same airfoil geometry, but moved the flush slot to 0.3Cax upstream of the vane.
They found that for this configuration, slot flow stayed closer to the endwall and provided better
cooling than flow from the slot located at 0.2Cax upstream of the vane.
The study reported in our paper expands upon the work of Cardwell et al. [12] by
including heat transfer coefficient and shear stress measurements. It is also important to note
that the slot locations relative to the vane differ between this study and that of Cardwell et al.
[12], which will be addressed.
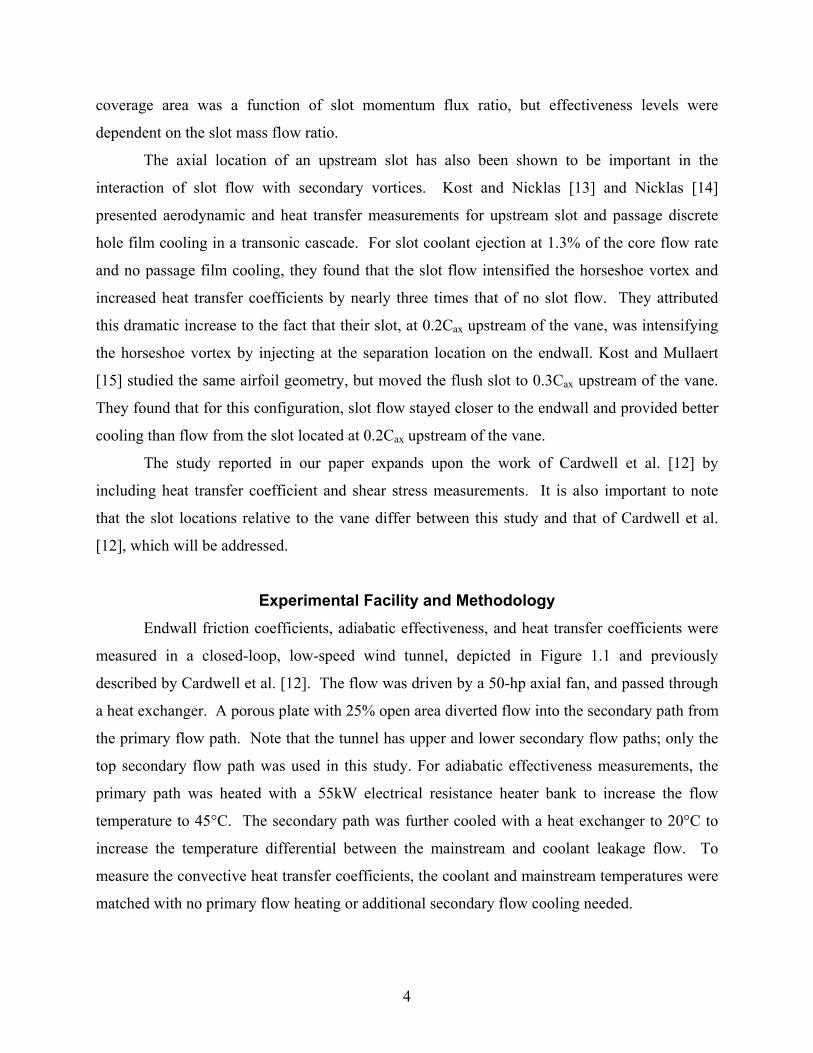
Experimental Facility and Methodology Endwall friction coefficients, adiabatic effectiveness, and heat transfer coefficients were
measured in a closed-loop, low-speed wind tunnel, depicted in Figure 1.1 and previously
described by Cardwell et al. [12]. The flow was driven by a 50-hp axial fan, and passed through
a heat exchanger. A porous plate with 25% open area diverted flow into the secondary path from
the primary flow path. Note that the tunnel has upper and lower secondary flow paths; only the
top secondary flow path was used in this study. For adiabatic effectiveness measurements, the
primary path was heated with a 55kW electrical resistance heater bank to increase the flow
temperature to 45°C. The secondary path was further cooled with a heat exchanger to 20°C to
increase the temperature differential between the mainstream and coolant leakage flow. To
measure the convective heat transfer coefficients, the coolant and mainstream temperatures were
matched with no primary flow heating or additional secondary flow cooling needed.
5
Downstream of the heat exchanger shown in Figure 1.1, the primary flow next passed
through several screens and a contraction section. The contraction, located 2.9 vane chords
upstream of the vane, reduced the flow area from 1.11 m2 to 0.62 m2 through symmetric 45°
bounding walls. The primary flow area remained constant up to the corner test section.
The corner test section contained two full nozzle guide vanes and a third partial vane
connected to a flexible wall to maintain the desired pressure distribution along the center vane.
The vane design was a three-dimensional extrusion of a two-dimensional midspan airfoil
geometry. The vanes were scaled up by a factor of nine to allow for high measurement
resolution. The vanes were manufactured from low-density closed cell polyurethane foam for
low conductivity. A description of the turbine vane parameters is given in Table 1.1.
The boundary layer entering the cascade was measured at a location 0.63C upstream of
the vane stagnation. Table 1.2 lists the turbulent inlet boundary layer parameters, which were
maintained throughout this study. The measured inlet turbulence intensity and length scales
were 0.7% and 4 cm (0.07C), respectively. Although the turbulence intensity is lower than that
typically found in an engine, the effect of turbulence was considered to be of secondary interest
and was not examined in this study.
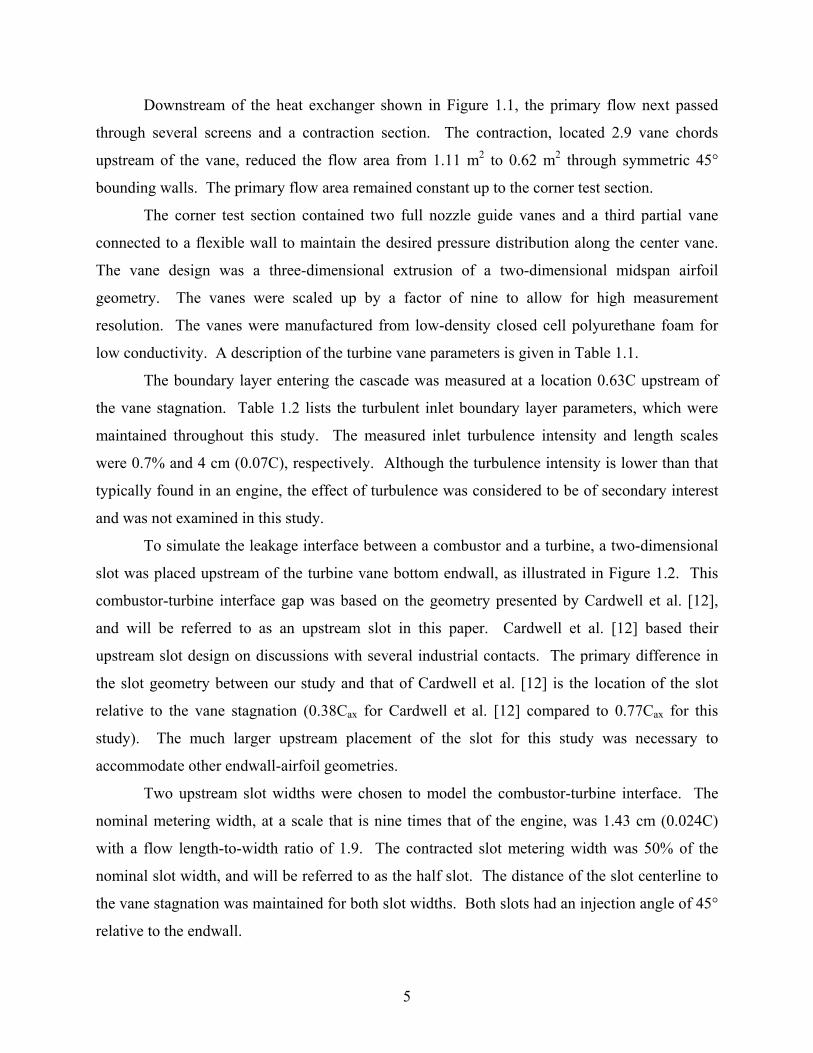
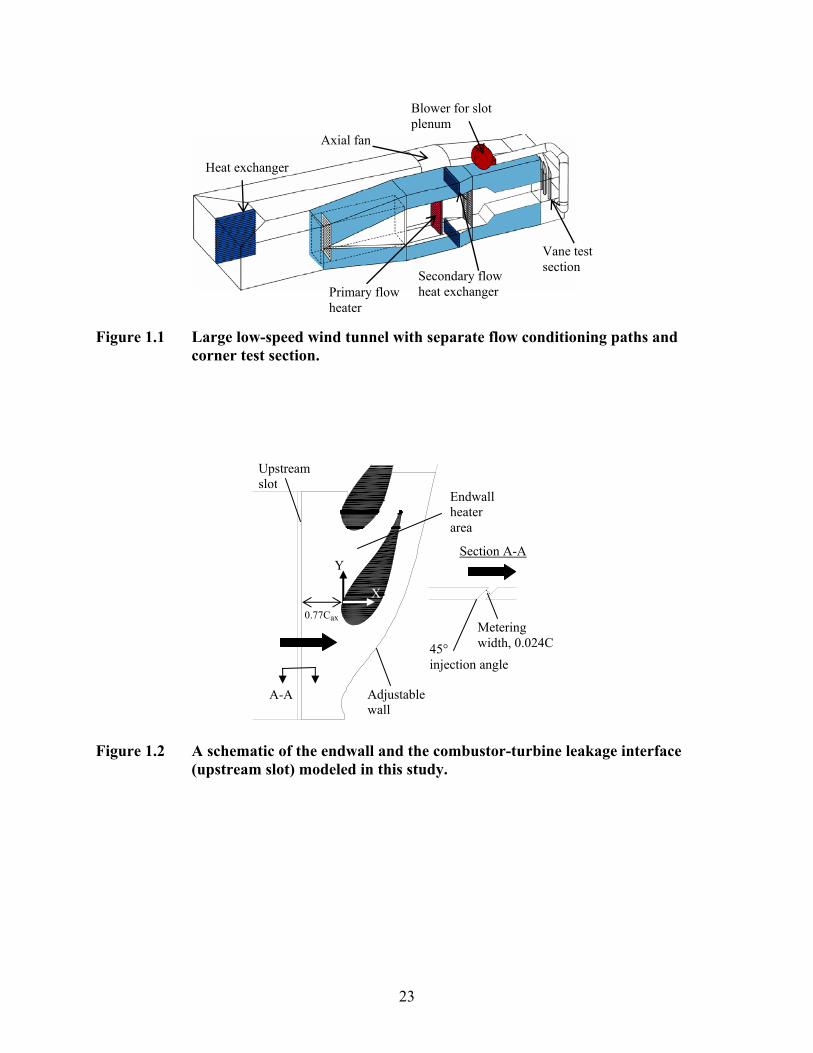
To simulate the leakage interface between a combustor and a turbine, a two-dimensional
slot was placed upstream of the turbine vane bottom endwall, as illustrated in Figure 1.2. This
combustor-turbine interface gap was based on the geometry presented by Cardwell et al. [12],
and will be referred to as an upstream slot in this paper. Cardwell et al. [12] based their
upstream slot design on discussions with several industrial contacts. The primary difference in
the slot geometry between our study and that of Cardwell et al. [12] is the location of the slot
relative to the vane stagnation (0.38Cax for Cardwell et al. [12] compared to 0.77Cax for this
study). The much larger upstream placement of the slot for this study was necessary to
accommodate other endwall-airfoil geometries.
Two upstream slot widths were chosen to model the combustor-turbine interface. The
nominal metering width, at a scale that is nine times that of the engine, was 1.43 cm (0.024C)
with a flow length-to-width ratio of 1.9. The contracted slot metering width was 50% of the
nominal slot width, and will be referred to as the half slot. The distance of the slot centerline to
the vane stagnation was maintained for both slot widths. Both slots had an injection angle of 45°
relative to the endwall.
6
Coolant was extracted from the top secondary channel of the wind tunnel by a 2-hp
blower and fed to a plenum located below the upstream slot. To calculate the average mass flow
exiting the slot, the inviscid blowing ratio from the slot was multiplied by an assumed discharge
coefficient of 0.6, which is the commonly-accepted value for flow from a sharp-edged orifice
[16]. Note that the coolant-to-mainstream density ratio was fixed at 1.1 for all adiabatic cooling
effectiveness measurements. The density ratio in this study is lower than that typically found in
an engine; however, past film cooling research has indicated that jet behavior best scales with
momentum flux ratio. The leakage mass flow ratios and nominal slot metering width for this
study were selected based on input from industrial contacts, so the blowing and momentum flux
ratios are expected to be representative of engine values. For the convective heat transfer
coefficient measurements, the coolant was maintained to within 0.1°C of the mainstream
temperature, resulting in a density ratio of 1.0. Table 1.3 lists the coolant settings investigated
for this paper. Mass flow from the upstream slot is reported as a percentage of the mass flow
entering a single vane passage.
Endwall Friction Coefficient Measurements
Endwall friction coefficient measurements were made using oil film interferometry; see
the review by Naughton and Sheplak [17], and implementation of the method in linear cascades
by Harrison [18] and Holley and Langston [19]. Oil film interferometry (OFI) is based upon the
dynamic behavior of a thin oil film. OFI is similar in concept to oil flow visualization, except
that the oil layer is extremely thin (on the order of visible light wavelengths), and the height of
the oil film is quantified to enable calculation of wall friction coefficients. The equation used in
this study to determine the friction coefficient is:
∫∞= dt
µ2
Uρh2LC
oil
2in,
oilf (1.1)
To derive Eq. (1.1), a mass and momentum balance is performed on a differential control
volume aligned with the endwall (limiting) streamline. The mass balance gives the height of the
oil and its average convective velocity as functions of time and distance along the streamline.
Based on an order-of-magnitude analysis for the oil film, the streamwise momentum can be
simplified by recognizing that the Reynolds number for the oil film is much less than one (thus
the inertial terms are negligible). Then, the momentum equation can be solved for the oil
velocity (retaining the pressure gradient, gravity, and shear terms) by applying no-slip boundary
7
conditions at the wall-oil interface, and the desired shear at the air-oil interface. Combining the
momentum and mass balance results yields the thin oil-film equation:
0gρsP
µ3h
µ2hτ
sth
soiloil
3oil
oil
2oils,woil =
−
∂∂
−∂∂
+∂
∂ (1.2)
For representative values pertinent to this study (hoil=1 µm, νoil=100 cSt, τw,s=10 Pa,
ρoil=1000 kg/m3, dP/ds=100 Pa/m, gs=10 m/s2), order-of-magnitude analysis on the terms in the
parentheses of Eq. (1.2) shows that the shear stress term is at least two orders of magnitude
larger than the other terms, which are then neglected. For spatially constant shear stress over the
region of interest (reasonable assumptions in this study because of the large scale and small
measurement sizes), the reduced oil film equation can be solved by separation of variables for
the height of the oil in terms of the shear stress, distance along the streamline, and time. Note
that the shear stress is non-dimensionalized by the inlet dynamic pressure before performing
separation of variables, so that the dynamic pressure appears in the integral in Eq. (1.1). The
solution requires measurement of the oil height only at the end of the wind tunnel run, since the
conditions leading to the final oil film thickness are integrated over time.
Fizeau interferometry provides a means of measuring the height of the oil. Light strikes
the surface of the oil film and is reflected and refracted. The phase difference (φ) between the
initially reflected and refracted rays will attenuate or augment the rays, creating interference
bands (fringes). The phase difference is related to the height of the oil by the wavelength of the
light rays, the optical properties of air and oil, and the incident light angle:
−=
i22
air2oil
oilθsinnn
1π4λφh (1.3)
The phase difference between successive fringes is an integer multiple of 2π. The
average spacing between successive fringes (L) is determined by a least-squares cosine fit to the
pixel intensity profile of the fringe pattern [19] to determine the period of the intensity profile.
The location of the friction coefficient measurement in the interferogram is taken as the center of
the intensity profile.
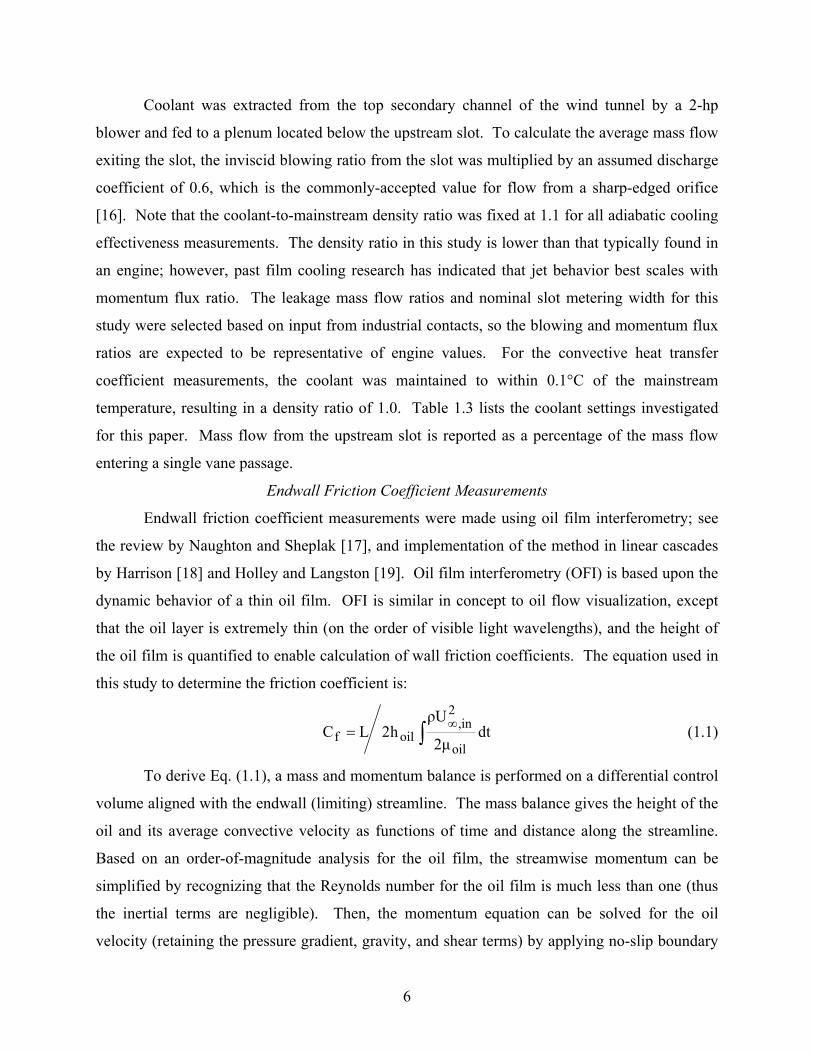
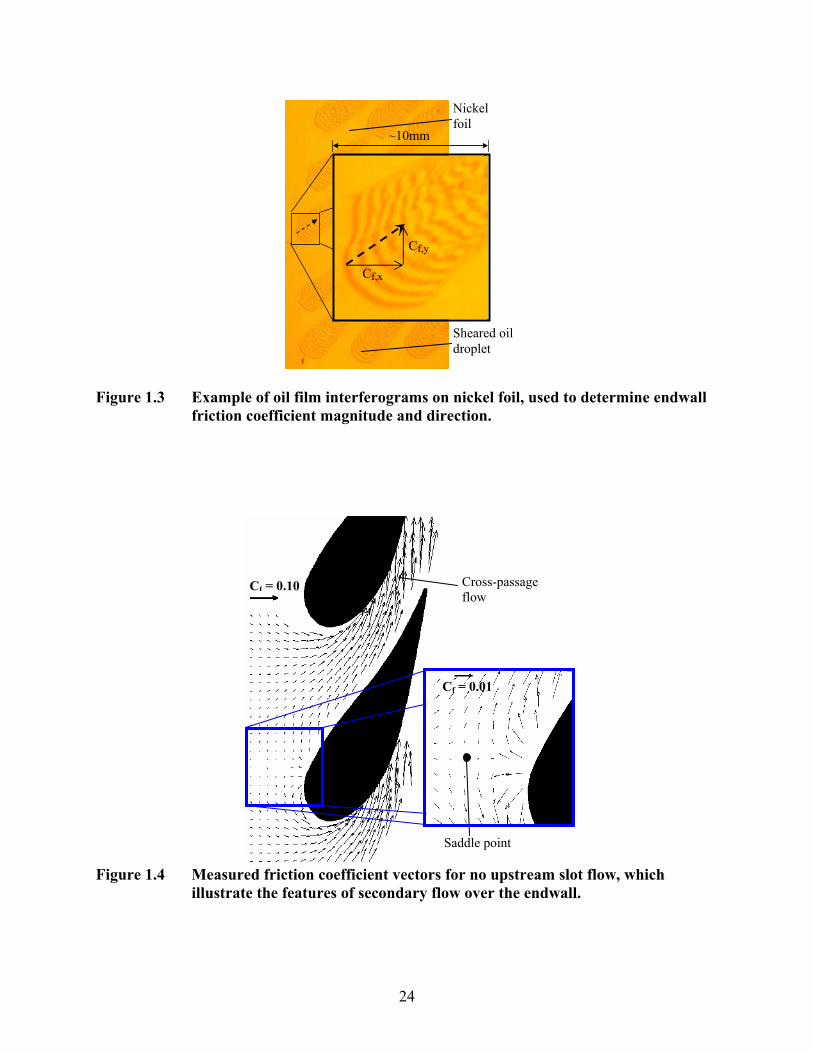
To measure endwall friction coefficients in the cascade, small silicone oil droplets,
nominally less than 5 mm in diameter, were placed on 0.05 mm thick rectangular sheets of nickel
foil that had been adhered to the endwall (see Figure 1.3). For the entire endwall, three
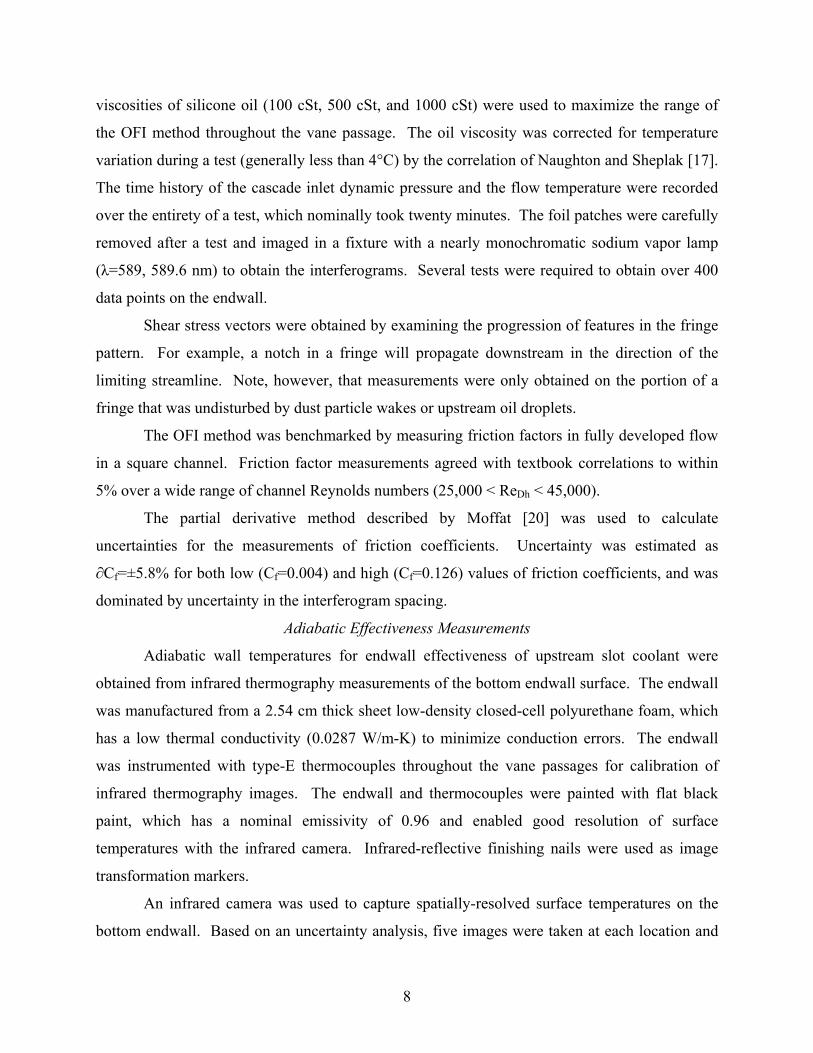
8
viscosities of silicone oil (100 cSt, 500 cSt, and 1000 cSt) were used to maximize the range of
the OFI method throughout the vane passage. The oil viscosity was corrected for temperature
variation during a test (generally less than 4°C) by the correlation of Naughton and Sheplak [17].
The time history of the cascade inlet dynamic pressure and the flow temperature were recorded
over the entirety of a test, which nominally took twenty minutes. The foil patches were carefully
removed after a test and imaged in a fixture with a nearly monochromatic sodium vapor lamp
(λ=589, 589.6 nm) to obtain the interferograms. Several tests were required to obtain over 400
data points on the endwall.
Shear stress vectors were obtained by examining the progression of features in the fringe
pattern. For example, a notch in a fringe will propagate downstream in the direction of the
limiting streamline. Note, however, that measurements were only obtained on the portion of a
fringe that was undisturbed by dust particle wakes or upstream oil droplets.
The OFI method was benchmarked by measuring friction factors in fully developed flow
in a square channel. Friction factor measurements agreed with textbook correlations to within
5% over a wide range of channel Reynolds numbers (25,000 < ReDh < 45,000).
The partial derivative method described by Moffat [20] was used to calculate
uncertainties for the measurements of friction coefficients. Uncertainty was estimated as
∂Cf=±5.8% for both low (Cf=0.004) and high (Cf=0.126) values of friction coefficients, and was
dominated by uncertainty in the interferogram spacing.
Adiabatic Effectiveness Measurements
Adiabatic wall temperatures for endwall effectiveness of upstream slot coolant were
obtained from infrared thermography measurements of the bottom endwall surface. The endwall
was manufactured from a 2.54 cm thick sheet low-density closed-cell polyurethane foam, which
has a low thermal conductivity (0.0287 W/m-K) to minimize conduction errors. The endwall
was instrumented with type-E thermocouples throughout the vane passages for calibration of
infrared thermography images. The endwall and thermocouples were painted with flat black
paint, which has a nominal emissivity of 0.96 and enabled good resolution of surface
temperatures with the infrared camera. Infrared-reflective finishing nails were used as image
transformation markers.
An infrared camera was used to capture spatially-resolved surface temperatures on the
bottom endwall. Based on an uncertainty analysis, five images were taken at each location and
9
averaged, where each image is also an average of 16 frames taken by the camera. The camera’s
spatial integration was approximately 0.17 mm (0.0012C). Images were post-calibrated by
determining the emissivity and background temperature of the image through matching of the
image temperatures with the acquired thermocouple measurements. The thermocouples and the
calibrated images generally agreed to within 0.3°C. An in-house MATLAB routine was
developed to assemble the individual images into a single endwall map.
A one-dimensional correction for endwall conduction effects was applied to all adiabatic
effectiveness measurements. The resulting η correction was 0.14 at η=0.75 measured
downstream of the slot, and 0.05 for η=0.07 measured at the exit of the vane passage.
The partial derivative method was used to calculate uncertainties for the measurements of
adiabatic cooling effectiveness. For adiabatic surface temperatures, a precision uncertainty of
±0.33°C was determined by taking the standard deviation of six measurement sets of IR camera
images, with each set consisting of five images. Since the IR images were calibrated as closely
as possible to the thermocouples in each image, the bias uncertainty for an image was assumed to
be the root-sum-square of the thermocouple bias uncertainty (±0.2°C) and the average deviation
of the calibrated images from the thermocouples (±0.34°C). In this way, a bias uncertainty of
±0.39°C was determined. Using the bias and precision uncertainties, a total uncertainty of
±0.51°C was estimated for the IR surface temperature measurements. Overall uncertainty in
adiabatic effectiveness was calculated to be ∂η=±0.036 at a η value of 0.1, and ∂η=±0.026 at a η
value of 0.8.
Heat Transfer Measurements
Endwall heat transfer measurements were taken by imaging surface temperatures on a
constant heat flux plate attached to a 2.54 cm thick sheet of the closed-cell polyurethane foam.
The heat flux plate consisted of a 37 µm copper layer on top of a 75 µm thick kapton layer, in
which 25 µm inconel elements were embedded in a serpentine pattern. The heater covered the
entire endwall, from immediately downstream of the slot to 0.3C downstream of the vane trailing
edge, as shown in Figure 1.2. E-type thermocouples, embedded in the foam endwall, were
placed in thermal contact with the bottom surface of the heater by thermal cement. A conduction
bias between the bottom-mounted thermocouple and the infrared top-surface measurement was
accounted for by a one-dimensional calculation of the thermal resistance of the heater. The
infrared camera was also used to capture surface temperatures on the heat flux plate.
10
The input heat flux to the endwall was calculated by measuring the voltage across the
heater circuit, as well as the voltage across a precision resistor (1Ω) in series with the circuit,
which gave the current. This flux was corrected for conduction and radiation losses, which
accounted for a maximum of 0.2% and 21% of the input power, respectively. Note that the
conduction and radiation corrections varied locally with the highest correction occurring at the
highest surface temperatures. Uncertainty in Stanton numbers was dominated by the uncertainty
in surface temperature measurements. For those measurements, a precision uncertainty of
±0.22°C was estimated from the standard deviation of six IR image measurement sets, and a bias
uncertainty of ±0.88°C was determined in the same way as for the adiabatic effectiveness
measurements. Overall uncertainty in Stanton numbers was ∂St=±0.00011 (3.3%) at a St value
of 0.003, and ∂St=±0.0009 (7.5%) at a St value of 0.011.
Discussion of Results
Endwall friction coefficient measurements without any upstream slot flow over the
endwall will be presented first, followed by adiabatic cooling effectiveness results with upstream
slot flow. Heat transfer coefficient measurements with and without upstream slot flow are then
discussed. Finally, the net heat flux reduction parameter, which incorporates both heat transfer
coefficients and adiabatic cooling effectiveness, is presented.
Friction Coefficients without an Upstream Slot
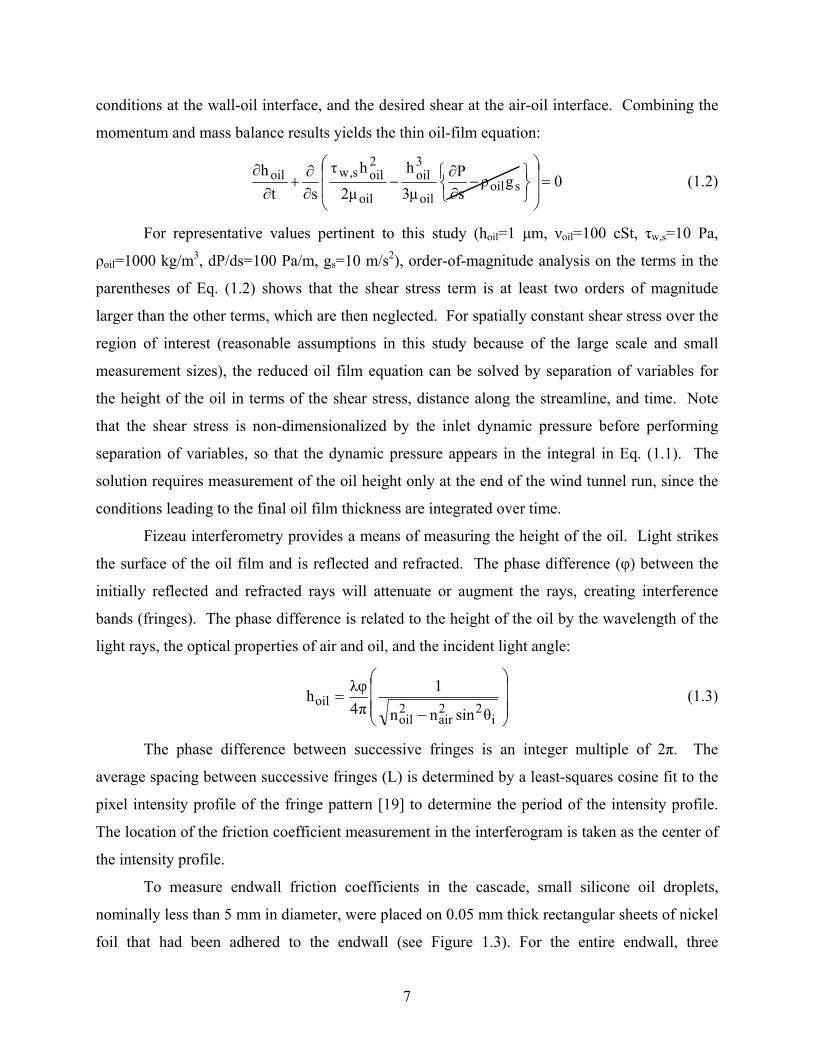
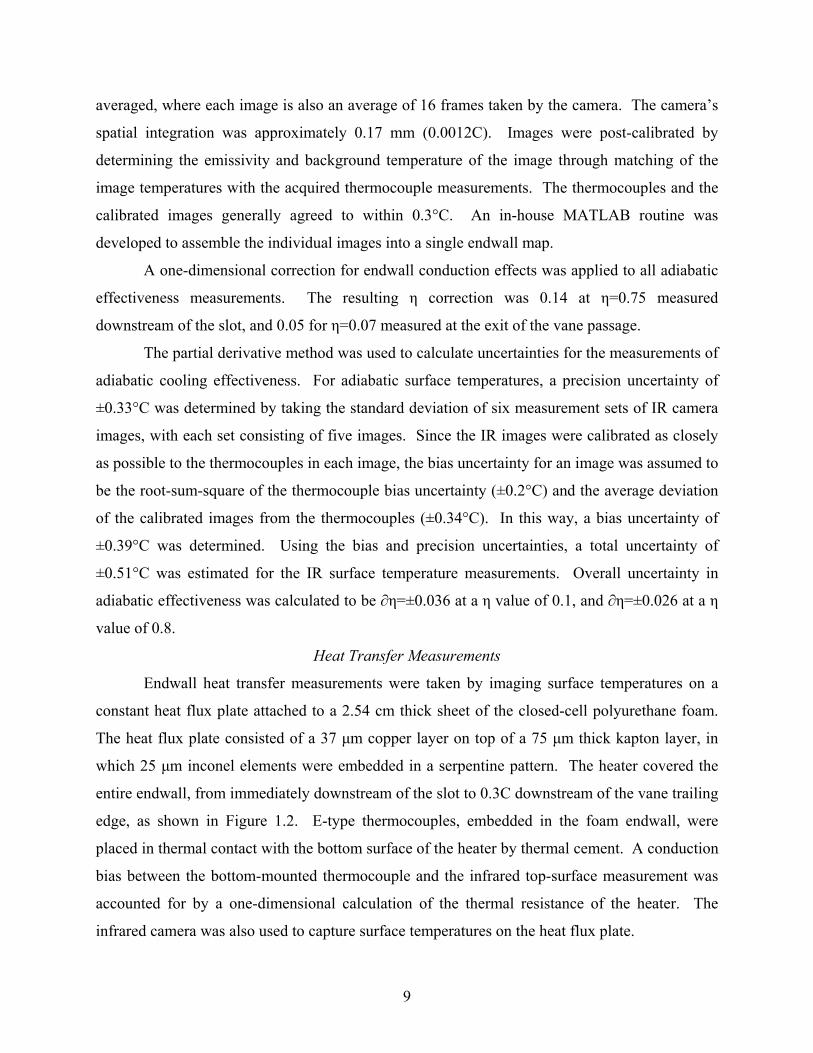
Oil film interferometry (OFI) measurements of endwall friction coefficients were linearly
interpolated to a uniform grid, and then downsampled to create the vector plot in Figure 1.4.
Several unique features due to secondary flow are visible in the vector field. Shear decreases as
flow approaches the vane leading edge and begins to stagnate. A saddle point is also visible
upstream of the vane, where flow diverges around the leading edge. The saddle point is the
intersection of flow attachment and separation lines on the endwall. At the separation line, the
incoming boundary layer separates from the endwall and rolls up into the horseshoe vortex. The
vortex roll-up causes flow to wash down the airfoil toward the endwall and then move upstream,
away from the airfoil-endwall junction.
Further in the passage, cross-passage flow from the passage vortex sweeps from the
pressure side of the lower airfoil to the suction side on the adjacent airfoil. Because of this, the
exit turning angle of the airflow near the endwall is much larger than the exit turning angle of
11
inviscid flow away from the wall. The measured friction coefficient magnitudes near the
passage throat have increased relative to the inlet values, resulting from the flow acceleration in
the vane passage.
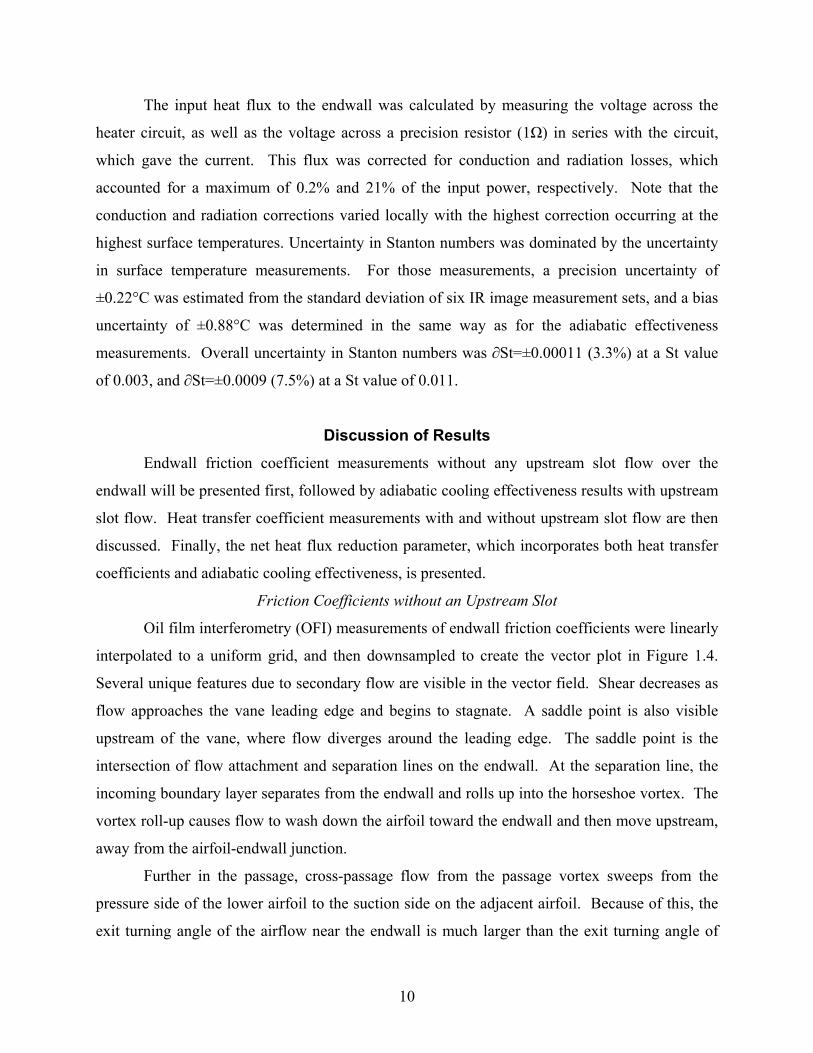
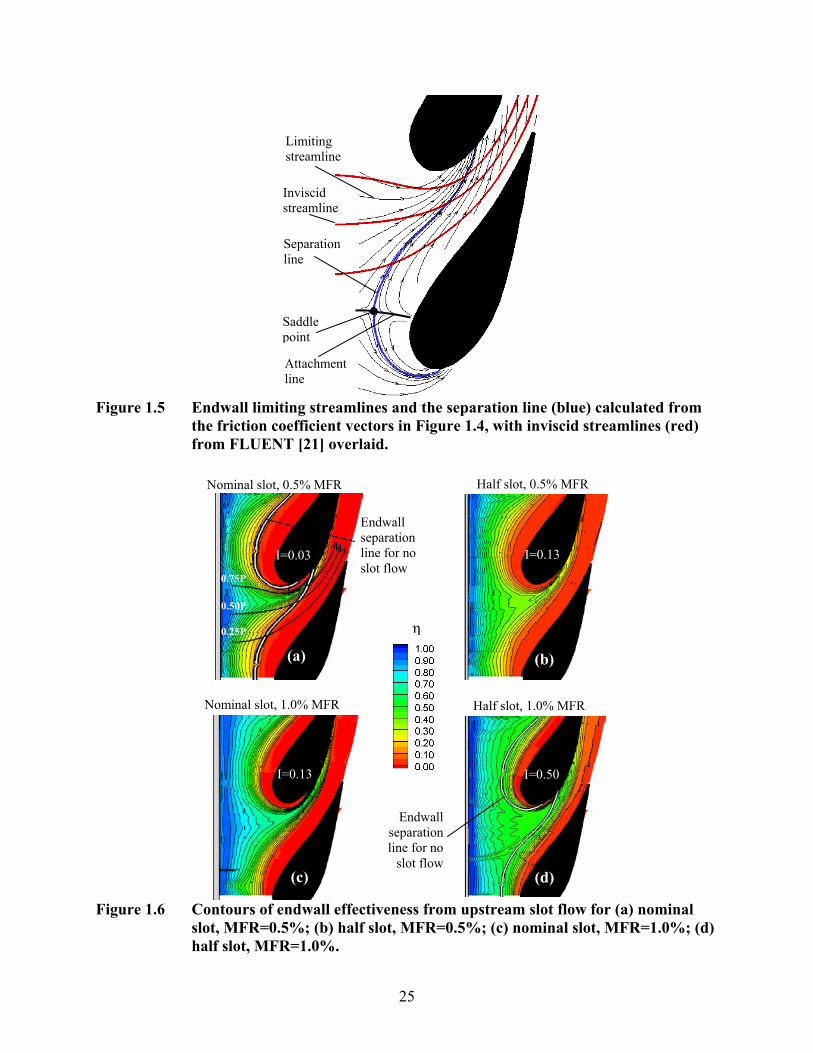
Figure 1.5 shows a prediction of inviscid streamlines near the mid-span of the vane using
FLUENT 6.2 [21], which are superimposed upon the endwall streamlines computed from the
friction coefficient measurements. The endwall streamlines are representative of the flow
streamlines in the limit as the wall is approached, and thus are also known as limiting
streamlines. Figure 1.5 shows the endwall separation line also computed from the endwall
friction coefficient vector measurements. The separation line was obtained by computing
multiple streamline paths starting very near to the saddle point, and taking the mean of the paths.
Note that since the saddle point is a location of zero shear stress, its exact location could not be
found since the OFI method requires some detectable amount of oil flow.
Adiabatic Effectiveness Levels from an Upstream Slot
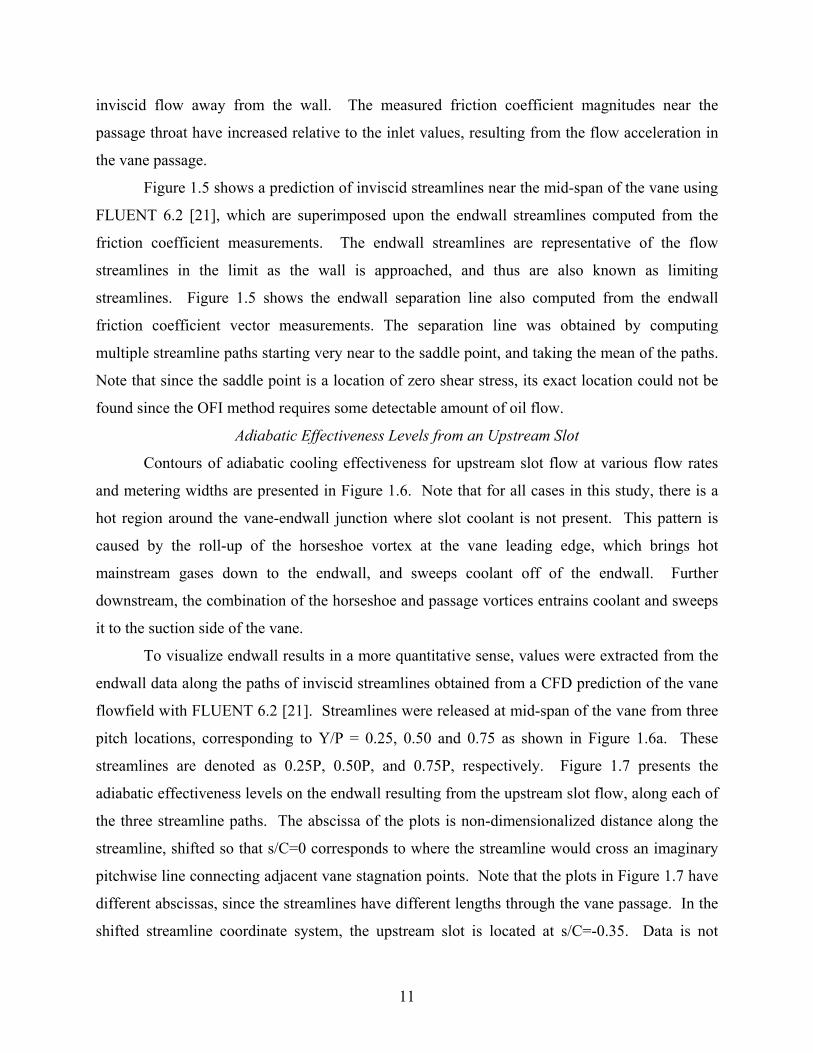
Contours of adiabatic cooling effectiveness for upstream slot flow at various flow rates
and metering widths are presented in Figure 1.6. Note that for all cases in this study, there is a
hot region around the vane-endwall junction where slot coolant is not present. This pattern is
caused by the roll-up of the horseshoe vortex at the vane leading edge, which brings hot
mainstream gases down to the endwall, and sweeps coolant off of the endwall. Further
downstream, the combination of the horseshoe and passage vortices entrains coolant and sweeps
it to the suction side of the vane.
To visualize endwall results in a more quantitative sense, values were extracted from the
endwall data along the paths of inviscid streamlines obtained from a CFD prediction of the vane
flowfield with FLUENT 6.2 [21]. Streamlines were released at mid-span of the vane from three
pitch locations, corresponding to Y/P = 0.25, 0.50 and 0.75 as shown in Figure 1.6a. These
streamlines are denoted as 0.25P, 0.50P, and 0.75P, respectively. Figure 1.7 presents the
adiabatic effectiveness levels on the endwall resulting from the upstream slot flow, along each of
the three streamline paths. The abscissa of the plots is non-dimensionalized distance along the
streamline, shifted so that s/C=0 corresponds to where the streamline would cross an imaginary
pitchwise line connecting adjacent vane stagnation points. Note that the plots in Figure 1.7 have
different abscissas, since the streamlines have different lengths through the vane passage. In the
shifted streamline coordinate system, the upstream slot is located at s/C=-0.35. Data is not
12
plotted directly downstream of the slot, but rather starting at s/C=-0.3, in order to avoid the high
measurement uncertainty at the start of the thermal boundary layer in the heat transfer coefficient
measurements.
In Figure 1.7, effectiveness values eventually become zero as each streamline path
crosses into the hot region. Note that in most cases, the path of the 0.75P streamline crosses the
hot ring region around the suction side of the vane, passes through the narrow band of coolant
being swept to the suction side by the passage vortex, and re-enters the pressure side hot region
(refer to Figure 1.6a). These crossings explain why effectiveness along the 0.75P path decays,
increases, and then progressively decays.
As described earlier, the slot in this study was positioned at 0.77Cax upstream of the vane
stagnation. A slot located far upstream, away from the influence of the vane, can reduce or
eliminate the potential for hot gas path ingestion into the slot, but from a practical point of view
may be difficult to implement in an engine. The effect of moving the slot upstream is shown in
Figure 1.8. A similar lack of coolant coverage around the base of the vane is seen between this
study’s results and those of Knost and Thole [10], for 1% slot flow from a nominal slot. The
horseshoe and passage vortices control the distribution of coolant in the passage, despite the
differences in slot location. Note that the upstream slot for the case in Figure 1.8 had the same
geometry as the slot tested by Knost and Thole [10], but Knost and Thole positioned their slot at
0.38Cax from the vane leading edge. In the contours of Figure 1.8, and along the inviscid
streamline paths in Figure 1.7, Knost and Thole’s [10] slot blowing at 1.0% MFR exhibits higher
local effectiveness than the nominal slot blowing at 1.0% MFR. Coolant ejected farther upstream
interacts more with the mainstream and thus is less effective when it reaches the vane passage.
However, the slot in Knost and Thole’s [10] study also results in more poorly distributed
effectiveness levels across the endwall than for a slot ejecting farther upstream (see Figure 1.8).
High effectiveness gradients would be a durability concern since they could lead to large
gradients in endwall metal temperature and increased thermal stresses.
The effect of increasing the coolant flow rate can be seen by comparing the contours in
Figures 1.6a and 1.6c for the nominal slot at two coolant flow rates, as well as in Figures 1.6b
and 1.6d for the half slot at two coolant flow rates. For a given upstream slot width, effectiveness
levels from upstream slot coolant over the endwall increase with increasing slot mass flow rates.
Also, coolant coverage is more uniform downstream of the slot and is better able to penetrate
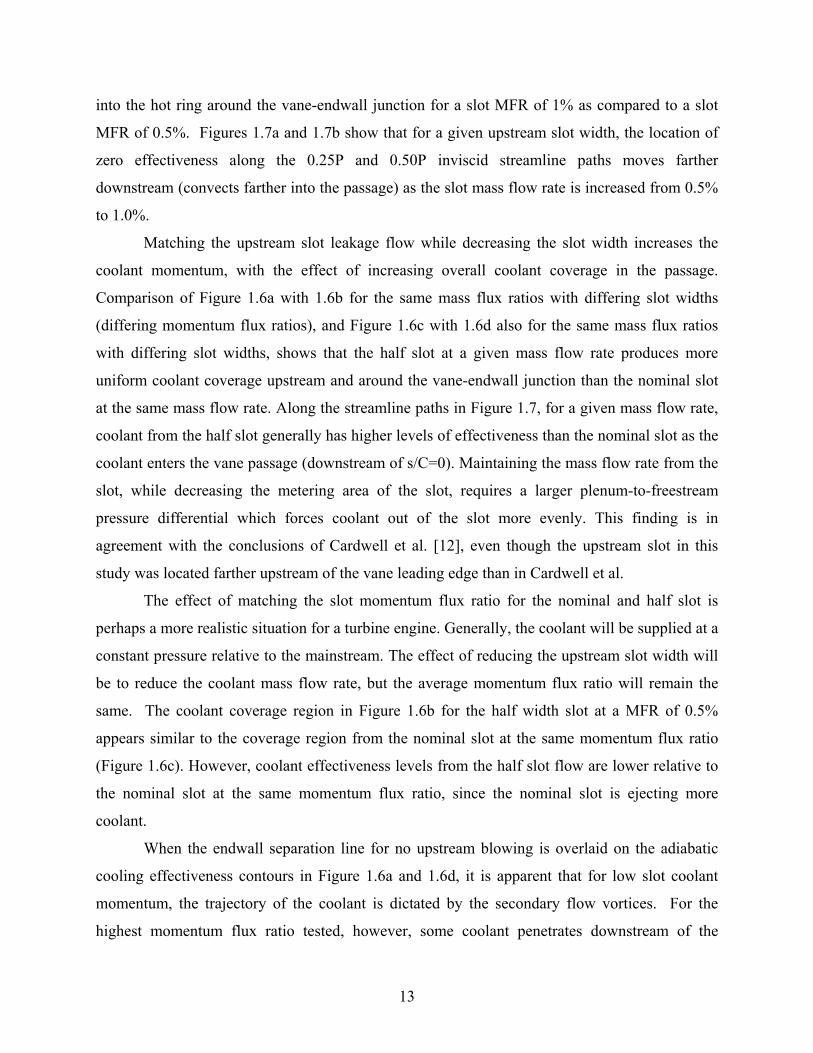
13
into the hot ring around the vane-endwall junction for a slot MFR of 1% as compared to a slot
MFR of 0.5%. Figures 1.7a and 1.7b show that for a given upstream slot width, the location of
zero effectiveness along the 0.25P and 0.50P inviscid streamline paths moves farther
downstream (convects farther into the passage) as the slot mass flow rate is increased from 0.5%
to 1.0%.
Matching the upstream slot leakage flow while decreasing the slot width increases the
coolant momentum, with the effect of increasing overall coolant coverage in the passage.
Comparison of Figure 1.6a with 1.6b for the same mass flux ratios with differing slot widths
(differing momentum flux ratios), and Figure 1.6c with 1.6d also for the same mass flux ratios
with differing slot widths, shows that the half slot at a given mass flow rate produces more
uniform coolant coverage upstream and around the vane-endwall junction than the nominal slot
at the same mass flow rate. Along the streamline paths in Figure 1.7, for a given mass flow rate,
coolant from the half slot generally has higher levels of effectiveness than the nominal slot as the
coolant enters the vane passage (downstream of s/C=0). Maintaining the mass flow rate from the
slot, while decreasing the metering area of the slot, requires a larger plenum-to-freestream
pressure differential which forces coolant out of the slot more evenly. This finding is in
agreement with the conclusions of Cardwell et al. [12], even though the upstream slot in this
study was located farther upstream of the vane leading edge than in Cardwell et al.
The effect of matching the slot momentum flux ratio for the nominal and half slot is
perhaps a more realistic situation for a turbine engine. Generally, the coolant will be supplied at a
constant pressure relative to the mainstream. The effect of reducing the upstream slot width will
be to reduce the coolant mass flow rate, but the average momentum flux ratio will remain the
same. The coolant coverage region in Figure 1.6b for the half width slot at a MFR of 0.5%
appears similar to the coverage region from the nominal slot at the same momentum flux ratio
(Figure 1.6c). However, coolant effectiveness levels from the half slot flow are lower relative to
the nominal slot at the same momentum flux ratio, since the nominal slot is ejecting more
coolant.
When the endwall separation line for no upstream blowing is overlaid on the adiabatic
cooling effectiveness contours in Figure 1.6a and 1.6d, it is apparent that for low slot coolant
momentum, the trajectory of the coolant is dictated by the secondary flow vortices. For the
highest momentum flux ratio tested, however, some coolant penetrates downstream of the
14
separation line, indicating that the coolant has a more significant interaction with endwall
secondary flow in this case.
Heat Transfer Coefficients for an Upstream Slot
Endwall heat transfer coefficients were measured with and without an upstream slot flow.
For the baseline with no slot flow, a qualitative comparison was made to Kang et al. [5], who
used the same airfoil geometry. Similar results were achieved, as can be seen in Figures 1.9a and
1.9b for both baselines with no slot flow, despite differences in the upstream tunnel geometry
and inlet boundary layer thicknesses (δ/S = 0.09 for Kang et al. [5] and δ/S = 0.18 for our work).
High heat transfer coefficients are seen in Figures 1.9a and 1.9b near the vane stagnation region
resulting from the horseshoe vortex. The effects of the passage vortex are seen further
downstream as the contours sweep to the suction surface.
Figures 1.9b through 1.9f compare heat transfer coefficients with and without upstream
slot flow for the various slot widths and flow rates. The overall effect of injection along the
endwall is that the heat transfer coefficients are slightly increased in the cases with injection,
relative to the baseline without injection. Figure 1.10 shows endwall heat transfer augmentation
levels relative to the no leakage flow case along the 0.25P, 0.50P, and 0.75P streamline paths.
Note that overall, augmentation levels with upstream slot blowing indicate higher heat transfer
throughout most of the passage.
The effect of increasing the slot mass flow rate, while maintaining the slot width, is
illustrated for the nominal slot in Figures 1.9c and 1.9e and for the half slot in Figures 1.9d and
1.9f. Stanton numbers increase slightly throughout the passage when the slot mass flow rate is
increased from 0.5% to 1.0% for a given slot width. Heat transfer augmentation levels along the
inviscid streamline paths (Figure 1.10) are generally higher as the mass flow rate increases
through a given slot width. An exception to this trend, however, is the region around s/C=-0.05
on the 0.25P streamline path (Figure 1.10a) and the region around s/C=0.10 on the 0.50P
streamline path (Figure 1.10b). At these locations, there is no difference in heat transfer
augmentation for the nominal slot injecting coolant at either mass flow rate. It was noted that the
0.25P streamline path crosses the separation line for no upstream slot blowing at s/C=-0.07,
while the 0.50P streamline path crosses the separation line at s/C=0.11 (refer to Figure 1.9c).
These results indicate that the separated flow dictates the heat transfer augmentation near the
endwall separation line, rather than the injection itself. However, for the half slot, increasing its

15
mass flow from 0.5% to 1.0% increases the coolant momentum to the point that the injection
begins to interfere with the horseshoe vortex.
As mentioned earlier, for a turbine engine, a decrease in upstream slot width would result
in a decrease in slot mass flow rate, but nominally the same momentum flux ratio. The effect of
decreasing the slot width while maintaining the same momentum flux is seen by comparing the
contours of Figures 1.9d and 1.9e. Stanton numbers are slightly lower for the half slot at a MFR
of 0.5%, compared to the nominal slot at a MFR of 1.0%, even though both have the same
momentum flux.
The endwall separation line, deduced from the measured friction coefficients with no
upstream slot blowing, is overlaid on the heat transfer coefficient results for no upstream slot
blowing (Figure 1.9b), and for blowing at the lowest and highest momentum flux ratios in
Figures 1.9c and 1.9f, respectively. There is a region of low heat transfer between the vanes near
the passage entrance that persists farther downstream for the case with the highest momentum
flux ratio (Figure 1.9f) relative to the lowest momentum flux ratio (Figure 1.9c). These
behaviors suggest that the upstream slot injection at a high momentum flux ratio reduces
horseshoe vortex strength.
Net Heat Flux Reduction for an Upstream Slot
The determination of convective heat transfer to a turbine endwall with film-cooling
requires knowledge of the film heat transfer coefficient, the metal wall temperature, and the
adiabatic wall (recovery) temperature. The addition of coolant to the endwall reduces the
adiabatic wall temperature and thus the driving potential for heat transfer. The mixing and flow
disturbance induced by the coolant injection, however, generally increases the convective heat
transfer coefficients. The net heat flux reduction parameter (NHFR) incorporates the effects of
convective heat transfer coefficients and coolant effectiveness on the overall augmentation to the
heat load to the component. To deduce the net heat flux reduction parameter, the component
wall metal temperature must also be known, since it is the other driving temperature for heat
transfer into the part. The non-dimensional form (denoted as φ) relates the wall temperature to
the freestream and coolant temperatures. Since the wall temperature is dependent on the vane
metal conductivity and internal cooling scheme, it had to be assumed for this study, which used
adiabatic materials for the endwall. A value of φ = 1.6 was assumed based on typical film-
16
cooled engine conditions (Sen et al. [22]). Note that values of NHFR < 0 indicate that the film
cooling scheme is causing an increase in the overall heat flux experienced by the surface.
Figure 1.11 presents the NHFR calculated along each of the inviscid streamline paths.
For the cases that have been studied, it is clear that there is a strong benefit of the leakage coolant
at the entrance to the vane passage. Downstream, however, the cooling benefit of the leakage
flow produces a detrimental effect where no coolant is present but the heat transfer coefficients
have been increased. This increase is caused by alterations to the secondary flows that in turn
increase the overall convective heat transfer coefficients. The 0.25P and 0.50P streamline paths,
shown in Figures 1.11a and 1.11b, respectively, indicate that the addition of upstream slot flow
at any mass flow rate or slot width causes NHFR values that are less than zero near the exit of
the vane passage. The lack of coolant penetration into the hot ring around the vane, combined
with slight heat transfer coefficient augmentations from slot flow, leads to an increased net heat
flux that would be experienced by the part.
It is apparent that the trends of NHFR along the streamline paths in Figure 1.11 parallel
the trends of the effectiveness levels, and many of the same conclusions about the effects of slot
flow can be made. Although increasing the slot flow rate tends to increase heat transfer
coefficients, the additional coolant from a given slot width at 1.0% MFR relative to 0.5% MFR
results in a net heat flux reduction. Also, the better coolant coverage from a half-width slot at a
given mass flow rate reduces net heat flux, as compared to the nominal slot at the same mass
flow rate. Finally, the case of matched momentum flux ratios for the nominal and half slots
shows that, despite reduced Stanton number augmentations from the half slot blowing versus the
nominal slot blowing, the lower amount of coolant ejected from the half slot at a MFR of 0.5% is
not as effective in reducing heat flux into the endwall as is the coolant from the nominal slot at a
MFR of 1.0%.
An overall, area-averaged NHFR is shown in Figure 1.12 as a function of slot momentum
flux ratio. Coolant ejection from the half slot does a better job in decreasing average heat flux
into the endwall than coolant from the nominal slot, when both are ejecting coolant at a given
mass flow ratio. However, blowing from the half slot at a momentum flux ratio of 0.13
(MFR=0.5%) increases the average net heat flux (decreases NHFR parameter) by 26%,
compared to the nominal slot blowing at the same momentum flux ratio (I=0.13, MFR=1.0%).
17
Thus, axial contraction of the upstream slot, in a situation where the slot momentum flux is
maintained, would increase endwall heat transfer.
Conclusions Measurements of adiabatic cooling effectiveness and heat transfer coefficients on the
endwall, from leakage flow through a two-dimensional upstream slot representing a combustor-
turbine interface gap, were presented. Two slot flow rates and two slot widths were tested, to
determine the effect of the contraction of the slot on the endwall heat transfer.
The dominance of the endwall secondary flow on upstream slot coolant coverage was
demonstrated by moving the slot further upstream. The coverage area of the slot coolant, when
the slot was located 0.77Cax upstream of the vane, was similar to the coverage area for a slot
located 0.38Cax upstream. It was noted, however, that effectiveness levels in the passage were
lower for the slot placed farther upstream since the coolant had more distance to interact with the
mainstream flow.
For a fixed slot width, increasing the slot mass flow resulted in slightly increased heat
transfer coefficients, but also higher adiabatic cooling effectiveness levels. Coolant exited the
slot more uniformly at the higher slot flow rates, since the higher flow rate required an increase
in slot pressure ratio. Overall, the net heat flux to the endwall was reduced, since more coolant
was present at the higher flow rates.
Decreasing the slot width while maintaining a constant slot mass flow resulted in larger
coolant coverage areas and increased local effectiveness levels. Moreover, heat transfer
coefficient augmentations from the half width slot were lower than augmentations from the
nominal slot. Area-averaged values of the net heat flux reduction parameter indicated that the
coolant from the half slot width reduced the net heat flux to the endwall compared to the nominal
slot, when both were ejecting coolant at the same mass flow rate. The higher momentum of slot
coolant from the half width slot enabled it to penetrate farther into the passage.
Overlaying the endwall separation line for no blowing on contours of effectiveness and
heat transfer coefficients revealed that for low slot momentum, the endwall secondary flow
dictated the coolant trajectory in the passage. At the highest momentum flux ratio tested, a
significant amount of coolant penetrated downstream of the endwall separation line, and heat

18
transfer coefficients were reduced compared to the low momentum slot flow. The high coolant
momentum in this case is suspected to have reduced the horseshoe vortex strength.
These results indicate that leakage flow through the combustor-turbine interface can
provide cooling to the endwall, with a more uniform distribution of coolant when the interface is
placed farther upstream. More uniform coverage reduces the spatial temperature variation in the
turbine endwall metal, which is beneficial for durability. The effects of thermal expansion of the
interface, however, need to be carefully considered since higher heat loads can result when the
combustor-turbine interface gap contracts. Understanding how a leakage interface expansion
impacts the heat transfer and cooling effectiveness of the leakage flow may help a designer to
protect the part during unwanted thermal expansion incidents with the least amount of coolant.
Acknowledgments The authors would like to thank the National Science Foundation’s GOALI program for
funding this research (Grant No. 0412971). We would also like to acknowledge our partners in
the GOALI program: Joel Wagner and Peter Tay (Pratt & Whitney), and Dr. Lee Langston and
Brian Holley (University of Connecticut).
Nomenclature C true chord of stator vane Cax axial chord of stator vane Cf friction coefficient, see Eq. (1.1) Cp heat capacity at constant pressure g gravitational acceleration (9.81 m/s2) h heat transfer coefficient hoil height of oil film I average momentum flux ratio, 2
in,∞∞2cc UρUρI =
L spacing between oil film interferogram bands (fringes) M average blowing ratio, in,cc UρUρM ∞∞= MFR mass flow ratio, inc m/mMFR &&= n index of refraction NHFR net heat flux reduction, ( )( )ηφ1hh1NHFR 0f −−=
NHFR area-averaged net heat flux reduction P pitch of stator vane, or pressure ReDh Reynolds number based on hydraulic diameter Rein inlet Reynolds number, νCURe in,in ∞=
19
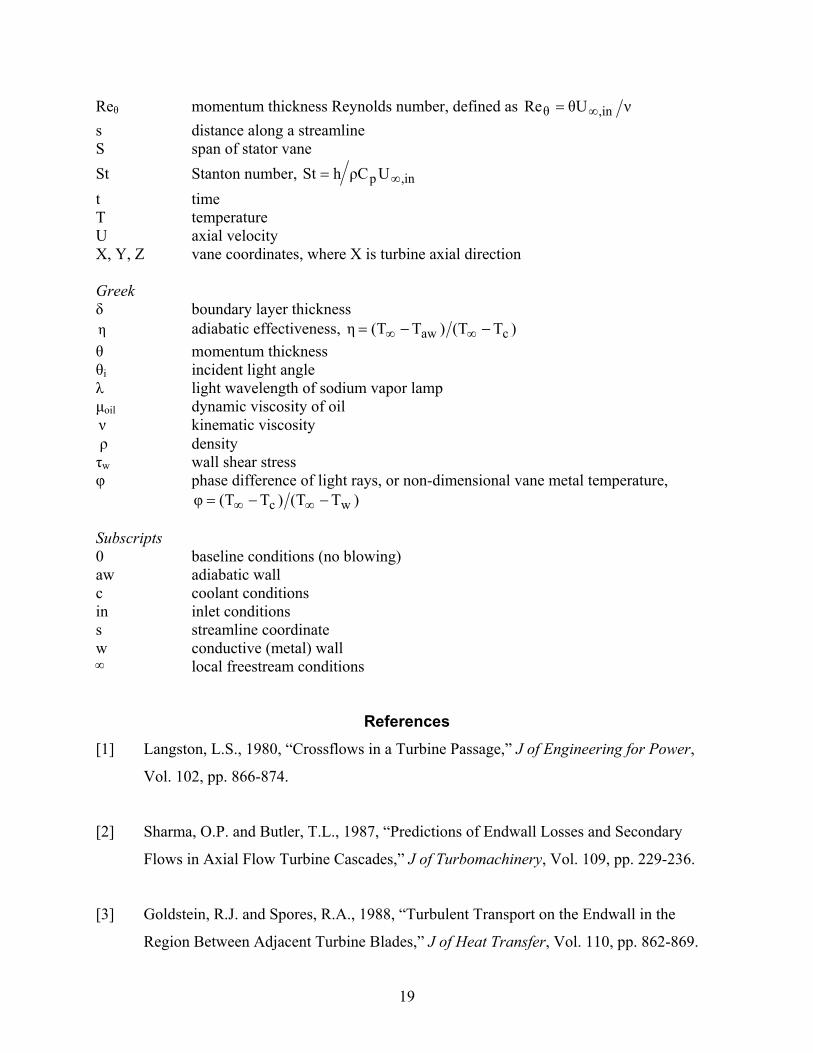
Reθ momentum thickness Reynolds number, defined as νUθRe in,θ ∞= s distance along a streamline S span of stator vane St Stanton number, in,p UCρhtS ∞= t time T temperature U axial velocity X, Y, Z vane coordinates, where X is turbine axial direction Greek δ boundary layer thickness η adiabatic effectiveness, )TT()TT(η caw −−= ∞∞ θ momentum thickness θi incident light angle λ light wavelength of sodium vapor lamp µoil dynamic viscosity of oil ν kinematic viscosity ρ density τw wall shear stress φ phase difference of light rays, or non-dimensional vane metal temperature, )TT()TT(φ wc −−= ∞∞ Subscripts 0 baseline conditions (no blowing) aw adiabatic wall c coolant conditions in inlet conditions s streamline coordinate w conductive (metal) wall local freestream conditions
References [1] Langston, L.S., 1980, “Crossflows in a Turbine Passage,” J of Engineering for Power,
Vol. 102, pp. 866-874.
[2] Sharma, O.P. and Butler, T.L., 1987, “Predictions of Endwall Losses and Secondary
Flows in Axial Flow Turbine Cascades,” J of Turbomachinery, Vol. 109, pp. 229-236.
[3] Goldstein, R.J. and Spores, R.A., 1988, “Turbulent Transport on the Endwall in the
Region Between Adjacent Turbine Blades,” J of Heat Transfer, Vol. 110, pp. 862-869.
∞
20
[4] Graziani, R.A., Blair, M.F., Taylor, J.R. and Mayle, R.E., 1980, “An Experimental Study
of Endwall and Airfoil Surface Heat Transfer in a Large Scale Turbine Blade Cascade,” J
of Engineering for Power, Vol. 102, pp. 257-267.
[5] Kang, M., Kohli, A., and Thole, K.A., 1999, “Heat Transfer and Flowfield Measurements
in the Leading Edge Region of a Stator Vane Endwall,” J of Turbomachinery, Vol. 121,
pp. 558-568.
[6] Ames, F.E., Barbot, P.A., and Wang, C., 2003, “Effects of Aeroderivative Combustor
Turbulence on Endwall Heat Transfer Distributions Acquired in a Linear Vane Cascade,”
J of Turbomachinery, Vol. 125, pp. 210-220.
[7] Blair, M.F., 1974, “An Experimental Study of Heat Transfer and Film Cooling on Large-
Scale Turbine Endwalls,” J of Heat Transfer, pp. 524-529.
[8] Granser, D., and Schulenberg, T., 1990, “Prediction and Measurement of Film Cooling
Effectiveness for a First-Stage Turbine Vane Shroud,” 90-GT-95.
[9] Knost, D. G., and Thole, K. A., 2004, “Adiabatic Effectiveness Measurements of
Endwall Film-Cooling for a First Stage Vane,” GT2004-53326.
[10] Knost, D. G., and Thole, K. A., 2005, “Adiabatic Effectiveness Measurements of
Endwall Film-Cooling for a First Stage Vane,” J of Turbomachinery, Vol. 127, pp. 297-
305.
[11] Burd, S.W., Satterness, C.J., and Simon, T.W., 2000, “Effects of Slot Bleed Injection
Over a Contoured Endwall On Nozzle Guide Vane Cooling Performance: Part II -
Thermal Measurements,” 2000-GT-200.
[12] Cardwell, N.D., Sundaram, N., and Thole, K.A., 2006, “The Effects of Varying the
21
Combustor-Turbine Gap,” GT2006-90089.
[13] Kost, F. and Nicklas, M., 2001, “Film-Cooled Turbine Endwall in a Transonic Flow
Field: Part I-Aerodynamic Measurements,” J of Turbomachinery, Vol. 123, pp. 709-719.
[14] Nicklas, M., 2001, “Film-Cooled Turbine Endwall in a Transonic Flow Field: Part II-
Heat Transfer and Film-Cooling Effectiveness,” J of Turbomachinery, Vol. 123, pp. 720-
729.
[15] Kost, F. and Mullaert, A., 2006, “Migration of Film-Coolant from Slot and Hole Ejection
at a Turbine Vane Endwall,” GT2006-90355.
[16] Munson, B. R., Young, D. F., and Okiishi, T. H., 2002, Fundamentals of Fluid
Mechanics (4th ed.), New York: John Wiley & Sons, Inc., p. 514.
[17] Naughton, J.W. and Sheplak, M., 2002, “Modern developments in shear stress
measurement,” Progress in Aerospace Sciences, Vol. 38, pp. 515-570.
[18] Harrison, S., 1990, “Secondary Loss Generation in a Linear Cascade of High-Turning
Turbine Blades,” J of Turbomachinery, Vol. 112, pp. 618-624.
[19] Holley, B., and Langston, L.S., “Surface Shear Stress and Pressure Measurements in a
Turbine Cascade,” GT2006-90580.
[20] Moffat, R. J., 1988, “Describing the Uncertainties in Experimental Results,”
Experimental Thermal and Fluid Science, Vol. 1, pp. 3-17.
[21] FLUENT (version 6.2.1), Fluent Inc., Lebanon, NH.
[22] Sen, B., Schmidt, D.L., and Bogard, D.G., 1996, “Film Cooling with Compound Angle
Holes: Heat Transfer,” J of Turbomachinery, Vol. 118, pp. 800-806.
22
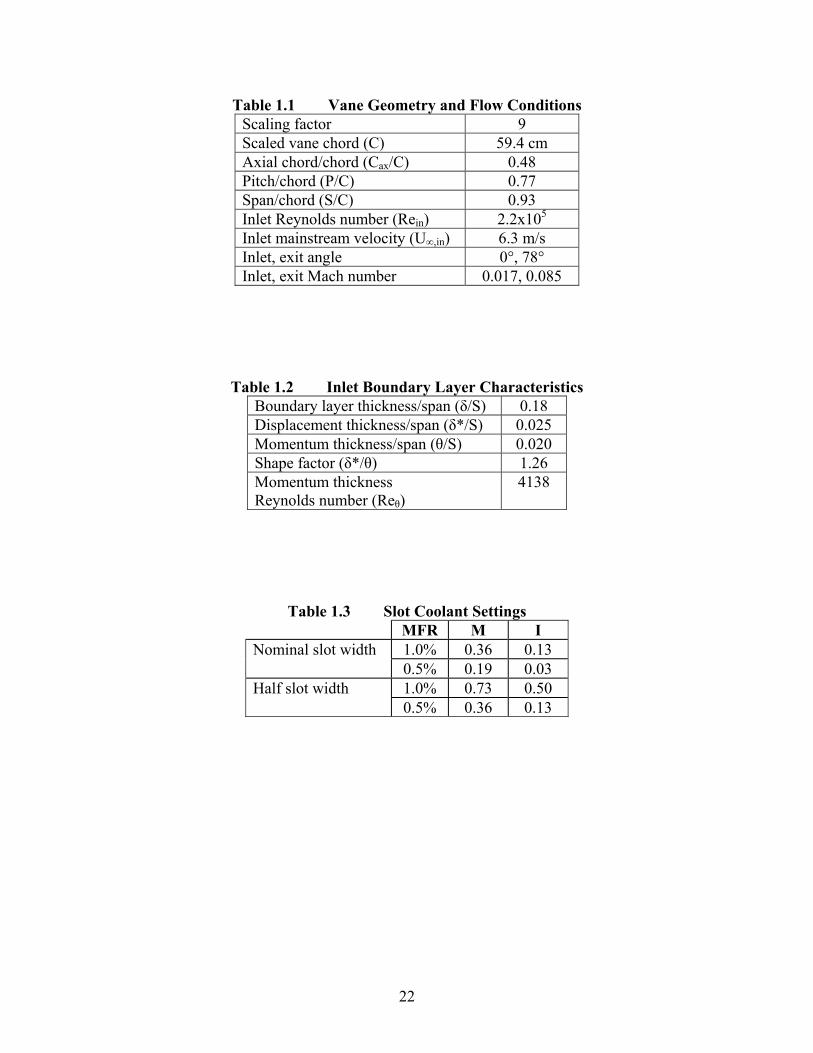
Table 1.1 Vane Geometry and Flow Conditions Scaling factor 9 Scaled vane chord (C) 59.4 cm Axial chord/chord (Cax/C) 0.48 Pitch/chord (P/C) 0.77 Span/chord (S/C) 0.93 Inlet Reynolds number (Rein) 2.2x10⁵ Inlet mainstream velocity (U∞,in) 6.3 m/s Inlet, exit angle 0°, 78° Inlet, exit Mach number 0.017, 0.085
Table 1.2 Inlet Boundary Layer Characteristics Boundary layer thickness/span (δ/S) 0.18 Displacement thickness/span (δ*/S) 0.025 Momentum thickness/span (θ/S) 0.020 Shape factor (δ*/θ) 1.26 Momentum thickness Reynolds number (Reθ)
4138
Table 1.3 Slot Coolant Settings MFR M I
1.0% 0.36 0.13 Nominal slot width 0.5% 0.19 0.03 1.0% 0.73 0.50 Half slot width
0.5% 0.36 0.13
23
Figure 1.1 Large low-speed wind tunnel with separate flow conditioning paths and
corner test section.
Figure 1.2 A schematic of the endwall and the combustor-turbine leakage interface (upstream slot) modeled in this study.
Heat exchanger
Axial fan
Vane test section
Primary flow heater
Secondary flow heat exchanger
Blower for slot plenum
Endwallheater area
X
Y
0.77Cax
A-A
Upstream slot
Adjustable wall
Section A-A
Metering width, 0.024C 45°
injection angle
24
Figure 1.3 Example of oil film interferograms on nickel foil, used to determine endwall friction coefficient magnitude and direction.
Figure 1.4 Measured friction coefficient vectors for no upstream slot flow, which
illustrate the features of secondary flow over the endwall.
x∆
Cf,x
Cf,y
Sheared oil droplet
~10mm
Nickel foil
Cf = 0.10 Cross-passage flow
Saddle point
Cf = 0.01
25
Figure 1.5 Endwall limiting streamlines and the separation line (blue) calculated from
the friction coefficient vectors in Figure 1.4, with inviscid streamlines (red) from FLUENT [21] overlaid.
Figure 1.6 Contours of endwall effectiveness from upstream slot flow for (a) nominal
slot, MFR=0.5%; (b) half slot, MFR=0.5%; (c) nominal slot, MFR=1.0%; (d) half slot, MFR=1.0%.
Limiting streamline
Saddle point
Separation line
Attachment line
Inviscid streamline
(c)
I=0.13
Nominal slot, 1.0% MFR
(d)
I=0.50
Half slot, 1.0% MFR
Endwall separation line for no
slot flow
(b)
I=0.13
Half slot, 0.5% MFR
(a)
I=0.03
0.75P
0.50P
0.25P
Nominal slot, 0.5% MFR
Endwall separation line for no slot flow
η
26
Figure 1.7 Adiabatic cooling effectiveness on the endwall from upstream slot flow,
sampled along an inviscid streamline released from (a) 25% pitch, (b) 50% pitch, (c) 75% pitch.
Figure 1.8 Contours of effectiveness for the nominal slot at 1.0% MFR for (a) Knost &
Thole [10] (slot at X/Cax=-0.38), and (b) this study (slot at X/Cax=-0.77).
η
(b) (a)
Upstream slot
Upstream slot
-0.2 0 0.2 0.4 0.60
0.2
0.4
0.6
0.8
1
s/C
η
0.75P
(c)
-0.2 0 0.2 0.4 0.60
0.2
0.4
0.6
0.8
1
s/C
η
0.50P
(b) 0
0.2
0.4
0.6
0.8
1
-0.2 0 0.2 0.4 0.6 0.8
Nominal slot, MFR=0.5%, I=0.03
Half slot, MFR=0.5%, I=0.13
Nominal slot, MFR=1.0%, I=0.13
Half slot, MFR=1.0%, I=0.50
Knost & Thole [10], MFR=1.0%
η
s/C
0.25P
(a)
27
Figure 1.9 Contours of St for (a) Kang et al. [5] (no upstream slot); (b) baseline (no
upstream slot); (c) nominal slot, MFR=0.5%; (d) half slot, MFR=0.5%; (e) nominal slot, MFR=1.0%; (f) half slot, MFR=1.0%.
(e)
I=0.13
Nominal slot, MFR=1.0%
(c)
I=0.03
0.75P
0.50P
0.25P
Nominal slot, MFR=0.5%
Endwall separation line for no slot flow
(f)
I=0.50
Half slot, MFR=1.0%
Endwall separation line for no slot flow
(d)
I=0.13
Half slot, MFR=0.5%
(a)
Kang et al. [5], (no injection), δ/S=0.09
St
(b)
Baseline, no injection, δ/S=0.18
Endwall separation line for no slot flow
28
Figure 1.10 Heat transfer augmentation on the endwall from upstream slot flow, sampled
along an inviscid streamline released from (a) 25% pitch, (b) 50% pitch, (c) 75% pitch.
-0.2 0 0.2 0.4 0.60.8
1
1.2
1.4
1.6
1.8
s/C
StSt
0
0.8
1
1.2
1.4
1.6
1.8
-0.2 0 0.2 0.4 0.6 0.8
Nominal slot, MFR=0.5%, I=0.03Half slot, MFR=0.5%, I=0.13Nominal slot, MFR=1.0%, I=0.13Half slot, MFR=1.0%, I=0.50
s/C
StSt
0
-0.2 0 0.2 0.4 0.60.8
1
1.2
1.4
1.6
1.8
s/C
StSt
0
0.25P
0.50P
0.75P
(a) (b)
(c)
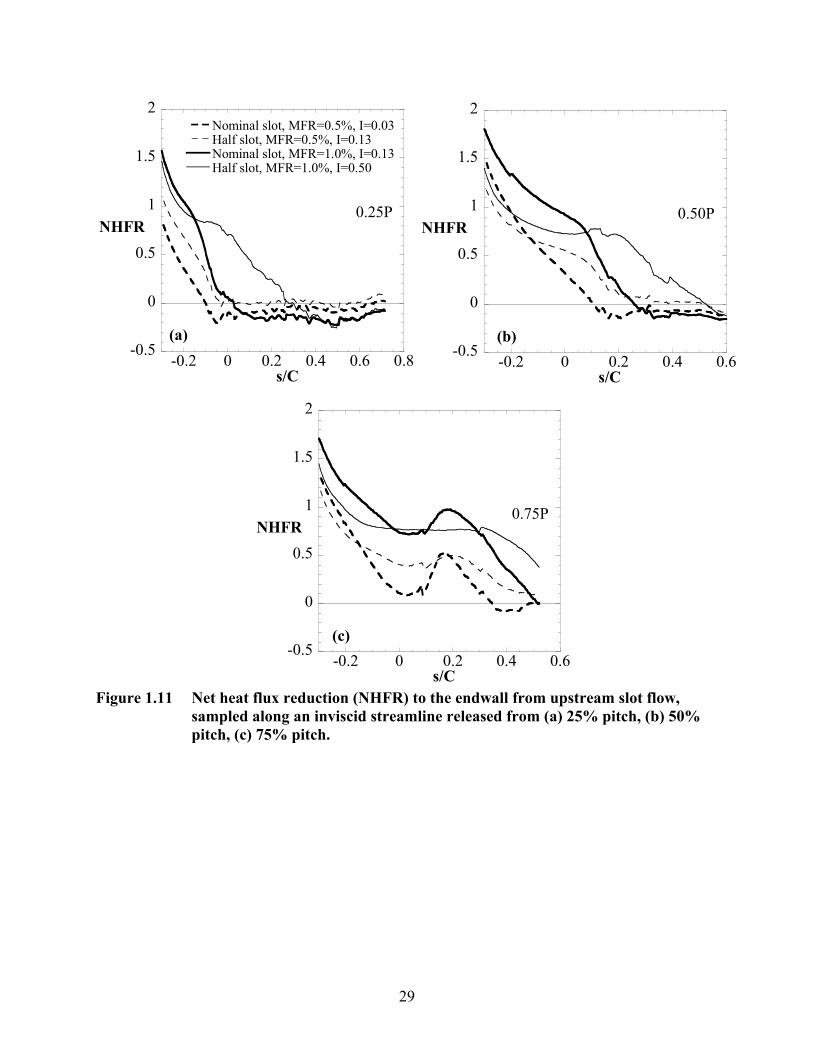
29
Figure 1.11 Net heat flux reduction (NHFR) to the endwall from upstream slot flow,
sampled along an inviscid streamline released from (a) 25% pitch, (b) 50% pitch, (c) 75% pitch.
-0.5
0
0.5
1
1.5
2
-0.2 0 0.2 0.4 0.6 0.8
Nominal slot, MFR=0.5%, I=0.03Half slot, MFR=0.5%, I=0.13Nominal slot, MFR=1.0%, I=0.13Half slot, MFR=1.0%, I=0.50
NHFR
s/C
-0.2 0 0.2 0.4 0.6-0.5
0
0.5
1
1.5
2
s/C
NHFR
-0.2 0 0.2 0.4 0.6-0.5
0
0.5
1
1.5
2
s/C
NHFR
0.25P
0.50P
0.75P
(a) (b)
(c)
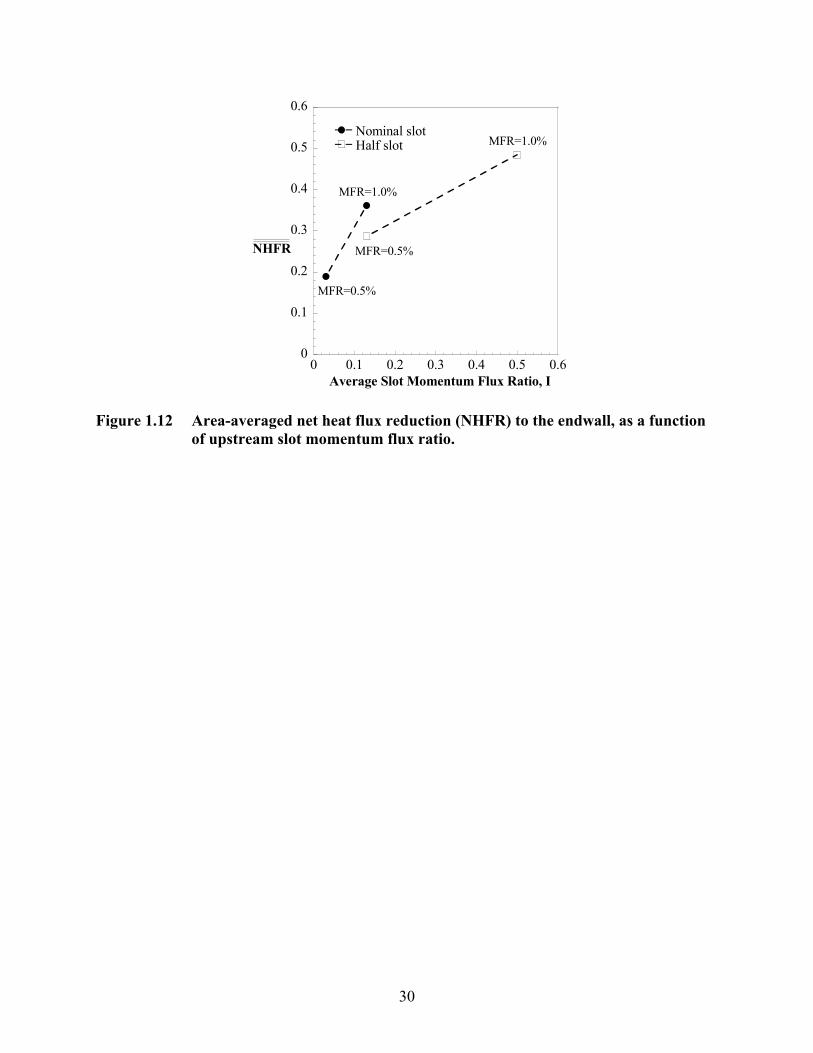
30
0
0.1
0.2
0.3
0.4
0.5
0.6
0 0.1 0.2 0.3 0.4 0.5 0.6
Nominal slotHalf slot
NHFR
Average Slot Momentum Flux Ratio, I
MFR=0.5%
MFR=1.0%
MFR=1.0%
MFR=0.5%
Figure 1.12 Area-averaged net heat flux reduction (NHFR) to the endwall, as a function of upstream slot momentum flux ratio.

*Co-author: Dr. Karen A. Thole, Mechanical and Nuclear Engineering Department, The Pennsylvania State University
31
Paper 2:
HEAT TRANSFER AND SHEAR STRESS FOR A NOZZLE GUIDE VANE ENDWALL WITH FILLETS AND COMBUSTOR-TURBINE GAP
LEAKAGE FLOW
To be submitted to the 2008 IGTI Conference*
Abstract
Increasing the turbine inlet temperature to achieve high gas turbine efficiency and power
output results in high heat loads on the nozzle guide vane in the turbine section. These heat
loads are managed by cooling air bypassed from the compressor. The endwall poses particular
cooling challenges because of the complex vortical secondary flow at the airfoil-endwall
junction. Past studies have shown that a fillet at the airfoil-endwall junction can attenuate the
development of secondary flow for aerodynamic and thermal benefit. Also, leakage flow from
the gap between the combustor and turbine can provide cooling to the endwall; however, the
combined effect of these two mechanisms has not been tested.
This study presents heat transfer, adiabatic cooling effectiveness, and shear stress on the
endwall and fillet surfaces for a linear cascade with leakage flow from a flush slot placed
upstream of the vanes. The addition of a fillet to the airfoil-endwall junction slightly reduced
average heat transfer coefficients compared to an unfilleted endwall, with and without upstream
slot leakage flow. A large fillet with a linear airfoil-to-endwall profile, however, displaced
coolant around the vane, leading to poor coverage except for a high slot momentum flux ratio.
Although shear stress magnitude without upstream slot flow was higher at the throat for the
filleted endwall, the fillet reduced overturning at the throat associated with secondary flow.
32
Introduction Increases in gas turbine efficiency and power output can be achieved by increasing the
temperature of the combustion products entering the nozzle guide vane in the turbine section.
However, the high heat loads to the nickel superalloy material of the nozzle guide vane require
significant cooling to maintain part strength and durability, given that the combustion gas
temperature can be on the order of 300°C higher than the melting temperature. Air bled from the
compressor section can be routed to the turbine for internal and external cooling.
The endwall region of a turbine vane or blade is particularly important to cool because of
the presence of a complex flow that develops at the airfoil-endwall junction. Various flow
models, including Langston [1], Sharma and Butler [2], Goldstein and Spores [3], and others,
describe an approaching boundary layer that rolls up into a horseshoe vortex at the leading edge
of the vane. The horseshoe vortex splits into suction and pressure side legs, and the pressure side
leg develops into a larger passage vortex. These vortical structures, generally termed secondary
flows, can be a large source of aerodynamic loss (30-50% according to Sharma and Butler [2]).
Secondary flows also sweep coolant from the endwall and increase endwall heat transfer
coefficients.
Several methods to control or eliminate secondary flows have been tested, including
blowing, endwall contouring, and modifications of the leading-edge endwall-airfoil junction.
Adding a fillet to the endwall-airfoil junction has been shown to be particularly successful in
reducing total pressure loss and endwall heat transfer coefficients; see the following discussion
of the results of Zess and Thole [4], Becz et al. [5], Lethander et al. [6], Han and Goldstein [7],
and others.
In an engine, gaps are present between individually manufactured components, and cool
air from the compressor is allowed to leak through the gaps. This prevents hot gas ingestion, and
can provide some cooling to the part surface. A particular gap of interest for the work presented
in this paper is between the combustor and the turbine. Leakage flow from this gap interacts
with the secondary flow, and at high flow rates the coolant may promote secondary flow
development. Furthermore, thermal expansion of the turbine over the large operational range of
the engine can result in variations in the gap width that affect the leakage flow from the gap.
This paper presents experimental measurements of the combined effect of combustor-
turbine interface leakage and a large leading-edge fillet on endwall heat transfer, adiabatic

33
cooling effectiveness, and shear stress. The objective of this study is to explore the interaction of
the fillet with combustor-turbine gap leakage flow.
Relevant Past Studies
Successful passive methods of controlling or eliminating horseshoe vortex development
include three-dimensional endwall contouring and leading edge endwall-airfoil geometries.
However, these methods are rarely considered simultaneously with film cooling, and in the case
of an engine with a leakage interface, the interaction of leakage flow with endwall contouring or
a fillet can result in unexpected behavior.
One of the more successful passive secondary flow control techniques has been
modification of the endwall-airfoil junction. Sauer et al. [8] used an asymmetric leading edge
bulb to intensify the suction side leg of the horseshoe vortex, which resulted in a 47% reduction
in net aerodynamic losses. Zess and Thole [4] computationally studied several fillet designs, and
experimentally tested a successful asymmetric linear-profile design. Measurements indicated
elimination of the horseshoe vortex and an order of magnitude reduction in turbulent kinetic
energy levels associated with vortex development. Becz et al. [5] investigated two bulbs based
on the design of Sauer et al. [8], as well as an asymmetric elliptical fillet, and found that only the
fillet reduced overall total mass-averaged pressure loss.
Other studies have focused on the thermal aspects of an endwall-airfoil juncture
modification. Shih and Lin [9] performed computational studies on two fillet designs with and
without swirl in the incoming flow profile. Their study indicated the largest reduction of heat
transfer on the airfoil and endwall and the least overall aerodynamic penalty occurred with no
fillet and inlet swirl. Lethander et al. [6] successfully integrated optimization software with a
commercial CFD solver to design a relatively large fillet (with dimensions at the limits of their
design space) that reduced adiabatic wall temperatures. Streamlines indicated elimination of the
horseshoe vortex for the large fillet, although the fillet exhibited a slight increase in mass-
averaged total pressure loss relative to an unfilleted endwall. Han and Goldstein [7] used
naphthalene sublimation to infer heat transfer distributions on the endwall through the heat and
mass transfer analogy. Their linear asymmetric fillet, based on the design of Zess and Thole [4],
reduced the horseshoe vortex but resulted in increased heat transfer at the endwall-airfoil
junction downstream of the fillet due to intensified corner vortices. The measurements of
34
Mahmood et al. [10] for four fillet geometries indicated that the fillets reduced the leading edge
vortex size and lowered endwall heat transfer coefficients downstream of the fillets, with a
concave circular geometry showing a slightly larger reduction in heat transfer than any of the
other geometries. Total pressure losses, however, were not reduced with any of the fillets. In a
related study, Saha et al. [11] presented computations for linear and circular profile fillets of the
same geometry as Mahmood et al. [10]. Endwall Nusselt numbers were slightly reduced with
the addition of a fillet, although there was no difference between the fillets. The fillets also
resulted in reduced streamwise vorticity and turbulent kinetic energy, leading Saha et al. [11] to
conjecture that a fillet weakened secondary flows.
Several significant studies have investigated the thermal and aerodynamic effect of
leakage flow introduced through the combustor-turbine interface gap upstream of the nozzle
guide vane. Blair’s [12] measurements of endwall heat transfer and adiabatic cooling
effectiveness from leakage flow through a two-dimensional flush slot upstream of the vane
revealed that coolant accumulated at the suction side corner of the vane-endwall junction, and
increased coolant flow rates resulted in better coverage. Endwall heat transfer coefficients,
however, were not dramatically influenced by the leakage flow. A computational study by Knost
and Thole [13] showed that near-wall streamlines became increasingly directed toward the
pressure side of the vane as the flow rate through their two-dimensional flush slot was increased.
A two-part study by Burd and Simon [14] and Burd et al. [15] investigated the
aerodynamic and thermal effect of leakage flow from a flush slot in a cascade with a streamwise-
contoured endwall. The aerodynamic measurements of Burd and Simon [14] revealed that the
slot exit velocity became more uniform across the vane pitch as the flow rate was increased, and
that the addition of leakage flow did not impact the total pressure loss in the cascade. Burd et al.
[15] concluded from their thermal measurements that coolant at low flow rates was strongly
influenced by secondary flow, but coolant at a high flow rate of 3.2% provided optimum
coverage because its high momentum enabled it to avoid being entrained by secondary flow
vortices. Heat transfer coefficients measured at limited points in the passage did not change
significantly with the addition of slot flow.
The series of studies by Kost and Nicklas [16], Nicklas [17], and Kost and Mullaert [18]
presented aerodynamic and heat transfer measurements for upstream slot flow and discrete hole
passage film cooling in a transonic cascade. Kost and Nicklas [16] and Nicklas [17] found that
35
leakage flow from their flush slot, positioned 0.2Cax upstream of the vane, strengthened the
horseshoe vortex and dramatically increased heat transfer coefficients. This was attributed to the
slot injecting at the separation location on the endwall. In Kost and Mullaert’s [18] subsequent
study, the slot was positioned farther upstream (at 0.3Cax upstream of the vane), which helped
coolant stay close to the endwall and spread more uniformly.
Cardwell et al. [19] studied the effect of axial expansion of the combustor-turbine
interface and found that adiabatic cooling effectiveness coverage area was a function of slot
momentum flux ratio, but effectiveness levels were dependent on the slot mass flow ratio. Lynch
and Thole [20] also concluded this for the same slot and airfoil geometry, even though their slot
was located two times farther upstream of the vane. Moreover, the limit of the coolant coverage
area correlated well with the endwall separation line. Lynch and Thole’s [20] heat transfer
coefficient results showed little variation with increasing slot flow.
This study is the first to present the combined effect of combustor-turbine interface
leakage flow and a large fillet at the endwall-airfoil junction. Furthermore, no fillet studies to
date have presented results for the fillet surface, which would be of interest to turbine designers
since it is a surface that must be cooled.
Experimental Facility and Methodology Heat transfer, adiabatic cooling effectiveness, and shear stress were measured on the
endwall of the nozzle guide vane test section in a closed-loop low-speed wind tunnel. The
tunnel, illustrated in Figure 2.1 and previously described by Lynch and Thole [20], had an axial
fan that drove the flow through the closed loop. A porous plate diverted some of the flow into
bypass channels, where it could be further cooled to 20°C for film effectiveness studies. The
core channel flow that was not diverted could be heated to 45°C with a 55kW heater bank, to
simulate hot mainstream flow for the effectiveness measurements. For the friction coefficient
and heat transfer coefficient studies, no flow heating or cooling was necessary.
A contraction section was located 2.9C upstream of the nozzle guide vane. The
contraction reduced the flow area from 1.11 m2 to 0.62 m2 through symmetric 45° bounding
walls. The nozzle guide vane test section is depicted in Figure 2.2. The test section contained
two flow passages, defined by two full nozzle guide vanes and a third partial vane connected to a
flexible wall. The flexible wall was adjusted to maintain the desired pressure distribution around

36
the center vane. The vanes, based on the midspan geometry of a commercial aircraft engine
nozzle guide vane, were scaled by a factor of nine from the engine, and were manufactured from
low-density polyurethane foam for low conductivity. The nozzle guide vane parameters are
given in Table 2.1.
A turbulent boundary layer was measured at 0.63C upstream of the vane on the bottom
endwall. The boundary layer had a thickness of δ/S=0.18, a momentum thickness of θ/S=0.020,
a shape factor H=1.26, and a momentum Reynolds number Reθ=4138. The effect of high
freestream turbulence was considered to be of secondary interest compared to the endwall
leakage flow and leading edge geometries; thus, the tunnel nominal turbulence intensity and
length scale for this study, measured at the cascade inlet, were 0.9% and 4 cm (0.07C),
respectively.
Combustor-Turbine Interface Geometry
The leakage interface between a combustor and a turbine was modeled by a two-
dimensional slot placed on the bottom endwall of the nozzle guide vane test section, as seen in
Figure 2.2 and described in Lynch and Thole [20]. The interface will be referred to as an
upstream slot in this paper. The leakage interface was based on the geometry of Cardwell et al.
[19], who consulted industrial contacts to design a representative leakage interface. Note,
however, that the upstream slot in this study, and that of Lynch and Thole [20], was located
much farther upstream of the vane (0.77Cax in this study, compared to 0.38Cax for Cardwell et al.
[19]), to accommodate the large leading-edge endwall-airfoil geometries presented here. The slot
extended across the entire pitch of the cascade.
To test the effects of engine axial thermal expansion on the leakage flow, two slot
metering widths were tested. The nominal metering width, scaled to nine times that of the
engine, was 1.43 cm (0.024C). The contracted slot width was 50% of the nominal metering
width, and will be referred to as a half slot.
The leakage flow was supplied from a plenum located underneath the bottom endwall.
The plenum supply was extracted from the top bypass channel of the wind tunnel by a blower
(see Figure 2.1). To determine the average mass flow through the slot, the inviscid blowing ratio
of the slot was multiplied by an assumed discharge coefficient of 0.6 (the commonly-accepted
value for a sharp-edged orifice [21]). In this paper, mass flow through the slot is reported as a
percentage of the mass flow entering a vane passage. Table 2.2 lists the coolant settings studied.

37
The coolant-to-mainstream density ratio was fixed at 1.1 for the adiabatic effectiveness
measurements. Although the density ratio is lower than the typical value for an engine, the mass
flow and slot width were based on industrial input, so the blowing and momentum flux ratios of
the slot flow are expected to be representative of engine values. For the heat transfer coefficient
measurements, the slot flow was maintained to within 0.1°C of the mainstream temperature.
Endwall-Airfoil Fillet Designs
Two large leading-edge fillet designs were chosen for comparison with a standard 90°
endwall-airfoil junction. The two geometries, illustrated in Figure 2.3, were designed with a
linear endwall-to-airfoil profile (referred to as a linear fillet), and an elliptical endwall-to-airfoil
profile (referred to as an elliptical fillet). The geometry of the fillets followed the methodology
of the computational optimization study by Lethander et al. [6]. The extent of the fillet outward
from the vane, as well as the height of the fillet from the bottom endwall, was described by a
half-cosine that was a function of the distance along the vane surface. The fillet design
parameters included the maximum fillet extent and height (cosine amplitude), the locations of the
maximum extent and height relative to the vane stagnation (cosine phase), and the maximum
distance of the fillet around the vane (cosine half-period). This allowed the leading-edge fillets
to merge smoothly into the nominal manufacturing fillet (1.1 cm radius [0.019C]) while still
maintaining the vane gage point. For this study, the linear fillet and the elliptical fillet had the
same design parameters, and only differed in their endwall-to-airfoil profile.
The linear and elliptical fillets were machined from the same low-density foam as the
vane and instrumented with thermocouples. The fillets were positioned around the base of the
vane airfoils and sealed using silicone. Note that the baseline unfilleted endwall did not have a
manufacturing fillet at the base of the vane, since the small size of the manufacturing fillet did
not have an impact on the endwall flowfield [6].
Shear Stress Measurements
Shear stress was measured on the endwall and linear fillet surface using the oil film
interferometry (OFI) technique. OFI employs the shear rate of oil over a surface to quantitatively
determine the wall shear, and was described in detail in Lynch and Thole [20]. Refer to Figure
2.4 for a depiction of the oil film development and a sample interferogram from the endwall
measurements. The oil film is on the order of the wavelength of visible light, and its thickness is
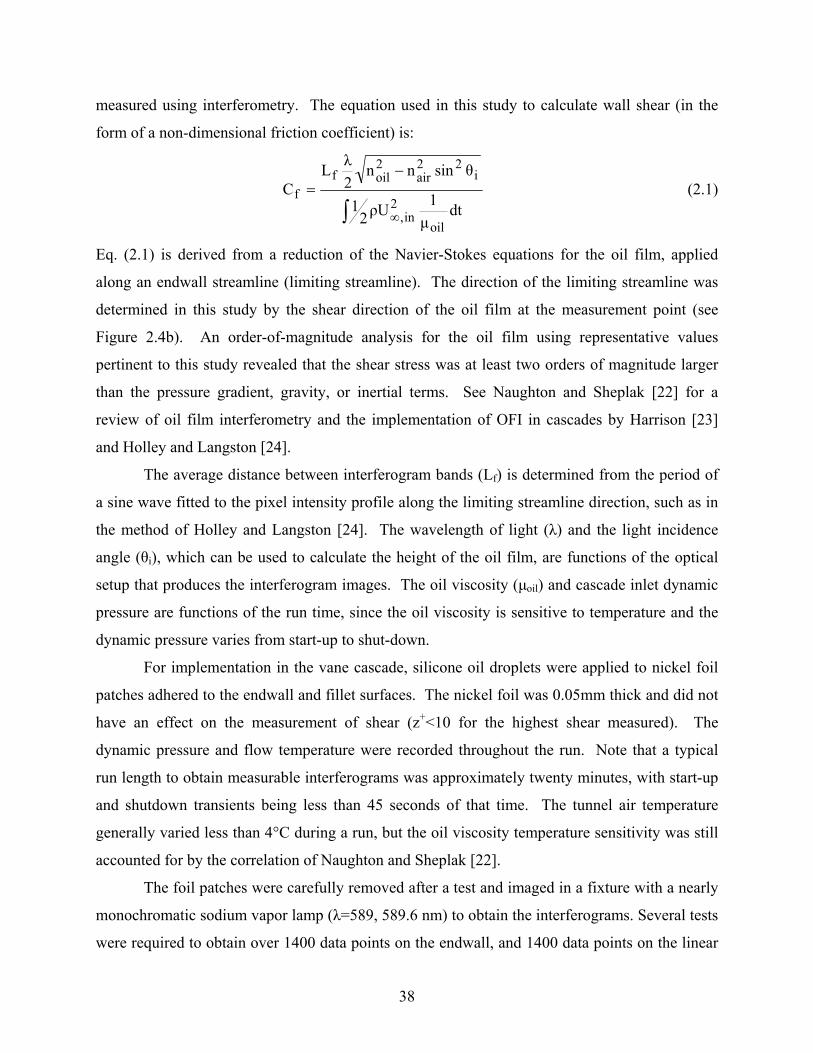
38
measured using interferometry. The equation used in this study to calculate wall shear (in the
form of a non-dimensional friction coefficient) is:
∫ ∞
−=
dtµ
1Uρ21
θsinnn2λL
C
oil
2in,
i22
air2oilf
f (2.1)
Eq. (2.1) is derived from a reduction of the Navier-Stokes equations for the oil film, applied
along an endwall streamline (limiting streamline). The direction of the limiting streamline was
determined in this study by the shear direction of the oil film at the measurement point (see
Figure 2.4b). An order-of-magnitude analysis for the oil film using representative values
pertinent to this study revealed that the shear stress was at least two orders of magnitude larger
than the pressure gradient, gravity, or inertial terms. See Naughton and Sheplak [22] for a
review of oil film interferometry and the implementation of OFI in cascades by Harrison [23]
and Holley and Langston [24].
The average distance between interferogram bands (Lf) is determined from the period of
a sine wave fitted to the pixel intensity profile along the limiting streamline direction, such as in
the method of Holley and Langston [24]. The wavelength of light (λ) and the light incidence
angle (θi), which can be used to calculate the height of the oil film, are functions of the optical
setup that produces the interferogram images. The oil viscosity (µoil) and cascade inlet dynamic
pressure are functions of the run time, since the oil viscosity is sensitive to temperature and the
dynamic pressure varies from start-up to shut-down.
For implementation in the vane cascade, silicone oil droplets were applied to nickel foil
patches adhered to the endwall and fillet surfaces. The nickel foil was 0.05mm thick and did not
have an effect on the measurement of shear (z+<10 for the highest shear measured). The
dynamic pressure and flow temperature were recorded throughout the run. Note that a typical
run length to obtain measurable interferograms was approximately twenty minutes, with start-up
and shutdown transients being less than 45 seconds of that time. The tunnel air temperature
generally varied less than 4°C during a run, but the oil viscosity temperature sensitivity was still
accounted for by the correlation of Naughton and Sheplak [22].
The foil patches were carefully removed after a test and imaged in a fixture with a nearly
monochromatic sodium vapor lamp (λ=589, 589.6 nm) to obtain the interferograms. Several tests
were required to obtain over 1400 data points on the endwall, and 1400 data points on the linear
39
fillet surface. Unlike the linear fillet, the elliptical fillet has double curvature and its surface
cannot be flattened without distortion (non-developable surface, see Figure 2.3b). Due to this
problem, at this time no shear stress measurements have been obtained for the elliptical fillet.
Our implementation of the OFI method was benchmarked by measuring friction factors
in fully developed flow in a square channel. Friction factor measurements agreed with textbook
correlations to within 5% over a range of channel Reynolds numbers (25,000 < ReDh < 45,000).
The partial derivative method described by Moffat [25] was used to calculate
uncertainties for the measurements of friction coefficient magnitude and direction. Magnitude
uncertainty was estimated as ∂Cf=±5.8% for both low (Cf=0.004) and high (Cf=0.126) values of
friction coefficients, and was dominated by uncertainty in the interferogram spacing. Directional
uncertainty was estimated as ∂Ψ=±2° for both high and low friction coefficient values.
Heat Transfer Coefficient Measurements
Measurements of heat transfer coefficients were taken on the endwall and fillet surfaces
by imaging surface temperatures on constant heat flux plates via infrared thermography. Both
the endwall and fillet heat flux plates contained 25 µm inconel elements embedded in a
serpentine pattern between 75 µm of kapton, to which a 37 µm copper layer was attached. To
eliminate the need for endwall cooling under the fillets, the endwall heater was designed with
separate circuits under the fillets. These circuits were turned off when the fillets were installed.
The endwall heaters were attached to a 2.54 cm thick sheet of closed-cell foam to reduce
conduction losses. Heat flux plates were also attached to the linear fillet, since its surface is
developable (can be reduced to two dimensions). Because of its double curvature (non-
developable surface), the elliptical fillet surface cannot be flattened without distortion, which
complicates the heat flux plate manufacturing process. At this time, heat transfer coefficient
measurements have not been taken with the elliptical fillet.
In order to calibrate the thermography images, type-E thermocouples were embedded into
the foam under the heat flux plates and connected thermally to the heaters by thermal cement. A
conduction bias of approximately 0.7°C between a bottom-mounted thermocouple and the top-
surface IR measurement, due to heater thermal resistance, was accounted for by a one-
dimensional correction. For all heaters, the top copper surface was painted flat black for high
emissivity. Markers were etched into the paint near the thermocouples in order to locate the
thermocouples and perform image transformation.
40
Spatially-resolved surface temperatures on the bottom endwall were obtained with an
infrared camera mounted on the top endwall. An uncertainty analysis revealed that five images
should be taken and averaged at each of the twenty locations around the cascade, where each
image is also an average of 16 frames captured by the camera. The spatial integration of the
camera was approximately 0.17 mm (0.0012C), and the camera frame size was 240x320 pixels.
Image post-calibration for surface emissivity and reflected temperature was performed by
matching the temperature at the thermocouple locations in the image to the output of the
thermocouples. Calibrated images and thermocouples generally agreed to within 0.86°C.
The three-dimensionality of the fillet surface required a perspective distortion correction
technique, since the portions of the fillet closer to the camera appear larger in the IR camera
image. A correction was performed by placing a grid on the fillet surface and imaging it with the
IR camera. An in-house program mapped the two-dimensional image pixels to the known
coordinates of the gridpoints to remove the distortion. The camera location at a top endwall
image port was fixed for all tests, so that the pixel mapping routine at each port could be used for
subsequent data collection. The variability due to slight misalignment of the camera was less
than three pixels (0.004C).
Heat flux to the endwall and fillets was determined by measuring the power supplied to
the heater circuits and dividing by the circuit areas. The current through each circuit was
determined by measuring voltage across a precision resistor (1Ω) in series with the circuit.
Radiation and conduction corrections were performed locally, with the highest corrections
occurring at the highest surface temperatures. The maximum corrections were 0.2% and 21% of
the input power for conduction and radiation, respectively.
Overall uncertainty in Stanton number was estimated as ∂St=±0.00011 (3.3%) at a St
value of 0.003, and ∂St=±0.0009 (7.5%) at a St value of 0.011, with the largest contribution from
the surface temperature measurements (∂T=±0.91°C).
Adiabatic Effectiveness Measurements
Adiabatic wall temperatures due to upstream slot coolant were measured on the bottom
endwall of the cascade with the IR camera. The bottom endwall was manufactured from 2.54 cm
thick closed-cell foam to reduce conduction errors. Type-E thermocouples were embedded in
the foam surface for calibration of the thermography measurements. The endwall and fillets
41
were painted using flat black paint for high emissivity. Infrared-reflective finishing nails were
used as transformation markers in the thermography images.
Image capture and post-calibration was performed in the same way as for the heat
transfer coefficient measurements. The thermocouples and the calibrated images generally
agreed to within 0.3°C. The perspective distortion correction for the three-dimensionality of the
fillet surfaces was also applied to these measurements.
A one-dimensional correction for endwall conduction effects was applied to all adiabatic
effectiveness measurements. The resulting η correction was 0.14 at η=0.75 measured
downstream of the slot, and 0.05 for η=0.07 measured at the exit of the vane passage.
Uncertainty in the measurements of adiabatic cooling effectiveness was estimated by the
partial derivative method. Overall uncertainty in adiabatic effectiveness was estimated to be
∂η=±0.036 at a η value of 0.1, and ∂η=±0.026 at a η value of 0.8. The largest contribution to
overall uncertainty was the measurement of adiabatic surface temperatures with the IR camera
(∂Taw=±0.51°C). The adiabatic surface temperature uncertainty was lower than the heat flux
plate surface temperature uncertainty because of a higher bias error in the method of heat flux
plate temperature measurements.
Discussion of Results
The measurements of shear stress magnitude and direction without upstream slot flow,
for the unfilleted endwall and the endwall with a linear fillet, will be discussed first. A review of
the heat transfer coefficient measurement results for an endwall with and without a linear fillet
and upstream slot flow will follow. Finally, experimental measurements of adiabatic cooling
effectiveness from an upstream slot in the presence of no fillet, a linear fillet, and an elliptical
fillet are discussed.
Wall Shear Stress without an Upstream Slot
The oil film interferometry method described earlier provided measurements of endwall
and fillet surface shear stress, which were non-dimensionalized as friction coefficients. As
described earlier, the difficulty in placing foil patches on the non-developable surface of the
elliptical fillet precluded shear stress measurements for that geometry. Figure 2.5 presents
contours of friction coefficient magnitude. The contours for the endwall with the linear fillet
(Figure 2.5b) show surprising similarities to the contours from an endwall without a fillet (Figure
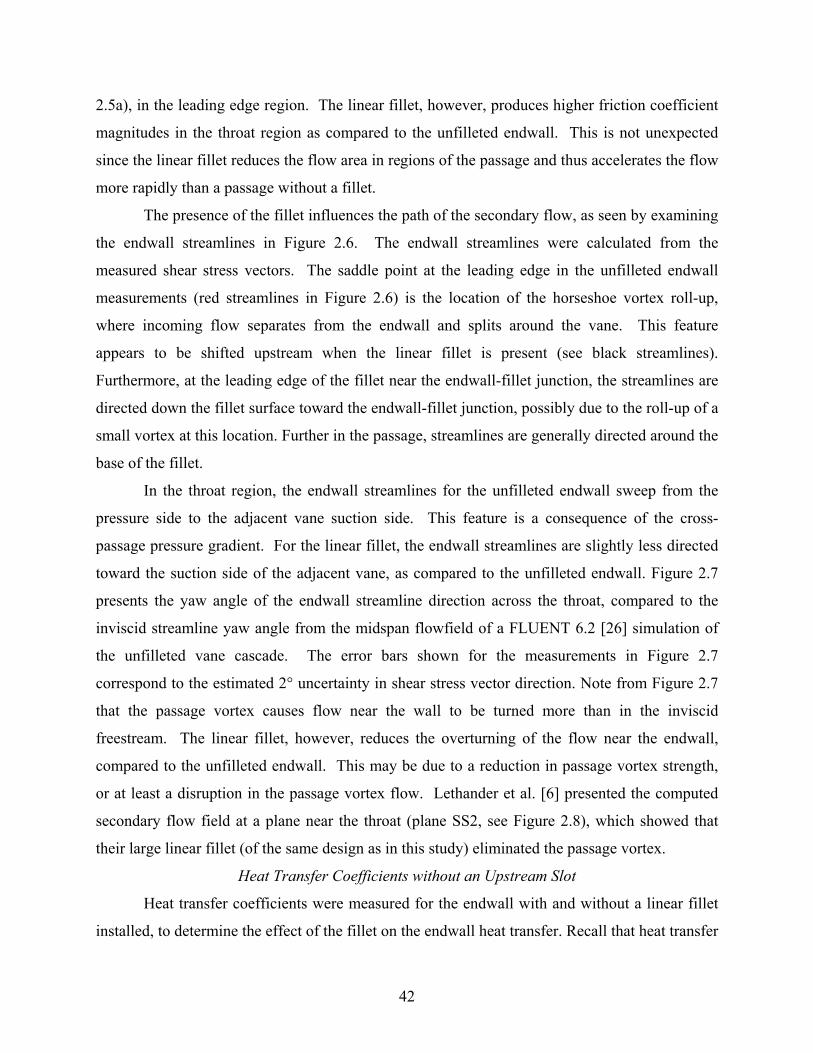
42
2.5a), in the leading edge region. The linear fillet, however, produces higher friction coefficient
magnitudes in the throat region as compared to the unfilleted endwall. This is not unexpected
since the linear fillet reduces the flow area in regions of the passage and thus accelerates the flow
more rapidly than a passage without a fillet.
The presence of the fillet influences the path of the secondary flow, as seen by examining
the endwall streamlines in Figure 2.6. The endwall streamlines were calculated from the
measured shear stress vectors. The saddle point at the leading edge in the unfilleted endwall
measurements (red streamlines in Figure 2.6) is the location of the horseshoe vortex roll-up,
where incoming flow separates from the endwall and splits around the vane. This feature
appears to be shifted upstream when the linear fillet is present (see black streamlines).
Furthermore, at the leading edge of the fillet near the endwall-fillet junction, the streamlines are
directed down the fillet surface toward the endwall-fillet junction, possibly due to the roll-up of a
small vortex at this location. Further in the passage, streamlines are generally directed around the
base of the fillet.
In the throat region, the endwall streamlines for the unfilleted endwall sweep from the
pressure side to the adjacent vane suction side. This feature is a consequence of the cross-
passage pressure gradient. For the linear fillet, the endwall streamlines are slightly less directed
toward the suction side of the adjacent vane, as compared to the unfilleted endwall. Figure 2.7
presents the yaw angle of the endwall streamline direction across the throat, compared to the
inviscid streamline yaw angle from the midspan flowfield of a FLUENT 6.2 [26] simulation of
the unfilleted vane cascade. The error bars shown for the measurements in Figure 2.7
correspond to the estimated 2° uncertainty in shear stress vector direction. Note from Figure 2.7
that the passage vortex causes flow near the wall to be turned more than in the inviscid
freestream. The linear fillet, however, reduces the overturning of the flow near the endwall,
compared to the unfilleted endwall. This may be due to a reduction in passage vortex strength,
or at least a disruption in the passage vortex flow. Lethander et al. [6] presented the computed
secondary flow field at a plane near the throat (plane SS2, see Figure 2.8), which showed that
their large linear fillet (of the same design as in this study) eliminated the passage vortex.
Heat Transfer Coefficients without an Upstream Slot
Heat transfer coefficients were measured for the endwall with and without a linear fillet
installed, to determine the effect of the fillet on the endwall heat transfer. Recall that heat transfer
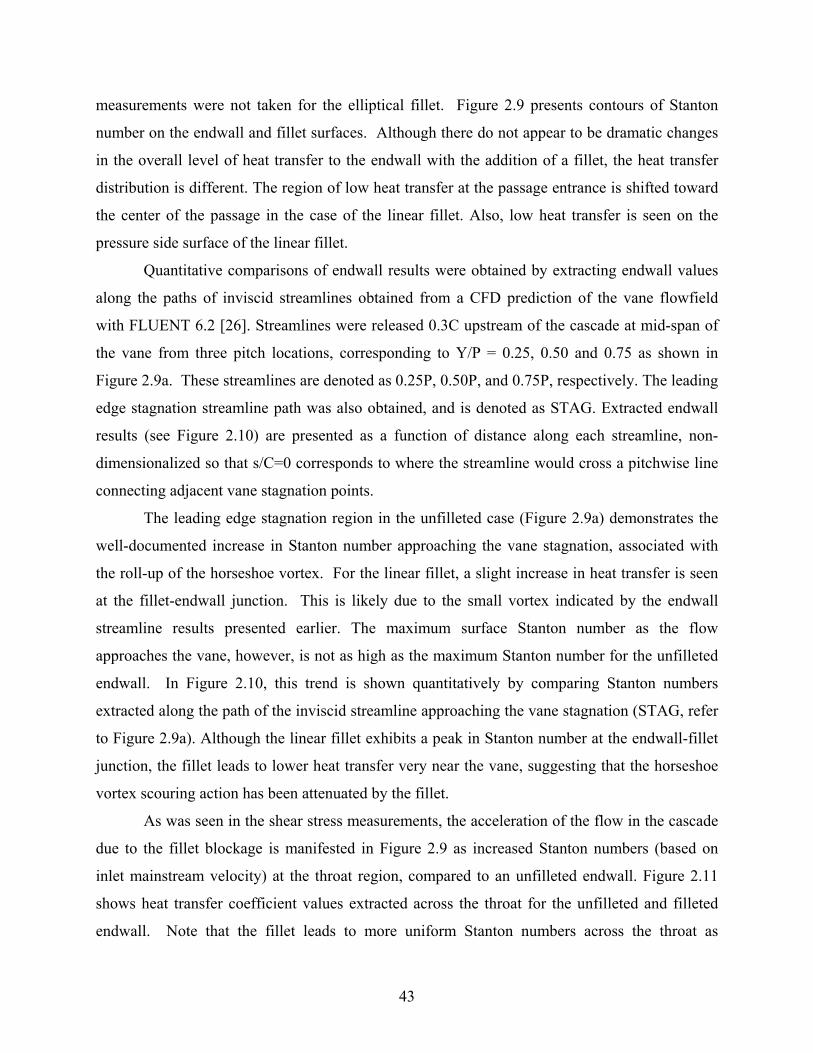
43
measurements were not taken for the elliptical fillet. Figure 2.9 presents contours of Stanton
number on the endwall and fillet surfaces. Although there do not appear to be dramatic changes
in the overall level of heat transfer to the endwall with the addition of a fillet, the heat transfer
distribution is different. The region of low heat transfer at the passage entrance is shifted toward
the center of the passage in the case of the linear fillet. Also, low heat transfer is seen on the
pressure side surface of the linear fillet.
Quantitative comparisons of endwall results were obtained by extracting endwall values
along the paths of inviscid streamlines obtained from a CFD prediction of the vane flowfield
with FLUENT 6.2 [26]. Streamlines were released 0.3C upstream of the cascade at mid-span of
the vane from three pitch locations, corresponding to Y/P = 0.25, 0.50 and 0.75 as shown in
Figure 2.9a. These streamlines are denoted as 0.25P, 0.50P, and 0.75P, respectively. The leading
edge stagnation streamline path was also obtained, and is denoted as STAG. Extracted endwall
results (see Figure 2.10) are presented as a function of distance along each streamline, non-
dimensionalized so that s/C=0 corresponds to where the streamline would cross a pitchwise line
connecting adjacent vane stagnation points.
The leading edge stagnation region in the unfilleted case (Figure 2.9a) demonstrates the
well-documented increase in Stanton number approaching the vane stagnation, associated with
the roll-up of the horseshoe vortex. For the linear fillet, a slight increase in heat transfer is seen
at the fillet-endwall junction. This is likely due to the small vortex indicated by the endwall
streamline results presented earlier. The maximum surface Stanton number as the flow
approaches the vane, however, is not as high as the maximum Stanton number for the unfilleted
endwall. In Figure 2.10, this trend is shown quantitatively by comparing Stanton numbers
extracted along the path of the inviscid streamline approaching the vane stagnation (STAG, refer
to Figure 2.9a). Although the linear fillet exhibits a peak in Stanton number at the endwall-fillet
junction, the fillet leads to lower heat transfer very near the vane, suggesting that the horseshoe
vortex scouring action has been attenuated by the fillet.
As was seen in the shear stress measurements, the acceleration of the flow in the cascade
due to the fillet blockage is manifested in Figure 2.9 as increased Stanton numbers (based on
inlet mainstream velocity) at the throat region, compared to an unfilleted endwall. Figure 2.11
shows heat transfer coefficient values extracted across the throat for the unfilleted and filleted
endwall. Note that the fillet leads to more uniform Stanton numbers across the throat as
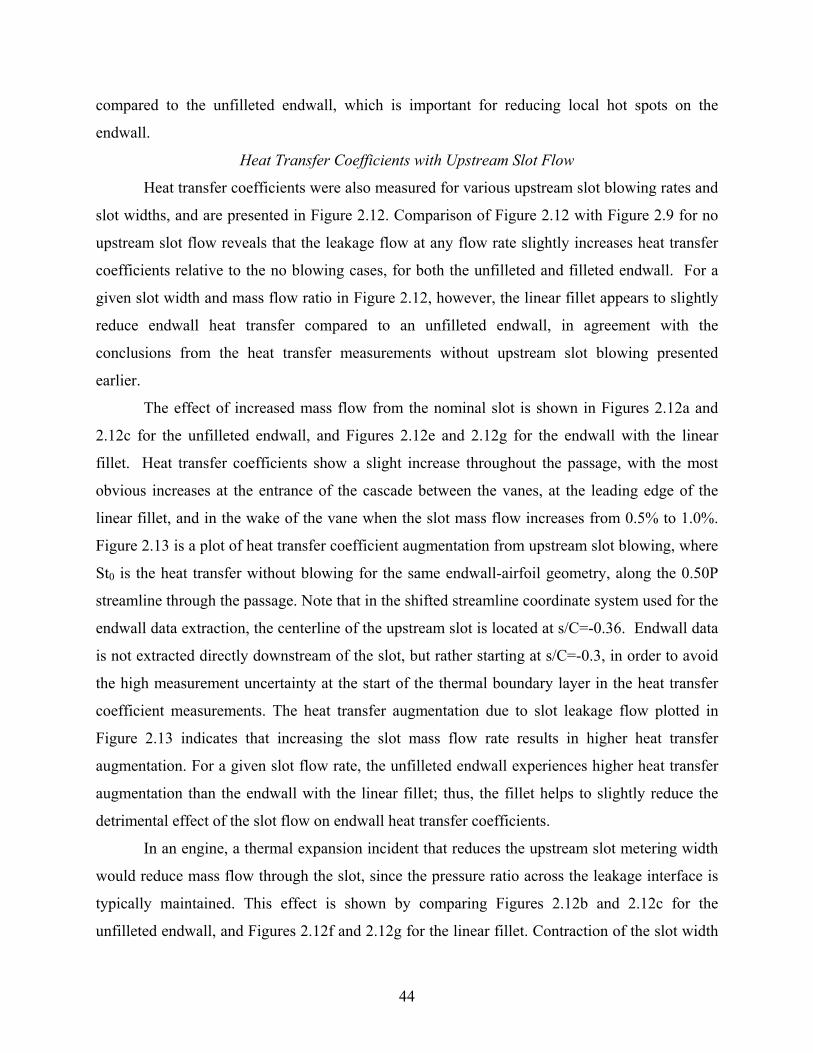
44
compared to the unfilleted endwall, which is important for reducing local hot spots on the
endwall.
Heat Transfer Coefficients with Upstream Slot Flow
Heat transfer coefficients were also measured for various upstream slot blowing rates and
slot widths, and are presented in Figure 2.12. Comparison of Figure 2.12 with Figure 2.9 for no
upstream slot flow reveals that the leakage flow at any flow rate slightly increases heat transfer
coefficients relative to the no blowing cases, for both the unfilleted and filleted endwall. For a
given slot width and mass flow ratio in Figure 2.12, however, the linear fillet appears to slightly
reduce endwall heat transfer compared to an unfilleted endwall, in agreement with the
conclusions from the heat transfer measurements without upstream slot blowing presented
earlier.
The effect of increased mass flow from the nominal slot is shown in Figures 2.12a and
2.12c for the unfilleted endwall, and Figures 2.12e and 2.12g for the endwall with the linear
fillet. Heat transfer coefficients show a slight increase throughout the passage, with the most
obvious increases at the entrance of the cascade between the vanes, at the leading edge of the
linear fillet, and in the wake of the vane when the slot mass flow increases from 0.5% to 1.0%.
Figure 2.13 is a plot of heat transfer coefficient augmentation from upstream slot blowing, where
St0 is the heat transfer without blowing for the same endwall-airfoil geometry, along the 0.50P
streamline through the passage. Note that in the shifted streamline coordinate system used for the
endwall data extraction, the centerline of the upstream slot is located at s/C=-0.36. Endwall data
is not extracted directly downstream of the slot, but rather starting at s/C=-0.3, in order to avoid
the high measurement uncertainty at the start of the thermal boundary layer in the heat transfer
coefficient measurements. The heat transfer augmentation due to slot leakage flow plotted in
Figure 2.13 indicates that increasing the slot mass flow rate results in higher heat transfer
augmentation. For a given slot flow rate, the unfilleted endwall experiences higher heat transfer
augmentation than the endwall with the linear fillet; thus, the fillet helps to slightly reduce the
detrimental effect of the slot flow on endwall heat transfer coefficients.
In an engine, a thermal expansion incident that reduces the upstream slot metering width
would reduce mass flow through the slot, since the pressure ratio across the leakage interface is
typically maintained. This effect is shown by comparing Figures 2.12b and 2.12c for the
unfilleted endwall, and Figures 2.12f and 2.12g for the linear fillet. Contraction of the slot width
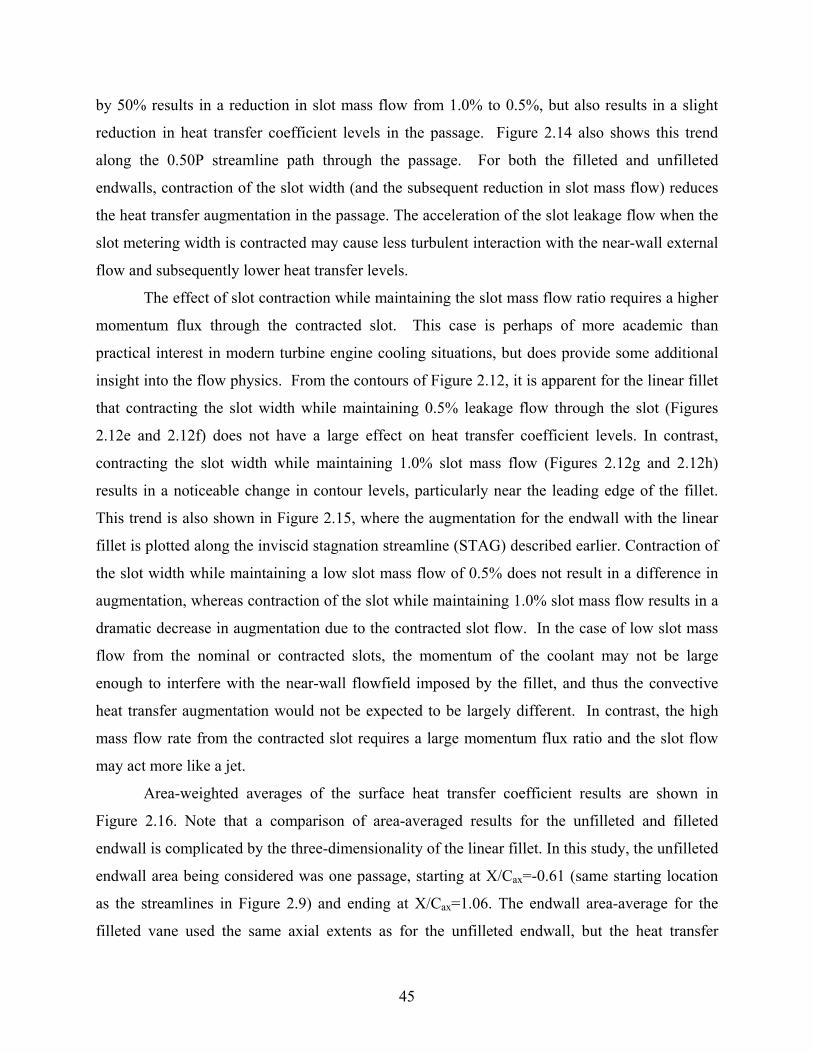
45
by 50% results in a reduction in slot mass flow from 1.0% to 0.5%, but also results in a slight
reduction in heat transfer coefficient levels in the passage. Figure 2.14 also shows this trend
along the 0.50P streamline path through the passage. For both the filleted and unfilleted
endwalls, contraction of the slot width (and the subsequent reduction in slot mass flow) reduces
the heat transfer augmentation in the passage. The acceleration of the slot leakage flow when the
slot metering width is contracted may cause less turbulent interaction with the near-wall external
flow and subsequently lower heat transfer levels.
The effect of slot contraction while maintaining the slot mass flow ratio requires a higher
momentum flux through the contracted slot. This case is perhaps of more academic than
practical interest in modern turbine engine cooling situations, but does provide some additional
insight into the flow physics. From the contours of Figure 2.12, it is apparent for the linear fillet
that contracting the slot width while maintaining 0.5% leakage flow through the slot (Figures
2.12e and 2.12f) does not have a large effect on heat transfer coefficient levels. In contrast,
contracting the slot width while maintaining 1.0% slot mass flow (Figures 2.12g and 2.12h)
results in a noticeable change in contour levels, particularly near the leading edge of the fillet.
This trend is also shown in Figure 2.15, where the augmentation for the endwall with the linear
fillet is plotted along the inviscid stagnation streamline (STAG) described earlier. Contraction of
the slot width while maintaining a low slot mass flow of 0.5% does not result in a difference in
augmentation, whereas contraction of the slot while maintaining 1.0% slot mass flow results in a
dramatic decrease in augmentation due to the contracted slot flow. In the case of low slot mass
flow from the nominal or contracted slots, the momentum of the coolant may not be large
enough to interfere with the near-wall flowfield imposed by the fillet, and thus the convective
heat transfer augmentation would not be expected to be largely different. In contrast, the high
mass flow rate from the contracted slot requires a large momentum flux ratio and the slot flow
may act more like a jet.
Area-weighted averages of the surface heat transfer coefficient results are shown in
Figure 2.16. Note that a comparison of area-averaged results for the unfilleted and filleted
endwall is complicated by the three-dimensionality of the linear fillet. In this study, the unfilleted
endwall area being considered was one passage, starting at X/Cax=-0.61 (same starting location
as the streamlines in Figure 2.9) and ending at X/Cax=1.06. The endwall area-average for the
filleted vane used the same axial extents as for the unfilleted endwall, but the heat transfer
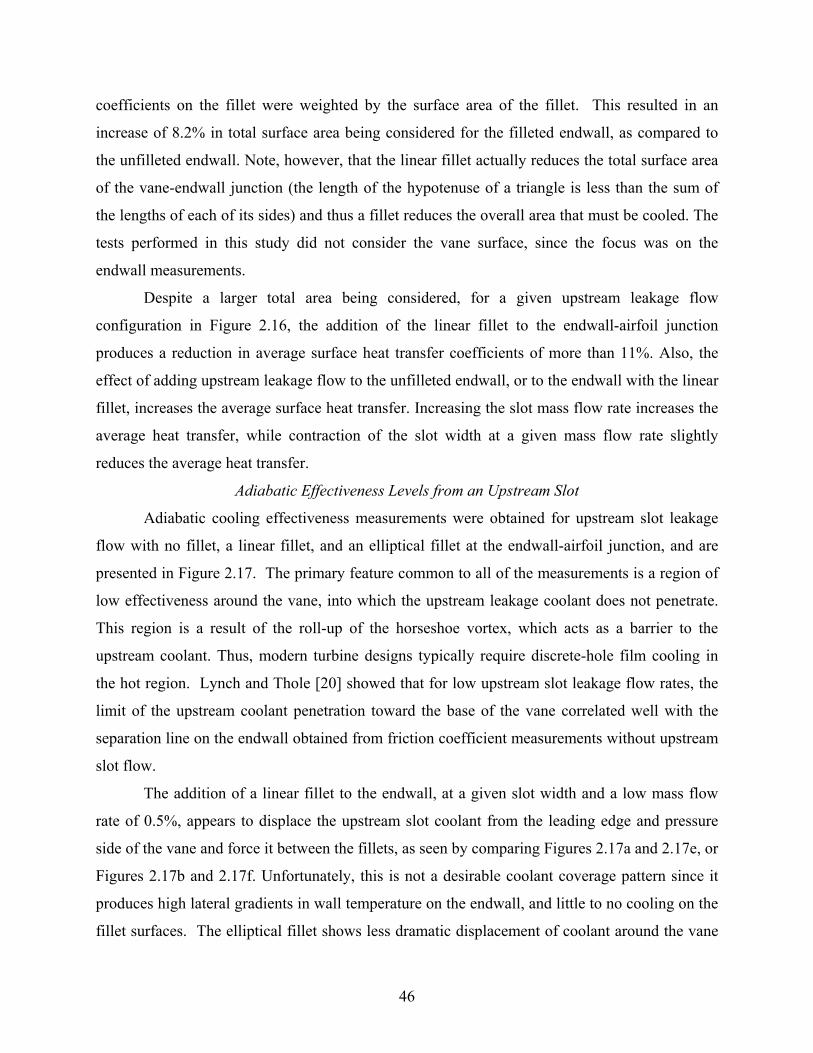
46
coefficients on the fillet were weighted by the surface area of the fillet. This resulted in an
increase of 8.2% in total surface area being considered for the filleted endwall, as compared to
the unfilleted endwall. Note, however, that the linear fillet actually reduces the total surface area
of the vane-endwall junction (the length of the hypotenuse of a triangle is less than the sum of
the lengths of each of its sides) and thus a fillet reduces the overall area that must be cooled. The
tests performed in this study did not consider the vane surface, since the focus was on the
endwall measurements.
Despite a larger total area being considered, for a given upstream leakage flow
configuration in Figure 2.16, the addition of the linear fillet to the endwall-airfoil junction
produces a reduction in average surface heat transfer coefficients of more than 11%. Also, the
effect of adding upstream leakage flow to the unfilleted endwall, or to the endwall with the linear
fillet, increases the average surface heat transfer. Increasing the slot mass flow rate increases the
average heat transfer, while contraction of the slot width at a given mass flow rate slightly
reduces the average heat transfer.
Adiabatic Effectiveness Levels from an Upstream Slot
Adiabatic cooling effectiveness measurements were obtained for upstream slot leakage
flow with no fillet, a linear fillet, and an elliptical fillet at the endwall-airfoil junction, and are
presented in Figure 2.17. The primary feature common to all of the measurements is a region of
low effectiveness around the vane, into which the upstream leakage coolant does not penetrate.
This region is a result of the roll-up of the horseshoe vortex, which acts as a barrier to the
upstream coolant. Thus, modern turbine designs typically require discrete-hole film cooling in
the hot region. Lynch and Thole [20] showed that for low upstream slot leakage flow rates, the
limit of the upstream coolant penetration toward the base of the vane correlated well with the
separation line on the endwall obtained from friction coefficient measurements without upstream
slot flow.
The addition of a linear fillet to the endwall, at a given slot width and a low mass flow
rate of 0.5%, appears to displace the upstream slot coolant from the leading edge and pressure
side of the vane and force it between the fillets, as seen by comparing Figures 2.17a and 2.17e, or
Figures 2.17b and 2.17f. Unfortunately, this is not a desirable coolant coverage pattern since it
produces high lateral gradients in wall temperature on the endwall, and little to no cooling on the
fillet surfaces. The elliptical fillet shows less dramatic displacement of coolant around the vane
47
than the linear fillet, but the coolant coverage is still not quite as extensive as for the unfilleted
endwall. Figure 2.18 presents effectiveness values extracted along the STAG streamline path for
the 0.5% slot mass flow cases. Along this streamline, for either the nominal or half slot widths at
0.5% mass flow, the linear fillet produces the lowest values of effectiveness, with the elliptical
fillet showing slightly higher effectiveness than the linear fillet, but lower effectiveness than for
an unfilleted endwall. However, along the 0.50P streamline path in Figure 2.19, the linear fillet
leads to higher effectiveness levels than the unfilleted endwall downstream of s/C=0.05, because
of how the linear fillets force the low-momentum coolant to travel between them.
Although the coolant displacement due to the linear fillet blockage is also apparent for
leakage flow from the nominal slot at 1.0% MFR (Figure 2.17g), the effect of slot width
contraction at this mass flow ratio (Figure 2.17h) results in coolant with high momentum that can
penetrate close to the vane. This effect of slot coolant penetration at a high momentum flux ratio
(I=0.50) was also noted in Lynch and Thole [20] for the unfilleted endwall (Figure 2.17d).
In general, the elliptical fillet shows similar coolant coverage as for the unfilleted endwall
(see Figures 2.17a and 2.17i, or 2.17d and 2.17l), with slightly lower local effectiveness levels
(compare effectiveness levels along the STAG streamline path in Figure 2.18). The smoothly
curved shape of the elliptical fillet results in less flow blockage than the linear fillet, and thus it
does not strongly dictate the endwall-airfoil junction flow pattern.
As was described in Lynch and Thole [20] for an unfilleted endwall, the effect of
upstream slot contraction due to engine thermal expansion leads to lower local effectiveness
levels, but similar extent of coolant coverage. This trend also holds for an endwall with a linear
or elliptical fillet (compare Figures 2.17f and 2.17g for the linear fillet, or Figures 2.17j and
2.17k for the elliptical fillet). Figure 2.19 shows that the higher mass flow (1.0% MFR) from the
nominal slot, at a momentum flux ratio of I=0.13, provides more cooling to the endwall than for
the half slot (0.5% MFR).
Area-weighted averages of the effectiveness data were performed the same way as for the
heat transfer coefficient data. Figure 2.20 presents the average cooling effectiveness for each of
the upstream slot coolant situations tested. Several trends are noted from this figure. For a given
mass flow rate, as the slot contracts, the average cooling effectiveness increases. Also, for
matched momentum flux, the contracted slot has lower average effectiveness than the nominal
slot since the contracted slot ejects less coolant (0.5% MFR, compared to 1.0% MFR from the

48
nominal slot). Adding a linear fillet to the vane-endwall junction tends to lower average cooling
effectiveness dramatically compared to the unfilleted endwall; at 0.5% MFR from the nominal
slot, the linear fillet causes a 43% reduction in average effectiveness compared to the unfilleted
endwall. The elliptical fillet performs better than the linear fillet in terms of average
effectiveness, but still has lower average effectiveness than an unfilleted endwall. Finally, at the
highest slot momentum flux ratio tested (I=0.50), the linear and elliptical fillets cause nearly the
same average effectiveness, but that level is 22% lower than the average effectiveness for an
unfilleted endwall.
Conclusions Measurements of shear stress and heat transfer were obtained for an endwall with and
without a large linear-profile fillet at the endwall-airfoil junction. Heat transfer and adiabatic
cooling effectiveness due to leakage flow from a flush slot placed upstream of the cascade were
also obtained for an endwall with no fillet, the large linear-profile fillet, and a similar large
elliptical-profile fillet.
For a linear-profile fillet and no slot leakage, flow acceleration due to the blockage of the
large linear fillet increased shear stress in the throat of the cascade as compared to an unfilleted
endwall. However, the yaw angles of the endwall streamlines were reduced with the linear fillet,
which may indicate a reduction in the strength of the passage vortex. Heat transfer was also
higher at the throat for an endwall with a linear fillet compared to an unfilleted endwall, but other
regions of the endwall showed lower heat transfer levels with a linear fillet. Moreover, the
average heat transfer was less for the endwall with a linear fillet.
Addition of leakage flow to the endwall from an upstream slot increased local heat
transfer relative to the no blowing case, and increasing the slot flow rate further increased heat
transfer. The half slot flow, at the same momentum flux as the nominal slot flow, resulted in
lower local heat transfer levels. For a given slot flow rate or metering width, the presence of the
linear fillet always resulted in a reduction in the average surface heat transfer coefficient,
suggesting that the benefit of the fillet was still evident in the more realistic interface leakage
flow situation studied here.
Unfortunately, neither the linear fillet nor the elliptical fillet performed well in terms of
the adiabatic cooling effectiveness levels of leakage flow from the flush slot configuration. The

49
linear fillet tended to displace slot coolant and channel it between the fillets, which resulted in
high effectiveness gradients. The elliptical fillet did not change the coverage of the coolant as
much as the linear fillet, but still tended to displace coolant away from the vane as compared to
an unfilleted endwall. Note that the leakage coolant behavior may also be a function of the
upstream slot location relative to the vane; coolant at the highest momentum flux ratio tested
(I=0.50) had sufficient momentum to be able to penetrate close to the vane and provide
significant coverage.
These results indicate that the use of a large fillet at the endwall-airfoil junction
contributes to reduced endwall heat transfer, but low-momentum leakage flow from the
combustor-turbine interface gap may be negatively impacted by the blockage of the fillet. Thus,
engine designers must carefully consider how a method of secondary flow control integrates with
the complex flowfield resulting from gap interface leakage.
Acknowledgments The authors would like to thank the National Science Foundation’s GOALI program for
funding this research (Grant No. 0412971). We would also like to acknowledge our partners in
the GOALI program: Joel Wagner and Peter Tay (Pratt & Whitney), and Dr. Lee Langston and
Brian Holley (University of Connecticut).
Nomenclature C true chord of stator vane Cax axial chord of stator vane
Cf friction coefficient, 2in,wf Uρ
21τC ∞= , see Eq. (2.1)
Cp heat capacity at constant pressure h heat transfer coefficient hoil height of oil film I average momentum flux ratio, 2
in,∞∞2cc UρUρI =
Lf spacing between oil film interferogram bands (fringes) M average blowing ratio, in,cc UρUρM ∞∞= MFR mass flow ratio, inc m/mMFR &&= n index of refraction P pitch of stator vane, or pressure ReDh Reynolds number based on hydraulic diameter

50
Rein inlet Reynolds number, νCURe in,in ∞= Reθ momentum thickness Reynolds number, defined as νUθRe in,θ ∞= s distance along a streamline S span of stator vane St Stanton number, in,p UCρhtS ∞= t time T temperature U axial velocity X, Y, Z vane coordinates, where X is turbine axial direction Greek δ boundary layer thickness η adiabatic cooling effectiveness, )TT()TT(η caw −−= ∞∞ θ momentum thickness θi incident light angle λ light wavelength of sodium vapor lamp µoil dynamic viscosity of oil ν kinematic viscosity ρ density τw wall shear stress φ phase difference of light rays, )TT()TT(φ wc −−= ∞∞ Ψ yaw angle (X-Y plane) relative to streamwise direction Subscripts/Superscripts 0 baseline conditions (no blowing) aw adiabatic wall c coolant conditions in inlet conditions s streamline coordinate local freestream conditions + scaling based on inner variables
References [1] Langston, L.S., 1980, “Crossflows in a Turbine Passage,” J of Engineering for Power,
Vol. 102, pp. 866-874.
[2] Sharma, O.P. and Butler, T.L., 1987, “Predictions of Endwall Losses and Secondary
Flows in Axial Flow Turbine Cascades,” J of Turbomachinery, Vol. 109, pp. 229-236.
[3] Goldstein, R.J. and Spores, R.A., 1988, “Turbulent Transport on the Endwall in the
∞
51
Region Between Adjacent Turbine Blades,” J of Heat Transfer, Vol. 110, pp. 862-869.
[4] Zess, G.A., and Thole, K.A., 2002, “Computational Design and Experimental Evaluation
of Using a Leading Edge Fillet on a Gas Turbine Vane,” J of Turbomachinery, Vol. 124,
pp. 167-175.
[5] Becz, S., Majewski, M.S., and Langston, L.S., 2004, “An Experimental Investigation of
Contoured Leading Edges for Secondary Flow Loss Reduction,” ASME Paper GT2004-
53964.
[6] Lethander, A.T., Thole, K.A., Zess, G.A., and Wagner, J., 2003, “Optimizing the Vane-
Endwall Junction to Reduce Adiabatic Wall Temperatures in a Turbine Vane Passage,”
ASME Paper GT2003-38940.
[7] Han, S., and Goldstein, R.J., 2006, “Influence of Blade Leading Edge Geometry on
Turbine Endwall Heat (Mass) Transfer,” J of Turbomachinery, Vol. 128, pp. 798-813.
[8] Sauer, H., Müller, R., and Vogeler, K., 2001, “Reduction of Secondary Flow Losses in
Turbine Cascades by Leading Edge Modifications at the Endwall,” J of Turbomachinery,
Vol. 123, pp. 207-213.
[9] Shih, T. I-P., and Lin, Y-L., 2001, “Controlling Secondary-Flow Structure by Leading-
Edge Airfoil Fillet and Inlet Swirl to Reduce Aerodynamic Loss and Surface Heat
Transfer,” J of Turbomachinery, Vol. 125, pp. 48-56.
[10] Mahmood, G.I., Gustafson, R., and Acharya, S., 2005, “Experimental Investigation of
Flow Structure and Nusselt Number in a Low-Speed Linear Blade Passage With and
Without Leading-Edge Fillets,” J of Heat Transfer, Vol. 127, pp. 499-512.
[11] Saha, A., Mahmood, G.I., and Acharya, S., 2006, “The Role of Leading-Edge Contouring
on End-Wall Flow and Heat Transfer: Computations and Experiments,” ASME Paper
52
GT2006-91318.
[12] Blair, M.F., 1974, “An Experimental Study of Heat Transfer and Film Cooling on Large-
Scale Turbine Endwalls,” J of Heat Transfer, pp. 524-529.
[13] Knost, D. G., and Thole, K. A., 2005, “Adiabatic Effectiveness Measurements of
Endwall Film-Cooling for a First Stage Vane,” J of Turbomachinery, Vol. 127, pp. 297-
305.
[14] Burd, S.W., and Simon, T.W., 2000, “Effects of Slot Bleed Injection Over a Contoured
Endwall On Nozzle Guide Vane Cooling Performance: Part I – Flow Field
Measurements,” 2000-GT-199.
[15] Burd, S.W., Satterness, C.J., and Simon, T.W., 2000, “Effects of Slot Bleed Injection
Over a Contoured Endwall On Nozzle Guide Vane Cooling Performance: Part II -
Thermal Measurements,” 2000-GT-200.
[16] Kost, F. and Nicklas, M., 2001, “Film-Cooled Turbine Endwall in a Transonic Flow
Field: Part I-Aerodynamic Measurements,” J of Turbomachinery, Vol. 123, pp. 709-719.
[17] Nicklas, M., 2001, “Film-Cooled Turbine Endwall in a Transonic Flow Field: Part II-
Heat Transfer and Film-Cooling Effectiveness,” J of Turbomachinery, Vol. 123, pp. 720-
729.
[18] Kost, F. and Mullaert, A., 2006, “Migration of Film-Coolant from Slot and Hole Ejection
at a Turbine Vane Endwall,” ASME Paper GT2006-90355.
[19] Cardwell, N.D., Sundaram, N., and Thole, K.A., 2006, “The Effects of Varying the
Combustor-Turbine Gap,” ASME Paper GT2006-90089.
[20] Lynch, S.P., and Thole, K.A., 2007, “The Effects of Combustor-Turbine Interface Gap

53
Leakage on the Endwall Heat Transfer for a Nozzle Guide Vane,” ASME Paper GT2007-
27867.
[21] Munson, B.R., Young, D.F., and Okiishi, T.H., 2002, Fundamentals of Fluid Mechanics
(4th ed.), New York: John Wiley & Sons, Inc., p. 514.
[22] Naughton, J.W. and Sheplak, M., 2002, “Modern developments in shear stress
measurement,” Progress in Aerospace Sciences, Vol. 38, pp. 515-570.
[23] Harrison, S., 1990, “Secondary Loss Generation in a Linear Cascade of High-Turning
Turbine Blades,” J of Turbomachinery, Vol. 112, pp. 618-624.
[24] Holley, B., and Langston, L.S., “Surface Shear Stress and Pressure Measurements in a
Turbine Cascade,” GT2006-90580.
[25] Moffat, R. J., 1988, “Describing the Uncertainties in Experimental Results,”
Experimental Thermal and Fluid Science, Vol. 1, pp. 3-17.
[26] FLUENT (version 6.2.1), Fluent Inc., Lebanon, NH.
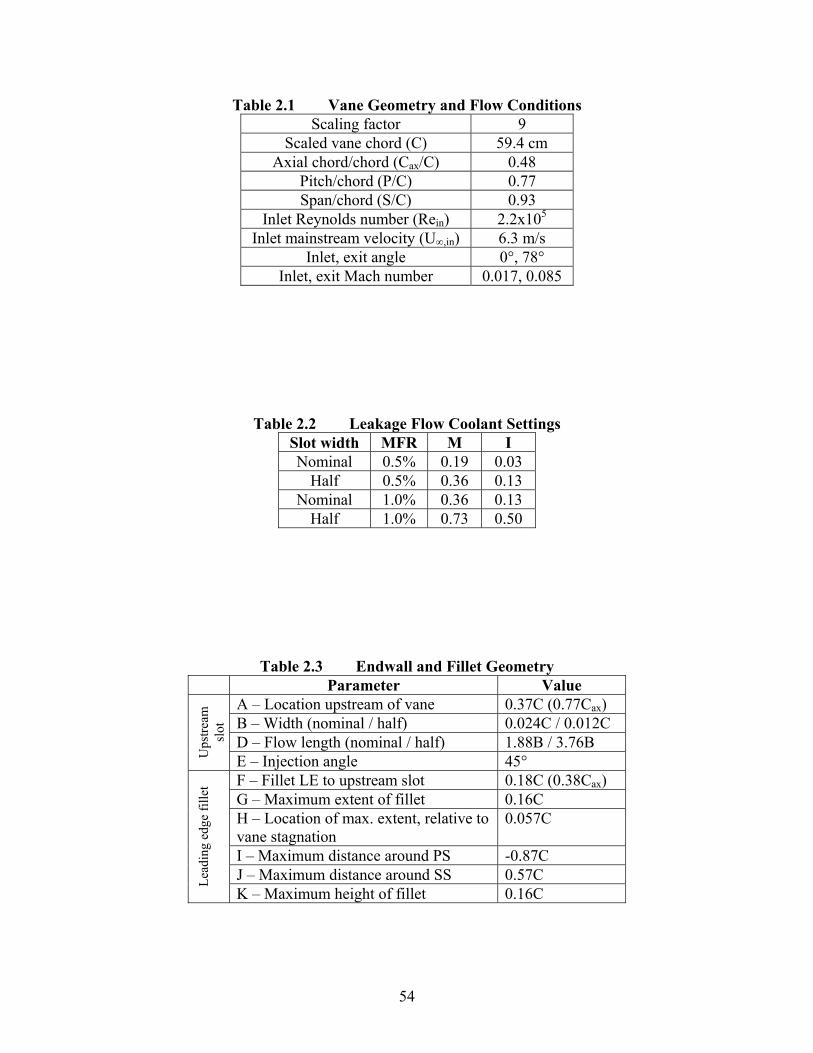
54
Table 2.1 Vane Geometry and Flow Conditions Scaling factor 9
Scaled vane chord (C) 59.4 cm Axial chord/chord (Cax/C) 0.48
Pitch/chord (P/C) 0.77 Span/chord (S/C) 0.93
Inlet Reynolds number (Rein) 2.2x10⁵ Inlet mainstream velocity (U∞,in) 6.3 m/s
Inlet, exit angle 0°, 78° Inlet, exit Mach number 0.017, 0.085
Table 2.2 Leakage Flow Coolant Settings Slot width MFR M I Nominal 0.5% 0.19 0.03
Half 0.5% 0.36 0.13 Nominal 1.0% 0.36 0.13
Half 1.0% 0.73 0.50
Table 2.3 Endwall and Fillet Geometry Parameter Value
A – Location upstream of vane 0.37C (0.77Cax) B – Width (nominal / half) 0.024C / 0.012C D – Flow length (nominal / half) 1.88B / 3.76B
Ups
tream
sl
ot
E – Injection angle 45° F – Fillet LE to upstream slot 0.18C (0.38Cax) G – Maximum extent of fillet 0.16C H – Location of max. extent, relative to vane stagnation
0.057C
I – Maximum distance around PS -0.87C J – Maximum distance around SS 0.57C Le
adin
g ed
ge fi
llet
K – Maximum height of fillet 0.16C
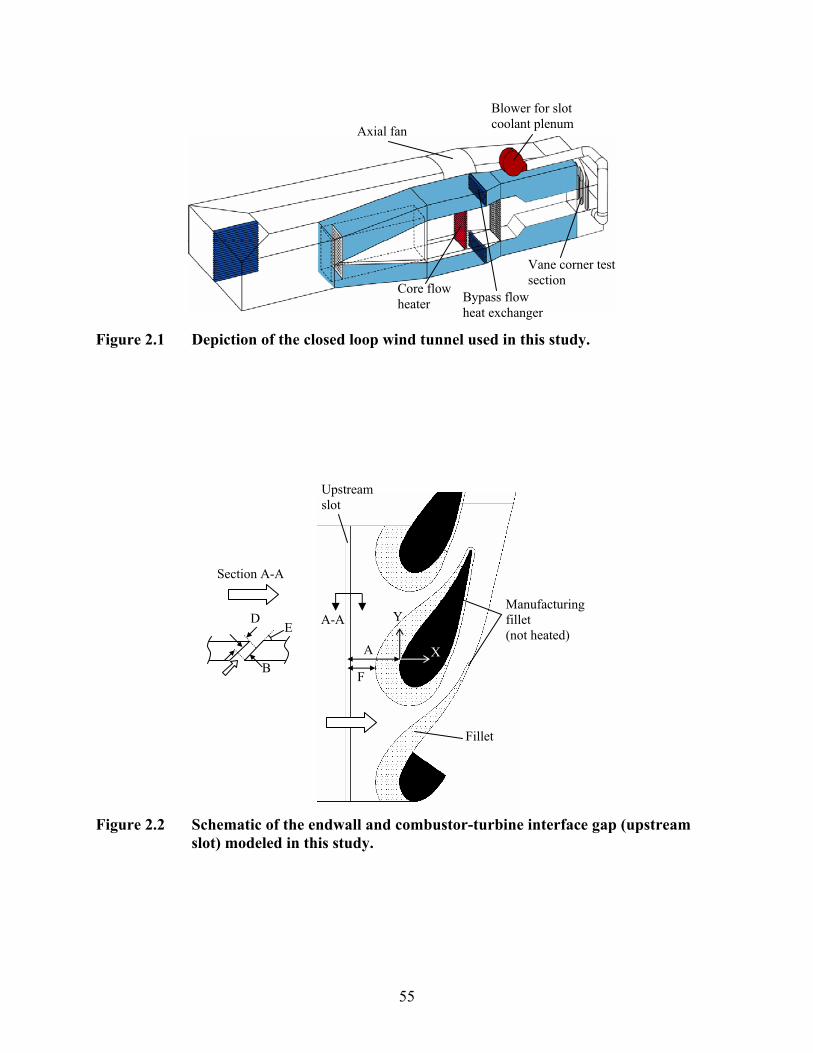
55
Figure 2.1 Depiction of the closed loop wind tunnel used in this study.
Figure 2.2 Schematic of the endwall and combustor-turbine interface gap (upstream
slot) modeled in this study.
Axial fan
Blower for slot coolant plenum
Vane corner test section Core flow
heater Bypass flow heat exchanger
B
E D
Section A-A
Fillet
Upstream slot
X
Y
A
Manufacturing fillet (not heated)
F
A-A
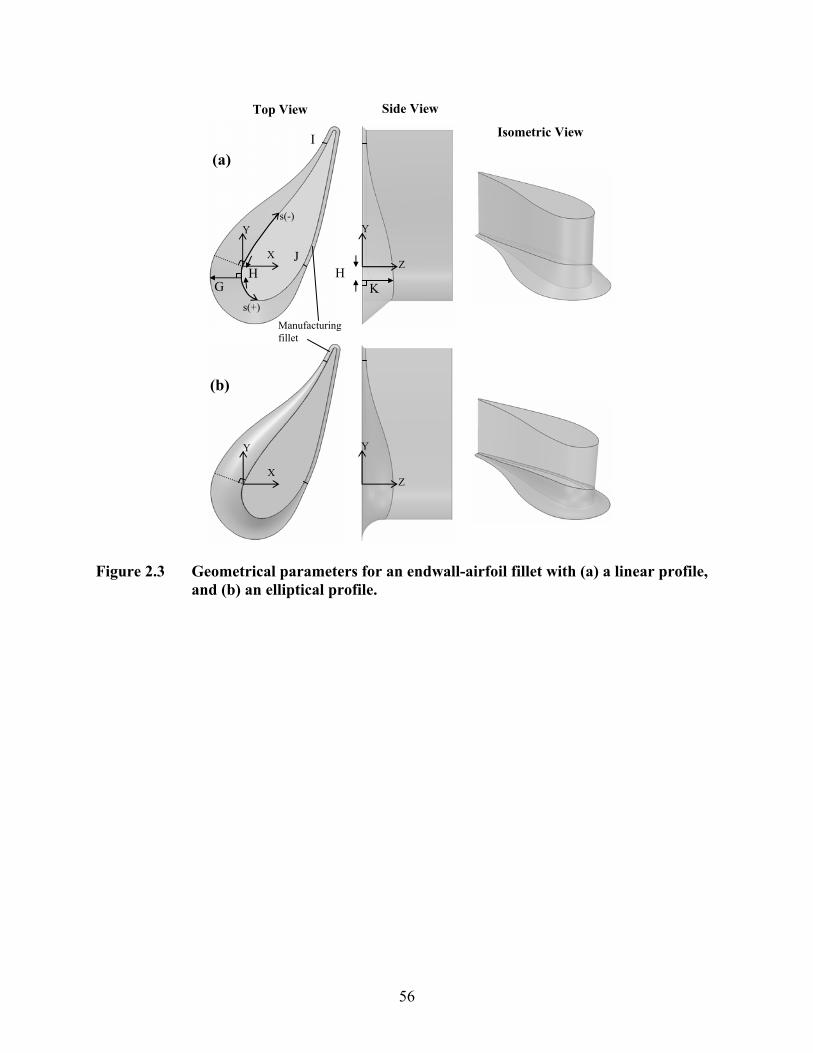
56
Figure 2.3 Geometrical parameters for an endwall-airfoil fillet with (a) a linear profile, and (b) an elliptical profile.
(b)
X
Y
Z
Y
Isometric View
G
I
J X
Y
(a)
Top View
s(-)
s(+)
H
Manufacturing fillet
Side View
Z
K
Y
H
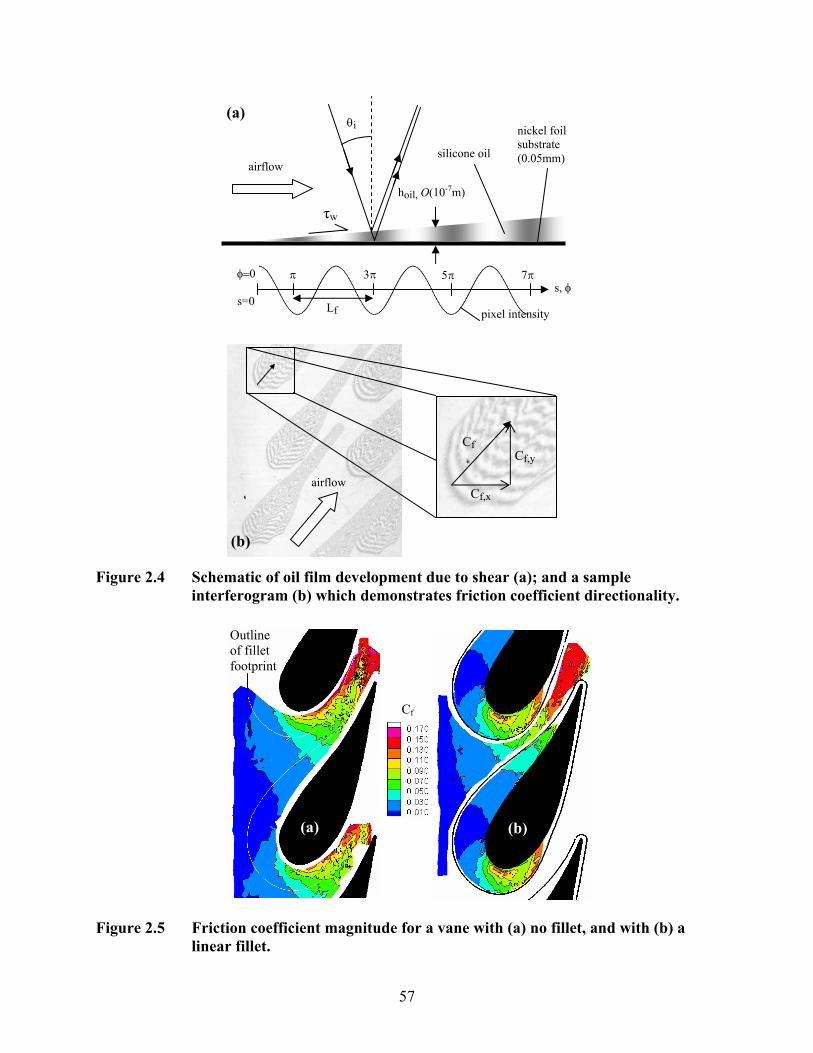
57
Figure 2.4 Schematic of oil film development due to shear (a); and a sample
interferogram (b) which demonstrates friction coefficient directionality.
Figure 2.5 Friction coefficient magnitude for a vane with (a) no fillet, and with (b) a linear fillet.
Cf,x
Cf,y
airflow
Cf
(b)
(a) θi
hoil, O(10-7m)
silicone oil
nickel foil substrate (0.05mm)
airflow
τw
Lf
s, φ 3π π 5π φ=0
s=0
7π
pixel intensity
Outline of fillet footprint
(a) (b)
Cf
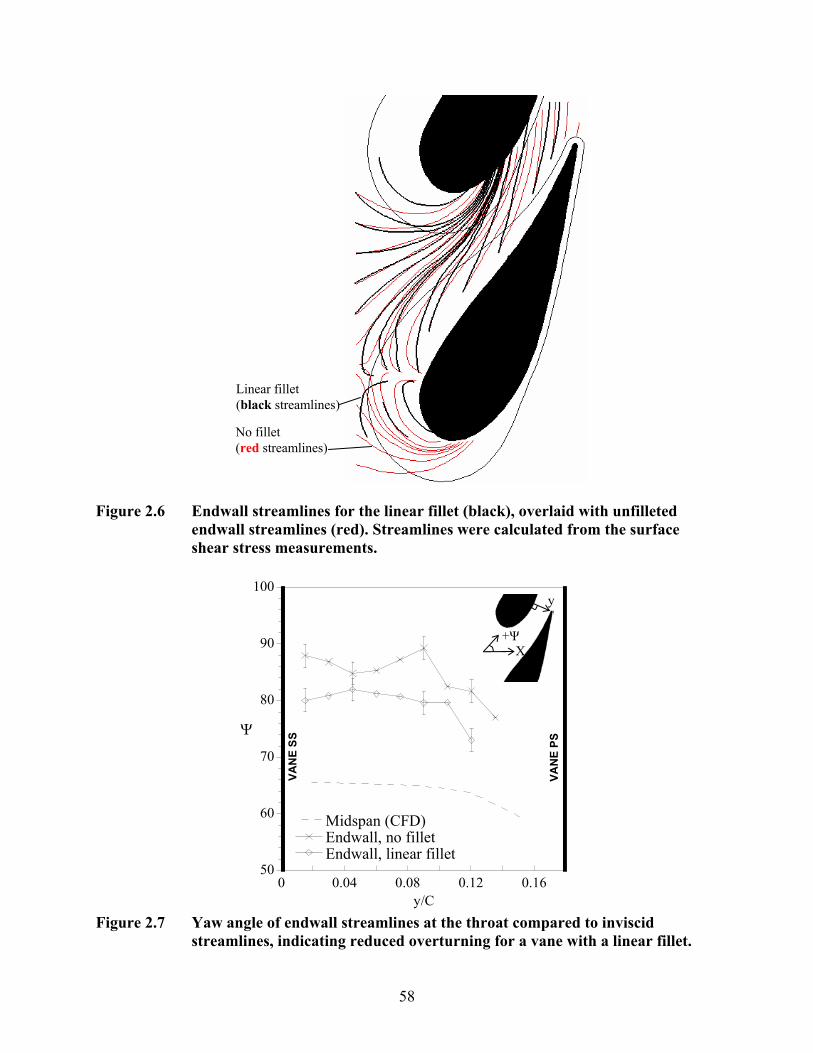
58
Figure 2.6 Endwall streamlines for the linear fillet (black), overlaid with unfilleted endwall streamlines (red). Streamlines were calculated from the surface shear stress measurements.
Figure 2.7 Yaw angle of endwall streamlines at the throat compared to inviscid
streamlines, indicating reduced overturning for a vane with a linear fillet.
50
60
70
80
90
100
0 0.04 0.08 0.12 0.16
Midspan (CFD)Endwall, no filletEndwall, linear fillet
Ψ
y/C
VAN
E SS
VAN
E PS
+Ψ
y
X
No fillet (red streamlines)
Linear fillet (black streamlines)
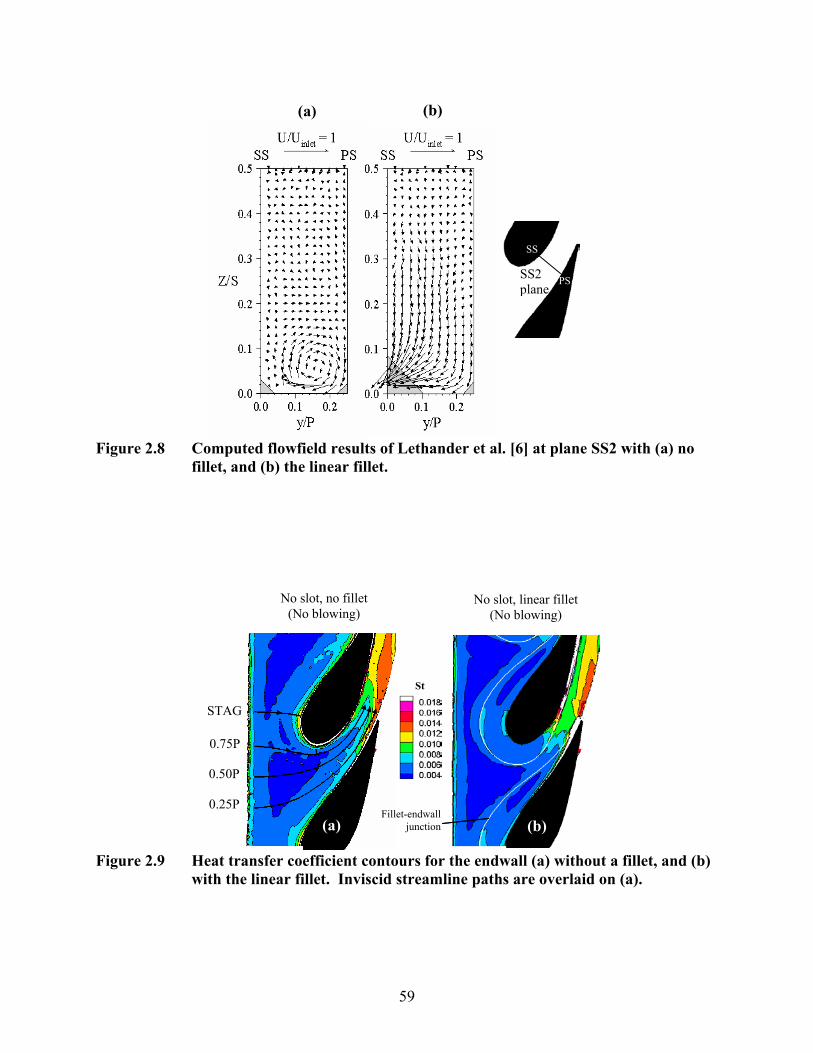
59
Figure 2.8 Computed flowfield results of Lethander et al. [6] at plane SS2 with (a) no
fillet, and (b) the linear fillet.
Figure 2.9 Heat transfer coefficient contours for the endwall (a) without a fillet, and (b)
with the linear fillet. Inviscid streamline paths are overlaid on (a).
St
(a)
STAG
0.25P
0.75P
0.50P
No slot, no fillet (No blowing)
No slot, linear fillet (No blowing)
Fillet-endwall junction (b)
(b)
SS2 plane
SS
PS
(a)

60
Figure 2.10 Heat transfer coefficients without upstream slot blowing, extracted along the
inviscid streamline approaching the vane stagnation (see Figure 2.9a).
Figure 2.11 Heat transfer coefficients at the throat for no upstream slot blowing.
0.002
0.004
0.006
0.008
0.01
0.012
0.014
0.016
0.018
0 0.04 0.08 0.12 0.16
No fillet, no blowingLinear fillet, no blowing
St
y/C
VAN
E SS
VAN
E PS
y
0.002
0.004
0.006
0.008
0.01
0.012
0.014
0.016
0.018
-0.35 -0.3 -0.25 -0.2 -0.15 -0.1 -0.05 0
No fillet, no blowingLinear fillet, no blowing
s/C
St
VA
NE
STAG
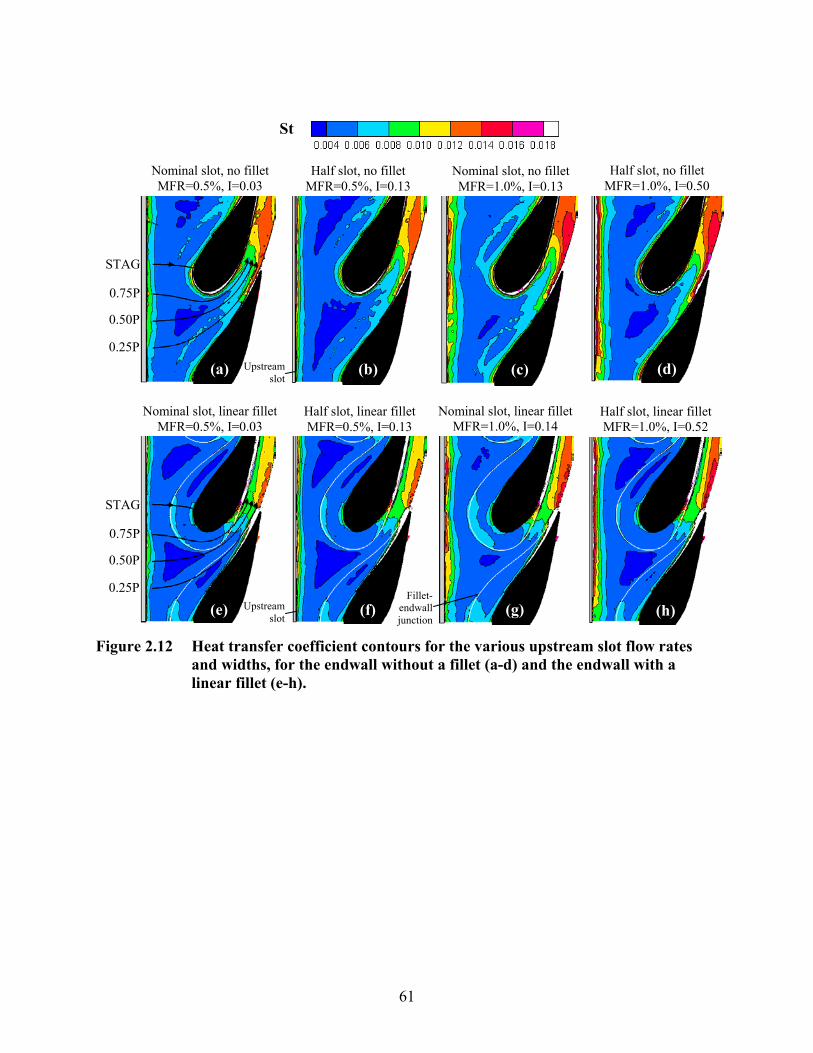
61
Figure 2.12 Heat transfer coefficient contours for the various upstream slot flow rates
and widths, for the endwall without a fillet (a-d) and the endwall with a linear fillet (e-h).
0.25P
0.50P
0.75P
STAG
Nominal slot, linear fillet MFR=0.5%, I=0.03
(e)
Half slot, linear fillet MFR=1.0%, I=0.52
(h)
Half slot, linear fillet MFR=0.5%, I=0.13
(f) Upstream slot
Nominal slot, linear fillet MFR=1.0%, I=0.14
(g) Fillet-
endwall junction
0.25P
0.50P
0.75P
STAG
Nominal slot, no fillet MFR=0.5%, I=0.03
(a)
Nominal slot, no fillet MFR=1.0%, I=0.13
(c)
Half slot, no fillet MFR=1.0%, I=0.50
(d)
Half slot, no fillet MFR=0.5%, I=0.13
(b) Upstream slot
St
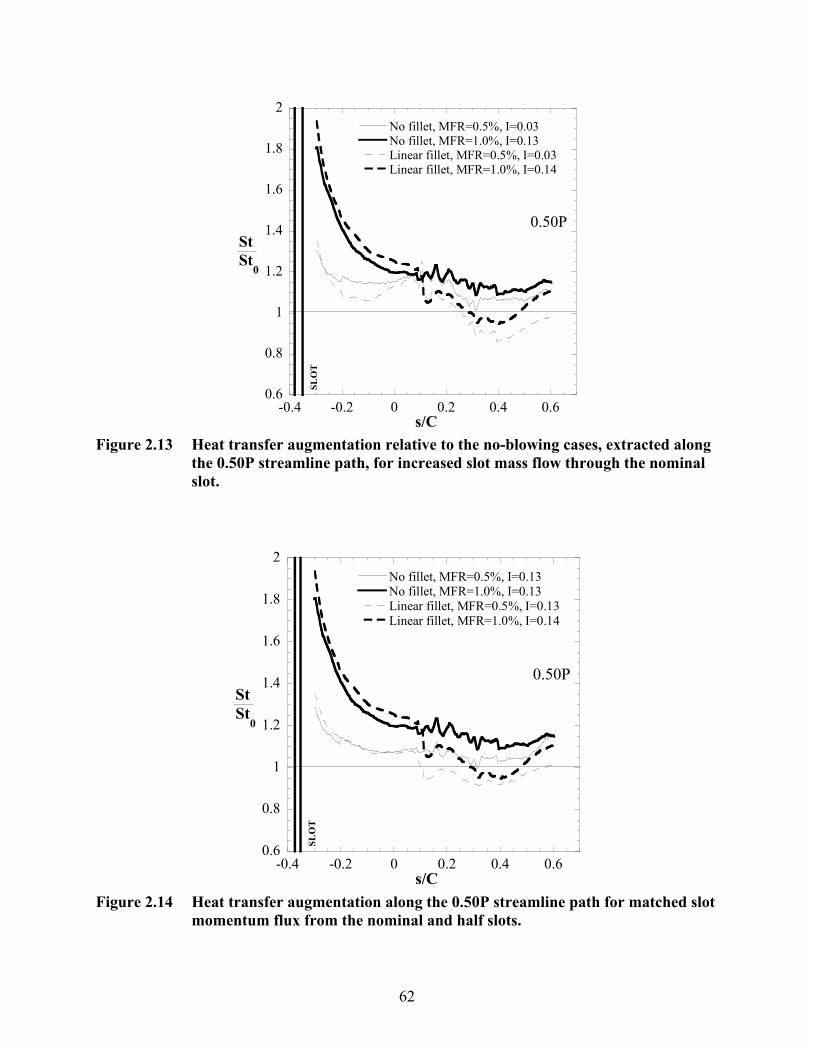
62
0.6
0.8
1
1.2
1.4
1.6
1.8
2
-0.4 -0.2 0 0.2 0.4 0.6
No fillet, MFR=0.5%, I=0.03No fillet, MFR=1.0%, I=0.13Linear fillet, MFR=0.5%, I=0.03Linear fillet, MFR=1.0%, I=0.14
s/C
StSt
0
SLO
T
0.50P
Figure 2.13 Heat transfer augmentation relative to the no-blowing cases, extracted along
the 0.50P streamline path, for increased slot mass flow through the nominal slot.
0.6
0.8
1
1.2
1.4
1.6
1.8
2
-0.4 -0.2 0 0.2 0.4 0.6
No fillet, MFR=0.5%, I=0.13No fillet, MFR=1.0%, I=0.13Linear fillet, MFR=0.5%, I=0.13Linear fillet, MFR=1.0%, I=0.14
s/C
StSt
0
SLO
T
0.50P
Figure 2.14 Heat transfer augmentation along the 0.50P streamline path for matched slot
momentum flux from the nominal and half slots.
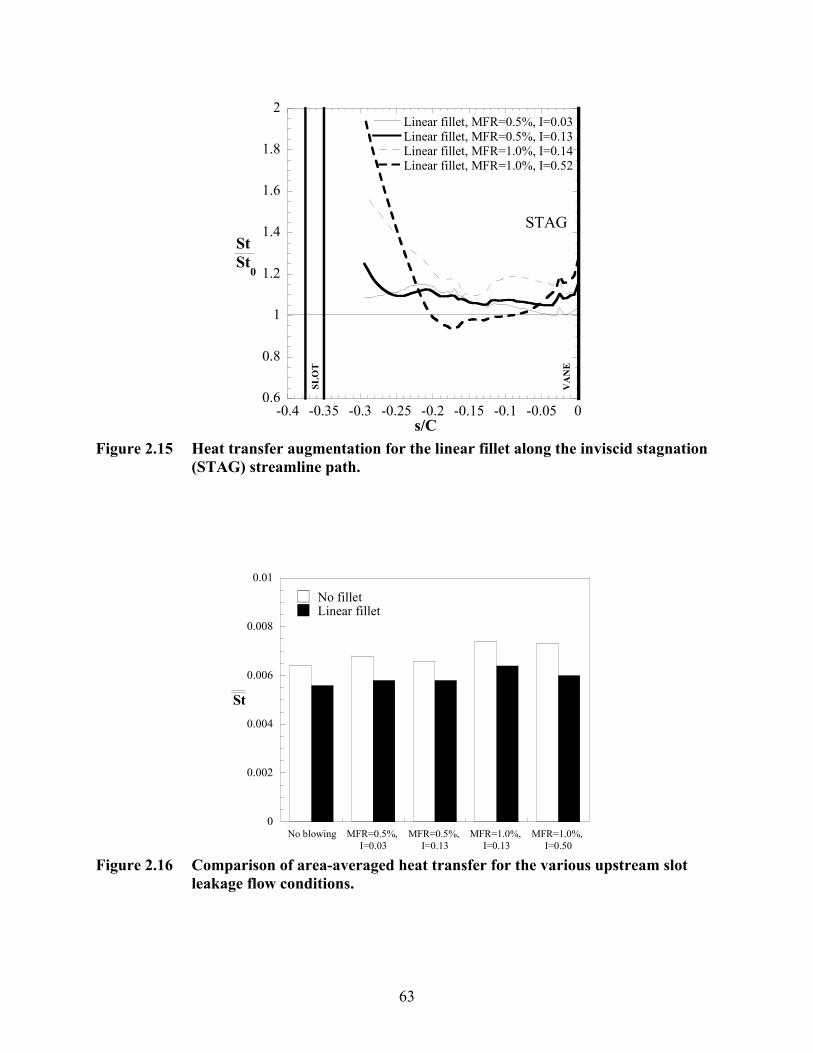
63
0.6
0.8
1
1.2
1.4
1.6
1.8
2
-0.4 -0.35 -0.3 -0.25 -0.2 -0.15 -0.1 -0.05 0
Linear fillet, MFR=0.5%, I=0.03Linear fillet, MFR=0.5%, I=0.13Linear fillet, MFR=1.0%, I=0.14Linear fillet, MFR=1.0%, I=0.52
s/C
StSt
0
SLO
T
STAG
VA
NE
Figure 2.15 Heat transfer augmentation for the linear fillet along the inviscid stagnation
(STAG) streamline path.
0
0.002
0.004
0.006
0.008
0.01
No filletLinear fillet
No blowing MFR=0.5%, I=0.03
MFR=0.5%, I=0.13
MFR=1.0%, I=0.13
MFR=1.0%, I=0.50
St
Figure 2.16 Comparison of area-averaged heat transfer for the various upstream slot
leakage flow conditions.
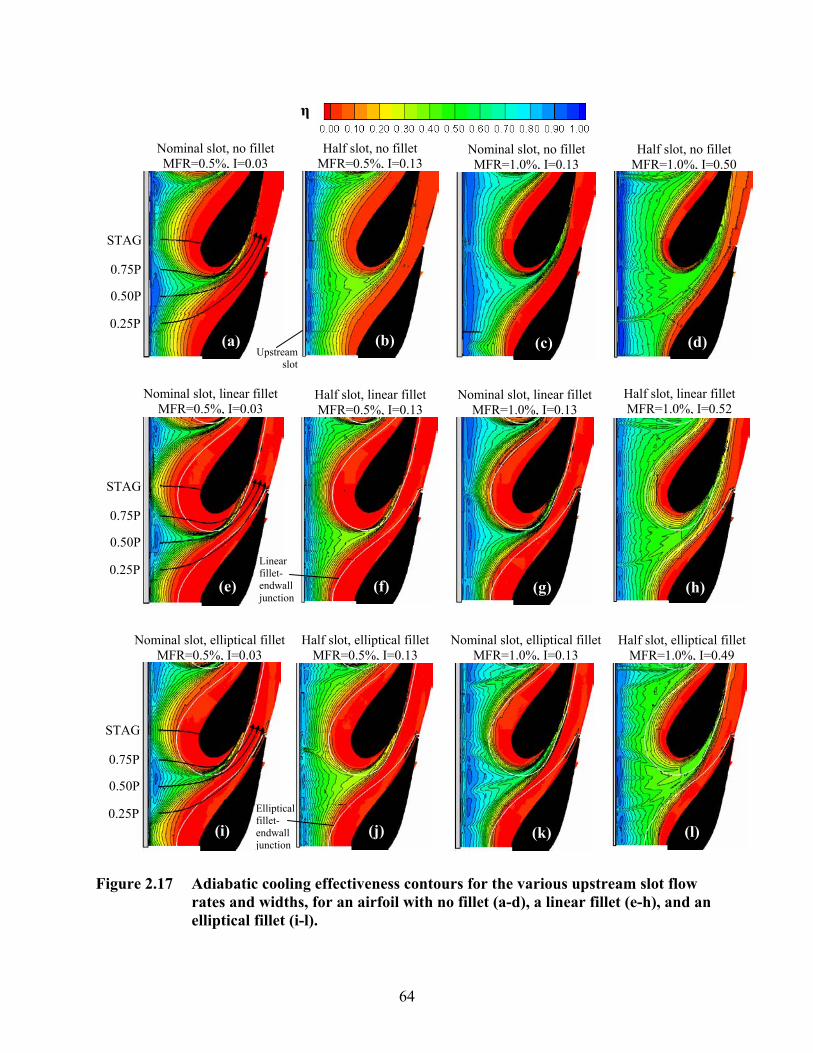
64
Figure 2.17 Adiabatic cooling effectiveness contours for the various upstream slot flow rates and widths, for an airfoil with no fillet (a-d), a linear fillet (e-h), and an elliptical fillet (i-l).
Nominal slot, linear fillet MFR=1.0%, I=0.13
(g)
Half slot, linear fillet MFR=1.0%, I=0.52
(h)
Nominal slot, elliptical fillet MFR=1.0%, I=0.13
(k)
Half slot, elliptical fillet MFR=1.0%, I=0.49
(l) (i)
0.75P
0.50P
0.25P
STAG
Nominal slot, elliptical fillet MFR=0.5%, I=0.03
Half slot, elliptical fillet MFR=0.5%, I=0.13
(j) Elliptical fillet-endwall junction
Nominal slot, linear fillet MFR=0.5%, I=0.03
(e)
0.75P
0.50P
0.25P
STAG
Half slot, linear fillet MFR=0.5%, I=0.13
Linear fillet-endwall junction
(f)
(d)
Half slot, no fillet MFR=1.0%, I=0.50
(c)
Nominal slot, no fillet MFR=1.0%, I=0.13
η
Nominal slot, no fillet MFR=0.5%, I=0.03
0.75P
0.50P
0.25P (a)
STAG
Half slot, no fillet MFR=0.5%, I=0.13
(b) Upstream
slot
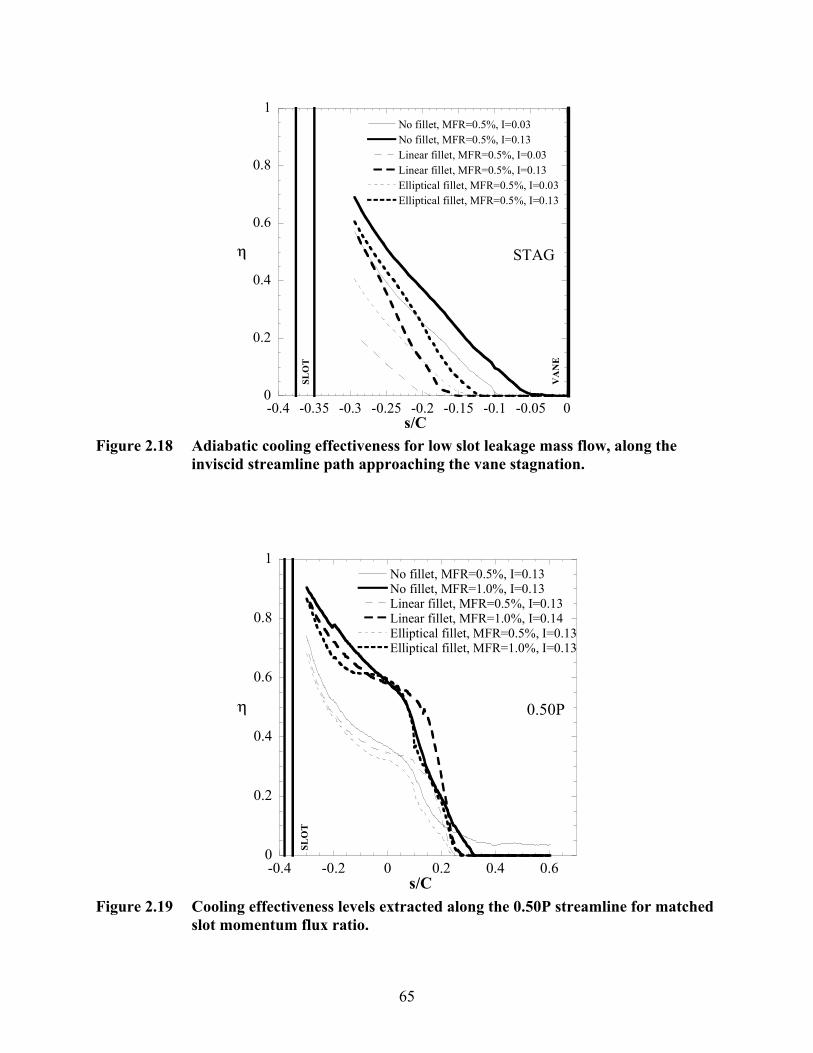
65
0
0.2
0.4
0.6
0.8
1
-0.4 -0.35 -0.3 -0.25 -0.2 -0.15 -0.1 -0.05 0
No fillet, MFR=0.5%, I=0.03No fillet, MFR=0.5%, I=0.13Linear fillet, MFR=0.5%, I=0.03Linear fillet, MFR=0.5%, I=0.13Elliptical fillet, MFR=0.5%, I=0.03Elliptical fillet, MFR=0.5%, I=0.13
s/C
η
SLO
T
STAG
VA
NE
Figure 2.18 Adiabatic cooling effectiveness for low slot leakage mass flow, along the
inviscid streamline path approaching the vane stagnation.
0
0.2
0.4
0.6
0.8
1
-0.4 -0.2 0 0.2 0.4 0.6
No fillet, MFR=0.5%, I=0.13No fillet, MFR=1.0%, I=0.13Linear fillet, MFR=0.5%, I=0.13Linear fillet, MFR=1.0%, I=0.14Elliptical fillet, MFR=0.5%, I=0.13Elliptical fillet, MFR=1.0%, I=0.13
s/C
η
SLO
T
0.50P
Figure 2.19 Cooling effectiveness levels extracted along the 0.50P streamline for matched
slot momentum flux ratio.
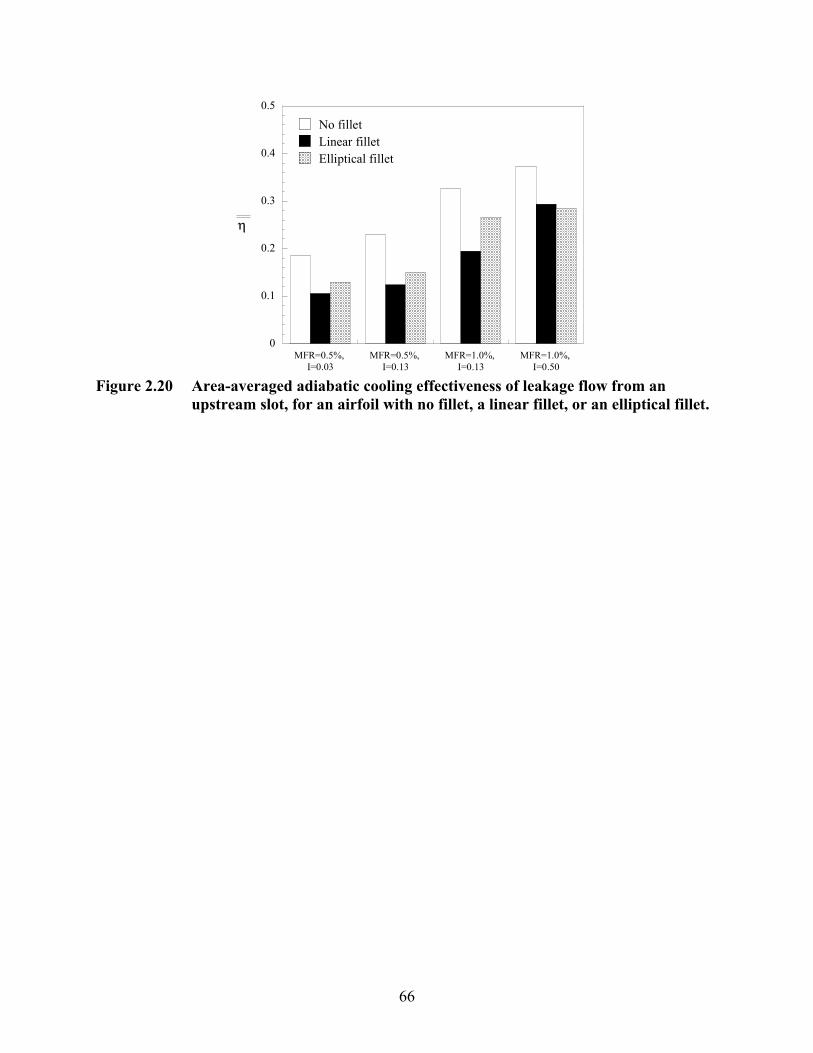
66
0
0.1
0.2
0.3
0.4
0.5
No filletLinear filletElliptical fillet
MFR=0.5%, I=0.03
MFR=0.5%, I=0.13
MFR=1.0%, I=0.13
MFR=1.0%, I=0.50
η
Figure 2.20 Area-averaged adiabatic cooling effectiveness of leakage flow from an
upstream slot, for an airfoil with no fillet, a linear fillet, or an elliptical fillet.