Embed Size (px)
Citation preview
An ESRI ® White Paper • May 2007
ESRI® Data & Maps 2006
ESRI 380 New York St., Redlands, CA 92373-8100 USA TEL 909-793-2853 • FAX 909-793-5953 • E-MAIL [email protected] • WEB www.esri.com

Copyright © 2007 ESRI All rights reserved. Printed in the United States of America. The information contained in this document is the exclusive property of ESRI. This work is protected under United States copyright law and other international copyright treaties and conventions. No part of this work may be reproduced or transmitted in any form or by any means, electronic or mechanical, including photocopying and recording, or by any information storage or retrieval system, except as expressly permitted in writing by ESRI. All requests should be sent to Attention: Contracts and Legal Services Manager, ESRI, 380 New York Street, Redlands, CA 92373-8100 USA. The information contained in this document is subject to change without notice. ESRI, the ESRI globe logo, ArcGIS, ArcView, ArcEditor, ArcInfo, ArcIMS, ArcSDE, StreetMap, ArcGrid, ArcXML, Community, ArcReader, ArcCatalog, www.esri.com, and @esri.com are trademarks, registered trademarks, or service marks of ESRI in the United States, the European Community, or certain other jurisdictions. Other companies and products mentioned herein may be trademarks or registered trademarks of their respective trademark owners.
J-9509
ESRI White Paper i www.esri.com/data
ESRI Data & Maps 2006
An ESRI White Paper Contents Page Overview............................................................................................... 1
Geographies .................................................................................... 2 United States ............................................................................. 3 World ........................................................................................ 3 Europe ....................................................................................... 3 Canada....................................................................................... 4 Mexico ...................................................................................... 4
United States Categories ................................................................. 4 Census ....................................................................................... 4 Hydrography ............................................................................. 4 Landmarks................................................................................. 4 Transportation ........................................................................... 5 Other ......................................................................................... 5
Boundaries ...................................................................................... 5 Basemaps ........................................................................................ 5 Cultural, Administrative ................................................................. 6 SRTM, GTOPO30, and Other Elevation and Image Data.............. 6
StreetMap USA Data and Help............................................................. 8 Using StreetMap USA .......................................................................... 8 Smart Data Compression Format.......................................................... 9 Data Distribution Application............................................................... 9 Metadata................................................................................................ 9 Global Elevation Tiling Scheme........................................................... 10 ESRI Data & Maps 2006: Content........................................................ 11
Help................................................................................................. 11 HTML-Based Help System....................................................... 11
Map Documents, Group Layers, and Background.......................... 11 Map Documents, Group Layers, Published Map Documents, and Background Folders ......................................................... 11
ESRI Data & Maps 2006
J-9509
May 2007 ii www.esri.com/data
Contents Page
United States Census....................................................................... 12 108th Congressional Districts ................................................... 12 109th Congressional Districts ................................................... 12 Counties .................................................................................... 12 County Boundaries.................................................................... 12 Counties (Generalized) ............................................................. 12 County Population Estimates 2000 (table) ............................... 12 County Population Estimates 1990 (table) ............................... 12 States ......................................................................................... 13 State Boundaries ....................................................................... 13 States (Generalized) .................................................................. 13 Census Tracts ............................................................................ 13 Census Block Groups................................................................ 13 Census Block Centroid Populations.......................................... 14 Census and Other Attributes ..................................................... 14 Census Feature Class Codes (table).......................................... 14 Cities ......................................................................................... 14 National Atlas of the United States........................................... 14
Cities ................................................................................... 14 Urbanized Areas.................................................................. 14
Populated Place Areas............................................................... 14 Populated Place Points.............................................................. 14 Census Urbanized Areas ........................................................... 15 Core Based Statistical Areas..................................................... 15 Telephone Area Code Boundaries ............................................ 15 ZIP Code Areas (Five-Digit) .................................................... 15 ZIP Code Areas (Three-Digit) .................................................. 15 ZIP Code Points ........................................................................ 16
United States Hydrography............................................................. 16 Drainage Systems (Generalized)............................................... 16 Lakes (Generalized) .................................................................. 16 Rivers (Generalized) ................................................................. 16 Rivers and Streams ................................................................... 16 Water Bodies............................................................................. 16 National Atlas of the United States........................................... 17
Water Feature Areas ........................................................... 17 Water Feature Lines............................................................ 17
United States Landmarks ................................................................ 17 Geographic Names Information System Cultural and Physical Points....................................................................................... 17
Buildings, Cemeteries, Churches, Golf Locales, Hospitals, Locales, Populated Places, Schools, and Summits ........... 17
Hospitals ................................................................................... 17
ESRI Data & Maps 2006
J-9509
ESRI White Paper iii www.esri.com/data
Contents Page Major Parks............................................................................... 17 Institutions ................................................................................ 18 Large Area Landmarks ............................................................ 18 Parks ......................................................................................... 18 Recreation Areas ...................................................................... 18 National Atlas of the United States........................................... 18
Historic Earthquakes........................................................... 18 Volcanoes............................................................................ 18
United States Other ......................................................................... 18 State Plane Zones for NAD 1927 and NAD 1983 .................... 18 National Atlas of the United States........................................... 19
Federal and Indian Land Areas ........................................... 19 Federal Land Lines ............................................................. 19 Public Land Survey............................................................. 19
USGS Topographic Quadrangle Series Indexes ....................... 19 1:24,000 .............................................................................. 19 1:100,000 ............................................................................ 19 1:250,000 ............................................................................ 19
United States Transportation........................................................... 19 Highways .................................................................................. 19 Major Highways........................................................................ 20 Major Roads.............................................................................. 20 Airports .................................................................................... 20 Transportation Terminals.......................................................... 20 National Atlas of the United States........................................... 20
Airports ............................................................................... 20 National Transportation Atlas................................................... 20
Interstate Highways ............................................................ 20 Railroads ............................................................................. 20
United States StreetMap USA Streets............................................. 21 Detailed Streets ......................................................................... 21
United States StreetMap USA StreetMap Background .................. 21 Cultural Landmarks .................................................................. 21 Landmark Points ....................................................................... 21 Natural Landmarks.................................................................... 21 Places ........................................................................................ 21 Hydrology ................................................................................. 22 Runways.................................................................................... 22 Schools...................................................................................... 22 USA Background...................................................................... 22 Water Boundaries...................................................................... 22
World .............................................................................................. 22 Countries (Generalized) ............................................................ 22
ESRI Data & Maps 2006
J-9509
May 2007 iv www.esri.com/data
Contents Page Country Boundaries (Generalized) ........................................... 22 Countries 2006.......................................................................... 22 Country Boundaries .................................................................. 23 Administrative Units................................................................. 23 Administrative Unit Boundaries ............................................... 23 Continents ................................................................................. 23 Regions ..................................................................................... 23 CountryWatch Demographics 2000 (table) .............................. 23 Country Memberships of Political Organizations (table) ......... 23 Cities ......................................................................................... 23 Gazetteer ................................................................................... 23 Drainage Systems...................................................................... 23 Lakes ......................................................................................... 24 Rivers ........................................................................................ 24 World Wildlife Fund Terrestrial Ecoregions ............................ 24 World Wildlife Fund Marine Ecoregions ................................. 24 Time Zones ............................................................................... 24 UTM Zones............................................................................... 24 Latitude and Longitude Grids ................................................... 24 Named Latitudes and Longitudes ............................................. 24 Map Background....................................................................... 24
Europe Basemap ............................................................................. 25 List of Countries ....................................................................... 25 Countries ................................................................................... 25 Level 1 Provinces...................................................................... 25 Level 2 Provinces...................................................................... 25 Level 3 Provinces...................................................................... 25 Cities ......................................................................................... 25 Places ........................................................................................ 26 Urbanized Areas........................................................................ 26 Major Roads.............................................................................. 26 Roads......................................................................................... 26 Railroads ................................................................................... 26 Railroad Stations....................................................................... 26 Major Lakes .............................................................................. 26 Major Rivers ............................................................................. 26 Water Bodies............................................................................. 26 Ferries ....................................................................................... 26
Europe Demography ....................................................................... 26 NUTS 0 Demographics............................................................. 26 NUTS 1 Demographics............................................................. 26 NUTS 2 Demographics............................................................. 27 NUTS 3 Demographics............................................................. 27

ESRI Data & Maps 2006
J-9509
ESRI White Paper v www.esri.com/data
Contents Page Canada............................................................................................. 27
Provinces................................................................................... 27 Major Cities .............................................................................. 27 Rural Cities ............................................................................... 27 Urban Cities .............................................................................. 27 Municipalities ........................................................................... 27 Regional Municipalities ............................................................ 28 Indian Reserves......................................................................... 28 Highways .................................................................................. 28 Railways.................................................................................... 28 FSA Postal Centroids................................................................ 28 Telephone Area Code Boundaries ............................................ 28 National Parks........................................................................... 28 Provincial Parks ........................................................................ 28 Water Bodies............................................................................. 28
Mexico ............................................................................................ 29 States ......................................................................................... 29 Municipalities ........................................................................... 29 Cities ......................................................................................... 29 Urban Areas .............................................................................. 29 Roads......................................................................................... 29 Railroads ................................................................................... 29 Rivers and Streams ................................................................... 29 Water Bodies............................................................................. 29 Contours.................................................................................... 29
Elevation Data—Global Shaded Relief .......................................... 29 SRTM Shaded Relief ............................................................... 29 GTOPO30 Shaded Relief ......................................................... 29
Image Data—Global Imagery 150-Meter Resolution..................... 30 Africa (150 m)—EarthSat NaturalVue Global Landsat Mosaic..................................................................................... 30 Asia-East (150 m)—EarthSat NaturalVue Global Landsat Mosaic..................................................................................... 30 Asia-West (150 m)—EarthSat NaturalVue Global Landsat Mosaic..................................................................................... 30 Australia (150 m)—EarthSat NaturalVue Global Landsat Mosaic..................................................................................... 30 Europe (150 m)—EarthSat NaturalVue Global Landsat Mosaic..................................................................................... 30 North America-North (150 m)—EarthSat NaturalVue Global Landsat Mosaic ....................................................................... 30 North America-South (150 m)—EarthSat NaturalVue Global Landsat Mosaic ....................................................................... 30
ESRI Data & Maps 2006
J-9509
May 2007 vi www.esri.com/data
Contents Page
South America (150 m)—EarthSat NaturalVue Global Landsat Mosaic ....................................................................... 30
Elevation Data—Global Digital Elevation Model.......................... 31 SRTM Global Digital Elevation Model ................................... 31 GTOPO30 Global Digital Elevation Model ............................ 31
Elevation Data—Data Quality ........................................................ 31 Global Elevation Index ............................................................. 31 GTOPO30 Source Index ........................................................... 31 SRTM Void Areas .................................................................... 31
Elevation Data—Water Bodies....................................................... 31 SRTM Water Bodies ................................................................ 31 GTOPO30 Water Bodies ......................................................... 32
Elevation Data—World Elevation .................................................. 32 Global Digital Elevation Model (ETOPO2) ............................. 32 Global Digital Elevation Model (GTOPO30)........................... 32 World Topography and Bathymetry ......................................... 32
Image Data—World Images ........................................................... 32 World Cloud Free ..................................................................... 32 World at Night .......................................................................... 32 World with Clouds.................................................................... 33 World with Ice .......................................................................... 33 World WorldSat Color Shaded Relief ...................................... 33
Appendix A: ESRI Data & Maps 2006 Data Update ........................... 34
J-9509
ESRI Data & Maps 2006
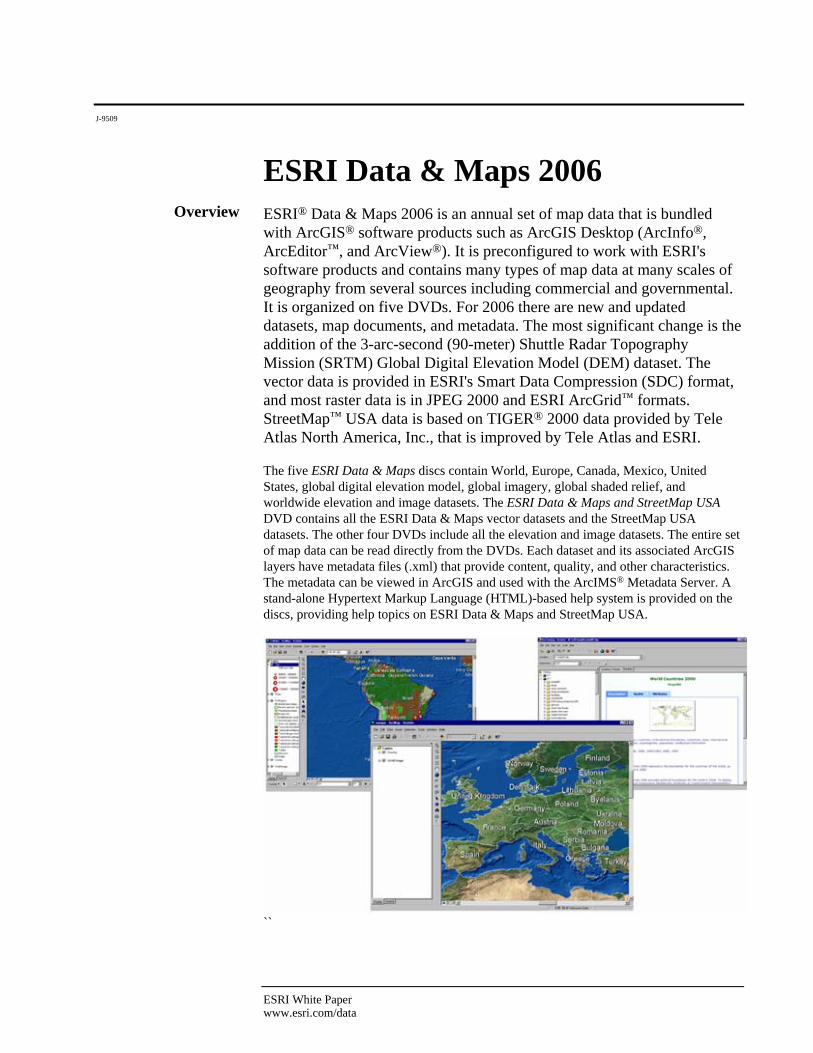
Overview ESRI® Data & Maps 2006 is an annual set of map data that is bundled with ArcGIS® software products such as ArcGIS Desktop (ArcInfo®, ArcEditor™, and ArcView®). It is preconfigured to work with ESRI's software products and contains many types of map data at many scales of geography from several sources including commercial and governmental. It is organized on five DVDs. For 2006 there are new and updated datasets, map documents, and metadata. The most significant change is the addition of the 3-arc-second (90-meter) Shuttle Radar Topography Mission (SRTM) Global Digital Elevation Model (DEM) dataset. The vector data is provided in ESRI's Smart Data Compression (SDC) format, and most raster data is in JPEG 2000 and ESRI ArcGrid™ formats. StreetMap™ USA data is based on TIGER® 2000 data provided by Tele Atlas North America, Inc., that is improved by Tele Atlas and ESRI. The five ESRI Data & Maps discs contain World, Europe, Canada, Mexico, United States, global digital elevation model, global imagery, global shaded relief, and worldwide elevation and image datasets. The ESRI Data & Maps and StreetMap USA DVD contains all the ESRI Data & Maps vector datasets and the StreetMap USA datasets. The other four DVDs include all the elevation and image datasets. The entire set of map data can be read directly from the DVDs. Each dataset and its associated ArcGIS layers have metadata files (.xml) that provide content, quality, and other characteristics. The metadata can be viewed in ArcGIS and used with the ArcIMS® Metadata Server. A stand-alone Hypertext Markup Language (HTML)-based help system is provided on the discs, providing help topics on ESRI Data & Maps and StreetMap USA.
``
ESRI White Paper www.esri.com/data

ESRI Data & Maps 2006
J-9509
May 2007 2 www.esri.com/data
A brief description of each disc that comprises ESRI Data & Maps 2006 follows.
ESRI Data & Maps—Data & Maps and StreetMap USA DVD contains the StreetMap USA datasets and files; the World, Europe, Canada, and Mexico data; and the United States data that includes the U.S. datasets needed to support the StreetMap functionality and features.
ESRI Data & Maps—Global Imagery and Shaded Relief: North and South America
DVD contains global imagery raster data at 150-meter resolution, global shaded relief derived from the SRTM Global Digital Elevation Model and GTOPO30 Global Digital Elevation Model, and water bodies from SRTM and GTOPO30 for North and South America.
ESRI Data & Maps—Global Imagery and Shaded Relief: Europe and Africa DVD
contains global imagery raster data at 150-meter resolution, global shaded relief derived from the SRTM Global Digital Elevation Model and GTOPO30 Global Digital Elevation Model, and water bodies from SRTM and GTOPO30 for Europe and Africa.
ESRI Data & Maps—Global Imagery and Shaded Relief: Asia and Australia DVD
contains global imagery raster data at 150-meter resolution, global shaded relief derived from the SRTM Global Digital Elevation Model and GTOPO30 Global Digital Elevation Model, and water bodies from SRTM and GTOPO30 for Asia and Australia.
ESRI Data & Maps—Elevation and Image Data: World DVD contains the SRTM
Global Digital Elevation Model, GTOPO30 Global Digital Elevation Model, water bodies from SRTM and GTOPO30, SRTM void areas, two index datasets, and other worldwide elevation and image datasets.
In addition, these DVDs contain the ESRI Data & Maps and StreetMap USA HTML-based help system, map documents (.mxd), group layers (.lyr), published map documents (.pmf), and background folders. The ESRI Data & Maps and StreetMap USA HTML-based help system provides help topics about ESRI Data & Maps, what is new, and redistribution rights as well as using the StreetMap functionality and StreetMap USA data. Please review the redistribution rights help topic before redistributing any datasets.
Geographies The geographies—World, Europe, Canada, Mexico, and United States—plus the geographies on the ESRI Data & Maps—Elevation and Image Data: World DVD and the three ESRI Data & Maps—Global Imagery and Shaded Relief DVDs are provided with map documents, group layers, published map documents, and background folders. World, Europe, Canada, Mexico, and United States geographies also have ArcXML™ files. The group layer contains the geography's datasets that are symbolized and labeled for display at scales ranging from nationwide to local areas. The map document contains the same group layer prepackaged within an existing map document. The published map document is a published version of the map document provided for ArcReader™ users. The background folder contains additional datasets that support the map documents and group
ESRI Data & Maps 2006
J-9509
ESRI White Paper 3 www.esri.com/data
layers. The ArcXML file is provided for ArcIMS Route Server users. These maps are a great way to view the data and are readily usable by anyone with ArcGIS Desktop. The vector and table datasets are in SDC 2 format. The nonvector datasets are in ESRI ArcGrid format and various image formats such as JPEG 2000. Each dataset has a metadata document (.xml) providing complete documentation for the dataset as well as one or more associated ArcGIS layer files displaying symbols and classifications for the dataset. Each ArcGIS layer has a metadata file providing complete documentation for the ArcGIS layer. Each SDC dataset also includes a projection file (.prj) storing the coordinate system information. Each dataset may also have other supporting files. ESRI Data & Maps contains many types of map data at many scales of geography and is useful for general-purpose basemaps and for more specific uses. Whether you need to create basemaps, conduct market analysis, or profile your customers, it provides accurate data to meet your needs. The data can make a new user productive and the software useful as soon as it is installed. For each geography included, the significant basemap layers are boundaries, cities, rivers, and roads. This basemap information is available for the World, Canada, Europe, Mexico, and the United States. In addition, where possible, demographic data is provided for subnational boundaries such as states, counties, or their equivalents. World, Europe, and Mexico datasets are in the World Geodetic System of 1984 (WGS84) datum. United States datasets are in the North American Datum of 1983 (NAD83) and WGS84 datums, and Canada datasets are in the NAD83 datum.
United States In the United States, many datasets have been updated to their most current versions. This includes the replacement of all Tele Atlas census and landmark layers with their recent versions. In addition, Health Forum American Hospital Association (AHA) Annual Survey Database hospital locations and many of the National Atlas of the United States datasets were also updated. At the world level, countries and their population values were updated to reflect the current political state of the world, and boundary line datasets were added for administrative units and countries. For Europe, all AND International Publishers N.V. basemap layers have been updated as well as the socioeconomic and demographic thematic data at the Nomenclature des Unités Territoriales Statistiques (NUTS) 0, 1, 2, and 3 levels. In Canada and Mexico, many of the data layers have also been updated. At the global level is the addition of the 3-arc-second (90-meter) SRTM dataset that includes the SRTM Global DEM with all void areas filled, shaded relief derived from the DEM, and water bodies.
World For the world, there are cities, countries, and subcountry administrative boundaries. Many helpful world reference datasets include time zones, Universal Transverse Mercator (UTM) zones, gazetteer, continents, regions, country and subcountry administrative boundary lines, latitude and longitude grids, a map background, and country memberships in political organizations (table). World datasets of special interest include World Ecoregions from the World Wildlife Fund Conservation Science Program and CountryWatch Demographics 2000 (table) with more than 40 attributes on geography, population, social indicators, economy, energy, and the environment.
Europe Data for Europe includes 15 basemap layers from AND International Publishers N.V., with the major water dataset split into two datasets, major lakes and major rivers, and four map layers of socioeconomic and demographic data at the NUTS 0, 1, 2, and 3 levels from Michael Bauer Research GmbH and EuroGeographics.
ESRI Data & Maps 2006
J-9509
May 2007 4 www.esri.com/data
The AND data is a comprehensive set of basemap data for Europe from large-scale source materials that provides high-quality layers for cartographic presentation and basic geographic analysis. This data includes country and province boundaries, water features, cities, urbanized areas, a connected road network, railroads, railroad stations, ferries, and thousands of named places. The NUTS 0-, 1-, 2-, and 3-level datasets result from socioeconomic and demographic data collected across Europe by Michael Bauer Research and boundary data provided by EuroGeographics and, in some areas, by AND International Publishers N.V. Michael Bauer Research established the data by reviewing relevant regional data and projecting the respective trends. To provide the best possible value to the user regarding comparability, all country results were projected by mathematical methods to the required geographic level, homogeneous base years, categories (e.g., age bands), and currency (Euro). The datasets provide attributes for name, NUTS codes, population size, population by sex, population by age groups, households, average number of persons per household, population density and growth, stock of dwellings, purchasing power, gross domestic product, number employed, and area.
Canada For Canada, data from DMTI Spatial Inc. provides 14 datasets, which include provinces, major cities, rural cities, urban cities, municipalities, regional municipalities, Indian reserves, highways, railroads, Forward Sortation Area (FSA) postal centroids, water bodies, national parks, provincial parks, and telephone area code boundaries.
Mexico For Mexico, data from Sistemas de Información Geográfica, S.A. de C.V. (SIGSA) provides nine datasets covering Mexico with great detail. The datasets include states, cities, municipalities, urban areas, roads, railroads, rivers and streams, water bodies, and contours.
United States Categories
A large amount of data is included for the United States. United States refers to the 50 states and the District of Columbia with nearly half of the datasets containing Puerto Rico and many with U.S. Virgin Islands, commonwealths, territories, and freely associated states. There are 65 datasets for the United States organized into the five categories—census, hydrography, landmarks, transportation, and other—plus the StreetMap USA data, that is located beside these five categories.
Census For the census category, the following datasets are included: U.S. Census tracts, block groups, block centroid populations, urbanized areas, and feature class codes; state and county boundaries, boundary lines, and generalized versions of these boundaries; cities, populated place areas, and points; Core Based Statistical Areas (CBSA); ZIP Codes™ (five-digit, three-digit, and points); 108th and 109th congressional districts; 2000 and 1990 county population estimates; telephone area code boundaries; and National Atlas of the United States cities and urbanized areas.
Hydrography For the hydrography category, the following datasets are included: drainage systems, lakes, and rivers; rivers and streams and water bodies from the National Hydrography Dataset; and National Atlas of the United States water feature lines and areas.
Landmarks For the landmarks category, the following datasets are included: major parks and Health Forum AHA Annual Survey Database hospital locations; Geographic Names Information System (GNIS) cultural and physical points of buildings, cemeteries, churches, golf locales, hospitals, locales, populated places, schools, and summits; Tele Atlas institutions,
ESRI Data & Maps 2006
J-9509
ESRI White Paper 5 www.esri.com/data
large area landmarks, parks, and recreation areas; and National Atlas of the United States historic earthquakes and volcanoes.
Transportation For the transportation category, the following datasets are included: highways, major highways, and major roads; Tele Atlas airports and transportation terminals; National Atlas of the United States airports; and National Transportation Atlas interstate highways and railroads.
Other For the other category, the following datasets are included: NAD 1983 and 1927 State Plane Zones; National Atlas of the United States federal land lines, federal and Indian land areas, and public land survey; and United States Geological Survey (USGS) Topographic Quadrangle Series indexes (1:24,000, 1:100,000, and 1:250,000). For the United States, all layers of census geography are current with Census 2000. Counties and Core Based Statistical Areas are current with 2002 census TIGER/Line® boundaries. All census-derived attributes are from U.S. Census 2000 Summary File 1 (SF1) and/or Census 2000 TIGER/Line documentation. Each year, ESRI Data & Maps includes the latest data from Tele Atlas North America, Inc. This includes states; counties; Core Based Statistical Areas; populated place areas; ZIP Codes (five-digit, three-digit, and points); census tracts, block groups, and block centroid populations; telephone area codes; institutions; large area landmarks; parks; recreation areas; airports; major roads; and transportation terminals.
Boundaries Boundaries for the United States include state and county boundaries, boundary lines, and generalized versions of these boundaries; CBSA and ZIP Code boundaries; and U.S. Census Bureau census tracts, block groups, and urbanized areas. A selection of Census 2000 attributes from SF1 is included with basic demographic information for state and county boundaries and U.S. Census Bureau census tracts and block groups. In addition, 2005 population estimates from ESRI Community™ Data are included for each of these boundary datasets to enable basic evaluation of growth and decline for an area as small as a neighborhood. Attributes from the 1997 Census of Agriculture from the U.S. Department of Agriculture (USDA) are provided for states and counties. For the most detailed assessment of where people live, block centroids and their 2000 populations are included for the more than eight million census blocks.
Basemaps Basemap information for the United States includes the detailed boundary datasets as well as cities, populated places, and a number of line and point feature sources. Major roads from Tele Atlas, including federal, state, and county highways; highways and major highways from StreetMap USA Streets; and railroads from the National Transportation Atlas, provide a detailed look at the transportation network. More than three million water features from the National Hydrography Dataset are provided in two national datasets for a detailed and comprehensive water reference. Water bodies that include lakes as small as six acres and rivers as narrow as 100 feet wide are represented as polygons. Rivers and streams are interconnected, including through bodies of water, and in general include streams longer than one mile. In contrast, with each generalized for small-scale maps, there are the drainage systems, lakes, and rivers datasets.
ESRI Data & Maps 2006
J-9509
May 2007 6 www.esri.com/data
Cultural, Administrative
Ten datasets incorporating cultural, administrative, and natural geographic content from the National Atlas of the United States are included and many contain data for Puerto Rico and the U.S. Virgin Islands. The cultural datasets include airports, cities and towns, and urbanized areas. The administrative datasets include federal and Indian lands (e.g., Bureau of Indian Affairs and Tennessee Valley Authority), linear federally owned land features (e.g., national parkways and wild and scenic rivers), and public land survey (e.g., donation lands, land grants, and private and public surveys of public lands). The natural datasets include linear water features (e.g., aqueducts, canals, intracoastal waterways, and streams), areal water features (e.g., bays, glaciers, lakes, and swamps), historic earthquakes, and volcanoes. Other data for the United States includes airports, 108th and 109th congressional districts, State Plane Zones, Topographic Quadrangle Series indexes, parks, and large-area landmarks. Airports include airport boundaries and the layout of the runways of the airports. The congressional districts represent the boundaries for the U.S. Congressional Districts. State Plane Zones show the approximation of the actual State Plane Coordinate System Zone boundaries for each datum. Topographic Quadrangle Series indexes represent the geographic extents of the 1:24,000, 1:100,000, and 1:250,000 USGS topographic maps. Parks identify large units of public land including all national parks, national forests, most state parks, and a number of local parks. Large-area landmarks include boundaries such as military lands, prisons, and educational lands. Point features include hospitals from the Health Forum AHA Annual Survey Database, landmark locations from Tele Atlas, cultural and physical features from USGS, and population and housing data from U.S. Census 2000 SF1. Tele Atlas institutions, transportation terminals, and recreation areas are named locations and can be used for reference when making a map of an urban area. The latest cultural and physical features from the USGS Geographic Names Information System are divided into nine datasets because of the number of features involved. The completeness of this data is dependent on the currency of the map the features were drawn from, but often this data can be a source of features that are not found in other locations. U.S. Census 2000 SF1 was used to create cities and populated places.
SRTM, GTOPO30, and Other Elevation
and Image Data
ESRI Data & Maps includes approximately 20 GB of elevation and image data organized on four DVDs. The majority of this data, added to ESRI Data & Maps in 2006, is derived from the National Aeronautics and Space Administration (NASA) and National Geospatial-Intelligence Agency (NGA) 3-arc-second (90-meter) SRTM dataset that is distributed by USGS Earth Resources Observation and Science (EROS) Data Center. The version of the SRTM data used by ESRI for processing is the version 2 "Finished" data that NGA created by subsampling the SRTM 1-arc-second data. The SRTM data includes a global digital elevation model with all void areas filled, shaded relief derived from the digital elevation model, void areas that reveal where ESRI filled the void areas in the original source SRTM 3-arc-second data, and water bodies. GTOPO30 data was used to complete the global DEM. Much effort was applied to correct elevation data voids and provide complete coverage of the globe. In addition, many of the raster datasets included in 2005, such as the Global Imagery 150-meter Resolution and World WorldSat Color Shaded Relief, have been carried over to 2006. The SRTM Global Digital Elevation Model represents an elevation map with all void areas filled by ESRI from the NASA/NGA SRTM datasets between 60 degrees north and

ESRI Data & Maps 2006
J-9509
ESRI White Paper 7 www.esri.com/data
56 degrees south latitude for geographic visualization on regional, national, and subnational scales. The resolution is 3 arc seconds (90 meters), and the pixel values represent the elevation in meters. SRTM Shaded Relief represents a shaded relief map of the world derived from the SRTM Global DEM. SRTM Void Areas represents those areas without elevation values within the original source SRTM 3-arc-second data. These void areas are a result of radar shadow, layover, and other effects of terrain as well as technical radar interferometry phase unwrapping issues. Elevation values for these areas in the SRTM Global DEM were estimated (i.e., filled in) by ESRI using the Delta Surface Fill (DSF) method with GTOPO30 data as the fill-in source. SRTM Water Bodies represents the lakes, rivers, and oceans from the SRTM Global DEM. Elevation values within lakes and oceans were set to be a constant elevation for each feature. Elevation values within rivers were reset to ensure the proper flow direction. GTOPO30 data completes the areas of the globe (north of 60 degrees north and south of 56 degrees south latitude) not covered by the SRTM coverage area for the global digital elevation model, shaded relief, and water bodies datasets. GTOPO30 data was developed by the USGS EROS Data Center in 1996 from a variety of data sources. For the non-SRTM coverage area of the world, GTOPO30 Global Digital Elevation Model represents gridded 30-arc-second (approximately 1-kilometer) elevation, GTOPO30 Shaded Relief represents a basemap layer displaying shaded relief information, and GTOPO30 Water Bodies represents the lakes, rivers, and oceans. The GTOPO30 Source Index represents the geographic extents of the data sources used to create the GTOPO30 Digital Elevation Model. Because of the data storage requirements for the SRTM and GTOPO30 datasets and to best organize them, the datasets are compressed and split into a 12-tile scheme with three columns and four rows. The Global Elevation Index represents the geographic extent of the SRTM and GTOPO30 tiled datasets (see the Global Elevation Tiling Scheme section below for more information). The SRTM Global DEM is compressed using lossy JPEG 2000 compression, and the GTOPO30 Global DEM is compressed using lossless JPEG 2000 compression. Global Imagery 150-Meter Resolution is EarthSat® natural-color, Landsat® 7-derived, 150-meter (492 ft.) resolution global imagery covering the entire land area of the earth except the high-latitude polar regions and Antarctica. Because of the size of this dataset, it is divided, by continent or partial continent, into eight areas. The worldwide elevation and image data also includes Global Digital Elevation Model (ETOPO2), Global Digital Elevation Model (GTOPO30), and World Topography and Bathymetry. These datasets provide basemap layers for displaying elevation for geographic analysis on global, continental, and national scales. Global Digital Elevation Model (ETOPO2) is from the National Geophysical Data Center (NGDC) in 2001. Global Digital Elevation Model (GTOPO30) is from the USGS EROS Data Center. Four wonderful images from the NASA Visible Earth program are World Cloud Free, World at Night, World With Clouds, and World With Ice. Each results from mosaicking hundreds of individual satellite images into a complete image of the earth. ESRI georeferenced these datasets to a real-world coordinate system. World WorldSat Color Shaded Relief provides land and ocean floor relief at a cell size of four square kilometers (at the equator).

ESRI Data & Maps 2006
J-9509
May 2007 8 www.esri.com/data
StreetMap USA Data and Help
StreetMap USA consists of two parts—the data known as StreetMap USA and the StreetMap functionality (formerly an extension) that is part of the core functionality of ArcGIS. StreetMap USA is provided as part of ESRI Data & Maps and is located within the USA folder. No license is required to use this data. With the use of StreetMap USA and ArcGIS StreetMap functionality, users can find addresses, quickly create intelligent maps, and perform simple point-to-point or optimized routing across nationwide (U.S.) street networks. The ESRI Data & Maps—Data & Maps and StreetMap USA DVD contains the detailed streets, United States vector datasets, and all other datasets and files that are needed to support the ArcGIS StreetMap functionality of nationwide street map display, address geocoding, routing, and generating travel directions. The detailed streets data is based on TIGER 2000 data enhanced by ESRI and Tele Atlas and prepared for routing within the StreetMap Find Route dialog box. The U.S. datasets needed to support the StreetMap USA functionality include states, cities, airports, drainage, railroads, parks, local landmarks, and more. For more information, the ESRI Data & Maps and StreetMap USA HTML-based help system provides help topics on using the StreetMap functionality, the StreetMap USA data, and its redistribution rights. Open the help.htm file located on any DVD to view the help topics. Additional information about the StreetMap USA data and its redistribution rights is available in the metadata documentation for each dataset (.xml).
Using StreetMap USA
StreetMap USA provides a map document, group layer, published map document, and ArcXML file; address locators and routing service; and all the associated StreetMap USA datasets for these files to work within ArcGIS 9.2. The group layer (StreetMap USA.lyr) contains several layers that have been symbolized and labeled for display at five scale ranges: national, state, regional, local, and detail. The layers display the appropriate types of features within each scale range. The map document (StreetMap USA.mxd) includes the same group layer prepackaged within an existing map document. You can zoom to any area of the StreetMap USA map document and convert the compressed street data to other types of feature classes such as shapefiles or geodatabases. The published map document (StreetMap USA.pmf) is a published version of the map document provided for ArcReader users. The ArcXML file (StreetMap USA.axl) is provided for ArcIMS Route Server users. The following lists the four address locators that are provided and their nationwide geocoding abilities—StreetMapUSA Locator.loc for geocoding most addresses; StreetMapUSA Alphanumeric Locator.loc for geocoding alphanumeric addresses; StreetMapUSA Hyphenated Locator.loc for geocoding hyphenated addresses; and StreetMapUSA Composite Locator.loc, which uses a combination of the three previously mentioned locators. Use these address locators to geocode addresses in the United States by interactively matching a single address or by batch matching from a table of addresses. ArcSDE® users can also geocode against the street data by first creating a new address locator in ArcSDE using the U.S. Streets with City State ZIP style. Within the StreetMap Find Route dialog box, you can set the routing service and address locator, then define stops and their duration, define barriers, map the quickest or shortest
ESRI Data & Maps 2006
J-9509
ESRI White Paper 9 www.esri.com/data
route, determine the best sequence to visit multiple stops, turn on the Trip Planning option, and view the travel directions as well as approximate travel time. The StreetMap USA map document is an integrated, interactive map display that serves as a general-purpose basemap for performing routing, travel directions, geocoding, and cartographic and thematic display of the StreetMap USA datasets. The map document supports seamless ad hoc panning and zooming from the full U.S. extent down to the detailed streets level. It displays various road categories, such as interstate highways and local roads, and other features including state boundaries, lakes, landmarks, and airports. The StreetMap USA map document table of contents is organized into thematic group layers such as roads, water, and landmarks. Within each thematic group, the data layers are organized according to their usable scale range. Typically, there are three or four scale-dependent datasets within each thematic group layer, for example, interstates, highways, and local streets. These layers provide the appropriate feature density, level of generalization, symbolization, and labeling for each of the five scale ranges. The thematic group layers can be easily expanded to show the various datasets arranged by display scale or simply turned on or off. The streets data is presorted to draw the road classes in the correct order for cartographic display. Dynamic label placement is used throughout. The ArcGIS 9 Layer Drawing Option has been implemented for a number of individual layers including city points, landmark points, and streets.
Smart Data Compression
Format
Smart Data Compression is a highly compressed vector format created by ESRI that is readable directly by ArcGIS Desktop and ArcIMS Route Server. All vector and table datasets in ESRI Data & Maps (including the StreetMap USA datasets) are in SDC 2 format. The SDC 2 format advantages are high compression, fast data retrieval, map and tabular data support, security features, and support for geocoding and routing.
Data Distribution Application
Included on the ESRI Data & Maps—Data & Maps and StreetMap USA DVD is the Data Distribution Application (DDA), which is intended primarily for converting the Data & Maps vector data from SDC format to shapefile format. The SDC data can first be viewed in the DDA viewer by opening the provided ArcGIS map document or ArcXML files or by adding in the individual SDC files. After panning and zooming to the area of interest, all data layers checked on in the table of contents can be extracted to shapefiles for the current map extent. The \DDA folder contains two versions of the application: DDA_Arc.exe for users with ArcGIS installed and DDA.exe for users without ArcGIS installed. Please see DDA_Help.htm for instructions on using both versions. Important: Data extracted from any Data & Maps SDC file will still be governed by the redistribution rights of the source SDC file. Please review the Data & Maps Redistribution rights table before redistributing any of this data. This table can be found in the ESRI Data & Maps section of the ArcGIS Desktop Help or through the help.htm file located on any DVD.
Metadata Each dataset and its associated ArcGIS layer files are fully documented with metadata. The metadata furnishes extensive general and technical characteristics of the dataset and layer files. The metadata displays a thumbnail for each dataset and layer. The dataset metadata provides identification, originator, publisher, description, temporal/currency,
ESRI Data & Maps 2006
J-9509
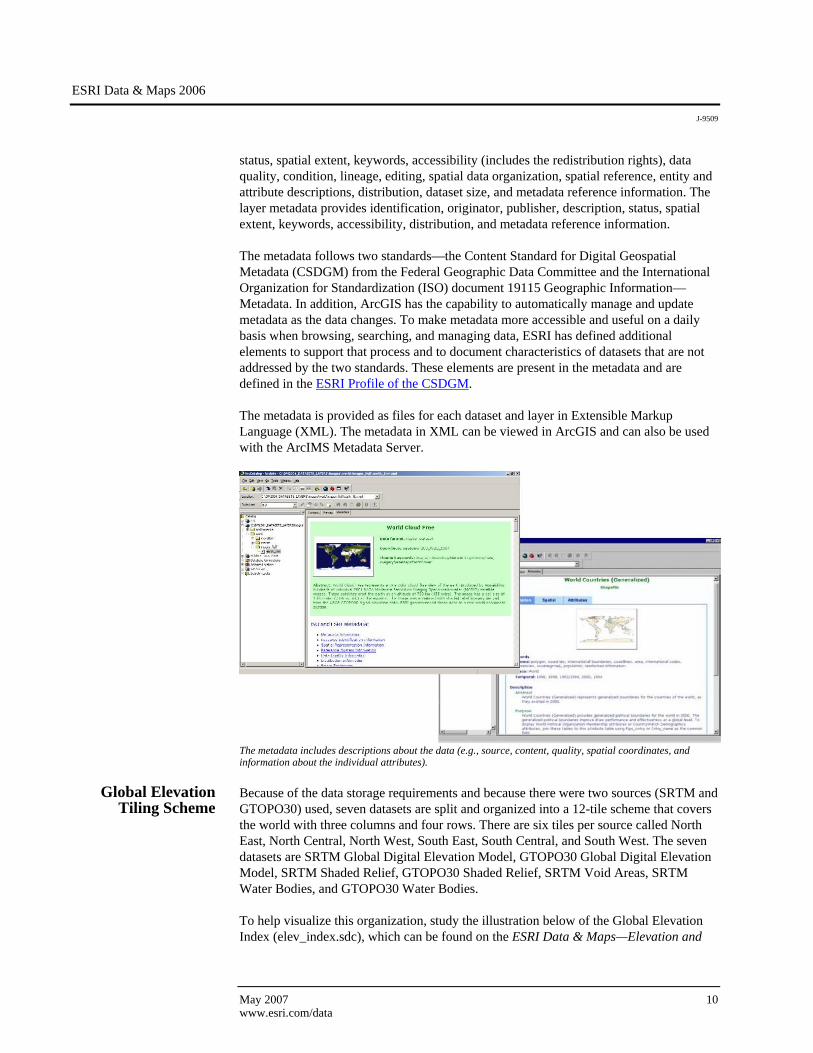
status, spatial extent, keywords, accessibility (includes the redistribution rights), data quality, condition, lineage, editing, spatial data organization, spatial reference, entity and attribute descriptions, distribution, dataset size, and metadata reference information. The layer metadata provides identification, originator, publisher, description, status, spatial extent, keywords, accessibility, distribution, and metadata reference information. The metadata follows two standards—the Content Standard for Digital Geospatial Metadata (CSDGM) from the Federal Geographic Data Committee and the International Organization for Standardization (ISO) document 19115 Geographic Information—Metadata. In addition, ArcGIS has the capability to automatically manage and update metadata as the data changes. To make metadata more accessible and useful on a daily basis when browsing, searching, and managing data, ESRI has defined additional elements to support that process and to document characteristics of datasets that are not addressed by the two standards. These elements are present in the metadata and are defined in the ESRI Profile of the CSDGM. The metadata is provided as files for each dataset and layer in Extensible Markup Language (XML). The metadata in XML can be viewed in ArcGIS and can also be used with the ArcIMS Metadata Server.
The metadata includes descriptions about the data (e.g., source, content, quality, spatial coordinates, and information about the individual attributes).
Global Elevation Tiling Scheme
Because of the data storage requirements and because there were two sources (SRTM and GTOPO30) used, seven datasets are split and organized into a 12-tile scheme that covers the world with three columns and four rows. There are six tiles per source called North East, North Central, North West, South East, South Central, and South West. The seven datasets are SRTM Global Digital Elevation Model, GTOPO30 Global Digital Elevation Model, SRTM Shaded Relief, GTOPO30 Shaded Relief, SRTM Void Areas, SRTM Water Bodies, and GTOPO30 Water Bodies. To help visualize this organization, study the illustration below of the Global Elevation Index (elev_index.sdc), which can be found on the ESRI Data & Maps—Elevation and
May 2007 10 www.esri.com/data

ESRI Data & Maps 2006
J-9509
Image Data: World DVD in the \srtm_void_filled\data_quality folder. This index dataset stores all the source and file-naming information for each tile.
For more information, see the Data & Maps 2006 Elevation Data HTML-based help system (SRTM_ReadMe.htm and SRTM_ReadMe_files folder) found on any one of the three ESRI Data & Maps—Global Imagery and Shaded Relief DVDs
ESRI Data & Maps 2006: Content
Help
HTML-Based Help
System Each disc contains a stand-alone ESRI Data & Maps and StreetMap USA HTML-based help system (help.htm and help folder) that provides help topics about ESRI Data & Maps, what is new, and redistribution rights as well as using the StreetMap functionality and the StreetMap USA data. Please review the redistribution rights help topic before redistributing any datasets. The help topics in HTML can be viewed within the HTML-based help system with any HTML browser. Each of the three ESRI Data & Maps—Global Imagery and Shaded Relief DVDs contains a stand-alone Data & Maps 2006 Elevation Data HTML-based help system (SRTM_ReadMe.htm and SRTM_ReadMe_files folder) that provides information about the approximately 20 GB of elevation and image data.
Map Documents, Group Layers, and
Background
Map Documents,
Group Layers, Published Map
Documents, and Background Folders
The geographies—Canada, Europe, Mexico, United States, and World—plus the geographies on the ESRI Data & Maps—Elevation and Image Data: World DVD and the three ESRI Data & Maps—Global Imagery and Shaded Relief DVDs are provided with map documents, group layers, published map documents, and background folders. The group layer contains the geography's datasets that are symbolized and labeled for display at scales ranging from nationwide to local areas. The map document contains the same group layer prepackaged within an existing map document. There are three basic types of
ESRI White Paper 11 www.esri.com/data
ESRI Data & Maps 2006
J-9509
May 2007 12 www.esri.com/data
map documents—basemap, thematic, and image overlay map. The published map document is a published version of the map document provided for ArcReader users. The background folder contains additional datasets that support the functionality of the map documents, group layers, and published map documents.
United States Census
108th Congressional Districts
U.S. 108th Congressional Districts represents the political boundaries for the U.S. 108th Congressional Districts. The data provides the locations of congressional districts primarily for national planning applications. This Congress began January 2003 and ended January 2005.
109th Congressional Districts
U.S. 109th Congressional Districts represents the political boundaries for the U.S. 109th Congressional Districts. The data provides the locations of congressional districts primarily for national planning applications. This Congress began January 2005 and ended January 2007. The membership is current as of August 25, 2006.
Counties U.S. Counties represents the counties of the United States in the 50 states, the District of Columbia, and Puerto Rico. U.S. Counties provides detailed boundaries that are consistent with the U.S. Census Tracts, U.S. Census Block Groups, and U.S. States datasets and are effective at state, county, and local levels. Census attributes for demographic and housing detail are from the U.S. Census 2000 Summary File 1. The 2005 population count estimate is included from ESRI Community Data. Agriculture attributes are from the 1997 Census of Agriculture (USDA)
County Boundaries U.S. County Boundaries represents the boundary lines of the counties of the United States. The boundaries are effective for cartographic display at state, county, and local levels.
Counties (Generalized)
U.S. Counties (Generalized) represents the counties of the United States in the 50 states and the District of Columbia. This dataset is generalized to improve draw performance and to be used effectively at a national level. Census attributes for demographic and housing detail are from the U.S. Census 2000 Summary File 1. The 2005 population count estimate is included from ESRI Community Data. Agriculture attributes are from the 1997 Census of Agriculture (USDA).
County Population Estimates 2000 (table)
U.S. County Population Estimates 2000 (table) represents the county population attributes (2000–2002) from the Population Estimates Branch, U.S. Census Bureau. The program promotes the cooperation between the states and the United States Census Bureau. These population estimates contain revisions of estimates from previous years and the results of special censuses and test censuses conducted by the Census Bureau. These population estimates are for 3,141 counties or county equivalents. For analysis, this data can be displayed with U.S. Counties or U.S. Counties (Generalized) using FIPS as the common field.
County Population Estimates 1990 (table)
U.S. County Population Estimates 1990 (table) represents the county population attributes (1990–1999) from the Population Estimates Program, Population Division, U.S. Census Bureau. The program promotes the cooperation between the states and the United States Census Bureau. These population estimates contain revisions of estimates from previous years and the results of special censuses and test censuses conducted by
ESRI Data & Maps 2006
J-9509
ESRI White Paper 13 www.esri.com/data
the Census Bureau. These population estimates are for 3,141 counties or county equivalents. County boundary changes have occurred since the 1990 census in Alaska, Colorado, Maryland, and Virginia. For analysis, this data can be displayed with U.S. Counties or U.S. Counties (Generalized) using FIPS as the common field.
States U.S. States represents the 50 states, the District of Columbia, and Puerto Rico. U.S. States provides detailed boundaries that are consistent with the U.S. Census Tracts, U.S. Census Block Groups, and U.S. Counties datasets and are effective at state and county levels. Census attributes for demographic and housing detail are from the U.S. Census 2000 Summary File 1. The 2005 population count estimate is included from ESRI Community Data. Agriculture attributes are from the 1997 Census of Agriculture (USDA).
State Boundaries U.S. State Boundaries represents the boundary lines of the states of the United States. The boundaries are effective for cartographic display at state and county levels.
States (Generalized) U.S. States (Generalized) represents the 50 states and the District of Columbia. This dataset is generalized to allow effective use at a national level. Census attributes for demographic and housing detail are from the U.S. Census 2000 Summary File 1. The 2005 population count estimate is included from ESRI Community Data. Agriculture attributes are from the 1997 Census of Agriculture (USDA).
Census Tracts U.S. Census Tracts represents the U.S. Census tracts of the United States in the 50 states and the District of Columbia. The boundaries are consistent with U.S. Counties, U.S. States, and U.S. Census Block Groups datasets. Census attributes for demographic and housing detail are from the U.S. Census 2000 Summary File 1. The 2005 population count estimate is included from ESRI Community Data. Tract is defined as a small, relatively permanent statistical subdivision of a county or statistically equivalent entity, delineated for data presentation purposes by a local group of census data users or the geographic staff of a regional census center in accordance with Census Bureau guidelines. Designed to be relatively homogeneous units with respect to population characteristics, economic status, and living conditions at the time they are established, census tracts generally contain between 1,000 and 8,000 people with an optimum size of 4,000 people. Census tract boundaries are delineated with the intention of being stable over many decades, so they generally follow relatively permanent visible features. However, they may follow governmental unit boundaries and other invisible features in some instances; the boundary of a state or county (or statistically equivalent entity) is always a census tract boundary.
Census Block Groups U.S. Census Block Groups represents the U.S. Census block groups of the United States. The boundaries are consistent with U.S. Counties, U.S. States, and U.S. Census Tracts datasets. Census attributes for demographic and housing detail are from the U.S. Census 2000 Summary File 1. The 2005 population count estimate is included from ESRI Community Data. A block group is a combination of census blocks that is a subdivision of a census tract. A block group consists of all blocks whose numbers begin with the same digit in a given census tract. The block group is the lowest level of geography for which the U.S. Census Bureau has tabulated sample data in Census 2000.
ESRI Data & Maps 2006
J-9509
May 2007 14 www.esri.com/data
Census Block Centroid Populations
U.S. Census Block Centroid Populations represents the population of the U.S. Census blocks for the United States. U.S. Census blocks are the smallest geographic entities within a county for which the Census Bureau tabulates population—bounded on all sides by visible features, such as streets, streams, and railroad tracks, and by invisible boundaries such as city, town, and county limits. Census attributes—POP2000, HSE_UNITS, and HOUSEHOLDS—are from the U.S. Census 2000 Summary File 1.
Census and Other Attributes
The U.S. Census and ESRI Community Data attributes described here are present in many U.S. datasets. U.S. Census attributes for demographic and housing detail are from the U.S. Census 2000 Summary File 1. They include a selection of 36 descriptive attributes focusing on total population, race, gender, age, households, families, and housing units. These attributes, or a selection of them, are included in the U.S. Census Tracts, Block Groups, Block Centroid Populations, Cities, Populated Places, States, and Counties datasets. The 2005 population count estimate is included from ESRI Community Data. This attribute is included in U.S. Counties, States, Core Based Statistical Areas, Census Tracts and Block Groups, and ZIP Code Areas and Points.
Census Feature Class Codes (table)
U.S. Census Feature Class Codes (CFCC) (table) represents the United States Census Bureau feature classifications. The Census feature class codes (also called FCC) are used in many datasets. This data can be displayed with any dataset containing the CFCC or FCC attribute and using it as the common field.
Cities U.S. Cities represents locations for cities within the United States with populations of 10,000 or greater (based on Census 2000 figures), all state capitals, and the national capital. Census attributes for demographic and housing detail are from the U.S. Census 2000 Summary File 1.
National Atlas of the United States
Cities U.S. National Atlas Cities represents cities and towns in the United States, Puerto Rico,
and the U.S. Virgin Islands. U.S. National Atlas Cities provides information about the locations, names, populations, and administrative status of cities and towns.
Urbanized Areas U.S. National Atlas Urbanized Areas represents urban areas in the United States derived from the urban areas layer of the Digital Chart of the World. U.S. National Atlas Urbanized Areas provides information about the locations, names, and populations of urbanized areas.
Populated Place Areas U.S. Populated Place Areas represents populated place areas that include census-designated places, consolidated cities, and incorporated places within the United States identified by the U.S. Census Bureau. U.S. Populated Place Areas provides areal locations for populated places including attributes—name, FIPS code, census class, area, and selected demographic data from the U.S. Census 2000 Summary File 1.
Populated Place Points
U.S. Populated Place Points represents populated places that include census-designated places, consolidated cities, and incorporated places within the United States identified by the U.S. Census Bureau. U.S. Populated Place Points provides locations for populated places including attributes—name, FIPS code, census class, area, and selected demographic data from the U.S. Census 2000 Summary File 1.

ESRI Data & Maps 2006
J-9509
ESRI White Paper 15 www.esri.com/data
Census Urbanized Areas
U.S. Census Urbanized Areas represents the Census 2000 Urbanized Areas (UA) and Urban Clusters (UC). A UA consists of contiguous, densely settled census block groups and census blocks that meet minimum population density requirements (1,000 ppsm/500 ppsm), along with adjacent densely settled census blocks that together encompass a population of at least 50,000 people. A UC consists of contiguous, densely settled census block groups and census blocks that meet minimum population density requirements, along with adjacent densely settled census blocks that together encompass a population of at least 2,500 people but fewer than 50,000 people. The dataset covers the 50 states plus the District of Columbia within the United States. U.S. Census Urbanized Areas provides information about the locations, names, population, housing, and urban codes of urbanized areas.
Core Based Statistical Areas
U.S. Core Based Statistical Areas represents geographic entities, defined by the United States Office of Management and Budget for use by federal statistical agencies, based on the concept of a core area with a large population nucleus plus adjacent communities having a high degree of economic and social integration with that core. A CBSA consists of a county containing an Incorporated Place or Census Designated Place with a population of at least 10,000 along with any adjacent counties that have at least 25 percent of employed residents of the county who work in the CBSA's core or central county. CBSAs are categorized as being either Metropolitan or Micropolitan. Each Metropolitan Statistical Area must have at least one urbanized area of 50,000 or more inhabitants. Each Micropolitan Statistical Area must have at least one urban cluster of at least 10,000 but less than 50,000 population. U.S. Core Based Statistical Areas provides the names and types of Core Based Statistical Areas. The 2005 population count estimate is included from ESRI Community Data.
Telephone Area Code Boundaries
U.S. Telephone Area Code Boundaries represents the telephone area codes for the United States. They are also known as Numbering Plan Areas. U.S. Telephone Area Code Boundaries provides information about the locations, current and previous area codes, method used to create the new area codes, and dates the new or previous area codes become effective or expire. The boundaries are current as of November 2005.
ZIP Code Areas (Five-Digit)
U.S. ZIP Code Areas (Five-Digit) represents five-digit ZIP Code areas used by the U.S. Postal Service to deliver mail more effectively. The first digit of a five-digit ZIP Code divides the United States into 10 large groups of states numbered from 0 in the northeast to 9 in the far west. Within these areas, each state is divided into an average of 10 smaller geographical areas, identified by the second and third digits. These digits, in conjunction with the first digit, represent a sectional center facility or a mail processing facility area. The fourth and fifth digits identify a post office, station, branch, or local delivery area. U.S. ZIP Code Areas provides area, post office name, and population for each ZIP Code area in the United States. The 2005 population count estimate is included from ESRI Community Data. The 2000 population is summed from the populations of the Census Bureau Block polygon centroids that fall within each ZIP Code area. U.S. ZIP Code Areas is from Tele Atlas and based on data derived from U.S. Postal Service data and other sources.
ZIP Code Areas (Three-Digit)
U.S. ZIP Code Areas (Three-Digit) represents the first three digits of a ZIP Code. The first digit of a five-digit ZIP Code divides the United States into 10 large groups of states
ESRI Data & Maps 2006
J-9509
May 2007 16 www.esri.com/data
numbered from 0 in the northeast to 9 in the far west. Within these areas, each state is divided into an average of 10 smaller geographical areas, identified by the second and third digits. These digits, in conjunction with the first digit, represent a sectional center facility or a mail processing facility area. These areas are serviced by the U.S. Post Office Sectional Center Facility (SCF). Note that a single SCF often services multiple three-digit areas. U.S. ZIP Code Areas (Three-Digit) provides area and population for each three-digit ZIP Code area in the United States. The 2005 population count estimate is included from ESRI Community Data. The 2000 population is summed from the populations of the Census Bureau Block polygon centroids that fall within each ZIP Code area. U.S. ZIP Code Areas (Three-Digit) is from Tele Atlas and based on data derived from U.S. Postal Service data and other sources.
ZIP Code Points U.S. ZIP Code Points represents the five-digit ZIP Code areas as points by placing their location using geographic-based centroids, plus all ZIP Codes that have no area and are represented as points rather than areas such as post office box ZIP Codes and unique ZIP Codes (single site, building, or organization). U.S. ZIP Code Points provides the post office name, type, and area for each ZIP Code location in the United States. The 2005 population count estimate is included from ESRI Community Data. U.S. ZIP Code Points are from Tele Atlas and based on data derived from U.S. Postal Service data and other sources.
United States Hydrography
Drainage Systems
(Generalized) U.S. Drainage Systems (Generalized) represents the major drainage systems within the United States. This dataset is generalized to allow effective use at a national level.
Lakes (Generalized) U.S. Lakes (Generalized) represents the major lakes within the United States. This dataset is generalized to allow effective use at a national level.
Rivers (Generalized) U.S. Rivers (Generalized) represents the major rivers within the United States. This dataset is generalized to allow effective use at a national level.
Rivers and Streams U.S. Rivers and Streams represents detailed rivers and streams in the United States. The dataset provides a database of linear water features that interconnects and identifies the stream segments or reaches that comprise the surface water drainage system of the United States. It includes information about the names, types, path levels, and lengths of the rivers and streams. The detailed and comprehensive rivers and streams are from the National Hydrography Dataset by the U.S. Geological Survey in cooperation with the U.S. Environmental Protection Agency.
Water Bodies U.S. Water Bodies represents the major lakes, reservoirs, large rivers, lagoons and estuaries in the United States. The dataset provides a database of areal water features that identifies the water bodies or reaches that comprise the surface water drainage system of the United States. It includes information about the names, types, and areas of the water bodies. The detailed and comprehensive water bodies are from the National Hydrography Dataset by the U.S. Geological Survey in cooperation with the U.S. Environmental Protection Agency.
ESRI Data & Maps 2006
J-9509
ESRI White Paper 17 www.esri.com/data
National Atlas of the United States
Water Feature Areas U.S. National Atlas Water Feature Areas represents the water feature areas (e.g., bays,
glaciers, lakes, and swamps) of the United States. It includes information about the names, types, areas, and locations of the water feature areas.
Water Feature Lines U.S. National Atlas Water Feature Lines represents the linear water features (e.g., aqueducts, canals, intracoastal waterways, and streams) of the United States. It includes information about the names, types, lengths, and locations of the water feature lines.
United States Landmarks
Geographic Names
Information System Cultural and Physical
Points
Buildings,
Cemeteries, Churches, Golf
Locales, Hospitals, Locales, Populated
Places, Schools, and Summits
U.S. GNIS represents an automated inventory of the proper names and locations of cultural and physical geographic features located throughout the United States. The purpose of the U.S. GNIS cultural and physical points dataset is to promote geographic feature name standardization and to serve as the federal government's repository of information regarding feature name spellings and applications for features in the United States and its commonwealths, territories, and freely associated states. The names listed in the inventory can be published on federal maps, charts, and in other documents. The feature locating information has been used in emergency preparedness, marketing, site selection and analysis, genealogical and historical research, and transportation routing applications. For this dataset, each of the cultural and physical feature types has been extracted into individual datasets to keep the number of features at a reasonable level. Cultural and Physical Features Points Buildings 38,098 Cemeteries 122,025 Churches 172,360 Golf Locales 3,561 Hospitals 9,940 Locales 122,086 Populated Places 176,905 Schools 166,887 Summits 70,140
Hospitals U.S. Hospitals represents the locations and selected attributes for hospitals included in the FY2004 edition of the Health Forum AHA Annual Survey Database. U.S. Hospitals provides locations and extensive information about hospitals such as description, type, name, address, number of beds, employees, patients, and emergency room visits.
Major Parks U.S. Major Parks represents national parks and forests as well as state and local parks and forests within the United States. U.S. Major Parks provides thousands of named parks and forests at national, state, and local levels.

ESRI Data & Maps 2006
J-9509
May 2007 18 www.esri.com/data
Institutions U.S. Institutions represents point locations within the United States for common institution landmark types including hospitals, educational institutions, religious institutions, government centers, and cemeteries. U.S. Institutions provides the locations, names, and the state and county they reside in for hundreds of thousands of institutions.
Large Area Landmarks
U.S. Large Area Landmarks represents common landmark areas within the United States including military areas, prisons, educational institutions, amusement centers, government centers, sport centers, golf courses, and cemeteries. U.S. Large Area Landmarks provides thousands of common landmark areas that are named and makes a good cultural layer at county and local levels.
Parks U.S. Parks represents parks and forests within the United States at national, state, and especially local levels. Each park or forest is named.
Recreation Areas U.S. Recreation Areas represents point locations within the United States for common recreational landmarks including golf courses, zoos, resorts, museums, and other recreational facilities. Each recreation area is named and shows the state and county it resides in.
National Atlas of the United States
Historic Earthquakes U.S. National Atlas Historic Earthquakes represents the locations of significant and
historic earthquakes in the United States and adjacent Canada and Mexico that caused deaths, property damage, and geological effects or were otherwise experienced by the resident populations. U.S. National Atlas Historic Earthquakes provides the locations of significant and historic earthquakes for geographic display and analysis at national and regional levels. This dataset is intended for a mixed audience of specialists and nonspecialists alike who have a need for general, nontechnical information about significant earthquakes in and near the United States.
Volcanoes U.S. National Atlas Volcanoes represents volcanoes thought to be active in the last 10,000 years in and near the United States. The data is a subset of data available from the Global Volcanism Program, Smithsonian Institution. U.S. National Atlas Volcanoes includes information about the location, volcano number, summit elevation, morphology, age, and type of evidence used to determine volcanic activity of the volcanoes.
United States Other
State Plane Zones for NAD 1927 and NAD
1983
U.S. State Plane Zones (NAD 1927 and NAD 1983) represent the State Plane Coordinate System Zones for the 1927 and 1983 North American Datums within the United States. U.S. State Plane Zones (NAD 1927 and NAD 1983) are generalized and are approximations of the actual State Plane Coordinate System Zone boundaries for the 1927 and 1983 North American Datums. They are intended for visual reference at small and medium map scales. Please contact state authorities with questions about a zone boundary.

ESRI Data & Maps 2006
J-9509
ESRI White Paper 19 www.esri.com/data
National Atlas of the United States
Federal and Indian
Land Areas U.S. National Atlas Federal and Indian Land Areas represents the federal and Indian-owned land areas (e.g., Bureau of Indian Affairs and Tennessee Valley Authority) of the United States. It includes information about the name, type, agency/bureau, location, and area of the land areas.
Federal Land Lines U.S. National Atlas Federal Land Lines represents the linear federally owned land features (e.g., national parkways and wild and scenic rivers) of the United States. It includes information about the name, type, and length of the land lines. No data exists for Hawaii.
Public Land Survey U.S. National Atlas Public Land Survey represents the public land surveys (e.g., donation lands, land grants, and private and public surveys of public lands) of the United States. It includes information about the name, type, township and range, and area of the land survey.
USGS Topographic Quadrangle Series
Indexes
1:24,000 USGS 1:24,000 Topographic Quadrangle Series Indexes represents the theoretical
geographic extent of USGS 1:24,000 topographic maps (7.5- by 7.5-minute quadrangles) for the conterminous 48 states and the District of Columbia. USGS 1:24,000 Topographic Quadrangle Series Indexes provides quadrangle name, identification number, publication data, and map coverage by state for each quadrangle. Rotated, offset, over edge, and inset quadrangle boundaries are rendered as standard-shaped quadrangles.
1:100,000 USGS 1:100,000 Topographic Quadrangle Series Indexes represents the theoretical geographic extent of USGS 1:100,000 topographic maps (30- by 60-minute quadrangles) for the conterminous 48 states and the District of Columbia. USGS 1:100,000 Topographic Quadrangle Series Indexes provides quadrangle name, identification number, publication data, and map coverage by state for each quadrangle. Rotated, offset, over edge, and inset quadrangle boundaries are rendered as standard-shaped quadrangles.
1:250,000 USGS 1:250,000 Topographic Quadrangle Series Indexes represents the theoretical geographic extent of USGS 1:250,000 topographic maps (1- by 2-degree quadrangles) for the conterminous 48 states and the District of Columbia. USGS 1:250,000 Topographic Quadrangle Series Indexes provides quadrangle name, identification number, publication data, and map coverage by state for each quadrangle. Rotated, offset, over edge, and inset quadrangle boundaries are rendered as standard-shaped quadrangles.
United States Transportation
Highways U.S. Highways represents the major and minor highways of the United States. These
include interstates, U.S. highways, state highways, major roads, and minor roads. This dataset is a subset of the StreetMap USA Detailed Streets dataset. It contains all class 1, 2, and 3 road segments plus any other road segments necessary to provide network
ESRI Data & Maps 2006
J-9509
May 2007 20 www.esri.com/data
connectivity. U.S. Highways provides a subset of highways and roads for national, state, and local display.
Major Highways U.S. Major Highways represents the major highways of the United States. These include interstates, U.S. highways, state highways, and major roads. This dataset is a subset of the StreetMap USA Detailed Streets dataset. It contains all class 1 and 2 road segments plus any other road segments necessary to provide network connectivity. U.S. Major Highways provides a subset of highways and major roads for national, state, and county display.
Major Roads U.S. Major Roads represents interstates, U.S. and state highways, major streets, and other major thoroughfares within the United States. It provides an invaluable reference and cartographic layer that make it easy to identify areas in other feature layers. U.S. Major Roads overlays accurately on streets and other boundary data.
Airports U.S. Airports represents airport boundaries and airport runways within the United States. All airports have a boundary, and most have at least one runway. U.S. Airports provides the boundaries for thousands of airports and runways. There are many attributes that describe each airport, for example, name, three- or four-character location ID (airport code), owner, elevation, congestion level, large certified air carrier enplanements, foreign enplanements, hub size, and tower type.
Transportation Terminals
U.S. Transportation Terminals represents locations within the United States for transportation terminals such as bus stations, train stations, marine terminals, and other significant transportation nodes. Most transportation terminals are named and provide the type as well as the state and county they reside in.
National Atlas of the United States
Airports U.S. National Atlas Airports represents airports in the United States, Puerto Rico, the
U.S. Virgin Islands, and U.S. possessions with airport passenger enplanements of greater than or equal to 100 passengers per year. U.S. National Atlas Airports provides information about the locations, names, location identifiers, and enplanements of airports.
National Transportation Atlas
Interstate Highways U.S. National Transportation Atlas Interstate Highways represents rural and urban
interstate highways. The dataset is part of the National Highway Planning Network published by the Federal Highway Administration as part of the National Transportation Atlas Databases for the United States. It provides a comprehensive database of interstate highways from the nation's principal arterial highway system and the National Highway System. The data is generalized to allow effective use at a national level.
Railroads U.S. National Transportation Atlas Railroads represents a comprehensive database of the nation's railway system at 1:100,000 scale. The dataset covers the 48 contiguous states plus the District of Columbia. It includes information about the names, owners, types, classes, and lengths of the railroads.
ESRI Data & Maps 2006
J-9509
ESRI White Paper 21 www.esri.com/data
United States StreetMap USA
Streets
Detailed Streets U.S. Detailed Streets represents detailed streets, interstate highways, and major roads
within the United States. U.S. Detailed Streets is the cornerstone of StreetMap USA. U.S. Detailed Streets is in SDC 2 format, based on TIGER 2000 data enhanced by ESRI and Tele Atlas, and prepared for routing within the StreetMap Find Route dialog box. The dataset provides nationwide street map display, routing, travel directions, and geocoding for the United States. No license is required to use this data. Address attributes are prestandardized based on ESRI U.S. Streets standardization rules. The attributes include left/right and to/from addresses; prefix direction, prefix type, name, suffix type, and suffix direction with up to four alternates of these five attributes; and road and ramp classes, street elevation, highway symbol, travel speed, ZIP Code, city, and state.
United States StreetMap USA
StreetMap Background
Cultural Landmarks U.S. Cultural Landmarks represents locations and proper names for airports, buildings,
cemeteries, churches, civil features, hospitals, locales, military facilities, parks, post offices, populated places, reserves, schools, and other landmark type features within the United States. Data was extracted from the USGS GNIS. This dataset provides attributes for name, class, county, state, and state and county FIPS codes.
Landmark Points U.S. Landmark Points represents locations and proper names for airports, amusement centers, apartment buildings, bus terminals, campgrounds, cemeteries, city halls, convents, monasteries, custodial facilities, educational institutions, religious institutions, employment centers, penitentiaries, fire stations, golf courses, government centers, halfway houses, hospitals, hotels, resorts, spa facilities, housing facilities, industrial buildings, islands, jails, landmarks, lookout towers, marinas, military installations, mountain peaks, national parks, national forests, nursing homes, office buildings, open spaces, orphanages, police stations, post offices, public libraries, shopping centers, state parks, local parks, towers, trailer courts, train stations, and other landmark type features within the United States. Data was extracted from the USGS GNIS. This dataset provides attributes for name, class, CFCC, county, state, and state and county FIPS codes.
Natural Landmarks U.S. Natural Landmarks represents locations for naturally occurring physical features within the United States. This dataset provides attributes for name, class, county, state, and state and county FIPS codes.
Places U.S. Places represents location, configuration, name, and socioeconomic and demographic attributes of cities and places within the United States. Data was extracted from the U.S. Census 2000 TIGER/Line database. This dataset provides attributes for ID, name, place and state FIPS codes, place code, legal/statistical code, state, population class, area; current year values for males, females, and average household size; current year and five-year estimates for median age; current year, five-year estimates, and growth rates for population, per capita income, and households; average budget expenditure; and budget indices for food, housing, travel, education, and news.

ESRI Data & Maps 2006
J-9509
May 2007 22 www.esri.com/data
Hydrology U.S. Hydrology represents hydrology features within the United States. Hydrology includes the following: naturally flowing water features, man-made channels to transport water, streams, rivers, washes, braided streams and rivers, near-seawaters, linear water in a man-made excavation, and special water features. This dataset provides attributes for name, class definition, CFCC, and length.
Runways U.S. Runways represents locations, identifications, and characteristics of airport runways within the United States. A wide range of air transport and physical information about runways and airports are provided including runway name, ID, length, width, and surface material. Source of this data was the U.S. Department of Transportation, 1995. This dataset provides attributes for name, county, state, state and county FIPS codes, site number, landing facility ID, city, and runway ID, length, width, and surface type.
Schools U.S. Schools represents locations for schools within the United States from the National Center for Education Statistics database. This dataset provides attributes for name, type, level, enrollment, address, place, state, county, state and county FIPS codes, and ZIP Codes.
USA Background U.S. USA Background represents the boundaries of the United States. It is divided by the USGS 1:100,000 Topographic Quadrangle Series indexes to increase display performance. This dataset is used for displaying a basemap background with coastlines for the United States.
Water Boundaries U.S. Water Boundaries represents water feature areas within the United States. Water boundaries include the following: basic hydrography, naturally flowing water features, man-made channels to transport water, inland bodies of water, man-made bodies of water, seaward bodies of water, bodies of water in a man-made excavation, and special water features. This dataset provides attributes for name, CFCC, class definition, and area.
World
Countries (Generalized)
World Countries (Generalized) represents generalized boundaries for the countries of the world as they existed in January 2006. The generalized political boundaries improve draw performance and effectiveness at a global level. The dataset includes information about the common, official, and local names; FIPS, Global Mapping International (GMI), and ISO codes; United Nations statuses; populations; and areas of the countries. This dataset can be displayed with World Country Memberships of Political Organizations (table) or CountryWatch Demographics 2000 (table) using FIPS_CNTRY or CNTRY_NAME as the common field.
Country Boundaries (Generalized)
World Country Boundaries (Generalized) represents the generalized boundary lines for the countries of the world. The generalized political boundary lines improve draw performance and effectiveness at a global level.
Countries 2006 World Countries 2006 represents the boundaries for the countries of the world as they existed in January 2006. The dataset includes information about the common, official, and local names; FIPS, GMI, and ISO codes; United Nations statuses; populations; and areas of the countries. This dataset can be displayed with World Country Memberships of
ESRI Data & Maps 2006
J-9509
ESRI White Paper 23 www.esri.com/data
Political Organizations (table) or CountryWatch Demographics 2000 (table) using FIPS_CNTRY or CNTRY_NAME as the common field.
Country Boundaries World Country Boundaries represents the boundary lines for the countries of the world.
Administrative Units World Administrative Units represents the boundaries for the first-level administrative units of the world. The dataset includes information about the names, country names, FIPS and GMI codes, types, populations, and areas of the administrative units.
Administrative Unit Boundaries
World Administrative Unit Boundaries represents the boundary lines for the first-level administrative units of the world.
Continents World Continents represents the boundaries for the continents of the world. The dataset includes information about the names and areas of the continents.
Regions World Regions represents the boundaries for the regions of the world. There are 25 commonly recognized world regions. The dataset provides an easy means of selecting a small multicountry area for display or study.
CountryWatch Demographics 2000
(table)
CountryWatch Demographics 2000 (table) represents a vast amount of 2000 demographic information for the countries recognized by the U.S. State Department. CountryWatch Demographics 2000 (table) provides information about the geography, population, social indicators, economy, key sectors of each economy, and environment of countries. To display CountryWatch Demographic attributes on a map, join this table to World Countries using FIPS_CNTRY or CNTRY_NAME as the common field.
Country Memberships of Political
Organizations (table)
World Country Memberships of Political Organizations (table) represents the memberships of countries in world political organizations such as the United Nations, the International Monetary Fund, and the Food and Agriculture Organization. The dataset includes information about the names, FIPS codes, capitals, and political organizations of the countries. This data can be displayed with World Countries using FIPS_CNTRY or CNTRY_NAME as the common field.
Cities World Cities represents the locations of major cities of the world. World Cities provides a basemap layer of the cities of the world that includes national capitals, provincial capitals, major population centers, and landmark cities.
Gazetteer World Gazetteer represents the locations and proper names for map features around the world. World Gazetteer includes attribute and annotation name information from various layers of the Digital Chart of the World. World Gazetteer provides a basemap layer that may be used to find locations by their proper name anywhere around the world. The categories include airports, coastal features, drainage features, land features, ocean features, islands, political features, and populated places.
Drainage Systems World Drainage Systems represents the major drainage systems of the world. The dataset includes information about the names, basin areas, discharge volumes, sediment loads, and lengths of the drainage systems.
ESRI Data & Maps 2006
J-9509
May 2007 24 www.esri.com/data
Lakes World Lakes represents the major lakes and inland seas of the world. The dataset includes information about the names, surface elevations, depths, and areas of the lakes and seas.
Rivers World Rivers represents the major rivers of the world. The dataset includes information about the names, systems, and lengths of the rivers.
World Wildlife Fund Terrestrial Ecoregions
World Wildlife Fund Terrestrial Ecoregions represents global terrestrial ecoregions. Ecoregions are defined as relatively large areas of land or water in the world containing a characteristic set of natural communities that share a large majority of their species, dynamics, and environmental conditions. This dataset contains all terrestrial ecoregions, which include those of the Global 200. Global 200 ecoregions are a collection of the earth's most outstanding and diverse terrestrial, freshwater, and marine habitats where the earth's biological wealth is most distinctive and rich, where its loss will be most severely felt, and which must be protected to preserve the web of life. World Wildlife Fund Terrestrial Ecoregions includes information about the names, realms, biomes, future conservation statuses, priorities, and Global 200 numbers of the terrestrial ecoregions. The data is from the World Wildlife Fund Conservation Science Program published in 2005.
World Wildlife Fund Marine Ecoregions
World Wildlife Fund Marine Ecoregions represents global marine ecoregions. Ecoregions are defined as relatively large areas of land or water in the world containing a characteristic set of natural communities that share a large majority of their species, dynamics, and environmental conditions. This dataset contains the marine ecoregions of the Global 200. Global 200 ecoregions are a collection of the earth's most outstanding and diverse terrestrial, freshwater, and marine habitats where the earth's biological wealth is most distinctive and rich, where its loss will be most severely felt, and which must be protected to preserve the web of life. The data is from the World Wildlife Fund Conservation Science Program 2001.
Time Zones World Time Zones represents the time zones of the world. The time zones are best displayed with World Countries or World Administrative Units but can be displayed with any feature dataset. World Time Zones commonly provides time zones for the countries and cities of the world. Note that daylight saving time is not shown.
UTM Zones World UTM Zones represents the Universal Transverse Mercator zones of the world.
Latitude and Longitude Grids
World Latitude and Longitude Grids represents a five-by-five-degree latitude-longitude grid covering the world with attributes that allow it to display grids at intervals of 5, 10, 15, 20, and 30 degrees. To display a grid with a five-degree interval, simply display all the lines. To display a coarser grid (e.g., a 15-degree interval), in the Layer Properties dialog box, set the DEGREE15 attribute value equal to Y. This dataset is used as an overlay for world-level maps.
Named Latitudes and Longitudes
World Named Latitudes and Longitudes represents geographically significant reference latitudes and longitudes for the world such as the equator, tropics, Arctic and Antarctic Circles, prime meridian, and International Date Line.
Map Background World Map Background represents grid cells of 30- by 30-degrees that cover the world. World Map Background provides a shaded background on which other data can be
ESRI Data & Maps 2006
J-9509
ESRI White Paper 25 www.esri.com/data
displayed. For example, quickly display the World Map Background as a blue ocean layer behind other land-based layers such as World Countries.
Europe Basemap
List of Countries Aland Islands Albania Andorra Armenia Austria Azerbaijan Belarus Belgium Bosnia and Herzegovina Bulgaria Channel Islands Croatia Cyprus Czech Republic Denmark Estonia Faeroe Islands Finland Former Yugoslav Republic of Macedonia France Georgia Germany Gibraltar Greece Hungary Iceland Ireland
Isle of Man Italy Latvia Liechtenstein Lithuania Luxembourg Malta Monaco Netherlands Norway Poland Portugal Republic of Moldova Romania Russian Federation San Marino Serbia and Montenegro Slovakia Slovenia Spain Svalbard and Jan Mayen Is Sweden Switzerland Turkey Ukraine United Kingdom of Great Britain Vatican
Countries Europe Countries represents the countries of Europe. This dataset provides attributes for
name, country code, area, and color mapping.
Level 1 Provinces Europe Level 1 Provinces represents the first level of subnational administrative units for countries in Europe. This dataset provides attributes for name, country name, country code, area, and color mapping.
Level 2 Provinces Europe Level 2 Provinces represents the second level of subnational administrative units for countries in Europe. This dataset provides attributes for name, country name, country code, area, and color mapping.
Level 3 Provinces Europe Level 3 Provinces represents the third level of subnational administrative units for countries in Europe. This dataset provides attributes for name, country name, country code, area, and color mapping.
Cities Europe Cities represents the cities of Europe including national capitals, major population centers, and landmark cities. This dataset provides attributes for name, type, level, city code, country name, country code, administrative unit name, population class, and capital indicator.
ESRI Data & Maps 2006
J-9509
May 2007 26 www.esri.com/data
Places Europe Places represents the populated places in Europe. This dataset provide attributes for name, type, level, populated place code, country name, country code, administrative unit name, population class, conurbation name, and capital indicator.
Urbanized Areas Europe Urbanized Areas represents the urbanized areas of Europe. This dataset provides attributes for name, country name, country code, type, and area.
Major Roads Europe Major Roads represents the major roads (European Highway System and national roads) in Europe. This dataset provides attributes for name, length, type, level, direction, national/local codes, international codes, tunnel, toll, tonnage, country name, and country code.
Roads Europe Roads represents the roads (European Highway System, national, and secondary roads) in Europe. This dataset provides attributes for name, length, type, level, direction, national/local codes, international codes, tunnel, toll, tonnage, country name, and country code.
Railroads Europe Railroads represents the railroads in Europe. This dataset provides attributes for name, length, type, level, tunnel, floor, tonnage, country name, and country code.
Railroad Stations Europe Railroad Stations represents the railroad stations in Europe as part of the railroad system for Europe. This dataset provides attributes for name, type, level, country name, country code, administrative unit name, and conurbation name.
Major Lakes Europe Major Lakes contains the major lakes for Europe. This dataset provides attributes for name, type, rank, area, country name, and country code.
Major Rivers Europe Major. Rivers contains the major rivers for Europe. This dataset provides attributes for name, type, rank, area, country name, and country code.
Water Bodies Europe Water Bodies contains rivers, lakes, and other inland water bodies for Europe. This dataset provides attributes for name, rank, area, country name, and country code.
Ferries Europe Ferries represents the ferry routes in Europe as part of the transportation system for Europe. This dataset provides attributes for name, length, level, direction, passenger- only, national/local codes, international codes, time, country name, and country code.
Europe Demography
NUTS 0 Demographics
Europe NUTS 0 Demographics represents areas of aggregated socioeconomic and demographic information at the NUTS 0 (country) level for Europe. This dataset provides
T
attributes for name, NUTS code, population size, population by sex, population by age groups, households, average number of persons per household, population density and growth, stock of dwellings, purchasing power, gross domestic product, number employed, and area.
NUTS 1 Demographics
Europe NUTS 1 Demographics represents areas of aggregated socioeconomic and demographic information at the NUTS 1 level for Europe. NUTS 1 units have a population between three million and seven million people. This dataset provides attributes for name, NUTS codes (0 and 1), population size, population by sex,

ESRI Data & Maps 2006
J-9509
ESRI White Paper 27 www.esri.com/data
population by age groups, households, average number of persons per household, population density and growth, stock of dwellings, purchasing power, gross domestic product, number employed, and area.
NUTS 2 Demographics
Europe NUTS 2 Demographics represents areas of aggregated socioeconomic and demographic information at the NUTS 2 level for Europe. NUTS 2 units have a population between 800,000 and 3,000,000 people. This dataset provides attributes for name, NUTS codes (0 and 2), population size, population by sex, population by age groups, households, average number of persons per household, population density and growth, stock of dwellings, purchasing power, gross domestic product, number employed, and area.
NUTS 3 Demographics
Europe NUTS 3 Demographics represents areas of aggregated socioeconomic and demographic information at the NUTS 3 level for Europe. NUTS 3 units have a population between 150,000 and 800,000 people. This dataset provides attributes for name, NUTS codes (0 and 3), population size, population by sex, population by age groups, households, average number of persons per household, population density and growth, stock of dwellings, purchasing power, gross domestic product, number employed, and area.
Canada
Provinces Canada Provinces represents the Canadian provinces and territories as well as coastlines, international boundaries, provincial boundaries, and demographics. The boundaries are digitized from CanMap®. This dataset provides attributes for name, area, FIPS code, population, and dwelling counts.
Major Cities Canada Major Cities represents the locations of major cities within Canada. The major cities are based on Statistics Canada and Natural Resources Canada definitions. This dataset provides attributes for name, province abbreviation, capital indicator, municipality name, municipality code, and municipality population.
Rural Cities Canada Rural Cities represents the locations of rural cities within Canada. A rural city is a sparsely populated place outside an urbanized area with less than 1,000 persons and a population density of less than 400 persons per square kilometer. This dataset provides attributes for name, province abbreviation, municipality name, municipality code, and municipality population.
Urban Cities Canada Urban Cities represents the locations of urban cities within Canada. An urban city lies outside a Census Metropolitan Area or Census Area and has a minimum population concentration of 1,000 persons and a population density of at least 400 persons per square kilometer. This dataset provides attributes for name, province abbreviation, municipality name, municipality code, and municipality population.
Municipalities Canada Municipalities represents the municipalities within Canada of types including cities, cantons, hamlets, towns/villes, villages, Indian reserves, parishes/paroisses, communities, unorganized, districts, and terre Inuite. The boundaries are digitized from CanMap. This dataset provides attributes for name, province abbreviation, type, area, population, and dwelling counts.
ESRI Data & Maps 2006
J-9509
May 2007 28 www.esri.com/data
Regional Municipalities
Canada Regional Municipalities represents the regional municipalities within Canada including regional districts and municipalities, counties, communauté, regions, divisions, and districts. The boundaries are digitized from CanMap. This dataset provides attributes for name, province abbreviation, area, population, dwelling counts, and color mapping.
Indian Reserves Canada Indian Reserves represents the Indian reserves within Canada. The Indian reserves are based on the National Atlas Information Service (NAIS) 1:2 million digital maps created by Natural Resources Canada for publishing of the National Atlas of Canada. This dataset provides attributes for name, type, and area.
Highways Canada Highways represents the expressways and primary highways of Canada. The highways are from the NAIS 1:2 million digital maps created by Natural Resources Canada for publishing of the National Atlas of Canada. This dataset provides attributes for name, type, route number, and distance in kilometers.
Railways Canada Railways represents the railroads within Canada. The railways are based on the NAIS 1:7.5 million digital maps created by Natural Resources Canada for publishing of the National Atlas of Canada. This dataset provides attributes for unique ID and distance in kilometers.
FSA Postal Centroids Canada FSA Postal Centroids represents the Forward Sortation Areas of Canada as centroids, which are identified by the first three characters of the postal code. The sequence of the three-character FSA is always alphabetical character/number/alphabetical character. The centroids are calculated from the DMTI Spatial FSA boundary dataset, which is created from the DMTI Spatial six-character postal code point dataset and CanMap. The FSA boundaries encompass the six-character postal code points starting with the FSA designation and conform to the streets and other physical features within CanMap. This dataset provides attributes for FSA code and province.
Telephone Area Code Boundaries
Canada Telephone Area Code Boundaries represents the telephone area codes for Canada. The area code boundaries are based on CanMap municipalities and are useful for call center applications. This dataset provides attributes for province, area code, area, and color mapping.
National Parks Canada National Parks represents the national parks and national park reserves within Canada. The national parks are based on the NAIS 1:7.5 million digital maps created by Natural Resources Canada for publishing of the National Atlas of Canada. This dataset provides attributes for name, type, and area.
Provincial Parks Canada Provincial Parks represents the provincial parks (historical, provincial, and wilderness) within Canada. The provincial parks are based on the NAIS 1:2 million digital maps created by Natural Resources Canada for publishing of the National Atlas of Canada. This dataset provides attributes for name, type, and area.
Water Bodies Canada Water Bodies represents the major freshwater bodies within Canada including lakes/lacs, large rivers/fleuves, reservoirs, and bays/baies. The boundaries are based on Statistics Canada data. This dataset provides attributes for name and area.
ESRI Data & Maps 2006
J-9509
ESRI White Paper 29 www.esri.com/data
Mexico
States Mexico States represents the states of Mexico with coastlines, international boundaries, and state boundaries. This dataset provides attributes for name, FIPS code, area in square kilometers, and color mapping.
Municipalities Mexico Municipalities represents the municipios of Mexico with coastlines, international boundaries, state boundaries, and municipio boundaries. This dataset provides attributes for name, state, unique ID, municipality ID, area, and color mapping.
Cities Mexico Cities represents the locations of cities in Mexico. This dataset provides attributes for name, alternate name, state, and population.
Urban Areas Mexico Urban Areas represents the locations of major urban areas in Mexico. This dataset provides attributes for name, state, population, and area.
Roads Mexico Roads represents the major roads and highways of Mexico. This dataset is used to display roads by their type, administrative class, toll information, and length.
Railroads Mexico Railroads represents the major railroads of Mexico. This dataset provides attributes for type and length.
Rivers and Streams Mexico Rivers and Streams represents the major rivers and streams in Mexico. This dataset provides attributes for name, type, status, rank, and length.
Water Bodies Mexico Water Bodies represents the major lakes, reservoirs, and lagoons in Mexico. This dataset provides attributes for name, type, status, rank, and area.
Contours Mexico Contours represents the 1,000-meter contour lines in Mexico. The contour values are in meters above sea level.
Elevation Data—Global Shaded Relief
SRTM Shaded Relief SRTM Shaded Relief (the six tiles—North East, North Central, North West, South East,
South Central, and South West) represents a shaded relief map (between 60 degrees north and 56 degrees south latitude) of the world derived from the NASA/NGA SRTM datasets distributed by U.S. Geological Survey's EROS Data Center. The resolution is 3 arc seconds (90 meters).
GTOPO30 Shaded Relief
GTOPO30 Shaded Relief (the six tiles—North East, North Central, North West, South East, South Central, and South West) represents a basemap layer displaying shaded relief information for the non-SRTM coverage area (north of 60 degrees north and south of 56 degrees south latitude) of the world. This data was derived from the GTOPO30 Digital Elevation Model datasets from the USGS EROS Data Center. The resolution is 30 arc seconds (approximately one kilometer).
ESRI Data & Maps 2006
J-9509
May 2007 30 www.esri.com/data
Image Data—Global Imagery 150-Meter
Resolution
Africa (150 m)—
EarthSat NaturalVue Global Landsat
Mosaic
Africa (150 m)—EarthSat NaturalVue Global Landsat Mosaic represents a 150-meter (492 ft.) resolution, natural-color, Landsat 7-derived, mosaicked image dataset covering the entire land area of Africa. NaturalVue Global Landsat Mosaic was created from NaturalVue 2000®. NaturalVue 2000 was derived from the GeoCover® Ortho 2000 program for NASA.
Asia-East (150 m)—EarthSat NaturalVue
Global Landsat Mosaic
Asia-East (150 m)—EarthSat NaturalVue Global Landsat Mosaic represents a 150-meter (492 ft.) resolution, natural-color, Landsat 7-derived, mosaicked image dataset covering the entire land area of eastern Asia except for the high-latitude polar regions. NaturalVue Global Landsat Mosaic was created from NaturalVue 2000. NaturalVue 2000 was derived from the GeoCover Ortho 2000 program for NASA.
Asia-West (150 m)—EarthSat NaturalVue
Global Landsat Mosaic
Asia-West (150 m)—EarthSat NaturalVue Global Landsat Mosaic represents a 150-meter (492 ft.) resolution, natural-color, Landsat 7-derived, mosaicked image dataset covering the entire land area of western Asia except for the high-latitude polar regions. NaturalVue Global Landsat Mosaic was created from NaturalVue 2000. NaturalVue 2000 was derived from the GeoCover Ortho 2000 program for NASA.
Australia (150 m)—EarthSat NaturalVue
Global Landsat Mosaic
Australia (150 m)—EarthSat NaturalVue Global Landsat Mosaic represents a 150-meter (492 ft.) resolution, natural-color, Landsat 7-derived, mosaicked image dataset covering the entire land area of Australia. NaturalVue Global Landsat Mosaic was created from NaturalVue 2000. NaturalVue 2000 was derived from the GeoCover Ortho 2000 program for NASA.
Europe (150 m)—
EarthSat NaturalVue Global Landsat
Mosaic
Europe (150 m)—EarthSat NaturalVue Global Landsat Mosaic represents a 150-meter (492 ft.) resolution, natural-color, Landsat 7-derived, mosaicked image dataset covering the entire land area of Europe except for the high-latitude polar regions. NaturalVue Global Landsat Mosaic was created from NaturalVue 2000. NaturalVue 2000 was derived from the GeoCover Ortho 2000 program for NASA.
North America-North
(150 m)—EarthSat NaturalVue Global
Landsat Mosaic
North America-North (150 m)—EarthSat NaturalVue Global Landsat Mosaic represents a 150-meter (492 ft.) resolution, natural-color, Landsat 7-derived, mosaicked image dataset covering the entire land area of northern North America except for the high-latitude polar regions. NaturalVue Global Landsat Mosaic was created from NaturalVue 2000. NaturalVue 2000 was derived from the GeoCover Ortho 2000 program for NASA.
North America-South
(150 m)—EarthSat NaturalVue Global
Landsat Mosaic
North America-South (150 m)—EarthSat NaturalVue Global Landsat Mosaic represents a 150-meter (492 ft.) resolution, natural-color, Landsat 7-derived, mosaicked image dataset covering the entire land area of southern North America. NaturalVue Global Landsat Mosaic was created from NaturalVue 2000. NaturalVue 2000 was derived from the GeoCover Ortho 2000 program for NASA.
South America
(150 m)—EarthSat NaturalVue Global
Landsat Mosaic
South America (150 m)—EarthSat NaturalVue Global Landsat Mosaic represents a 150-meter (492 ft.) resolution, natural-color, Landsat 7-derived, mosaicked image dataset covering the entire land area of South America except for the high-latitude polar regions. NaturalVue Global Landsat Mosaic was created from NaturalVue 2000. NaturalVue 2000 was derived from the GeoCover Ortho 2000 program for NASA.
ESRI Data & Maps 2006
J-9509
ESRI White Paper 31 www.esri.com/data
Elevation Data—Global Digital
Elevation Model
SRTM Global Digital
Elevation Model SRTM Global Digital Elevation Model (the six tiles—North East, North Central, North West, South East, South Central, and South West) represents an elevation map (between 60 degrees north and 56 degrees south latitude) of the world from the NASA/NGA SRTM datasets distributed by the USGS EROS Data Center. The resolution is 3 arc seconds (90 meters). SRTM Global Digital Elevation Model provides a basemap layer, with all void areas filled by ESRI using the Delta Surface Fill method with GTOPO30 as the fill-in source, displaying global elevation information for geographic visualization on regional and national scales. The filled void areas are not of the same quality as the surrounding SRTM elevation values. The pixel value represents the elevation in meters.
GTOPO30 Global Digital Elevation
Model
GTOPO30 Global Digital Elevation Model (the six tiles—North East, North Central, North West, South East, South Central, and South West) represents gridded 30-arc-second (approximately 1-kilometer) elevation for the non-SRTM coverage area (north of 60 degrees north and south of 56 degrees south latitude) of the world. This data was developed by the USGS EROS Data Center in 1996 from a variety of data sources. GTOPO30 Global Digital Elevation Model provides a basemap layer displaying global elevation information for geographic study on global, regional, and national scales for non-SRTM coverage areas. The pixel value represents the elevation in meters.
Elevation Data—Data Quality
Global Elevation
Index Global Elevation Index represents the geographic extents of the SRTM and GTOPO30 datasets used to create the combined global digital elevation model. This dataset provides attributes for the sources, locations, and names of the ESRI Data & Maps datasets that make up the global digital elevation model.
GTOPO30 Source Index
GTOPO30 Source Index represents the geographic extents of the data sources used to create the GTOPO30 Global Digital Elevation Model.
SRTM Void Areas SRTM Void Areas (the six tiles—North East, North Central, North West, South East, South Central, and South West) represents those areas without elevation values within the original source SRTM 3-arc-second data. The SRTM Void Areas coverage area is between 60 degrees north and 56 degrees south latitude of the world. These void areas are a result of radar shadow, layover, and other effects of terrain as well as technical radar interferometry phase unwrapping issues. These void areas also represent those areas where ESRI calculated an elevation value using the Delta Surface Fill method with GTOPO30 as the fill-in source. SRTM Void Areas provides the location and size of these void areas.
Elevation Data—Water Bodies
SRTM Water Bodies SRTM Water Bodies (the six tiles—North East, North Central, North West, South East,
South Central, and South West) represents the lakes, rivers, and oceans within the SRTM coverage area (between 60 degrees north and 56 degrees south latitude) of the world. All
ESRI Data & Maps 2006
J-9509
May 2007 32 www.esri.com/data
SRTM elevation values within lakes and ocean areas were set to be a constant elevation for that feature. Elevation values within river areas were set to ensure the proper flow direction. The primary source for these water features was a Landsat 5-based land-cover water layer supplemented with medium-scale maps and charts. This data can also be used for cartographic display. This dataset provides attributes for Feature and Attribute Coding Catalog (FACC) codes and descriptions as well as descriptions of atypical coding situations and code changes.
GTOPO30 Water Bodies
GTOPO30 Water Bodies (the six tiles—North East, North Central, North West, South East, South Central, and South West) represents the lakes, rivers, and oceans within the non-SRTM coverage area (north of 60 degrees north and south of 56 degrees south latitude) of the world. All GTOPO30 elevation values within ocean areas were set to be a constant elevation for that feature. This dataset provides attributes for FACC codes and descriptions.
Elevation Data—World Elevation
Global Digital
Elevation Model (ETOPO2)
Global Digital Elevation Model (ETOPO2) represents gridded (2- by 2-minute) elevation and bathymetry data for the world. This dataset was derived from the NGDC ETOPO2 Global 2-Minute Elevations dataset from September 2001. The VALUE attribute represents the elevation in meters.
Global Digital Elevation Model
(GTOPO30)
Global Digital Elevation Model (GTOPO30) represents gridded 30-arc-second (approximately 1-kilometer) elevation for the world. The source datasets were developed by the USGS EROS Data Center in 1996 from a variety of data sources. The VALUE attribute represents the elevation in meters.
World Topography and Bathymetry
World Topography and Bathymetry represents a color hillshaded DEM-based image of all continents and ocean beds of the world. The hillshading effect (illumination from azimuth of 315 degrees, or northwest) provides the appearance of three dimensions (also known as 2.5D).
Image Data—World Images
World Cloud Free World Cloud Free represents a true-color, cloud-free view of the earth produced by
mosaicking hundreds of individual 2001 NASA Moderate Resolution Imaging Spectroradiometer (MODIS) satellite images. These satellites orbit the earth at an altitude of 700 kilometers (435 miles). The image has a cell size of 1 square kilometer (0.386 sq. mi.) at the equator. The image was enhanced with shaded relief imagery derived from the USGS GTOPO30 global DEM data. ESRI georeferenced this dataset to a real-world coordinate system.
World at Night World at Night represents a nighttime view of the earth produced by mosaicking Defense Meteorological Satellite Program Operational Linescan System satellite images. This system was originally designed to view clouds by moonlight and to map the locations of permanent lights on the earth's surface. These images were derived from nine months of observations superimposed on a darkened land surface. ESRI georeferenced this dataset to a real-world coordinate system.
ESRI Data & Maps 2006
J-9509
ESRI White Paper 33 www.esri.com/data
World with Clouds World with Clouds represents a true-color view of the earth with cloud cover produced by mosaicking hundreds of individual 2001 NASA MODIS satellite images. These satellites orbit the earth at an altitude of 700 kilometers (435 miles). The image has a cell size of 1 square kilometer (0.386 sq. mi.) at the equator. The image was enhanced with shaded relief imagery derived from the USGS GTOPO30 Global DEM data. The cloud image is a composite of two days of imagery collected in visible light wavelengths and a third day of thermal infrared imagery over the poles. ESRI georeferenced this dataset to a real-world coordinate system.
World with Ice World with Ice represents a true-color, cloud-free view of the earth specially processed to depict areas of the earth covered with ice. Mosaicking hundreds of individual 2001 NASA MODIS satellite images created this image. For polar sea ice areas, MODIS observations were combined with observations of Antarctica made by the National Oceanic and Atmospheric Administration's (NOAA) Advanced Very High Resolution Radiometer. The MODIS satellites orbit the earth at an altitude of 700 kilometers (435 miles). The image has a cell size of 1 square kilometer (0.386 sq. mi.) at the equator. The image was enhanced with shaded relief imagery derived from the USGS GTOPO30 Global DEM data. ESRI georeferenced this dataset to a real-world coordinate system.
World WorldSat Color Shaded Relief
World WorldSat Color Shaded Relief represents a cloud-free view of the earth produced by mosaicking hundreds of individual 1996 NOAA weather satellite images. These satellites orbit the earth at an altitude of 800 kilometers (497 miles). The image has a cell size of 4 square kilometers (1.544 sq. mi.) at the equator. On completion of the base satellite mosaic, the land areas were enhanced with shaded relief imagery derived from 1,000-meter digital elevation data, bringing the earth's topography to life. For the ocean areas, WorldSat incorporated ocean floor relief data (bathymetry), providing a view of the undersea topography.
J-9509
May 2007 34 www.esri.com/data
Appendix A: ESRI Data & Maps 2006 Data Update
ESRI Data & Maps 2006 Release
Schedule
ESRI Data & Maps is released annually in the spring. If the ArcGIS software schedule doesn't coincide with this, ESRI Data & Maps is released twice in that year. In 2006, ESRI Data & Maps Data Update was released in the spring of 2006, and the ESRI Data & Maps full product was released with ArcGIS 9.2 in the fall of 2006.
ESRI Data & Maps 2006 Data Update
Contents
The ESRI Data & Maps 2006 Data Update included more than 60 datasets that were updated from the Data & Maps 2005 Media Kit. Most were updated to 2006 versions such as all the U.S. Tele Atlas data and the Europe basemap and demography data. In addition, minor corrections and enhancements were made to many of the datasets. The ESRI Data & Maps 2006 Data Update only contained the updated datasets and did not include new versions of the ArcGIS layer, map document, group layer, or published map format files. It was organized on one DVD. ESRI Data & Maps 2006 Data Update specifics are as follows:
Only updated datasets and their updated metadata were included.
It was organized on one DVD in the same file and folder structure as the 2005 ESRI Data & Maps and StreetMap USA DVD.
Supporting files—ArcGIS layers, map documents, group layers, published map
formats, ArcGIS Desktop Help, and HTML-based help—were not included.
Australia www.esriaustralia.com.au
Belgium/Luxembourg www.esribelux.com
Bulgaria www.esribulgaria.com
Canada www.esricanada.com
Chile www.esri-chile.com
China (Beijing) www.esrichina-bj.cn
China (Hong Kong) www.esrichina-hk.com
Finland www.esri-finland.com
France www.esrifrance.fr
Germany/Switzerland www.esri-germany.de www.esri-suisse.ch
Hungary www.esrihu.hu
India www.esriindia.com
Indonesia www.esrisa.com.my
Italy www.esriitalia.it
Japan www.esrij.com
Korea www.esrikr.co.kr
Malaysia www.esrisa.com.my
Netherlands www.esrinl.com
Northeast Africa 202-516-7485
Poland www.esripolska.com.pl
No. GS-35F-5086H
Printed in USA
ESRI International Offices
ESRI Regional Offices
Olympia 360-754-4727
St. Louis 636-949-6620
Minneapolis 651-454-0600
Philadelphia 610-644-3374
Boston 978-777-4543
Washington, D.C. 703-506-9515
Charlotte 704-541-9810
San Antonio 210-499-1044
Denver 303-449-7779
California 909-793-2853 ext. 1-1906
Portugal www.esri-portugal.pt
Romania www.esriro.ro
Singapore www.esrisa.com
Spain www.esri-es.com
Sweden www.esri-sweden.com
Thailand www.esrith.com
United Kingdom www.esriuk.com
Venezuela www.esriven.com
1-800-GIS-XPRT (1-800-447-9778)
www.esri.com
Locate an ESRI value-added reseller near you at
www.esri.com/resellers
Outside the United States, contact your local ESRI distributor. For the number of your distributor, call ESRI at 909-793-2853, ext. 1-1235, or visit our Web site at
www.esri.com/distributors
For More Information
ESRI 380 New York Street Redlands, California 92373-8100 USA
Phone: 909-793-2853Fax: 909-793-5953 E-mail: [email protected]
For more than 35 years, ESRI has
been helping people make better
decisions through management
and analysis of geographic
information. A full-service GIS
company, ESRI offers a framework
for implementing GIS technology
and business logic in any
organization from personal GIS on
the desktop to enterprise-wide GIS
servers (including the Web) and
mobile devices. ESRI GIS solutions
are flexible and can be customized
to meet the needs of our users.