Embed Size (px)
Citation preview


ESTIMATING THE VALUE OF THE
MARINE, COASTAL AND OCEAN RESOURCES
OF NEWFOUNDLAND AND LABRADOR (FOR THE PERIOD 1997 TO 1999)
Economics and Statistics BranchDepartment of Finance
Government of Newfoundland and LabradorMarch 2002
Estimating the Value of the Marine, Coastal and Ocean Resources of Newfoundland and Labrador wasprepared by the Economics and Statistics Branch, Department of Finance for Fisheries and Oceans Canada -Science, Oceans and Environment Branch (www.nfl.dfo-mpo.gc.ca) and the Department of Fisheries andAquaculture (www.gov.nf.ca/fishaq). All data is current as of September 30, 2001. The Economics andStatistics Branch can be reached as follows:
Economics and Statistics BranchDepartment of FinanceP.O. Box 8700St. John’s, NewfoundlandA1B 4J6Telephone: (709) 729-3255Facsimile: (709) 729-6944e-mail: [email protected]
To visit the web sites of the Economics and Statistics Branch:
Economic Research and Analysis Divisionwww.economics.gov.nf.ca
Newfoundland Statistics Agencywww.nfstats.gov.nf.ca
This report is available through the Economic Research and Analysis Division web site.
Readers should note that slight variations in format can occur between the PDF version of this report and the officialhard copy obtained from the Departments mentioned below.
TABLE OF CONTENTS
Acknowledgements . . . . . . . . . . . . . . . . . . . . . . . . . . . . . . . . . . . . . . . . . . . . . . . . . . . . . . . Page 1
Glossary of Terms . . . . . . . . . . . . . . . . . . . . . . . . . . . . . . . . . . . . . . . . . . . . . . . . . . . . . . . . Page 3
Executive Summary . . . . . . . . . . . . . . . . . . . . . . . . . . . . . . . . . . . . . . . . . . . . . . . . . . . . . . . Page 4
1.0 Introduction . . . . . . . . . . . . . . . . . . . . . . . . . . . . . . . . . . . . . . . . . . . . . . . . . . . . . . . Page 71.1 Background . . . . . . . . . . . . . . . . . . . . . . . . . . . . . . . . . . . . . . . . . . . . . . . . . Page 71.2 Defining the Oceans Sector . . . . . . . . . . . . . . . . . . . . . . . . . . . . . . . . . . . . . Page 81.3 Methodology . . . . . . . . . . . . . . . . . . . . . . . . . . . . . . . . . . . . . . . . . . . . . . . Page 101.4 Relevance of this Study . . . . . . . . . . . . . . . . . . . . . . . . . . . . . . . . . . . . . . . Page 13
2.0 Overview of the Provincial Economy . . . . . . . . . . . . . . . . . . . . . . . . . . . . . . . . . . Page 142.1 Goods Sector . . . . . . . . . . . . . . . . . . . . . . . . . . . . . . . . . . . . . . . . . . . . . . . Page 142.2 Services Sector . . . . . . . . . . . . . . . . . . . . . . . . . . . . . . . . . . . . . . . . . . . . . . Page 152.3 Exports . . . . . . . . . . . . . . . . . . . . . . . . . . . . . . . . . . . . . . . . . . . . . . . . . . . . Page 162.4 Employment . . . . . . . . . . . . . . . . . . . . . . . . . . . . . . . . . . . . . . . . . . . . . . . . Page 17
3.0 Oceans-related Activity: the Private Sector . . . . . . . . . . . . . . . . . . . . . . . . . . . . . . Page 183.1 Oil and Gas . . . . . . . . . . . . . . . . . . . . . . . . . . . . . . . . . . . . . . . . . . . . . . . . Page 183.2 Fishery . . . . . . . . . . . . . . . . . . . . . . . . . . . . . . . . . . . . . . . . . . . . . . . . . . . . Page 203.3 Aquaculture . . . . . . . . . . . . . . . . . . . . . . . . . . . . . . . . . . . . . . . . . . . . . . . . Page 223.4 Shipbuilding and Ship Repair . . . . . . . . . . . . . . . . . . . . . . . . . . . . . . . . . . Page 223.5 Marine Tourism and Recreation . . . . . . . . . . . . . . . . . . . . . . . . . . . . . . . . Page 233.6 Marine Transportation and Infrastructure . . . . . . . . . . . . . . . . . . . . . . . . . Page 243.7 Oceans Technologies . . . . . . . . . . . . . . . . . . . . . . . . . . . . . . . . . . . . . . . . . Page 26
4.0 Oceans-related Activity: Federal Public Sector . . . . . . . . . . . . . . . . . . . . . . . . . . . Page 284.1 Fisheries and Oceans Canada . . . . . . . . . . . . . . . . . . . . . . . . . . . . . . . . . . . Page 284.2 Atlantic Canada Opportunities Agency . . . . . . . . . . . . . . . . . . . . . . . . . . . Page 294.3 Marine Atlantic . . . . . . . . . . . . . . . . . . . . . . . . . . . . . . . . . . . . . . . . . . . . . Page 294.4 Environment Canada . . . . . . . . . . . . . . . . . . . . . . . . . . . . . . . . . . . . . . . . . Page 304.5 Department of National Defence . . . . . . . . . . . . . . . . . . . . . . . . . . . . . . . . Page 304.6 Transport Canada . . . . . . . . . . . . . . . . . . . . . . . . . . . . . . . . . . . . . . . . . . . . Page 304.7 Natural Resources Canada . . . . . . . . . . . . . . . . . . . . . . . . . . . . . . . . . . . . . Page 314.8 Other Departments and Agencies . . . . . . . . . . . . . . . . . . . . . . . . . . . . . . . Page 31
5.0 Oceans-related Activity: Provincial Public Sector . . . . . . . . . . . . . . . . . . . . . . . . . Page 345.1 Department of Fisheries and Aquaculture . . . . . . . . . . . . . . . . . . . . . . . . . Page 345.2 Department of Industry, Trade and Rural Development . . . . . . . . . . . . . . Page 345.3 Department of Works, Services and Transportation . . . . . . . . . . . . . . . . . Page 355.4 Other Provincial Departments . . . . . . . . . . . . . . . . . . . . . . . . . . . . . . . . . . Page 355.5 Memorial University of Newfoundland . . . . . . . . . . . . . . . . . . . . . . . . . . . Page 36
6.0 Economic Impact of the Oceans Sector . . . . . . . . . . . . . . . . . . . . . . . . . . . . . . . . . Page 406.1 GDP Impact . . . . . . . . . . . . . . . . . . . . . . . . . . . . . . . . . . . . . . . . . . . . . . . . Page 406.2 Labour Income Impact . . . . . . . . . . . . . . . . . . . . . . . . . . . . . . . . . . . . . . . . Page 416.3 Employment Impact . . . . . . . . . . . . . . . . . . . . . . . . . . . . . . . . . . . . . . . . . . Page 41
7.0 Conclusions . . . . . . . . . . . . . . . . . . . . . . . . . . . . . . . . . . . . . . . . . . . . . . . . . . . . . . Page 43
Appendix 1 - Public Sector Data . . . . . . . . . . . . . . . . . . . . . . . . . . . . . . . . . . . . . . . . . . . . Page 44
Appendix 2 - Economic Impacts . . . . . . . . . . . . . . . . . . . . . . . . . . . . . . . . . . . . . . . . . . . . Page 47
Appendix 3 - Private Sector Data Sources . . . . . . . . . . . . . . . . . . . . . . . . . . . . . . . . . . . . . Page 50
Estimating the Value of the Marine, Coastal and Ocean Resources of Newfoundland and Labrador
Page 1
ACKNOWLEDGEMENTS
This report was completed by the Economics and Statistics Branch, Department of Finance forFisheries and Oceans Canada and Newfoundland and Labrador’s provincial Department of Fisheriesand Aquaculture.
The Economics and Statistics Branch wishes to acknowledge the following individuals for theircontribution and effort toward this study.
Steering Committee
John Collins, Fisheries and Oceans Canada, Government of CanadaFrank Corbett, Fisheries and Oceans Canada, Government of CanadaBrian Delaney, Department of Fisheries and Aquaculture, Government of Newfoundland and LabradorRod Forsey, Department of Finance, Government of Newfoundland and LabradorLeslie Grattan, Environmental Planning & Projects Management, Government of Newfoundland andLabradorBill Hickey, Fisheries and Oceans Canada, Government of CanadaDon Hogan, Atlantic Canada Opportunities Agency, Government of CanadaAlton Hollett, Department of Finance, Government of Newfoundland and LabradorMike Warren, Department of Fisheries and Aquaculture, Government of Newfoundland and Labrador
Working Group
Sharmane Allen, Fisheries and Oceans Canada, Government of CanadaRose AuCoin, Department of Finance, Government of Newfoundland and LabradorGerald Crane, Department of Finance, Government of Newfoundland and Labrador
Federal Government
Agriculture and Agri-Foods CanadaAtlantic Canada Opportunities AgencyCanadian Environmental Assessment AgencyCanadian Food Inspection AgencyCanadian Heritage - Parks Canada Canadian International Development AgencyCanadian Transportation AgencyCitizenship and Immigration CanadaDepartment of Foreign Affairs and International TradeDepartment of National DefenceEnvironment CanadaFisheries and Oceans Canada
Estimating the Value of the Marine, Coastal and Ocean Resources of Newfoundland and Labrador
Page 2
Health CanadaHuman Resources Development CanadaIndian and Northern Affairs CanadaIndustry CanadaInternational Development Research CentreJustice CanadaMarine Atlantic National Energy BoardNational Research CouncilNatural Resources CanadaOffice of Critical Infrastructure Protection and Emergency PreparednessPublic Works and Government Services CanadaRoyal Canadian Mounted PoliceTransport Canada
Provincial Government
Department of EnvironmentDepartment of Fisheries and AquacultureDepartment of Human Resources and EmploymentDepartment of Industry, Trade and Rural DevelopmentDepartment of Mines and EnergyDepartment of Tourism, Culture and RecreationDepartment of Works, Services and TransportationDepartment of Youth Services and Post-Secondary EducationMemorial University of Newfoundland (and affiliated faculties and institutes)
Federal-Provincial Partnerships
Canada-Newfoundland Offshore Petroleum Board
Estimating the Value of the Marine, Coastal and Ocean Resources of Newfoundland and Labrador
Page 3
GLOSSARY OF TERMS
Econometrics. An area of economics that combines economic theory and statisticalprinciples/methods in order to develop mathematical estimates of key economic relationships (e.g., anestimate of the relationship between consumer spending and income).
Goods Sector. Is a classification term for those industries that produce goods for local consumersor for export. It includes agriculture; logging and forestry; fishing and trapping; mining; crudepetroleum; utilities (electric power, gas and water); construction; and manufacturing. These industriesare often collectively referred to as the Good Producing Industries.
Gross Domestic Product (GDP). A measure of the value of all goods and services produced withinthe province in a given period. GDP measures the size of the economy and whether it is growing.Statistics Canada estimates GDP in two ways. First, GDP at market prices which values GDP bytotalling the expenditures required to purchase the goods and services produced. This method is oftenreferred to as GDP from the expenditure side. Second, GDP at factor cost which values GDP bysumming the payments made to the owners of the factors used in production (i.e., land, labour andmachinery/buildings) inclusive of profit, which is the factor payment to entrepreneurs. Also referredto as GDP from the income side. GDP at factor cost equals GDP at market prices less indirect taxesand subsidies.
Multiplier. A number used to determine the impact of an event/project/industry on the economy. Theratio of total change in output or employment to the initial change (or direct change). For example,if an industry were to create 100 new jobs, it would require materials and services from its supplyingindustries. If this increase in demand created 30 new jobs in the supplying industries, the employmentmultiplier would be 1.3 [i.e., 100 (direct) + 30 (spinoff)].
Services Sector. Is a classification term for those industries that produce services for local consumersor for export. It includes transportation and storage; communication; wholesale/retail trade; finance,insurance, and real estate; community, business and personal services; and public administration. Theseindustries are often collectively referred to as the Service Producing Industries.

Estimating the Value of the Marine, Coastal and Ocean Resources of Newfoundland and Labrador
1 Fiscal years 1997/98 to 1999/2000 for public sector entities.
Page 4
EXECUTIVE SUMMARY
Newfoundland and Labrador, including its culture, settlement patterns, and economy, has developedfrom its association with the ocean. Today, over 90 per cent of the province’s population live adjacentto or within a few kilometres of the ocean. In this context, and given the increasing utilization ofmarine, coastal and related resources, there is increased emphasis on defining, protecting andpreserving these assets. There is also a need to better understand their importance and contributionto the economy.
The provincial Department of Fisheries and Aquaculture and Fisheries and Oceans Canada are seekingto determine the economic value of oceans, marine and coastal activity (i.e., the oceans sector) in theprovince. Economic value can be derived from ocean resources and from use of the ocean as a meansof movement, operation, business activity, and innovation. Estimating this value is important forpolicy development and management decisions at both the federal and provincial level, and inunderstanding the role and importance of industries and other stakeholders vis-à-vis their economiccontributions in the oceans sector.
This study, completed by the provincial Department of Finance, attempts to estimate the economicvalue of the oceans sector to the provincial economy. Using 1997-1999 as the reference period,1 thisstudy includes both private sector industries (i.e., oil and gas, fishery, aquaculture, shipbuilding,boatbuilding, marine tourism and recreation, marine transportation, and oceans technologies) andfederal and provincial public sector oceans-related departments and agencies.
The economic impacts of an activity or project encompass a wide array of indicators such as GrossDomestic Product (GDP), labour income (wages and salaries plus supplementary labour income suchas employers’ portion of mandatory employment programs and pension contributions) andemployment. To calculate economic impacts, the Department of Finance used the Newfoundland andLabrador Econometric Model and multipliers from the provincial Input-Output Model.
For the purposes of this study, economic impacts are separated into three components:
S Direct impacts are labour income and business profits earned as a result of working directlyon a given activity or project;
S Indirect impacts are generated when other firms supply goods and services to the directactivity or project; and
S Induced impacts are generated when the direct and indirect employees and business ownersspend their incomes on other areas of the economy which leads to increased retail sales,housing starts and other expenditures.
Estimating the Value of the Marine, Coastal and Ocean Resources of Newfoundland and Labrador
2 When using individual industry impacts readers should consult Note on Individual Industry Impacts on
page 12, in Section 1.3.
Page 5
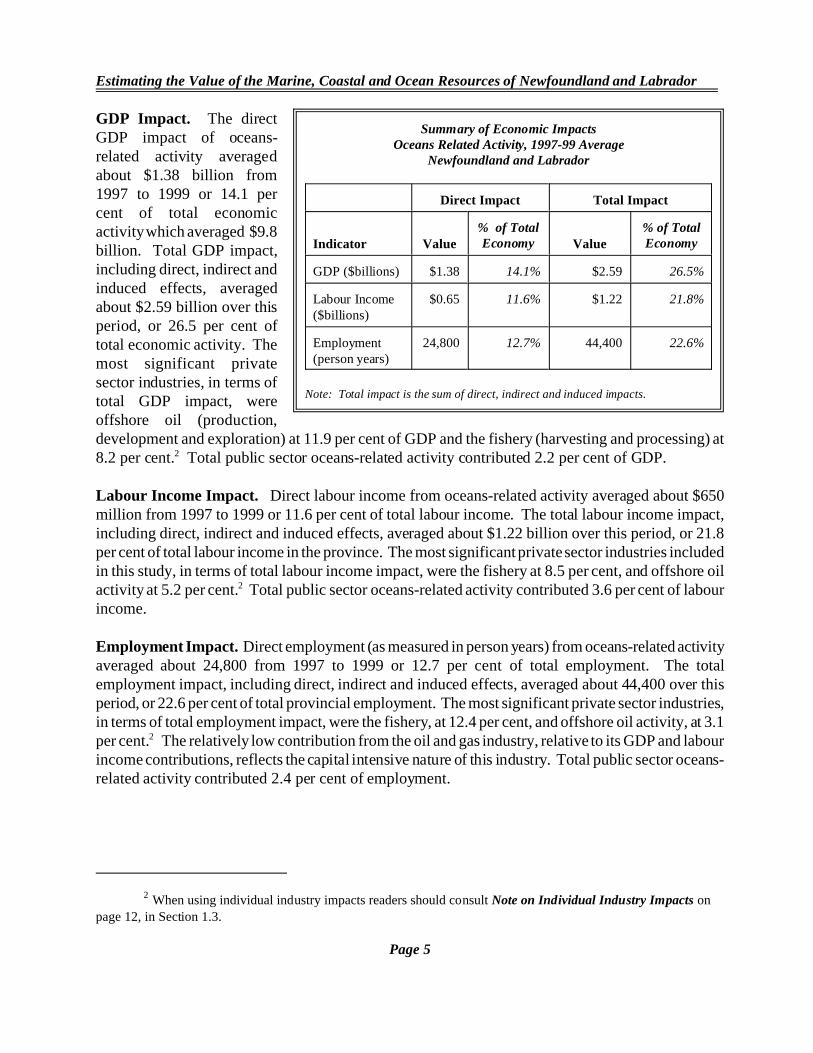
GDP Impact. The directGDP impact of oceans-related activity averagedabout $1.38 billion from1997 to 1999 or 14.1 percent of total economicactivity which averaged $9.8billion. Total GDP impact,including direct, indirect andinduced effects, averagedabout $2.59 billion over thisperiod, or 26.5 per cent oftotal economic activity. Themost significant privatesector industries, in terms oftotal GDP impact, wereoffshore oil (production,development and exploration) at 11.9 per cent of GDP and the fishery (harvesting and processing) at8.2 per cent.2 Total public sector oceans-related activity contributed 2.2 per cent of GDP.
Labour Income Impact. Direct labour income from oceans-related activity averaged about $650million from 1997 to 1999 or 11.6 per cent of total labour income. The total labour income impact,including direct, indirect and induced effects, averaged about $1.22 billion over this period, or 21.8per cent of total labour income in the province. The most significant private sector industries includedin this study, in terms of total labour income impact, were the fishery at 8.5 per cent, and offshore oilactivity at 5.2 per cent.2 Total public sector oceans-related activity contributed 3.6 per cent of labourincome.
Employment Impact. Direct employment (as measured in person years) from oceans-related activityaveraged about 24,800 from 1997 to 1999 or 12.7 per cent of total employment. The totalemployment impact, including direct, indirect and induced effects, averaged about 44,400 over thisperiod, or 22.6 per cent of total provincial employment. The most significant private sector industries,in terms of total employment impact, were the fishery, at 12.4 per cent, and offshore oil activity, at 3.1per cent.2 The relatively low contribution from the oil and gas industry, relative to its GDP and labourincome contributions, reflects the capital intensive nature of this industry. Total public sector oceans-related activity contributed 2.4 per cent of employment.
Summary of Economic ImpactsOceans Related Activity, 1997-99 Average
Newfoundland and Labrador
Direct Impact Total Impact
Indicator Value% of TotalEconomy Value
% of TotalEconomy
GDP ($billions) $1.38 14.1% $2.59 26.5%
Labour Income($billions)
$0.65 11.6% $1.22 21.8%
Employment(person years)
24,800 12.7% 44,400 22.6%
Note: Total impact is the sum of direct, indirect and induced impacts.

Estimating the Value of the Marine, Coastal and Ocean Resources of Newfoundland and Labrador
3 Estimated by the Newfoundland Statistics Agency.
Page 7
1.0 INTRODUCTION
1.1 BACKGROUND
The coast of Newfoundland and Labrador is made up of thousands of inlets, coves, and bays with anestimated length of 17,540 km. Of this, the island of Newfoundland’s coastline is approximately 9,655km, and Labrador’s is about 7,885 km. Canadian sovereign territory off the Atlantic Coast extends380 km from the coast of the province, resulting in an ocean area off the province’s coastline ofapproximately 1.1 million sq. km.3
Newfoundland and Labrador, including its culture, settlement patterns, and economy, has developedfrom its association with the ocean. Today, over 90 per cent of the province’s population live adjacentto, or within a few kilometres of, the ocean. The increasing utilization of marine, coastal and relatedresources has increased the need to define, protect and preserve these assets, and to better understandtheir importance and contribution to the economy.
Two of Newfoundland and Labrador’s key industries, oil and gas production and the fishery, areocean-based. However, the importance of ocean-related activity goes beyond these two industries:
S As an island, marine transportation infrastructure provides a vital link between the provinceand the rest of Canada, and is necessary to service coastal communities within the Province.To this end, significant public funds are expended by both the federal and provincialgovernments.
S Marine transportation is also vital for cargo transport and tourism development. Improvingport infrastructure at St. John’s, Corner Brook, Bull Arm, Marystown and other towns allowslocal authorities to increase their cargo transport capacities, engage in ocean-basedmanufacturing and fabrication, attract cruiseships, and open up new economic opportunity.Manufacturers of newsprint, lumber, refined petroleum, and non-resource based goods andservices rely on marine transportation to reach export markets. Similarly, tourism promotionand marketing packages often include whale watching, iceberg viewing, sea kayaking, andother ocean-related activity.
S Memorial University of Newfoundland, the Marine Institute, and various other public andprivate sector research centres are increasingly focused on marine-based environmental,geomatics, communications, and navigational technologies.
The provincial Department of Fisheries and Aquaculture and Fisheries and Oceans Canada wish todetermine the economic value of oceans, marine and coastal activity (i.e., the oceans sector) in theprovince. This report attempts to estimate the importance of the oceans sector to the economy of
Estimating the Value of the Marine, Coastal and Ocean Resources of Newfoundland and Labrador
4 Other federal departments and agencies have oceans related responsibilities but have no directoperational or labour expenditures in Newfoundland and Labrador and are, therefore, not included in this study.
Page 8
Newfoundland and Labrador, building on methodologies previously used for analyses in NewBrunswick (2000), Nova Scotia (1998), Australia (1997) and the United Kingdom (1996).
1.2 DEFINING THE OCEANS SECTOR
For the purposes of this study, the area under consideration includes the coastline, inshore andnearshore waters, as well as activity in offshore areas to the edge of the continental shelf.
Marine resources in these areas can be classified as economic or ecological. This study focuses on theoceans sector as an economic resource and includes two broadly based industrial groupings in boththe private and public sectors:
S Industries that use/extract ocean resources, including offshore oil production, the fishery, and(to some degree) tourism.
S Industries that use the ocean as a medium of movement, operation or innovation. This wouldinclude marine system design and construction, marine operations and shipping, and marine-related equipment and service industries.
Private sector industries considered in the study include:
S oil and gasS fisheryS aquacultureS shipbuilding and ship repairS marine tourism and recreationS marine transportation and infrastructure (including ports and harbours)S oceans technologies (marine IT, communications, environmental, biotechnology).
Public sector departments, institutions and agencies include:
Federal4
SS Agriculture and Agri-Foods CanadaS Atlantic Canada Opportunities AgencyS Canadian Environmental Assessment AgencyS Canadian Food Inspection AgencyS Canadian Heritage - Parks CanadaS Canadian Transportation Agency
Estimating the Value of the Marine, Coastal and Ocean Resources of Newfoundland and Labrador
5 Includes activities of the former Department of Environment and Labour.
6 Includes activities of the former Departments of Industry, Trade and Technology and Development andRural Renewal.
7 Includes activities of the former Department of Education.
Page 9
S Citizenship and Immigration CanadaS Department of Foreign Affairs and International TradeS Department of National DefenceS Environment CanadaS Fisheries and Oceans CanadaS Human Resources Development CanadaS Industry CanadaS Justice CanadaS Marine AtlanticS Natural Resources CanadaS National Research CouncilS Office of Critical Infrastructure Protection and Emergency PreparednessS Public Works and Government Services CanadaS Royal Canadian Mounted PoliceS Transport Canada
Provincial
S Department of Environment5
S Department of Fisheries and AquacultureS Department of Human Resources and EmploymentS Department of Industry, Trade and Rural Development6
S Department of Mines and EnergyS Department of Tourism, Culture and RecreationS Department of Works, Services and TransportationS Department of Youth Services and Post Secondary Education7
S Memorial University of Newfoundland
Federal-Provincial Partnerships
Canada-Newfoundland Offshore Petroleum Board
Estimating the Value of the Marine, Coastal and Ocean Resources of Newfoundland and Labrador
8 Each of these institutes is affiliated with Memorial University.
Page 10
Research and Development institutes8
S AquanetS Canadian Centre For Fisheries InnovationS Canadian Centre For Marine CommunicationsS C-CORES Centre for Aquaculture and Seafood DevelopmentS Centre for Earth Resources ResearchS Fisheries Technology UnitS GENESIS GroupS Ocean Engineering Research CentreS Oceans Sciences Centre.
1.3 METHODOLOGY
The analytical phase of the study encompassed two key blocks: data collection and economic impactanalysis. The initial phase of data collection concentrated on the identification of the private sectorindustries and government departments/agencies that make up the oceans sector in Newfoundland andLabrador. Every effort was made to include significant and quantifiable data from both the private andpublic sectors. A list of entities included was outlined in Section 1.2 - Defining the Oceans Sector.
The reference period for the study was 1997 to 1999. The data for the three years were adjusted toremove double counting, and was averaged to help minimize the problems of fluctuations in oceans-related activity over the period. Key data collected for the private sector industries included GrossDomestic Product, labour income and employment. This data came from various sources outlined inAppendix 3. Public sector data came from department labour income and employment (in full-yearequivalents) and is contained in Appendix 1.
Fisheries and Oceans Canada managed the collection of federal departmental and agency data. Twenty–seven federal departments and agencies deemed to have oceans-related responsibilities werecontacted via letter and asked to contribute to the project. Twenty-one of these responded withinformation pertaining to total departmental/agency expenditures, income expenditures and numberof full time equivalent positions pertaining to fiscal years 1996/97 to 1998/99. The remainingdepartments/agencies indicated that they had no direct expenditures related to ocean activity inNewfoundland and Labrador or that the expenditures were minimal.
The Department of Finance coordinated and managed the collection of data from seven provincialdepartments and Memorial University of Newfoundland. It should be noted that a number of federaland provincial departments cautioned that their internal reporting mechanisms were not set up to reply
Estimating the Value of the Marine, Coastal and Ocean Resources of Newfoundland and Labrador
Page 11
to a request of this nature and that the data should be treated as estimates and considered conservativein most cases.
The study also included cost-shared economic development agreements whose program delivery oftenincludes several federal (e.g., Fisheries and Oceans Canada, Atlantic Canada Opportunities Agency)and provincial (e.g., Industry, Trade and Rural Development; Fisheries and Aquaculture; Tourism, Culture and Recreation) departments. For simplicity, expenditures made through these agreementsare, unless otherwise indicated, included with the Atlantic Canada Opportunities Agency and Industry,Trade and Rural Development expenditures.
The provincial Department of Finance also managed the collection of private sector data. A numberof sources were used to find, and in some cases, derive the data. A list of sources for private sectordata is contained in Appendix 3. Although the goal of the study was to be as comprehensive aspossible, not all industries or sub-industries are included due to lack of data. As such, the study’sresults should be considered conservative.
While recognising that oceans technologies, research and development (R&D) institutes, and industryassociations (e.g., Newfoundland Ocean Industries Association, Newfoundland Association ofTechnical Industries) are a component of the oceans sector, for the purposes of this study these entitieswere not included as a direct data source as these activities are, in most cases, captured in the indirectimpacts.
The economic impacts of the public and private entities identified in this study are separated into threecategories:
S Direct impacts are labour income and business profits earned by workers and business ownersworking directly on a given activity or project;
S Indirect impacts are generated when other firms supply goods and services to the directactivity or project; and
S Induced impacts are generated when direct and indirect employees and business owners spendtheir incomes on other areas of the economy which leads to increased retail sales, housingstarts and so on.
The primary data formed the direct economic impact of the oceans sector. Two economic analysistools, the Newfoundland and Labrador Econometric and Input-Output Models, were then used todetermine the indirect and induced impacts of the oceans sector.
The Newfoundland and Labrador Econometric Model (NALEM), is a detailed model of therelationships between key economic variables in the provincial economy and is used by governmentfor economic forecasting as well as to assess the macroeconomic impacts created by majordevelopment projects and government policy changes. NALEM contains over 370 mathematicalequations and 600 data series which are designed to represent key aspects of the provincial economy,and to capture the relationship between certain socioeconomic variables or indicators. For example,
Estimating the Value of the Marine, Coastal and Ocean Resources of Newfoundland and Labrador
Page 12
changes in consumer spending can affect government revenues, employment levels, investmentspending, and so on; NALEM tries to capture these relationships. The model is designed to capturethe major economic relationships in the provincial economy, but not the minute details of every aspectof economic activity. It provides a representation of the current structure (i.e., basic economicrelationships) of the provincial economy. As this structure changes (e.g., EI program changes, taxharmonization, collapse of the groundfishery, development of the oil and gas industry, etc.), the modelis modified to capture the new or changed economic relationships. NALEM is organized into 10different sectors. Consumer spending, residential construction, business investment, governmentspending, exports, and imports comprise the six expenditure sectors essential to the determination ofGDP and other key economic indicators. The remaining four sectors cover income and output,demographic and labour market activity, prices and wages, and government revenue. The governmentrevenue sector deals with the revenues of all levels of government. Forecasts can be produced for allmain indicators of provincial economic activity including GDP, personal income, labour force,employment, and Consumer Price Index (CPI). Forecasts for detailed components and determinantsof the main economic indicators are also available. Forecasts of economic indicators which are largelydetermined by factors outside of the provincial economy (e.g., interest rates, exchange rates, certaincommodity prices, etc.) are generally obtained from external sources such as national forecastingagencies. NALEM has been in use since 1990.
The Newfoundland and Labrador Input-Output Model (NALIOM), simulates the relationshipsbetween commodity outputs and commodity inputs at an industry level under the assumption oflinearity (that is, that inputs used by an industry in the past to produce a commodity will be used in thesame proportions in future for producing any incremental output). NALIOM can provide estimatesof GDP and employment impacts of over 600 types of commodity purchases on over 200 industries(i.e., the direct impact). It can also provide the impacts of purchases locally sourced to specificindustries (i.e., the indirect impact). The model’s strength lies in its ability to capture backwardlinkages that arise from the production of one industry’s inputs by other industries, and, in turn, theproduction of inputs for those industries by their suppliers.
Multipliers from NALIOM were used in this study to obtain the indirect industry impacts, which arethe impacts of oceans-related activities on the industries that supply the direct industries with inputs.NALEM was used to capture the induced impacts on the provincial economy, which includes impactsrelated to the spending of workers who are directly or indirectly employed in oceans-related activity.
Note on Individual Industry ImpactsIn some cases direct oceans related industries are also indirect (e.g., transportation servicesused by the oil and gas industry). To avoid double counting, the indirect multipliers have beenadjusted to remove any direct impacts quantified elsewhere. As such, readers are cautioned thatindividual industry impacts in this report are lower in some cases than if an impact wasconducted for an industry on a stand alone basis.

Estimating the Value of the Marine, Coastal and Ocean Resources of Newfoundland and Labrador
Page 13
1.4 RELEVANCE OF THIS STUDY
Economic value can be derived from ocean resources, and from use of the ocean as a means ofmovement, operation, business activity (e.g., tourism), and innovation (e.g., engineering, shipbuilding,shipping, research and development). Estimating this value is important for several reasons:
S Fisheries and Oceans Canada can incorporate the analysis and results into policies andmanagement decisions as part of its oceans mandate and development of its oceans strategy;
S It can assist the Atlantic Canada Opportunities Agency in facilitating economic developmentand building on identified oceans-related opportunities;
S The Government of Newfoundland and Labrador can utilize the results to further itstransportation, economic development, and information technology agendas as well asassisting in the development of integrated coastal zone management plans;
S Both orders of government will better understand the role and importance of industries andother stakeholders vis-à-vis their economic contributions in the oceans sector;
S The study will provide baseline and benchmark data from which future trends and growth canbe measured, and from which statistics and other information to develop policy can be derived;and
S It will allow for interprovincial analysis with other Atlantic provinces which have completedor are undertaking similar research.
Section Two of this study is an overview of Newfoundland and Labrador’s economy. Sections Threeto Five provide a qualitative descriptive overview of oceans-related industries and activities. SectionSix includes a quantitative analysis of the economic value of the oceans sector in the province. TheAppendices include data tables and data sources.
Estimating the Value of the Marine, Coastal and Ocean Resources of Newfoundland and Labrador
9 GDP at market prices measures payments to the owners of factor inputs used in production and includes
indirect taxes and subsidies. This differs from GDP at factor cost which excludes indirect taxes and subsidies.
10 Nominal GDP, not adjusted for inflation, was $14.1 billion in 2000. This is 13.8 per cent higher thanoutput in 1999 and 33.2 per cent higher than 1997.
11 The projected comparative percentage for 2000 is about 70 per cent.
Page 14
2.0 OVERVIEW OF THE PROVINCIAL ECONOMY
In 1999, Newfoundland and Labrador’s economy produced output (measured as Gross DomesticProduct or GDP at market prices9) of about $12.1 billion before deflating for inflation. Thisrepresented growth of 15.2 per cent from $10.5 billion in 1997.10 This expansion was due to majorcapital investment projects, and economic restructuring and diversification. Exports, in particularcrude oil, were a main factor in this expansion.
The province’s output per person relative to Canada as a whole has improved in recent years due tothis sustained period of strong economic growth. Real GDP (discounted for inflation) per person forNewfoundland and Labrador was 68.8 per cent of the Canadian average in 1999, up from 64.5 percent in 1997.11
2.1 GOODS SECTOR
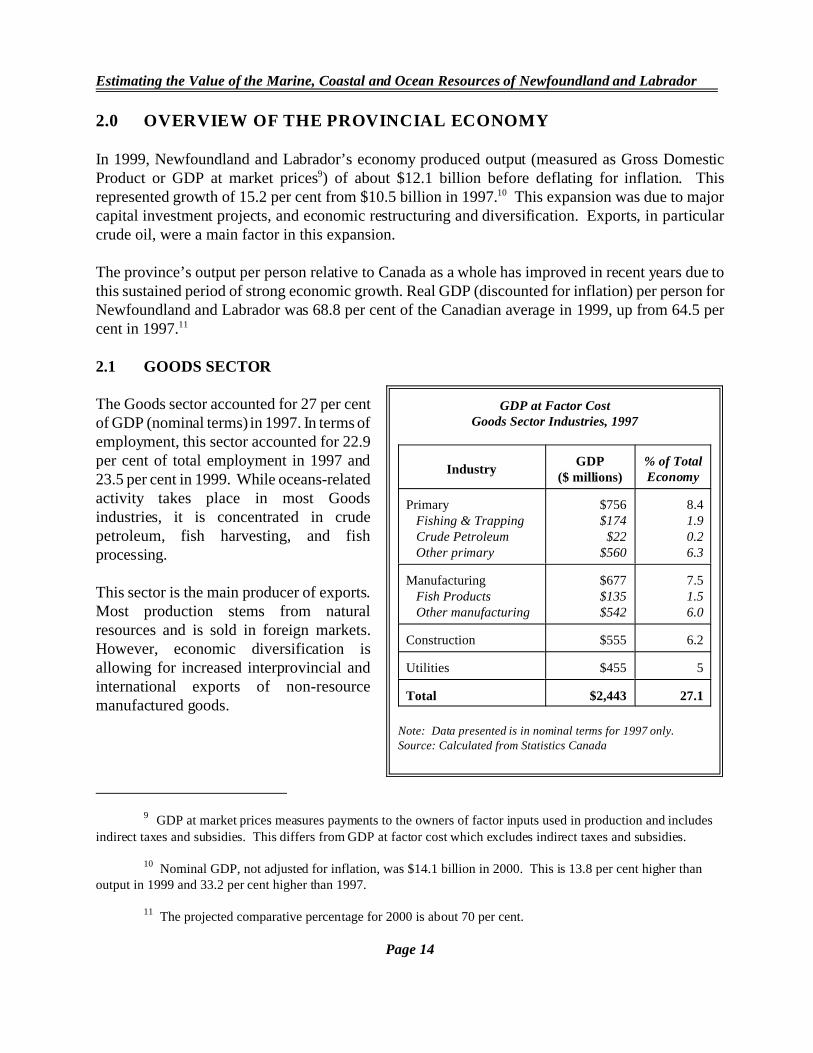
The Goods sector accounted for 27 per centof GDP (nominal terms) in 1997. In terms ofemployment, this sector accounted for 22.9per cent of total employment in 1997 and23.5 per cent in 1999. While oceans-relatedactivity takes place in most Goodsindustries, it is concentrated in crudepetroleum, fish harvesting, and fishprocessing.
This sector is the main producer of exports.Most production stems from naturalresources and is sold in foreign markets.However, economic diversification isallowing for increased interprovincial andinternational exports of non-resourcemanufactured goods.
GDP at Factor CostGoods Sector Industries, 1997
IndustryGDP
($ millions)% of TotalEconomy
Primary Fishing & Trapping Crude Petroleum Other primary
$756$174
$22$560
8.41.90.26.3
Manufacturing Fish Products Other manufacturing
$677$135$542
7.51.56.0
Construction $555 6.2
Utilities $455 5
Total $2,443 27.1
Note: Data presented is in nominal terms for 1997 only.Source: Calculated from Statistics Canada
Estimating the Value of the Marine, Coastal and Ocean Resources of Newfoundland and Labrador
12 Production in 2000 was 52.8 million barrels.
13 In 2000, landings were about 275,000 tonnes, with a landed value of $581 million.
14 The value of retail sales was a record $4.52 billion in 2000. Employment was 37,000.
Page 15
Offshore oil is the highest valued commodity produced in Newfoundland and Labrador. The Hiberniafield, which started producing in 1997, extracted 36.4 million barrels of oil in 1999 with an estimatedmarket value of approximately $1 billion.12 A Development Application on the Terra Nova field wasapproved in 1997 and the construction phase for the project commenced in 1998. The White Roseproject is currently in the planning stages with production scheduled to come on stream in 2005.
The fishery has played a fundamental role inthe province’s economic development.Problems with historically dominantgroundfish stocks in the early 1990s,however, resulted in moratoria on many ofthese stocks. Since then, the fishery hasrestructured and diversified. Shellfish nowdominates the industry, particularly shrimpand crab. In 1999, about 270,000 tonnes offish were landed, valued at $505.8 million.This was an increase from a landed volumeof 204,400 tonnes and a landed value of$306.6 million in 1997.13
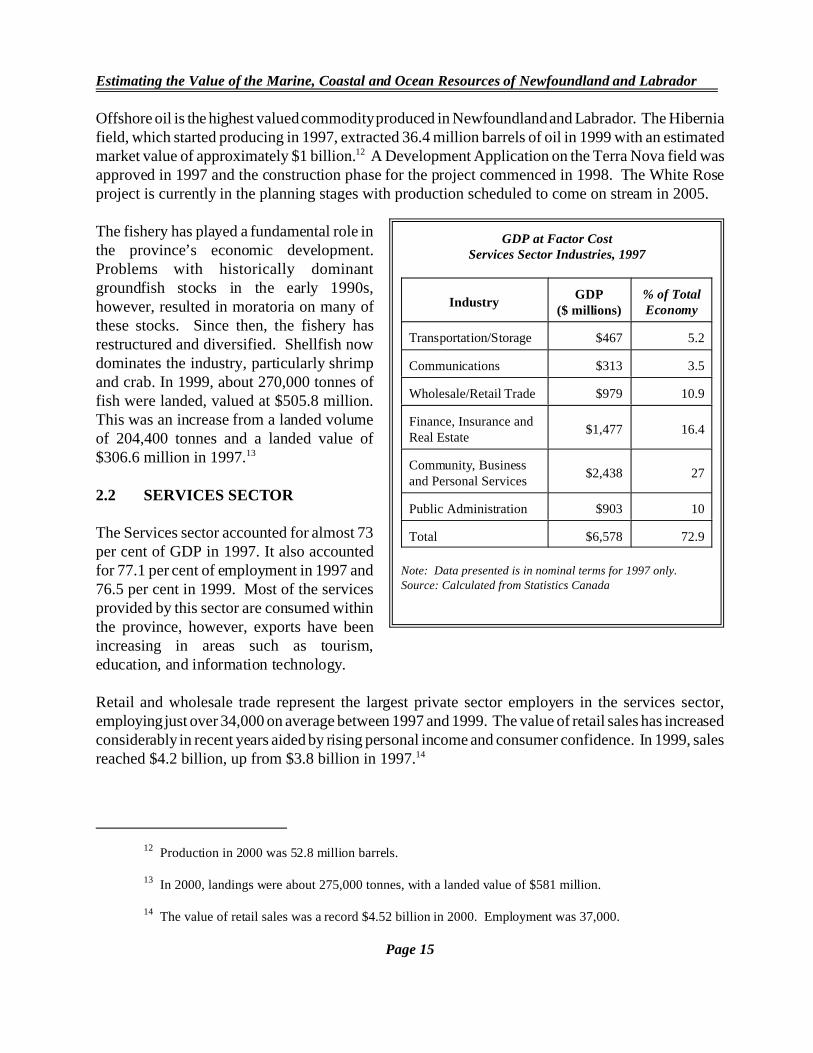
2.2 SERVICES SECTOR
The Services sector accounted for almost 73per cent of GDP in 1997. It also accountedfor 77.1 per cent of employment in 1997 and76.5 per cent in 1999. Most of the servicesprovided by this sector are consumed withinthe province, however, exports have beenincreasing in areas such as tourism,education, and information technology.
Retail and wholesale trade represent the largest private sector employers in the services sector,employing just over 34,000 on average between 1997 and 1999. The value of retail sales has increasedconsiderably in recent years aided by rising personal income and consumer confidence. In 1999, salesreached $4.2 billion, up from $3.8 billion in 1997.14
GDP at Factor CostServices Sector Industries, 1997
IndustryGDP
($ millions)% of TotalEconomy
Transportation/Storage $467 5.2
Communications $313 3.5
Wholesale/Retail Trade $979 10.9
Finance, Insurance andReal Estate
$1,477 16.4
Community, Businessand Personal Services
$2,438 27
Public Administration $903 10
Total $6,578 72.9
Note: Data presented is in nominal terms for 1997 only. Source: Calculated from Statistics Canada
Estimating the Value of the Marine, Coastal and Ocean Resources of Newfoundland and Labrador
15 Includes air, auto and cruiseship visitors. In 2000, there were 426,250 non-resident visitors to theprovince.
16 Public sector employment in 2000 was 58,800, or 36.8 per cent of Services sector employment and 28.7per cent of total employment.
17 Exports in 2000 were valued at about $8.2 billion.
Page 16
Tourism is a growing services industry driven by the success of special events celebrations (e.g., Cabot500), increased cruiseship activity, improved infrastructure and more product offerings. Tourismexpenditures (resident and non-resident) totalled over $500 million per year over this period.Spending by non-resident tourists, which generally account for between 40 to 45 per cent of totalspending, represents a service export for the province. In 1999, there were 408,500 non-residentvisitors to the province.15
The provision of public services is a major employment generator in the services sector. In 1997,public services accounted for employment of 55,900, or 38.3 per cent of service employment (29.5per cent of total employment). This includes those who work for a local, provincial or federalgovernment, for a government service or agency, a crown corporation, or a government fundedestablishment (e.g., schools, universities, and hospitals). In 1999, public employment was estimatedat 60,300 or 38.5 per cent of service employment (29.4 per cent of total employment).16
Employment in other service industries has been boosted by private sector expansion anddiversification including new activities such as customer call centres, oceans technologies and offshoreengineering.
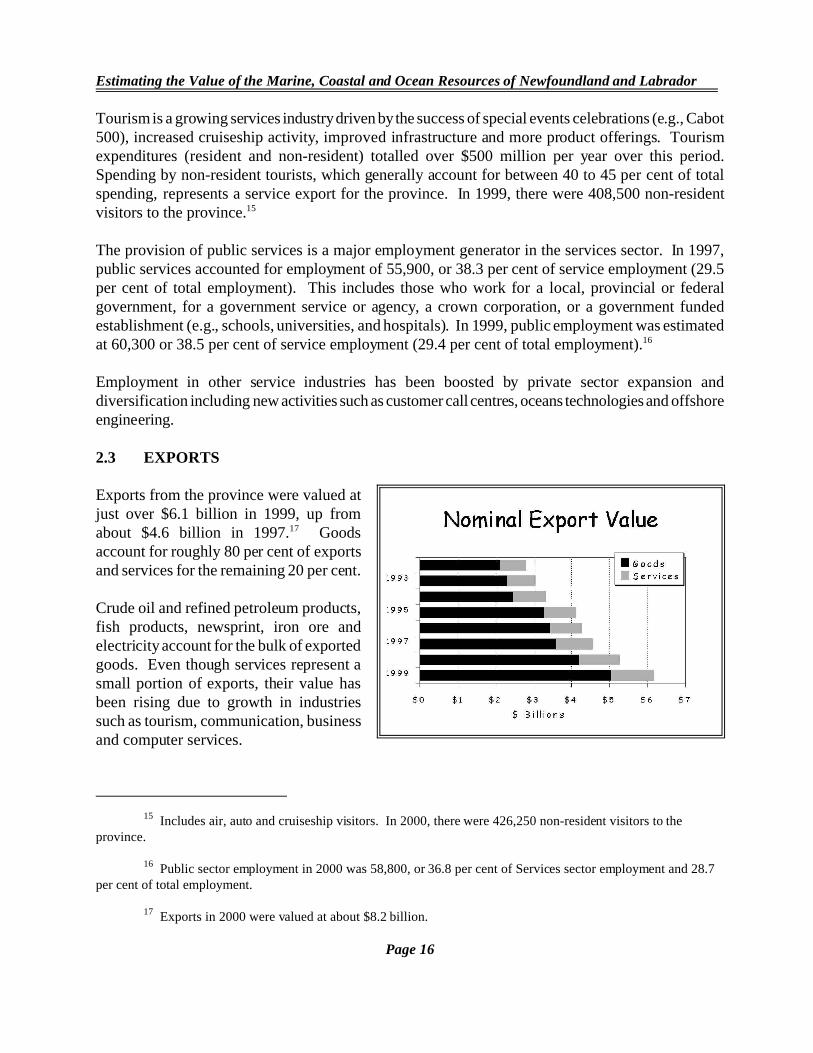
2.3 EXPORTS
Exports from the province were valued atjust over $6.1 billion in 1999, up fromabout $4.6 billion in 1997.17 Goodsaccount for roughly 80 per cent of exportsand services for the remaining 20 per cent.
Crude oil and refined petroleum products,fish products, newsprint, iron ore andelectricity account for the bulk of exportedgoods. Even though services represent asmall portion of exports, their value hasbeen rising due to growth in industriessuch as tourism, communication, businessand computer services.
Estimating the Value of the Marine, Coastal and Ocean Resources of Newfoundland and Labrador
18 Shipment value in 2000 was $2.2 billion.
19 Employment in 2000 was 204,600 which was relatively stable with 1999.
20 The unemployment rate fell in 2000 to 16.7 per cent.
Page 17
The value of manufactured shipments totalled just over $2 billion in 1999, most of which is bound forexport markets. While natural resources and oil refining dominate the industry, diversification of themanufacturing base continues with the goal of achieving a greater product mix for export and domesticconsumption.18
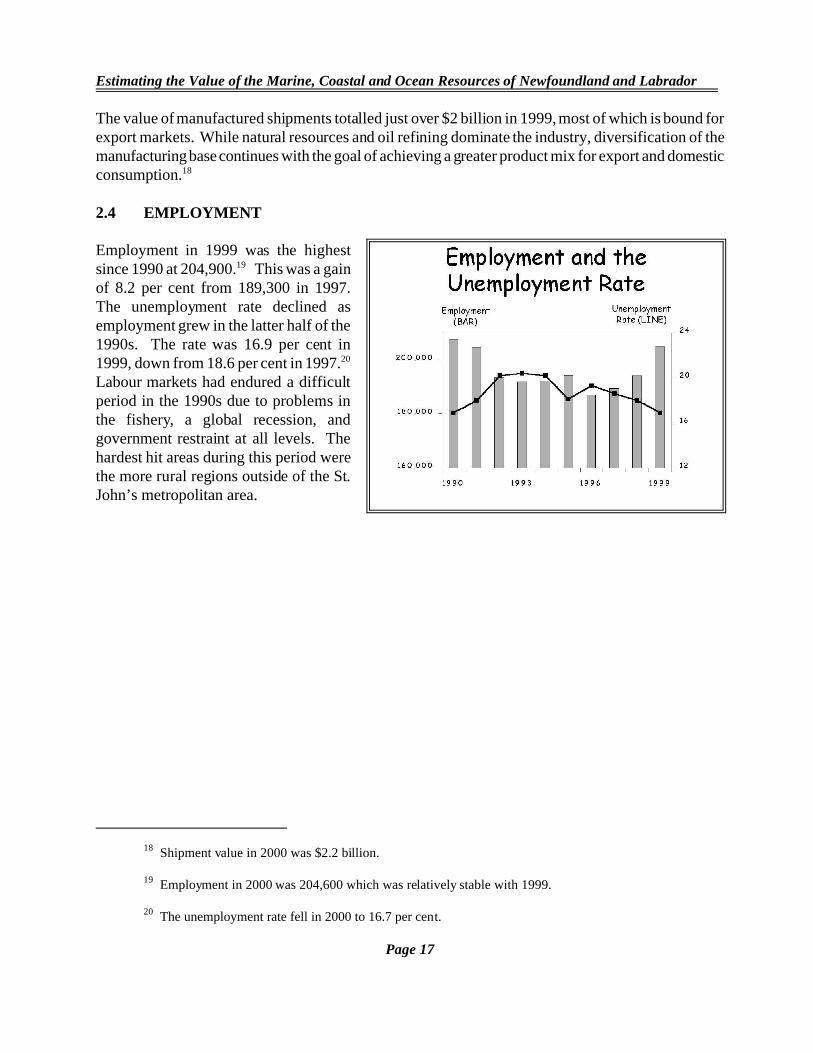
2.4 EMPLOYMENT
Employment in 1999 was the highestsince 1990 at 204,900.19 This was a gainof 8.2 per cent from 189,300 in 1997.The unemployment rate declined asemployment grew in the latter half of the1990s. The rate was 16.9 per cent in1999, down from 18.6 per cent in 1997.20
Labour markets had endured a difficultperiod in the 1990s due to problems inthe fishery, a global recession, andgovernment restraint at all levels. Thehardest hit areas during this period werethe more rural regions outside of the St.John’s metropolitan area.
Estimating the Value of the Marine, Coastal and Ocean Resources of Newfoundland and Labrador
21 Key industry data for these industries are included in Appendix 2.
Page 18
3.0 OCEANS-RELATED ACTIVITY: THE PRIVATE SECTOR 21
3.1 OIL AND GAS
Since offshore exploration activity started in 1966, over 200 wells have been drilled in the offshoreNewfoundland and Labrador area, and about 1.2 million square km. of seismic data have beencollected. There have been 23 significant discoveries, comprising 2.1 billion barrels of oil and 9.3trillion cubic feet of natural gas liquids. Industry expenditures from 1966 to 2000 totalled $13.6 billionin exploration ($4.3 billion), development ($8.3 billion), and production ($1.0 billion).
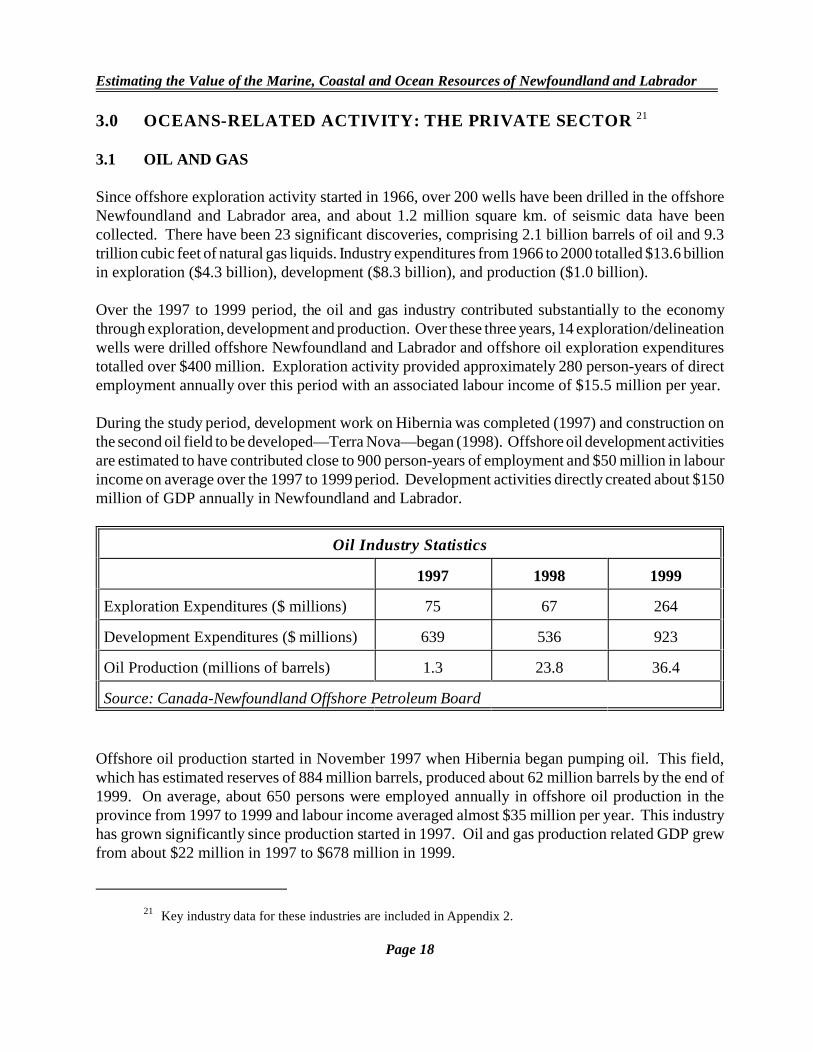
Over the 1997 to 1999 period, the oil and gas industry contributed substantially to the economythrough exploration, development and production. Over these three years, 14 exploration/delineationwells were drilled offshore Newfoundland and Labrador and offshore oil exploration expenditurestotalled over $400 million. Exploration activity provided approximately 280 person-years of directemployment annually over this period with an associated labour income of $15.5 million per year.
During the study period, development work on Hibernia was completed (1997) and construction onthe second oil field to be developed—Terra Nova—began (1998). Offshore oil development activitiesare estimated to have contributed close to 900 person-years of employment and $50 million in labourincome on average over the 1997 to 1999 period. Development activities directly created about $150million of GDP annually in Newfoundland and Labrador.
Oil Industry Statistics
1997 1998 1999
Exploration Expenditures ($ millions) 75 67 264
Development Expenditures ($ millions) 639 536 923
Oil Production (millions of barrels) 1.3 23.8 36.4
Source: Canada-Newfoundland Offshore Petroleum Board
Offshore oil production started in November 1997 when Hibernia began pumping oil. This field,which has estimated reserves of 884 million barrels, produced about 62 million barrels by the end of1999. On average, about 650 persons were employed annually in offshore oil production in theprovince from 1997 to 1999 and labour income averaged almost $35 million per year. This industryhas grown significantly since production started in 1997. Oil and gas production related GDP grewfrom about $22 million in 1997 to $678 million in 1999.
Estimating the Value of the Marine, Coastal and Ocean Resources of Newfoundland and Labrador
22 Estimated by the Department of Mines and Energy (2001).
23 The Whiffen Head Transshipment facility is included in Section 3.6, Marine Transportation.
Research and development in support of offshore activity is included in Section 5.4, Memorial University ofNewfoundland.
24 Note that the Canada-Newfoundland Offshore Petroleum Board is a federal-provincial partnership andnot a private sector entity. It is included with this section, however, as it is the regulatory body for the offshore oiland gas industry.
25 While the CNOPB is formally funded on a 50:50 basis by the federal and provincial governments, italso receives licensing and related fees from industry. During the study period, the CNOPB indicated that industryrevenues accounted for about 50% of its total revenues.
Page 19
Oil and gas activity represents a growth area with considerable upside potential for the economy ingeneral and for the oceans sector in particular. After some delays, production at Terra Nova beganin early 2002 and should average about 130,000 barrels of oil per day at capacity. In addition, thedevelopment of White Rose, the third field to be developed, will contribute significantly to theeconomy.
The development of this industry has resulted in new onshore infrastructure in this province worth$1.2 billion.22 Construction facilities include Bull Arm (a world class construction facility built forHibernia construction and subsequently used for Terra Nova construction in the late 1990s), andshipyards and related facilities at Marystown and St. John’s. Over 200 local firms supply goods andsupport services to the industry. Labour force development and expertise in the building andconstruction trades, engineering, offshore safety, and oil rig trades (e.g., well-head drilling) arebenefitting local residents and providing employment.23
Growth in this industry is driven by strong Canadian and United States energy markets. This industryis expected to expand and diversify over the next several years, facilitated by:
S The extension of offshore exploration activity into the Flemish Pass, Carson-Bonnition andSouth Whale Basins, South Coast of the Island, and Western Newfoundland;
S Joint industry-government work into natural gas development;S The emergence of technology transfer opportunities—front end engineering design; increased
local participation in seismic survey mapping; andS Increased participation in supply and support services aided by improving construction and
port/supply infrastructure.
Canada-Newfoundland Offshore Petroleum Board.24 Activity in the offshore oil and gas industryis managed by the Canada-Newfoundland Offshore Petroleum Board25. This joint federal-provincialauthority, established in 1985, administers the relevant provisions of the Canada-NewfoundlandAtlantic Accord Implementation Act and the Canada - Newfoundland Atlantic Accord ImplementationNewfoundland Act. The Board’s regulatory responsibilities include:
Estimating the Value of the Marine, Coastal and Ocean Resources of Newfoundland and Labrador
26 Shrimp and crab accounted for 75% of landed value in 2000. Fisheries employment in 2000 averaged15,200.
Page 20
S the sale of interest in lands;S the issuance of exploration licences, approvals and authorizations pertaining to exploration
activities;S the declaration of significant and commercial discoveries;S the issuance of production licences;S decisions related to the commencement, continuation and suspension of drilling and
production;S the administration of regulations; andS the exercise of emergency powers pertaining to safety, environmental protection and resource
conservation.
In addition to its regulatory role, the Board has the responsibility and authority to evaluate andapprove a proponent’s industrial benefits plan. In this role, the Board must be assured that theprovisions of the Atlantic Accord Acts are respected as they relate to providing full and fairopportunities to workers and companies in Canada, and in particular Newfoundland and Labrador, forthe supply of goods and services used in offshore activity. The Board employs about 45 people andexpends approximately $4.2 million annually.
3.2 FISHERY
Over the past century, the Newfoundland and Labrador fishing industry has transformed from apredominantly salt cod trade to a freshly frozen multispecies industry. This transformation was drivenby the introduction of new technologies in the harvesting sector, and by the construction of larger,technology-driven facilities in the processing sector. Fisheries development focussed on groundfishuntil 1992 when a fishing moratorium was called on the Northern cod stock. Moratoria on othergroundfish stocks were announced over the next two years.
In response to these moratoria, the fishing industry has undergone restructuring. This restructuring,involving a substantial reorientation primarily into shellfish species such as crab and shrimp, haspositively contributed in recent years to the overall performance of the Newfoundland and Labradoreconomy. In 1990, crab and shrimp accounted for 13 per cent of total landed value ($34 million of$258 million). By 1999, these two fisheries accounted for 70 per cent of total landed value ($354million of $506 million). This shift into shellfish has also meant that the fishery has become relativelymore capital intensive and less labour intensive. Total fisheries employment (measured in person years)peaked in 1987 at just about 26,000 and, in 1990, stood at 20,900. In 1999, employment stood at17,100.26

Estimating the Value of the Marine, Coastal and Ocean Resources of Newfoundland and Labrador
27 Landings declined to about 56,000 tonnes ($263 million) in 2000.
28 Landings grew to 77,400 tonnes ($179 million) in 2000.
Page 21
Fishing Industry Statistics
1997 1998 1999
Volume of Landings (metric tonnes) 206,026 251,100 270,620
Value of Landings ($ millions) 308.8 363.9 505.8
Employment (person years)
Harvesting 8,500 9,600 8,700
Processing 5,300 6,100 8,400
Total 13,800 15,700 17,100
Source: Department of Fisheries and Aquaculture; Statistics Canada; provincial Departmentof Finance
Note: These data only include the portion of offshore shrimp landings that accrue toNewfoundland-based licences and, hence, they tend to be lower than published DFO data.
Crab. Crab landings grew throughout the 1990s and peaked in 1999 at about 69,200 tonnes. Thelanded value of this fishery also grew to $236.3 million by 1999.27 About 3,400 inshore fishingenterprises and 35 processing plants participate in this fishery. During peak season, about 17,000people are employed in this fishery in harvesting and processing.
Northern Shrimp. In 1997, 39,000 tonnes of shrimp was landed in Newfoundland and Labrador. By1999 about 69,000 tonnes, valued at about $154 million, was landed.28 About one-half of this latteramount was landed by a relatively new (since 1996) fleet of 360 nearshore temporary shrimp permitholders. During peak season, about 3,000 people are employed in this fishery in harvesting andprocessing.
Groundfish. Despite experiencing a very severe blow in the early 1990s, groundfish activity rose overthe study period from 36,000 tonnes (valued at $31 million) in 1997 to 68,000 tonnes ($85 million)in 1999. Of this, cod comprised 12,000 tonnes ($11 million) in 1997 rising to 37,000 tonnes ($62million) in 1999. From 1987 to 1991 (i.e., pre-moratoria), landings of groundfish averaged about350,000 tonnes (including 250,000 tonnes of cod).
Estimating the Value of the Marine, Coastal and Ocean Resources of Newfoundland and Labrador
29 Weak markets limited production in 2000. Total sales declined by $4 million and total productiondropped by 1,500 tonnes.
30 This translates into about 250 person years of employment as jobs are not full-year.
Page 22
3.3 AQUACULTURE
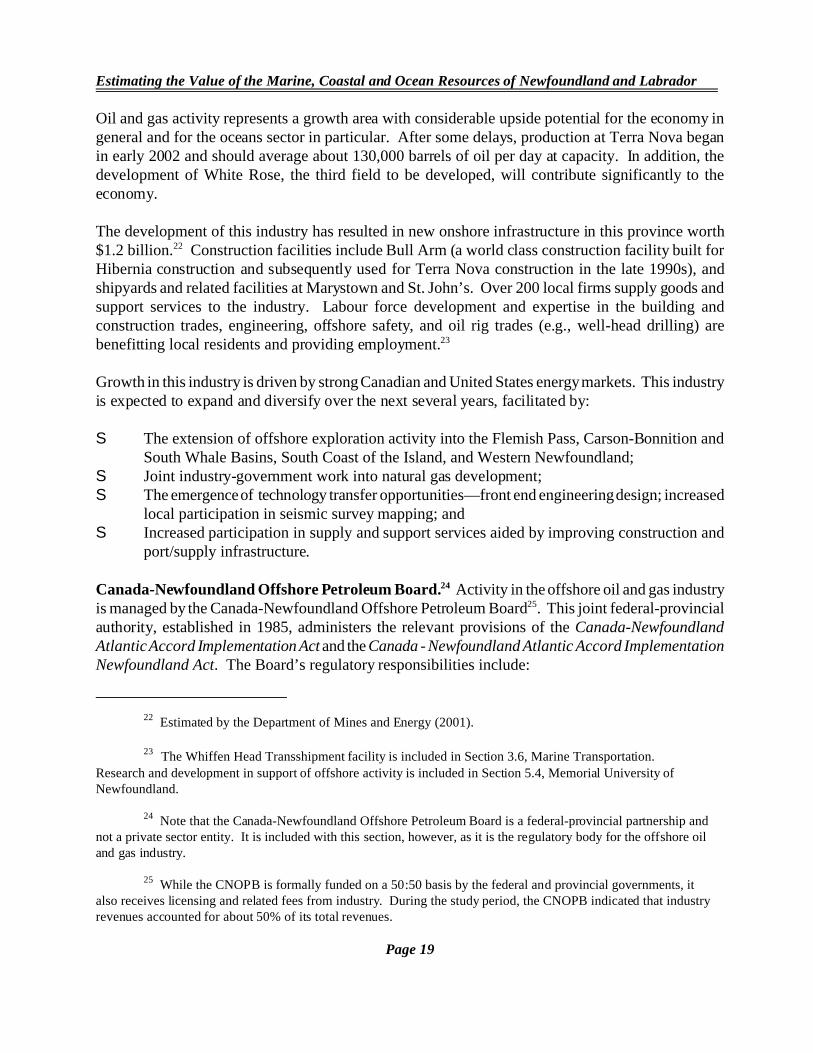
In 1995, aquaculture production exceeded 1,000 tonnes for the first time, and in 1996, aquaculturesales exceeded $5 million for the first time. By 1999, production totalled 4,308 tonnes at a sales valueof about $18.3 million29. Aquaculture operators employed about 500 people annually over thisperiod.30 The four main species produced in Newfoundland and Labrador are blue mussels, Atlanticsalmon, steelhead trout, and cod.
Aquaculture Production (metric tonnes)
1997 1998 1999
Atlantic Salmon 613 401 399
Trout 369 1,364 2,088
Cod 26 36 105
Mussels 752 946 1,700
Other 17 7 16
TOTAL 1,777 2,754 4,308
Source: Department of Fisheries and Aquaculture
3.4 SHIPBUILDING AND SHIP REPAIR
Shipbuilding is an integral part of marine manufacturing in the province. Anchored by large modernfacilities at St. John’s and Marystown, local shipyards have the capability to construct and repairmedium size, technologically advanced ships, as well as oil rigs and subsea equipment. In recent years,the industry has also engaged in national and international procurement, thereby creating newemployment and technology transfer opportunities. Employment in shipbuilding is estimated at about1,000 persons in 1998—this fell to about 562 in 1999.
These shipbuilding facilities are supplemented by an experienced and strategically placed network ofsmaller manufacturers and marine service centres (e.g., Harbour Grace, Port Saunders, Bonavista,L’Anse au Diable). According to Statistics Canada, seven firms were engaged in boatbuilding activity,
Estimating the Value of the Marine, Coastal and Ocean Resources of Newfoundland and Labrador
31 This was followed by the Vikings! 1000 Years celebrations in 2000.
32 In 2000, non-resident visitors reached a high 426,250 and expenditures totalled $290 million.
33 See Appendix 3 for further details on this data source.
Page 23
employing approximately 75 people in 1998. Most firms service the fishing fleet, however, some arealso engaged in the manufacture and repair of recreational craft.
3.5 MARINE TOURISM AND RECREATION
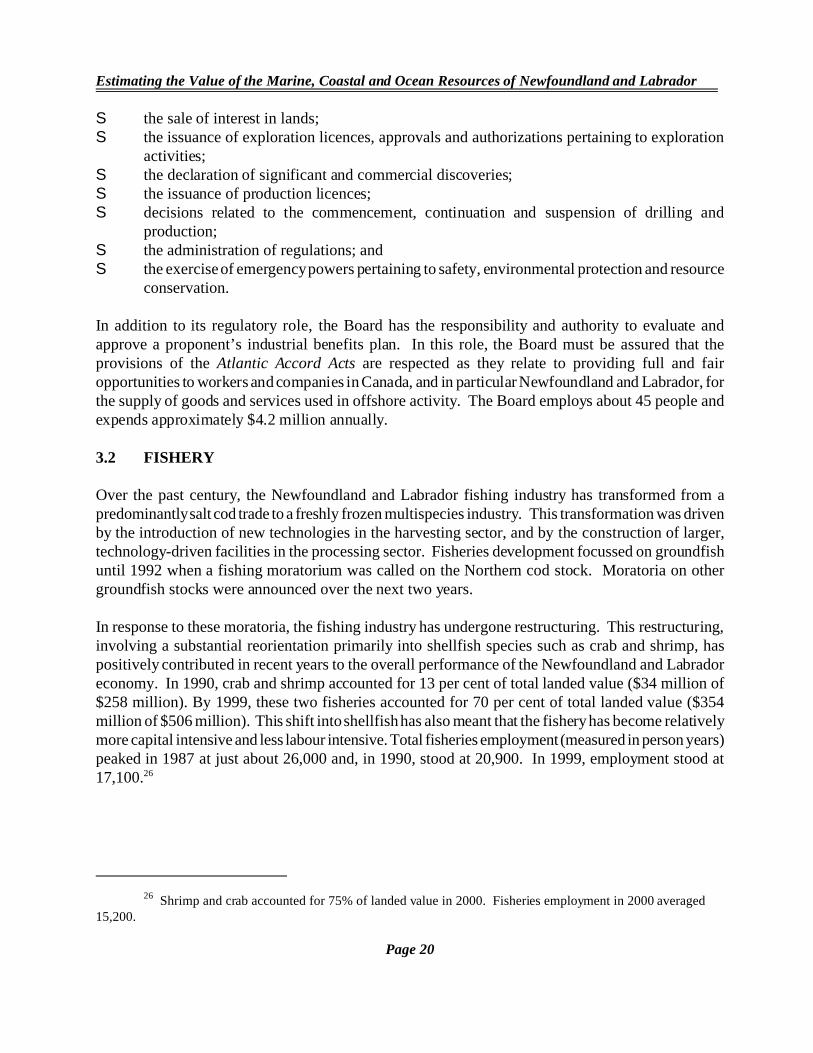
The tourism industry grew significantly over the period from 1997 to 1999 driven by the specialcelebrations strategy (e.g., Soiree’99)31 and increased cruise ship visitation. Tourism growth was alsoaided by more diversified product offerings (e.g., golf, archaeology), improved transportation andaccommodations infrastructure, and increased business travel resulting from improved economicperformance. A weak Canadian currency versus the US dollar also assisted in making the provincemore attractive to US tourists in recent years. Between 1997 and 1999, non-resident visitation grewby almost 12 per cent (associated expenditures increased by about 14 per cent).32
Both resident and non-resident touriststravel for a number of reasons, includingbusiness, pleasure (hunting, fishing, hiking,sightseeing), and visiting family andfriends. An estimated five per cent ofresident tourists, 47 per cent of non-resident auto tourists and 36 per cent ofnon-resident air tourist participate inoceans/marine related activities.33 Usingthis information, it is estimated that over1,200 person-years of employment can beattributed to oceans/marine relatedtourism. Associated labour income isapproximately $23 million.
The Cruiseship Authority of Newfoundland and Labrador (CANAL), legislatively incorporated in1998, promotes and co-ordinates industry activity. CANAL is promoting the province as a unique anddistinctive destination for Adventure/Ecotourism, South/North and Trans-Atlantic cruises and forhome porting cruises within the Province. In 1999, 60 cruise ship port calls were registered and22,500 passenger visits. The overall economic impact from cruise ship activity in the province in 1999
Estimating the Value of the Marine, Coastal and Ocean Resources of Newfoundland and Labrador
34 In 2000, there were 66 cruise ship port calls but fewer passenger visits, about 15,000. The decline inthe number of passenger visits reflected the increased use of smaller cruise vessels.
Page 24
was about $2 million. Given the developing nature of this industry, these figures are expected to growover the foreseeable future.34
3.6 MARINE TRANSPORTATION AND INFRASTRUCTURE
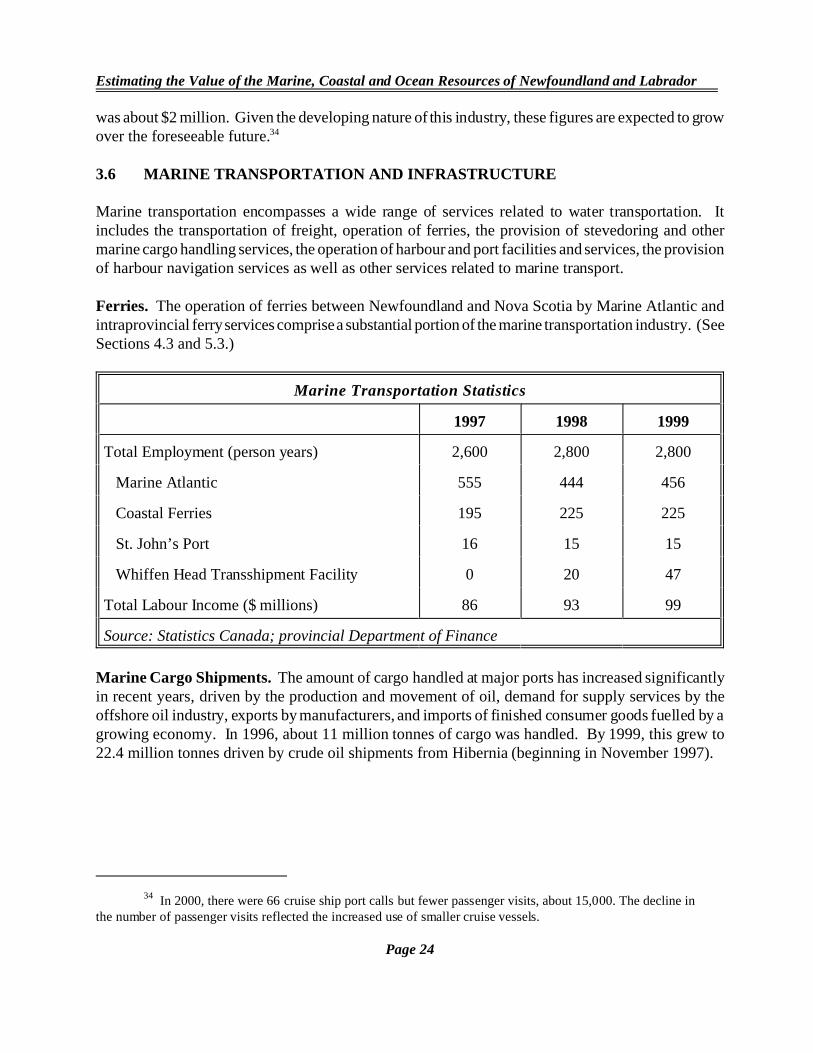
Marine transportation encompasses a wide range of services related to water transportation. Itincludes the transportation of freight, operation of ferries, the provision of stevedoring and othermarine cargo handling services, the operation of harbour and port facilities and services, the provisionof harbour navigation services as well as other services related to marine transport.
Ferries. The operation of ferries between Newfoundland and Nova Scotia by Marine Atlantic andintraprovincial ferry services comprise a substantial portion of the marine transportation industry. (SeeSections 4.3 and 5.3.)
Marine Transportation Statistics
1997 1998 1999
Total Employment (person years) 2,600 2,800 2,800
Marine Atlantic 555 444 456
Coastal Ferries 195 225 225
St. John’s Port 16 15 15
Whiffen Head Transshipment Facility 0 20 47
Total Labour Income ($ millions) 86 93 99
Source: Statistics Canada; provincial Department of Finance
Marine Cargo Shipments. The amount of cargo handled at major ports has increased significantlyin recent years, driven by the production and movement of oil, demand for supply services by theoffshore oil industry, exports by manufacturers, and imports of finished consumer goods fuelled by agrowing economy. In 1996, about 11 million tonnes of cargo was handled. By 1999, this grew to22.4 million tonnes driven by crude oil shipments from Hibernia (beginning in November 1997).
Estimating the Value of the Marine, Coastal and Ocean Resources of Newfoundland and Labrador
35 See Appendix 3 for further details on this data source. For the purpose of allocating activity to a site orport, the Town of Grand Bank is the port of reference for shipments of offshore oil from Hibernia. As such, thepercentage figure shown (20.5 percent) includes both shipments from Hibernia as well as shipments from the Townof Grand Bank itself (which account for a relatively small component of the 20.5 percent).
Page 25
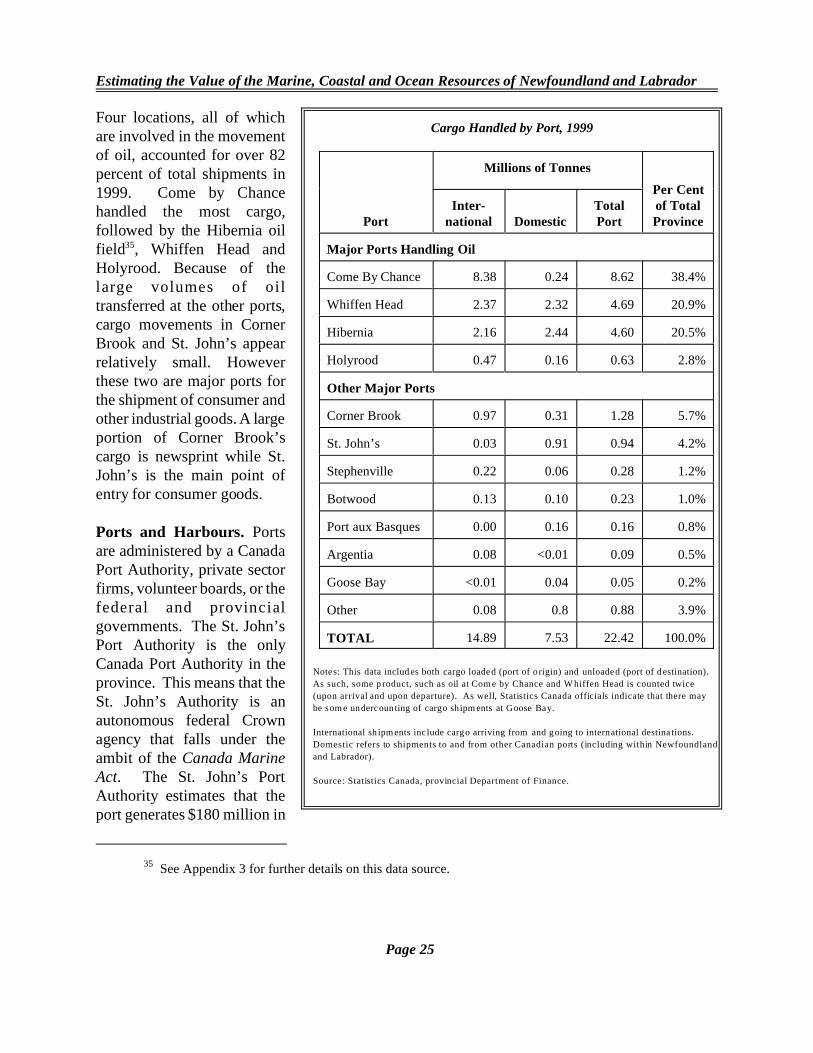
Four locations, all of whichare involved in the movementof oil, accounted for over 82percent of total shipments in1999. Come by Chancehandled the most cargo,followed by the Hibernia oilfield35, Whiffen Head andHolyrood. Because of thelarge volumes of oiltransferred at the other ports,cargo movements in CornerBrook and St. John’s appearrelatively small. Howeverthese two are major ports forthe shipment of consumer andother industrial goods. A largeportion of Corner Brook’scargo is newsprint while St.John’s is the main point ofentry for consumer goods.
Ports and Harbours. Portsare administered by a CanadaPort Authority, private sectorfirms, volunteer boards, or thefederal and provincialgovernments. The St. John’sPort Authority is the onlyCanada Port Authority in theprovince. This means that theSt. John’s Authority is anautonomous federal Crownagency that falls under theambit of the Canada MarineAct. The St. John’s PortAuthority estimates that theport generates $180 million in
Cargo Handled by Port, 1999
Port
Millions of Tonnes
Per Centof TotalProvince
Inter-national Domestic
TotalPort
Major Ports Handling Oil
Come By Chance 8.38 0.24 8.62 38.4%
Whiffen Head 2.37 2.32 4.69 20.9%
Hibernia 2.16 2.44 4.60 20.5%
Holyrood 0.47 0.16 0.63 2.8%
Other Major Ports
Corner Brook 0.97 0.31 1.28 5.7%
St. John’s 0.03 0.91 0.94 4.2%
Stephenville 0.22 0.06 0.28 1.2%
Botwood 0.13 0.10 0.23 1.0%
Port aux Basques 0.00 0.16 0.16 0.8%
Argentia 0.08 <0.01 0.09 0.5%
Goose Bay <0.01 0.04 0.05 0.2%
Other 0.08 0.8 0.88 3.9%
TOTAL 14.89 7.53 22.42 100.0%
Notes: This data includ es both cargo loaded (port of o rigin) and unloade d (port of d estination).
As such, some p roduct, such as oil at Com e by Chance and W hiffen Head is counted twice
(upon arrival and upon departure). As well, Statistics Canada officials indicate that there may
be som e undercoun ting of cargo sh ipm ents at Goose Bay.
International sh ipm ents inc lude cargo arriving from and going to international destina tions.
Domestic refers to shipments to and from other Canadian ports (including within Newfoundland
and Labrador).
Source: Statistics Canada, provincial Department of Finance.
Estimating the Value of the Marine, Coastal and Ocean Resources of Newfoundland and Labrador
Page 26
revenues per year and creates 2,500 direct and spin-off jobs. These revenues are derived from severalsources: cargo transport; supply services to the offshore oil industry; cruiseship activity; fishing; tourboats; and infrastructure improvements which are allowing the Port Authority to attract other business.
The administrative role of private sector firms and volunteer boards in harbour management isincreasing. Beginning in 1995, Transport Canada, under its National Marine Policy, has beendevolving responsibility for administration of most ports to local authorities. Exclusions to this policyincluded those eligible for Canada Port Authority status and those designated as remote ports whichwill continue to be federally operated. In this province, six ports were divested to the private sector,31 ports were divested to the provincial government, and 20 ports remain eligible for divestiture.
Over the same period, Fisheries and Oceans Canada has been implementing several initiatives throughits Small Craft Harbours program which are markedly increasing the role of the voluntary sector inharbour management. Harbour Authorities are being established at active fishing harbours, whileinactive fishing harbours and recreational harbours are being divested either through transfer to not-for-profit organizations or facility removal. Harbour Authorities are typically non-profit, locallycontrolled organizations with strong links to the fishery. These Authorities, through lease agreements,manage wharf and docking facilities, provide services, and generate revenue to cover the costs of day-to-day management and minor maintenance. The Department continues to be the custodian of theproperty while playing a monitoring and advisory role to Authorities and providing funding for majorrepairs, maintenance and capital requirements. In Newfoundland and Labrador, of 409 small craftharbours, 197 harbours are currently being managed by Harbour Authorities, 81 have been identifiedas potential harbour authority managed sites, and 19 have been divested or are in various stages of thedivestiture process. It remains to be decided if the remaining 112 harbours will come under HarbourAuthority management (for fishing harbours) or be divested to other organizations.
3.7 OCEANS TECHNOLOGIES
Oceans technologies (except biotechnology) typically focus on low volume, high value customengineered products and services for use in, on and/or beneath the ocean. The oceans technologyindustry in the province is growing, aided by oil and gas development, fisheries expansion, and by ageneral maturing of information industries. Firms in the local industry are engaged in hydrographicservices, remote sensing, marine communications, custom engineering and product development,marine geomatics, electronic charts and mapping, marine training, weather forecasting, defencesurveillance, ice management, and/or environmental technologies.
Most firms are small (less than 50 employees), entrepreneurial, export oriented, and have advancedtechnical capabilities in R&D, manufacturing and/or marketing applications. There are about 50companies operating in this province, employing about 1,000 workers. Many firms have entered intojoint venture and partnership arrangements with larger, out-of-province firms for technology transfer,procurement, and marketing purposes. Firms are supported by industry organizations, such as theNewfoundland Oceans Industries Association and Newfoundland Association of Technical Industries.Total revenues to local firms are about $45 million annually (including publicly funded R&D grants
Estimating the Value of the Marine, Coastal and Ocean Resources of Newfoundland and Labrador
Page 27
and subsidies). Most local firms sell products and services to local industry (e.g., oil, the fishery) and,as such, their economic contribution is considered an indirect impact from other industries.
The biotechnology industry is emerging as a new industry in the province, primarily focusing on marineapplications. In 1999, the industry had revenues of approximately $2 million, and R&D spendingexceeded $3.5 million (see Section 5.5). There are about 15 biotechnology companies in the province,employing about 100 people. An additional 400 people are employed in academic R&D.
Estimating the Value of the Marine, Coastal and Ocean Resources of Newfoundland and Labrador
36 Federal public service data is included in Appendix 1.
Page 28
4.0 OCEANS-RELATED ACTIVITY: FEDERAL PUBLIC SECTOR 36
Canada’s oceans are part of the “global commons” and, therefore, the management premise ofCanada’s oceans is based on both national and international obligations and commitments. InNewfoundland and Labrador, 22 federal departments and agencies administer these commitments andobligations, generating about 2,500 person years of employment. While some departments andagencies have greater presence than others, collectively their specific authorities, policies and programresponsibilities guide a wide range of activities: resource management; sovereignty and defence;economic, trade and industrial development; transportation and safety; and health and environment.
4.1 FISHERIES AND OCEANS CANADA
Fisheries and Oceans Canada (DFO) is responsible for policies and programs in support of Canada’seconomic, ecological and scientific interests in oceans and inland waters; for the conservation andsustainable utilization of Canada’s fisheries resources in marine and inland waters; for leading andfacilitating federal policies and programs on oceans; and for safe, effective, and environmentally soundmarine services responsive to the needs of Canadians in a global economy.
With approximately 1,200 full-time employees, DFO has the largest federal presence in Newfoundlandand Labrador and is the only department with virtually its entire budget and staffing devoted to ocean-related activities. Programs and services for the public are delivered through several branches.
The Fisheries Management Branch is responsible for the management, conservation and protectionof marine and inland fisheries. In addition to developing and enforcing annual harvesting plans for 40different fish species, the harvesting and processing of which generates an export value of roughly $1billion, the Branch is also responsible for addressing international issues, such as trans-boundary stocksmanaged through the Northwest Atlantic Fishery Organization (NAFO).
The Canadian Coast Guard (CCG) ensures the safe and environmentally responsible use ofCanada’s waters; supports the understanding and management of oceans resources; facilitates the useof our waters for shipping, recreation and fishing; and provides marine expertise in support ofCanada’s domestic and international interests. The CCG undertakes programs and activities to achieveits long-term objectives. The major program areas include marine safety, service and environmentalprotection, environmental response, boating safety, icebreaking, marine communications and trafficservices, navigational aids, protection of the public right to navigation, and fleet support to fisheriesenforcement and scientific research.
The Science, Oceans and Environment Branch provides timely and reliable scientific informationand advice in support of the conservation, protection, and sustainable utilization of marine and aquaticresources in the region. Programs include research activities such as studies of the biology, life history

Estimating the Value of the Marine, Coastal and Ocean Resources of Newfoundland and Labrador
37 Not all monies are directed to oceans-related activities.
Page 29
and resource status of commercially important and emerging species and ecosystems, biological andphysical oceanography, aquaculture, environmental sciences, habitat protection, and Oceans Actimplementation. The Branch also contributes to marine safety through its hydrographic division, whichproduces marine navigation charts.
Through the collection and analysis of a wide variety of data, the Policy and Economics Branchprovides analytical, economic and policy advice in support of fisheries management and development,and public investment initiatives affecting the fish harvesting, processing and aquaculture sectors.
With a focus on partnering with local Harbour Authorities, the Small Craft Harbours and RealProperty Management Branch is responsible for long-term maintenance of 409 active fishingharbours in the region.
4.2 ATLANTIC CANADA OPPORTUNITIES AGENCY
The Atlantic Canada Opportunities Agency’s (ACOA) oceans related responsibilities and activitiesstem from its mandate and strategic focuses. Most funding in this area comes from ACOA’s BusinessDevelopment Program, Atlantic Investment Partnership, and through cost-shared federal-provincialagreements. Cost-shared agreements, worth a total of about $345 million37, include:
S Comprehensive Economic Development Agreement (70:30 federal:provincial cost-sharingratio, expires March 2005);
S Economic Development Component of the Fisheries Adjustment and Restructuring Initiative(70:30, expires March 2003);
S Agreement on Economic Renewal (80:20, expires March 2002); andS Strategic Regional Diversification Agreement (70:30, expired June 2001).
ACOA also provides a Consulting Advisory Service to assist business clients. Oceans relatedindustries that have taken advantage of this service include oil and gas, fishing, aquaculture, tourism,boating and shipping, ocean industries and technologies, and marine defence.
4.3 MARINE ATLANTIC
Marine Atlantic is a federal Crown corporation that operates ferries across the Cabot Strait betweenthe island of Newfoundland and mainland Canada. Management functions are located in St. John’s(head office), Port aux Basques (finance, accounting, computer systems and risk management) andNorth Sydney (operations management, human resources, purchasing, marine technical, and safetyfunctions).
Estimating the Value of the Marine, Coastal and Ocean Resources of Newfoundland and Labrador
38 In 2000, passenger traffic reached another record high of 508,970, an increase of 7 percent.
39 National Defence patrols supplement extensive offshore surveillance conducted by Fisheries and
Oceans Canada - Newfoundland Region.
Page 30
Ferries operate year-round on the 100 nautical mile route between Port aux Basques and NorthSydney, and during the summer on the 280 nautical mile route between Argentia and North Sydney.The company owns four vessels: the MV Caribou (built in 1986, capacity of about 1,000 passengersand 350 autos); the MV Joseph and Clara Smallwood (1990, similar capacities as the MV Caribou);the MV Leif Ericson (purchased in 2000, capacity of 500 passengers and 300 autos); and the MVAtlantic Freighter (1978, carries trailers without drivers, containers and dangerous commodities).Marine Atlantic experienced its second consecutive year of record traffic in 1999, carrying about475,700 passengers.38
4.4 ENVIRONMENT CANADA
Environment Canada delivers oceans-related programs through four branches. The Corporate AffairsBranch delivers the EcoAction funding program in the province and has responsibility for the AtlanticCoastal Action Program (two sites in the province). The Environmental Protection Branch enforcesthe Canadian Environmental Protection Act and the Fisheries Act (Section 36), and delivers severalmarine related programs such as the Shellfish Water Quality Protection Program, Ocean DisposalPermit Program, and Environmental Emergencies Program. The Meteorological Service of Canadaprovides weather warnings and forecasts (including marine forecasts) for the province and surroundingwaters, and provides other services including extreme weather and sea state forecasts, monitoring,climatology and research in Atlantic storms. The Environmental Conservation Branch delivers theenforcement and science programs of the Canadian Wildlife Service, and participates in the provisionof information and advice for environmental assessments and responses to marine environmentalemergencies.
4.5 DEPARTMENT OF NATIONAL DEFENCE
CFS St. John’s serves as a support station for many aspects of the Department’s operations in supportof maritime operations. The most significant activity in this region focuses on HMC ships engagedin patrolling the offshore fishery. An estimated 125 sea days are committed to this task.39 Coupledwith this, St. John’s serves as a replenishment, rest and recreation port for approximately 25 port visitsby HMC ships per year. In addition, air support services are provided by Gander and Torbay airportsfor regular maritime patrol flights.
4.6 TRANSPORT CANADA
Transport Canada has two main roles in the oceans sector: marine safety and overseeing themanagement of ports. Marine Safety encompasses the full spectrum of responsibilities related to thesafety of ships, the protection of life and property, and the environment. The Harbours and Ports
Estimating the Value of the Marine, Coastal and Ocean Resources of Newfoundland and Labrador
40 Two of these sites are expected to be divested shortly.
41 Natural Resources Canada provided data for its geological survey of Canada Branch but not for otheroceans-related expenditures. Its contributions to the Canada-Newfoundland Offshore Petroleum Board and theOffshore Development Fund are estimates based on provincial expenditures and established cost-sharing ratios.
42 This methodology differs and takes a narrower view of oceans activity than that of New Brunswick(2000) which included total operations and maintenance expenditures.
Page 31
Branch is implementing a divestiture program consistent with the National Marine Policy whilecontinuing to operate sites under its authority. There are presently 20 ports remaining to be divestedin the province.40
4.7 NATURAL RESOURCES CANADA
This department is responsible for energy resource stewardship, including funding for the Canada-Newfoundland Offshore Petroleum Board; the cost-shared Offshore Development Fund; and theGeological Survey of Canada (GSC).41 The GSC supplies a national geoscience knowledge baserequired to support effective mineral and hydrocarbon exploration and development across Canada,provides the geological basis necessary to understand and address health, safety and environmentalissues, and advocates the interests of Canadian geoscience at the international level. The AtlanticOffice is located in Nova Scotia and is responsible for marine geoscience.
4.8 OTHER DEPARTMENTS AND AGENCIES
Agriculture and Agri-Foods Canada - involvement in the fishing and seafood industry is limited tomarket development activities. These activities include: one-on-one counseling regarding marketdevelopment; provision of specific market information; trade leads related to the seafood sector;recruitment for trade shows; providing a Canadian pavilion at major shows; a fax-back informationservice; and a web site specifically for seafood market development.
Department of Canadian Heritage through Parks Canada - responsible for establishing a systemof National Marine Conservation Areas that are representative of the country’s ocean environmentsand the Great Lakes. This work is designed to represent the diversity of our nation’s marineecosystems; maintain marine ecological processes and life support systems; preserve biodiversity; serveas ‘models’ of sustainable utilization of species and ecosystems; facilitate and encourage marineresearch and ecological monitoring; protect depleted, vulnerable, threatened, or endangered species,populations and habitats; protect and maintain areas critical to the lifecycles of economically importantspecies; and provide interpretation of marine areas for the purposes of conservation, education andtourism. For the purposes of this study, oceans related activity from this Department includes specificoceans related research at the Terra Nova and Gros Morne National Parks. It does not, howeverinclude general operations and maintenance activities at these National Parks or any other NationalHistoric Sites in the province.42
Estimating the Value of the Marine, Coastal and Ocean Resources of Newfoundland and Labrador
43 EI benefit payments to individuals are not directly included in this study. While benefit payments arenot part of direct impacts, they would be partly captured in the induced impacts.
Page 32
Citizenship and Immigration Canada - three main activities that are oceans-related: shipping(monitoring and enforcement), oil and gas (employment authorizations), and tourism (ensuring thatindividuals meet entrance requirements).
Human Resources Development Canada - is involved in oceans-related activities indirectly throughEI income support for many workers in marine related industries and employment programmingfunded through the EI account.43
The EI fund also provides for employment programming through the Labour Market DevelopmentAgreement. This programming includes the provision of training seats at post secondary institutes,wage subsidies, self employment assistance and skill upgrading/job creation opportunities. Oceansrelated data is only available for training seat purchases made at the Marine Institute of MemorialUniversity of Newfoundland. Over the 1997-1999 period, over 1,200 individuals received assistancethrough this program.
HRDC was also responsible for coordinating most TAGS (The Atlantic Groundfish Strategy) andFRAM (Fisheries Restructuring and Adjustment Measures) activity in the province, including incomesupport, employment adjustment, training and early retirement measures (but excluding certain licenceretirement and economic development components). These programs were established by the federalgovernment in response to the groundfish moratoria of the 1990s and were terminated in August 1998.
Industry Canada - reviews industrial benefits plans, monitors contracting for offshore oil and gasprojects, and identifies supply gaps and opportunities for Canadian participation. The Department,in cooperation with the Department of Foreign Affairs and International Trade, also maintainsa focus of international business development as it relates to the export of oceans technology productsand services.
Justice Canada - provides its clients (i.e., federal government departments and agencies) with avariety of advisory and civil litigation services in connection with clients’ oceans-related activity. TheDepartment also prosecutes persons who are accused of violating oceans-related criminal legislation,and is assisted in these functions by private lawyers who are retained as agents of the Minister ofJustice.
Public Works and Government Services Canada - provides architectural and engineering servicesto federal departments and agencies, including construction and project management for wharves,breakwaters and other marine structures, and offices, laboratories and related facilities. Services aregenerally on a cost recovery basis with the client department. The Department also provides propertyand facilities management, office accommodation and real estate advisory services, and serves, throughits Supply and Services Directorate, as the federal government’s chief purchasing agent.
Estimating the Value of the Marine, Coastal and Ocean Resources of Newfoundland and Labrador
Page 33
Canadian Environmental Assessment Agency - manages and coordinates environmental reviews(panel review and comprehensive study process). During the 1997-1999 period, the Agencycompleted one panel review in the Newfoundland and Labrador offshore (the Terra Nova Projectwhich was released in 1997) and one comprehensive study process (the Newfoundland TransshipmentTerminal in 1996). The Agency recently completed a comprehensive study process for the White RoseProject (2001).
Canadian Food Inspection Agency - responsible for the enforcement of the Fish Inspection Act,components of the Fisheries Act, and other food related legislation as it pertains to fish as food.Activities include: inspection of fish, fish products, fish processing establishments, water supplies usedin fish processing, transport vehicles, fishing vessels and wharves and unloading sites; sampling andanalysis of shellfish to ensure compliance with biotoxin and microbiology requirements of the CanadianShellfish Sanitation Program (CSSP); certification of fish products for export; and licensing ofprocessing establishments for export purposes.
Canadian Transportation Agency - maintains oceans related regulatory responsibilities under theCoasting Trade Act, Pilotage Act and Canada Marine Act.
National Research Council - operates the Institute for Marine Dynamics (IMD). IMD wasestablished in 1985 as a national centre for ocean technology research and development. It providestechnical assistance to Canadian businesses and works with international companies and researchagencies to bring new technology to Canada.
Office of Critical Infrastructure Protection and Emergency Preparedness - reporting to theMinister of National Defence, this office is responsible for developing and implementing acomprehensive approach to protecting Canada’s critical infrastructure from threats and vulnerabilities,and ensuring national civil emergency preparedness. Specifically pertaining to ocean activity inNewfoundland and Labrador, the office administers the Disaster Financial Assistance Arrangementsand, consequently, was involved in responses to the January 2001 storm on the South Coast andHurricane Luis in 1995.
Royal Canadian Mounted Police - monitors pleasure boaters, engages in search and rescue efforts,and enforces coastal fishing and hunting activities under 258 Acts. The RCMP also maintains theForce’s only Catamaran (PMV Simmonds) in Atlantic Canada. Based in Burin, this vessel is used toenforce the Customs and Excise Act between Canada and St. Pierre and Miquelon, and, as required,supports enforcement activities carried out by Fisheries and Oceans Canada.
Estimating the Value of the Marine, Coastal and Ocean Resources of Newfoundland and Labrador
44 Provincial public service data is included in Appendix 1.
45 Note that these agreements, listed in Section 4.2, include two directed at the fishing industry, and
cover a range of other industries (tourism, aquaculture, IT, manufacturing and others). For simplicity in definingand analyzing oceans sector expenditures and to ensure no double counting, the provincial cost-shared componentin Appendix 1 is attributed wholly to the Department of Industry, Trade and Rural Development.
Page 34
5.0 OCEANS-RELATED ACTIVITY: PROVINCIAL PUBLIC SECTOR 44
The province’s geographical position (as an island in the case of Newfoundland, as an adjacent to theocean in the case of Labrador) requires that government assume certain roles and responsibilities vis-à-vis oceans management, including transportation, economic development, and environmentalmonitoring. Seven departments administer these responsibilities within the province, generating closeto 500 person years of employment. Additionally, through Memorial University of Newfoundland,there is a concentration of oceans-related research and development expertise within the province.
5.1 DEPARTMENT OF FISHERIES AND AQUACULTURE
The principle responsibilities of the Department of Fisheries and Aquaculture are fisheries andaquaculture development, processing capacity management, and quality enhancement. TheDepartment’s mandate is to support and promote the development of sustainable and viable fishingand aquaculture industries, aimed at producing high value and quality products. This is achieved byproviding fishing and aquaculture industry participants, other government organizations, and thegeneral public, with programs and services in the areas of fisheries and aquaculture development,quality assurance, processing and aquaculture capacity management, policy development and analysis,and information services.
In recent years, the primary focus of the Department has been to balance processing capacity withavailable resources; to promote the utilization of emerging fish species; to maximize the value of allfish resources; and to develop the province’s aquaculture industry.
The Department administers, and is governed by, seven pieces of legislation. These include theAquaculture Act, Fisheries Loan Act, Fish Inspection Act, Fisheries Act, Fisheries Restructuring Act,Fishery Products International Act and the Professional Fish Harvesters Act.
5.2 DEPARTMENT OF INDUSTRY, TRADE AND RURAL DEVELOPMENT
The Department of Industry, Trade and Rural Development serves as co-chair for economicdevelopment agreements with the federal government45, monitors industrial benefits from offshore oildevelopment projects, supports the development of advanced technologies in the province andadministers the functions of the former Fisheries Loan Board.
Estimating the Value of the Marine, Coastal and Ocean Resources of Newfoundland and Labrador
Page 35
The Industrial Benefits Division leads departmental activities relating to industrial benefits activitiesand government procurement. The division contributes to economic development in the province byconcentrating its efforts on major projects in the oil industry, special government procurementinitiatives such as the Canadian Search and Rescue Helicopter Project, and other initiatives such asVoisey’s Bay development. The Division also jointly administers the Industry Development Fund(IDF) with Natural Resources Canada. This joint Provincial-Federal cost-shared fund is a componentof the Offshore Development Fund, which was structured pursuant to the Atlantic Accord. Currently,the IDF focus is mainly on development studies, research, testing, and education support. TheIndustry Support Division of the Department facilitates and supports development of advancedtechnology industries (including environmental and marine technologies) in the province. Thisincludes, but is not limited to, funding for industry associations, sector studies, and strategic planningexercises focused on industry growth and development.
The Portfolio Management Division implements the functions of the former Fisheries Loan Board ofNewfoundland. This includes collections under the Direct Loan Program (about $20 millionoutstanding from about 2,000 clients) and loan guarantees under the Fisheries Loan GuaranteeProgram. This program operates under agreements with chartered banks through which theDepartment provides a loan guarantee covering about 20 percent of loans granted. The Province hasa contingent loan exposure of about $20 million under this program.
5.3 DEPARTMENT OF WORKS, SERVICES AND TRANSPORTATION
This department manages 16 provincial marine ferry services providing passenger and freight servicesand, when required, implements emergency evacuations. These ferry services include those routes thathave historically been provincially operated (e.g., Portugal Cove-Bell Island, Fogo Island-Farewell)as well as those that have been devolved in recent years from the federal government (e.g.,Lewisporte-Goose Bay). Many of these routes are directly serviced by the Department while otherroutes (e.g., St. Barbe-Labrador Straits/Blanc Sablon) are administered through third party contracts.
The Department is also responsible for administering 16 port authorities along the Labrador coast and15 port authorities along the province’s south coast. These authorities were transferred to theProvince by Transport Canada as part of marine services agreements in the late 1990s.
5.4 OTHER PROVINCIAL DEPARTMENTS
Department of Environment - administers various Acts as they relate to the allocation of water,stream alterations, protection of water supply areas, and other aspects of water resource management.(Most of these activities are freshwater-related; minimal activity is oceans-related.) The Departmentalso participates on national policy development working groups such as the impacts of global climatechange, and protection of water resources.
Department of Human Resources and Employment - responsible for implementing fisheriesadjustment (early retirement) agreements signed with the federal government during the 1990s. These
Estimating the Value of the Marine, Coastal and Ocean Resources of Newfoundland and Labrador
Page 36
agreements include: Plant Workers Adjustment Program (1991, 184 retirees); Northern Cod EarlyRetirement Program (1993, 1,436 retirees); Atlantic Fishers Early Retirement Program (1995, 252retirees); Fishplant Older Workers Adjustment Program (1995, 560 retirees); and Fisheries EarlyRetirement Program (1998, ongoing, estimated at almost 1,400 retirees at maturity).
Department of Mines and Energy - responsible for facilitating and/or undertaking: energy resourcestewardship as it relates to offshore oil and other resources; delivery of programs and advisory servicessupporting resource assessment, management and/or development; and the development, monitoringand evaluation of policy, legislative and regulatory frameworks. These functions are delivered inpartnership with energy industry associations and producers; provincial, national and internationalbusinesses actively pursuing energy resource assessment and/or development; and those municipal,provincial, federal and federal-provincial departments and organizations which share some aspect ofEnergy’s mandate (e.g., the Canada-Newfoundland Offshore Petroleum Board).
Department of Youth Services and Post-Secondary Education - through the OffshoreDevelopment Fund, implements offshore training programs for workers in relevant oil rig and shippingtrades. It provides direct funding to the College of the North Atlantic to cover the cost of facilities,equipment and support services for offshore training. Finally, it provides funding for the AtlanticAccord Career Development Awards Program. This Program has provided scholarships and bursariesto almost 6,000 post secondary and graduating high school students since inception.
5.5 MEMORIAL UNIVERSITY OF NEWFOUNDLAND
The Marine Institute of Memorial University of Newfoundland is the successor of the College ofFisheries, Navigation, Marine Engineering and Electronics. Enrolment at the Marine Institute isgreater than 4,500 on an annual basis, instructed by 130 faculty members. The role of the Instituteis to develop, apply, and transform new technology initiatives to support the offshore oil industry, thefishery and other marine industries. In addition to providing education and training programs, theInstitute supports industry through its participation in research and development, technology transfer,and public policy advocacy initiatives. The Institute is also embarking on efforts aimed at increasingthe University’s status as an innovator and contributor to the understanding, education, and researchin the oceans sector.
In addition to the Marine Institute, significant oceans-related research is undertaken at various researchinstitutes and departments at Memorial University. In most cases, these institutes are funded throughpublic sector (federal, provincial and/or cost shared grants) or private sector investments, and haveminimal own-source core funding. The larger research and development centres are identified below.
Aquanet. In July 2000, AquaNet was established as one of Canada’s Centres of Excellence toundertake aquaculture research. Funded for a four year period by Industry Canada, research at thisfacility is primarily aimed at increasing the efficiency of aquaculture production through speciesdiversification, biotechnology, and environmental sustainability. In addition, funding is provided for
Estimating the Value of the Marine, Coastal and Ocean Resources of Newfoundland and Labrador
Page 37
the training of highly qualified personnel, and to assess environmental and social aspects of theindustry.
Canadian Centre for Fisheries Innovation. The Canadian Centre for Fisheries Innovation (CCFI),established in 1989, has a mandate to apply fisheries related science and technology capability to theissues and potential of the fishing industry. In meeting this mandate, the CCFI, in partnership withindustry and government, conducts research and development and demonstration projects inharvesting, processing, aquaculture, and marine biotechnology. This work benefits fish harvesters andprocessors, aquaculture operators, manufacturers of fisheries related equipment, and those responsiblefor regulating the resource. The CCFI’s research and development activities are carried out inpartnership with the Marine Institute’s Centre for Aquaculture and Seafood Development, MemorialUniversity’s Departments of Biology, Chemistry, and Biochemistry, and the Ocean Sciences Centre.
Canadian Centre for Marine Communications. The Canadian Centre for Marine Communications(CCMC), established in 1989, collaborates with the Canadian marine information technology industryto develop products and services in the areas of marine communications, navigation and informationtechnology. Current initiatives within the Centre’s program framework include: an extension of the“information highway” to offshore areas; marine geomatics in support of the offshore oil industry;development of enabling technologies and marine applications for satellite communications; marineapplications of robotics and intelligent systems; and development of new wireless technologies andapplications. These activities are strategically designed to build a prosperous Canadian marine ITsector comprising industry, government and academia.
C-CORE. C-CORE is an applied R&D corporation which specializes in engineering and businessskills required by resource industries. Established in 1975, C-CORE activities include technologytransfer and demonstration, commercialization of intellectual property and specialized advisoryservices to a wide range of industries. Within the oceans sector, C-CORE is undertaking majorprograms in, among other areas, ice engineering and management, fisheries stock assessmenttechniques, fish processing technologies, natural gas pipelines, remote sensing, and geotechnicalengineering. Under the Harsh Environments Initiative of the European and Canadian space agencies,C-CORE is seeking to adapt and apply space technologies to sectors such as oil and gas, whichoperate in harsh terrestrial and marine environments.
Centre for Aquaculture and Seafood Development. This Centre seeks to enhance thecompetitiveness of the aquaculture and seafood processing sectors by working with industry in areasof applied research, product and process development, technology transfer and advisory services, andsupport for education and training activities. Activities and research at this centre include but are notlimited to: plant sanitation; process design; product formulation; thermal processing; fish nutrition;water recirculation and treatment; developmental shellfish biology; and aquaculture site selection.
Centre for Earth Resources Research. The Centre for Earth Resources Research (CERR) is a unitof the Earth Sciences Department of Memorial University which collaborates with industry andgovernment on matters related to earth resources. Oceans-related research at CERR includes shallow
Estimating the Value of the Marine, Coastal and Ocean Resources of Newfoundland and Labrador
46 Memorial University is the only university in Canada that offers a B.Eng. degree in Ocean and Naval
Architectural Engineering and M.Eng. and Ph.D. degrees in Ocean Engineering.
Page 38
marine seafloor seismic profiling, identification and profiling of offshore petroleum resources andoffshore exploration technology.
Fishing Technology Unit. The Marine Institute’s Centre for Sustainable Aquatic Resources (C-SAR)focuses on research in harvesting technology, coastal zone management, ecosystem management andapplied research. Working with local industry, government and international partners, C-SAR developsnew technologies, techniques and expertise in the areas of fisheries conservation, selectivity andresponsible harvesting. C-SAR is currently focused on projects that focus on fuel efficiency, reducingsea bottom impacts, eliminating bycatch, and size selectivity. The Centre’s work with Fishery ProductsInternational on seabed friendly trawls recently won the U.S. National Fisheries Institute Award forresponsible fishing.
GENESIS Group. The GENESIS Group Inc. is the technology transfer agency of MemorialUniversity. Formerly the Seabright Corporation (established in 1982), the GENESIS Group isundertaking biotechnology research in the areas of antifreeze proteins for aquaculture purposes,pigmenting farmed fish, fish vaccinations, scallop hatchery technology, and the use of dietary factorsto control fish reproduction.
Ocean Engineering Research Centre. This Centre (OERC), established in 1969, is an integral partof Memorial’s Faculty of Engineering and Applied Science and has become a focus of the effort toestablish ocean engineering as a new research and educational field in Canada.46 OERC is involvedin research, development, and consulting with application to most aspects of ocean engineering,including the offshore and naval architectural engineering industries. The main areas of interest in theCentre are: marine hydrodynamics and wave structure interaction; sea ice mechanics, iceberg and icestructure interaction; risk analysis in offshore systems; naval architectural aspects including vesselmotions, propulsion and small craft problems; and ocean monitoring, acoustics, geotechnology andinstrumentation.
Oceans Sciences Centre. The Ocean Sciences Centre is a cold ocean research facility located in LogyBay near St. John’s. The Centre houses laboratories where research is conducted on the NorthAtlantic fishery, aquaculture, oceanography, ecology, and fish behaviour and physiology. Research isalso conducted on organisms ranging from bacteria to seals.
In addition to the research and development institutes identified above, other departments also conductoceans-related research. For example, the Department of Physics maintains a Physical OceanographyGroup (established in 1979), and the Department of Biology maintains a Whale Research Group(1978). More recently, the Social Sciences and Humanities Research Council of Canada and theNatural Science and Engineering Research Council of Canada, in partnership with MemorialUniversity, commenced a five-year Coasts Under Stress project. Beginning in April 2000, this project

Estimating the Value of the Marine, Coastal and Ocean Resources of Newfoundland and Labrador
Page 39
will seek to identify the important ways in which changes in society and the environment in coastalBritish Columbia and coastal Newfoundland and Labrador have affected, or will affect, the health ofpeople, their communities and the environment over the long term.
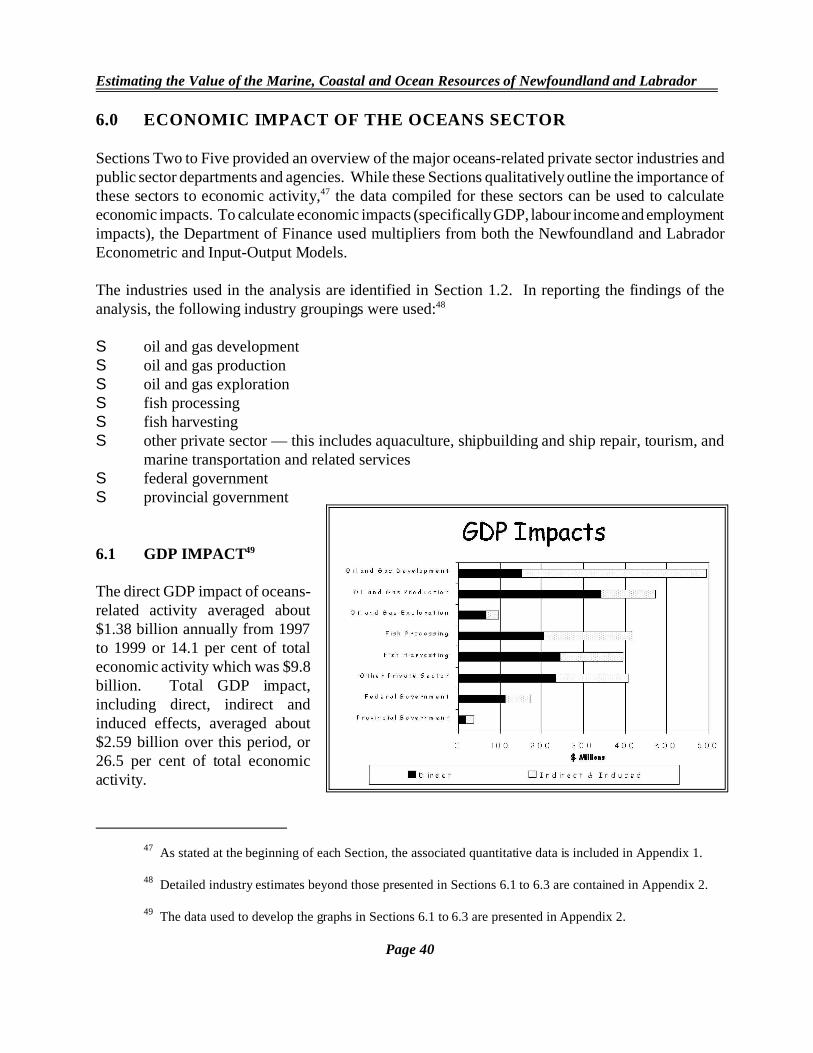
Estimating the Value of the Marine, Coastal and Ocean Resources of Newfoundland and Labrador
47 As stated at the beginning of each Section, the associated quantitative data is included in Appendix 1.
48 Detailed industry estimates beyond those presented in Sections 6.1 to 6.3 are contained in Appendix 2.
49 The data used to develop the graphs in Sections 6.1 to 6.3 are presented in Appendix 2.
Page 40
6.0 ECONOMIC IMPACT OF THE OCEANS SECTOR
Sections Two to Five provided an overview of the major oceans-related private sector industries andpublic sector departments and agencies. While these Sections qualitatively outline the importance ofthese sectors to economic activity,47 the data compiled for these sectors can be used to calculateeconomic impacts. To calculate economic impacts (specifically GDP, labour income and employmentimpacts), the Department of Finance used multipliers from both the Newfoundland and LabradorEconometric and Input-Output Models.
The industries used in the analysis are identified in Section 1.2. In reporting the findings of theanalysis, the following industry groupings were used:48
S oil and gas developmentS oil and gas productionS oil and gas explorationS fish processingS fish harvestingS other private sector — this includes aquaculture, shipbuilding and ship repair, tourism, and
marine transportation and related servicesS federal governmentS provincial government
6.1 GDP IMPACT49
The direct GDP impact of oceans-related activity averaged about$1.38 billion annually from 1997to 1999 or 14.1 per cent of totaleconomic activity which was $9.8billion. Total GDP impact,including direct, indirect andinduced effects, averaged about$2.59 billion over this period, or26.5 per cent of total economicactivity.
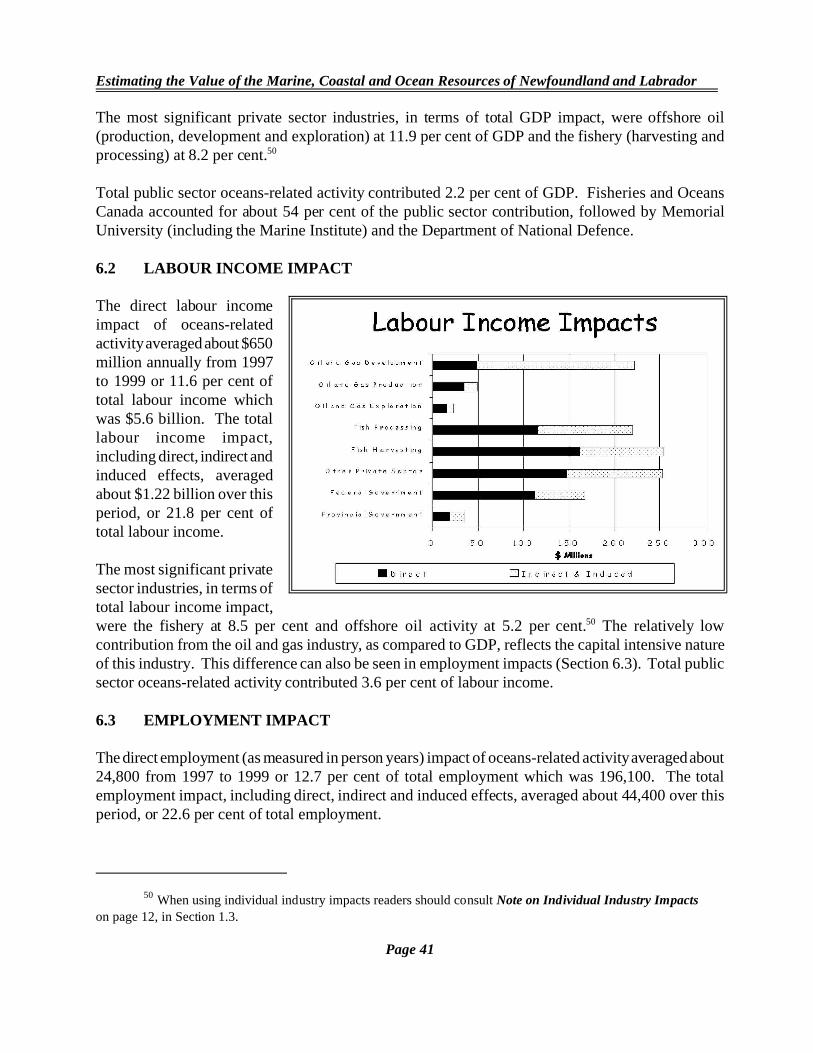
Estimating the Value of the Marine, Coastal and Ocean Resources of Newfoundland and Labrador
50 When using individual industry impacts readers should consult Note on Individual Industry Impacts
on page 12, in Section 1.3.
Page 41
The most significant private sector industries, in terms of total GDP impact, were offshore oil(production, development and exploration) at 11.9 per cent of GDP and the fishery (harvesting andprocessing) at 8.2 per cent.50
Total public sector oceans-related activity contributed 2.2 per cent of GDP. Fisheries and OceansCanada accounted for about 54 per cent of the public sector contribution, followed by MemorialUniversity (including the Marine Institute) and the Department of National Defence.
6.2 LABOUR INCOME IMPACT
The direct labour incomeimpact of oceans-relatedactivity averaged about $650million annually from 1997to 1999 or 11.6 per cent oftotal labour income whichwas $5.6 billion. The totallabour income impact,including direct, indirect andinduced effects, averagedabout $1.22 billion over thisperiod, or 21.8 per cent oftotal labour income.
The most significant privatesector industries, in terms oftotal labour income impact,were the fishery at 8.5 per cent and offshore oil activity at 5.2 per cent.50 The relatively lowcontribution from the oil and gas industry, as compared to GDP, reflects the capital intensive natureof this industry. This difference can also be seen in employment impacts (Section 6.3). Total publicsector oceans-related activity contributed 3.6 per cent of labour income.
6.3 EMPLOYMENT IMPACT
The direct employment (as measured in person years) impact of oceans-related activity averaged about24,800 from 1997 to 1999 or 12.7 per cent of total employment which was 196,100. The totalemployment impact, including direct, indirect and induced effects, averaged about 44,400 over thisperiod, or 22.6 per cent of total employment.
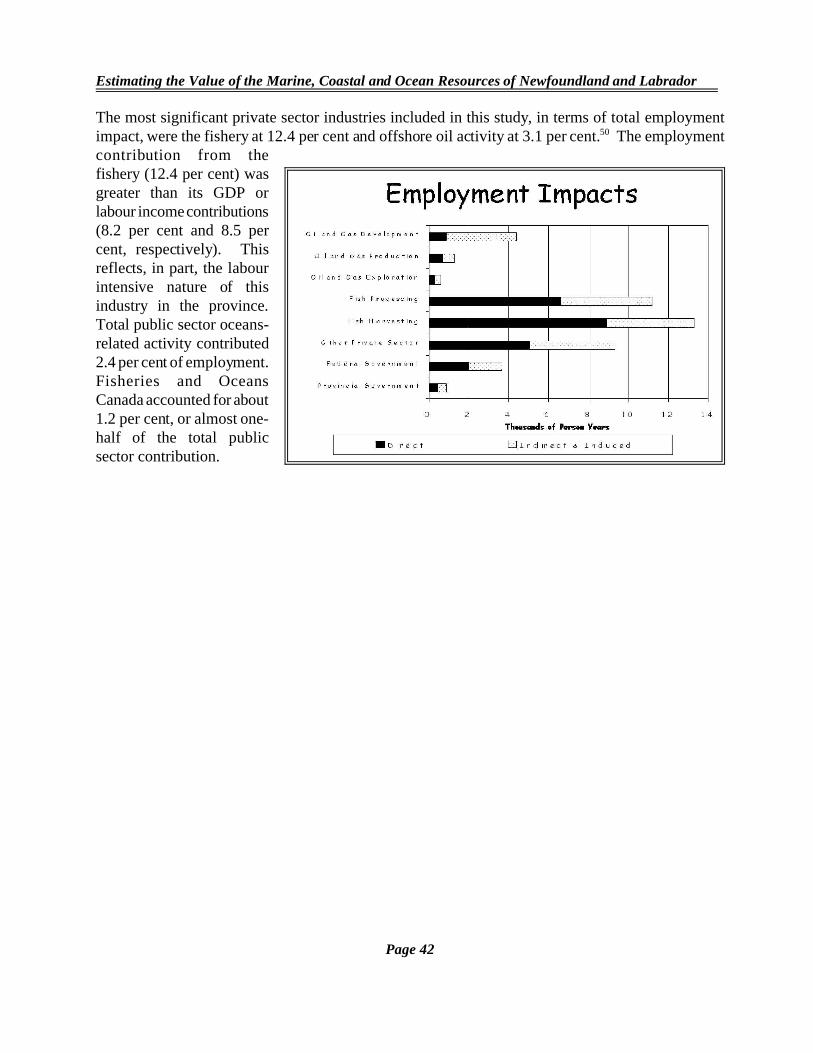
Estimating the Value of the Marine, Coastal and Ocean Resources of Newfoundland and Labrador
Page 42
The most significant private sector industries included in this study, in terms of total employmentimpact, were the fishery at 12.4 per cent and offshore oil activity at 3.1 per cent.50 The employmentcontribution from thefishery (12.4 per cent) wasgreater than its GDP orlabour income contributions(8.2 per cent and 8.5 percent, respectively). Thisreflects, in part, the labourintensive nature of thisindustry in the province.Total public sector oceans-related activity contributed2.4 per cent of employment.Fisheries and OceansCanada accounted for about1.2 per cent, or almost one-half of the total publicsector contribution.
Estimating the Value of the Marine, Coastal and Ocean Resources of Newfoundland and Labrador
Page 43
7.0 CONCLUSIONS
The economy, environment and social fabric of Newfoundland and Labrador are intrinsically linkedto the Atlantic Ocean and its resources. During the 1997-99 period, ocean related activitiescontributed, on average, $2.59 billion or 26.5 per cent to the province’s GDP. In addition, 21.8 percent of the province’s labour income and 22.6 per cent of its employment were directly and indirectlylinked to ocean-related activities. Two industries — oil and gas, and the fishery — dominated Newfoundland and Labrador’s oceanssector over the three year period studied. Combined, these two industries accounted for, on average,20.1 per cent of economic activity (including indirect and spin-off impacts), 13.7 per cent of labourincome, and 15.5 per cent of employment.
The contribution of oceans-related activity from other private sector industries, such as tourism,transportation, recreation and marine construction, were also important, contributing, on average,about 4.2 per cent of GDP, 4.6 per cent of labour income and 4.7 per cent of employment.
The public service plays an important role in the oceans sector in Newfoundland and Labrador. On aday-to-day basis, about 3,000 public servants from various departments and agencies and MemorialUniversity work in oceans related activity. The public sector accounted for 2.2 per cent of GDP, 3.6per cent of labour income, and 2.4 per cent of employment over the study period.
Offshore oil production has increased since 1999. During 2000, Hibernia oil production grew by 45per cent from 1999. Current estimates indicate that Hibernia oil production could grow to 60 millionbarrels in 2002. Terra Nova, will add over 30 million barrels to production in 2002 and up to 47million barrels at peak. This increased production activity will be complemented by development ofother fields such as White Rose.
Increasing reliance on high valued shellfish, such as crab and shrimp, allowed the landed value of thefishery to reach a record high of $580.7 million in 2000. Despite recent market weakness, landedvalue was approximately $500 million in 2001. As well, aquaculture production grew to over 5,200tonnes in 2001, compared to the previous peak of about 4,300 tonnes in 1999.
Growth in the oil and gas industry and the fishery has been complemented by increased employment,higher wages, and increased demand for indirect and spin-off goods and services. While this positivelyimpacted the Services sector in general, in particular it was beneficial to firms engaged in oceantechnologies and to research and development institutes focused on marine activity.

Appendix 1 - Public Sector Data
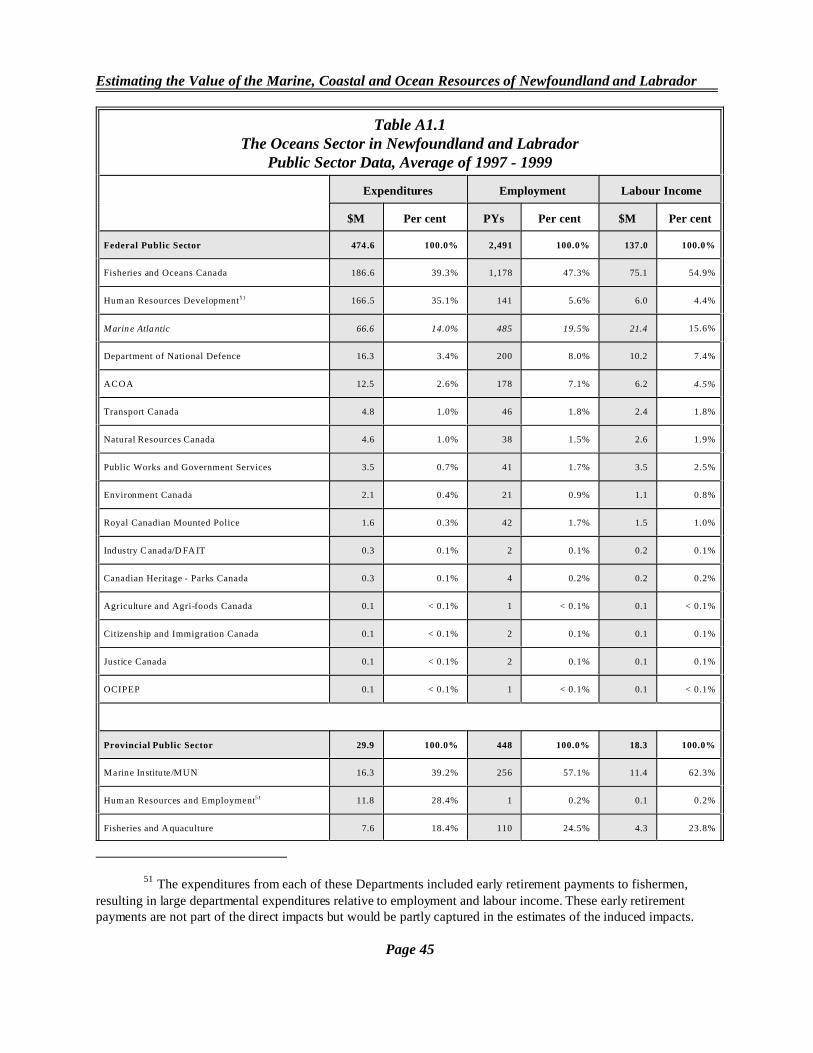
Estimating the Value of the Marine, Coastal and Ocean Resources of Newfoundland and Labrador
51 The expenditures from each of these Departments included early retirement payments to fishermen,
resulting in large departmental expenditures relative to employment and labour income. These early retirementpayments are not part of the direct impacts but would be partly captured in the estimates of the induced impacts.
Page 45
Table A1.1The Oceans Sector in Newfoundland and Labrador
Public Sector Data, Average of 1997 - 1999
Expenditures Employment Labour Income
$M Per cent PYs Per cent $M Per cent
Federal Public Sector 474 .6 100.0% 2,491 100.0% 137 .0 100.0%
Fisheries and Oceans Canada 186 .6 39.3% 1,178 47.3% 75.1 54.9%
Hum an Resources Development51 166 .5 35.1% 141 5.6% 6.0 4.4%
Marin e Atla ntic 66.6 14.0% 485 19.5% 21.4 15.6%
Department of National Defence 16.3 3.4% 200 8.0% 10.2 7.4%
ACOA 12.5 2.6% 178 7.1% 6.2 4.5%
Transport Canada 4.8 1.0% 46 1.8% 2.4 1.8%
Natural Resources Canada 4.6 1.0% 38 1.5% 2.6 1.9%
Public Works and Government Services 3.5 0.7% 41 1.7% 3.5 2.5%
Environment Canada 2.1 0.4% 21 0.9% 1.1 0.8%
Royal Canadian Mounted Police 1.6 0.3% 42 1.7% 1.5 1.0%
Indus try C anada/D FA IT 0.3 0.1% 2 0.1% 0.2 0.1%
Canadian Heritage - Parks Canada 0.3 0.1% 4 0.2% 0.2 0.2%
Agriculture and Agri-foods Canada 0.1 < 0.1% 1 < 0.1% 0.1 < 0.1%
Citizenship and Immigration Canada 0.1 < 0.1% 2 0.1% 0.1 0.1%
Justice Canada 0.1 < 0.1% 2 0.1% 0.1 0.1%
OCIPEP 0.1 < 0.1% 1 < 0.1% 0.1 < 0.1%
Provincial Public Sector 29.9 100.0% 448 100.0% 18.3 100.0%
Marine Institu te /MUN 16.3 39.2% 256 57.1% 11.4 62.3%
Hum an Resources and Employment51 11.8 28.4% 1 0.2% 0.1 0.2%
Fisheries and A quaculture 7.6 18.4% 110 24.5% 4.3 23.8%

Estimating the Value of the Marine, Coastal and Ocean Resources of Newfoundland and Labrador
52 This Department was restructured in February 2001 combining the former Departments of Industry,Trade and Technology, and Development and Rural Renewal.
53 This Department, prior to February 2001, was part of the Department of Education.
54 This Department, prior to February 2001, was a part of the Department of Environment and Labour.
55 The CNOPB is included with the federal public sector for impact calculations.
Page 46
Table A1.1 (Continued from page 45)The Oceans Sector in Newfoundland and Labrador
Public Sector Data, Average of 1997 - 1999
Expenditures Employment Labour Income
$M Per cent PYs Per cent $M Per cent
Industry, Trade and Rural Development52 3.4 8.2% 55 12.2% 1.4 7.9%
M ines and E nergy 1.0 2.5% 14 3.0% 0.6 3.3%
Youth S ervices & P ost Secondary Ed ucation53 1.0 2.4% 2 0.4% 0.1 0.5%
Works, Services and T ransportation 0.3 0.8% 8 1.7% 0.3 1.5%
Environment54 0.1 0.2% 3 0.7% 0.1 0.5%
Federal-Provincial Partnerships 3.6 100.0% 34 100.0% 2.6 100.0%
CNOPB 55 3.6 100.0% 34 100.0% 2.6 100.0%

Appendix 2 - Economic Impacts
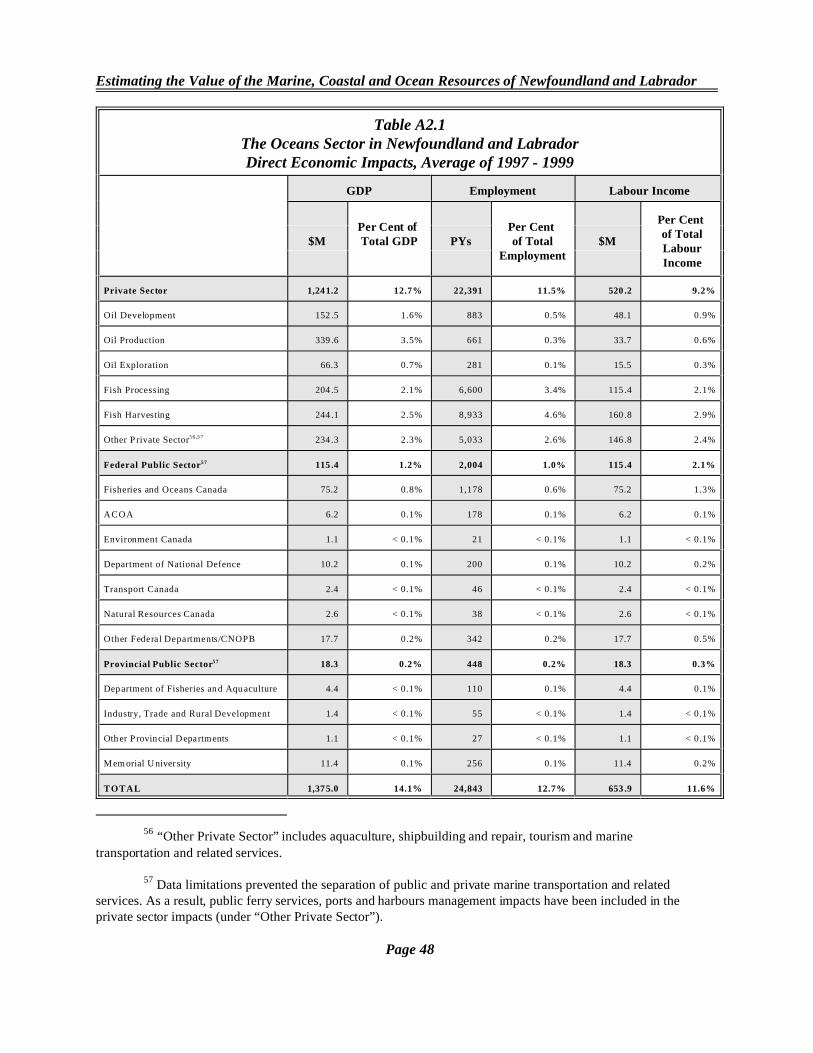
Estimating the Value of the Marine, Coastal and Ocean Resources of Newfoundland and Labrador
56 “Other Private Sector” includes aquaculture, shipbuilding and repair, tourism and marine
transportation and related services.
57 Data limitations prevented the separation of public and private marine transportation and relatedservices. As a result, public ferry services, ports and harbours management impacts have been included in theprivate sector impacts (under “Other Private Sector”).
Page 48
Table A2.1The Oceans Sector in Newfoundland and LabradorDirect Economic Impacts, Average of 1997 - 1999
GDP Employment Labour Income
$MPer Cent of Total GDP PYs
Per Cent of Total
Employment$M
Per Cent of TotalLabourIncome
Private Sector 1,241.2 12.7% 22,391 11.5% 520 .2 9.2%
Oil Development 152 .5 1.6% 883 0.5% 48.1 0.9%
Oil Production 339 .6 3.5% 661 0.3% 33.7 0.6%
Oil Exploration 66.3 0.7% 281 0.1% 15.5 0.3%
Fish Processing 204 .5 2.1% 6,600 3.4% 115 .4 2.1%
Fish Harvesting 244 .1 2.5% 8,933 4.6% 160 .8 2.9%
Other P rivate Sector56,57 234 .3 2.3% 5,033 2.6% 146 .8 2.4%
Federal Public Sector57 115 .4 1.2% 2,004 1.0% 115 .4 2.1%
Fisheries and Oceans Canada 75.2 0.8% 1,178 0.6% 75.2 1.3%
ACOA 6.2 0.1% 178 0.1% 6.2 0.1%
Environment Canada 1.1 < 0.1% 21 < 0.1% 1.1 < 0.1%
Department of National Defence 10.2 0.1% 200 0.1% 10.2 0.2%
Transport Canada 2.4 < 0.1% 46 < 0.1% 2.4 < 0.1%
Natural Resources Canada 2.6 < 0.1% 38 < 0.1% 2.6 < 0.1%
Other Federal Departments/CNOPB 17.7 0.2% 342 0.2% 17.7 0.5%
Provincial Public Sector57 18.3 0.2% 448 0.2% 18.3 0.3%
Dep artment of Fisheries an d Aqu aculture 4.4 < 0.1% 110 0.1% 4.4 0.1%
Industry, Trade and Rural Development 1.4 < 0.1% 55 < 0.1% 1.4 < 0.1%
Oth er Provincial D epartments 1.1 < 0.1% 27 < 0.1% 1.1 < 0.1%
M em orial U niver sity 11.4 0.1% 256 0.1% 11.4 0.2%
TOTAL 1,375.0 14.1% 24,843 12.7% 653 .9 11.6%
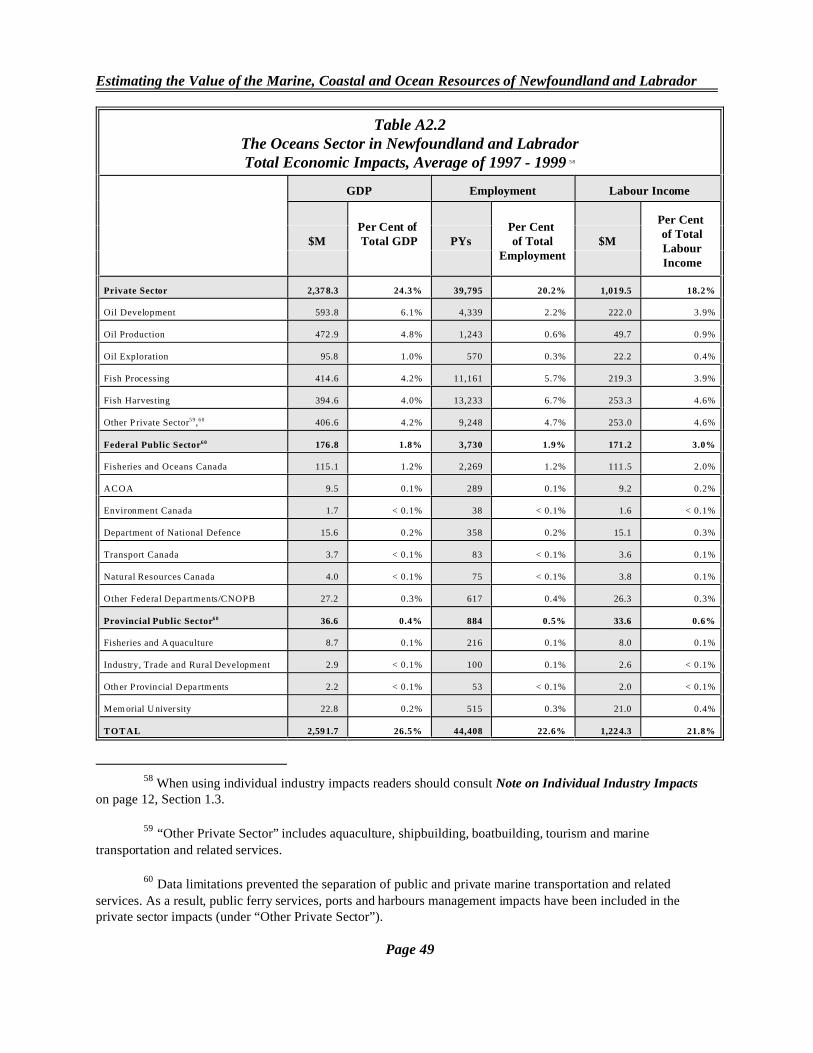
Estimating the Value of the Marine, Coastal and Ocean Resources of Newfoundland and Labrador
58 When using individual industry impacts readers should consult Note on Individual Industry Impactson page 12, Section 1.3.
59 “Other Private Sector” includes aquaculture, shipbuilding, boatbuilding, tourism and marine
transportation and related services.
60 Data limitations prevented the separation of public and private marine transportation and related
services. As a result, public ferry services, ports and harbours management impacts have been included in theprivate sector impacts (under “Other Private Sector”).
Page 49
Table A2.2The Oceans Sector in Newfoundland and LabradorTotal Economic Impacts, Average of 1997 - 1999 58
GDP Employment Labour Income
$MPer Cent of Total GDP PYs
Per Cent of Total
Employment$M
Per Cent of TotalLabourIncome
Private Sector 2,378.3 24.3% 39,795 20.2% 1,019.5 18.2%
Oil Development 593 .8 6.1% 4,339 2.2% 222 .0 3.9%
Oil Production 472 .9 4.8% 1,243 0.6% 49.7 0.9%
Oil Exploration 95.8 1.0% 570 0.3% 22.2 0.4%
Fish Processing 414 .6 4.2% 11,161 5.7% 219 .3 3.9%
Fish Harvesting 394 .6 4.0% 13,233 6.7% 253 .3 4.6%
Other P rivate Sector59,60 406 .6 4.2% 9,248 4.7% 253 .0 4.6%
Federal Public Sector60 176 .8 1.8% 3,730 1.9% 171 .2 3.0%
Fisheries and Oceans Canada 115 .1 1.2% 2,269 1.2% 111 .5 2.0%
ACOA 9.5 0.1% 289 0.1% 9.2 0.2%
Environment Canada 1.7 < 0.1% 38 < 0.1% 1.6 < 0.1%
Department of National Defence 15.6 0.2% 358 0.2% 15.1 0.3%
Transport Canada 3.7 < 0.1% 83 < 0.1% 3.6 0.1%
Natural Resources Canada 4.0 < 0.1% 75 < 0.1% 3.8 0.1%
Other Federal Departments/CNOPB 27.2 0.3% 617 0.4% 26.3 0.3%
Provincial Public Sector60 36.6 0.4% 884 0.5% 33.6 0.6%
Fisheries and A quaculture 8.7 0.1% 216 0.1% 8.0 0.1%
Industry, Trade and Rural Development 2.9 < 0.1% 100 0.1% 2.6 < 0.1%
Oth er Provincial D epartments 2.2 < 0.1% 53 < 0.1% 2.0 < 0.1%
M em orial U niver sity 22.8 0.2% 515 0.3% 21.0 0.4%
TOTAL 2,591.7 26.5% 44,408 22.6% 1,224.3 21.8%

Appendix 3 - Private Sector Data Sources
Estimating the Value of the Marine, Coastal and Ocean Resources of Newfoundland and Labrador
Page 51
A list of the industries included and the sources of data follows.
Oil and Gas exploration: GDP data was developed using exploration expenditures provided by theCanada-Newfoundland Offshore Petroleum Board (CNOPB) and GDP data for “Service IndustriesIncidental to Mineral Extraction” from Statistics Canada. Employment data was provided by theCNOPB. Labour income was estimated by the Department of Finance using employment data and anestimate of average weekly earnings.
Oil and Gas Development: GDP data for 1997 (the most recent year available for nominal GDP data)was taken from Statistics Canada for the industry “Gas and Oil Facility Construction”. The 1998 and1999 data was developed using the 1997 data and development expenditures from CNOPB.Employment data was provided by the CNOPB. Labour income was estimated by the Department ofFinance using employment data and an estimate of average annual earnings.
Oil and Gas Production: GDP data for 1997 was taken from Statistics Canada for the industry “CrudePetroleum and Natural Gas Industries”. The 1998 and 1999 data was developed using the 1997 dataand estimates of value of production. Employment data was provided by the CNOPB. Labour incomewas estimated by the Department of Finance using employment data and an estimate of average annualearnings.
Primary Fishing: GDP data for 1997 was taken from Statistics Canada for the industry “Fishing andTrapping Industries”. (We know that trapping constitutes only a very small portion of GDP in thisindustry in Newfoundland and Labrador.) The 1998 and 1999 data was developed using the value offish landings. Employment data comes from Statistics Canada’s Labour Force Survey. Labour incomewas obtained from the Labour Income division of Statistics Canada.
Fish Processing: GDP data for 1997 was taken from Statistics Canada for the industry “Fish ProductsIndustry”. The 1998 and 1999 data was developed using the production value of fish products, assupplied by the Department of Fisheries and Aquaculture. Employment data comes from StatisticsCanada’s Labour Force Survey. Labour Income was obtained from the Labour Income division ofStatistics Canada.
Aquaculture: GDP, employment and labour income was obtained from Statistics Canada’s CanadianAquaculture Industry Survey.
Boatbuilding: GDP, employment and labour income was obtained from Statistics Canada’s AnnualSurvey of Manufacturers. Years used for this industry were 1996 and 1998 since data in other yearswas suppressed.
Shipbuilding: Estimates of GDP were calculated in-house by the Department of Finance based oninformation supplied by the Department of Industry Trade and Rural Development (ITRD).Employment and income data was also supplied by ITRD.
Estimating the Value of the Marine, Coastal and Ocean Resources of Newfoundland and Labrador
61 The exit surveys include four activities which were identified as being oceans related: boat touring,
whale watching, iceberg viewing and sea kayaking. Estimates indicate that about 47 per cent of non-resident autovisitors and 36 per cent of non-residents air visitors engage in oceans related activity.
Page 52
Water Transportation: Estimates of GDP were calculated in-house by the Department of Financebased on information supplied by Marine Atlantic, Department of Works, Services and Transportationand by the Port of St. John’s. Employment data comes from Statistics Canada’s Labour Force Survey.Labour income was calculated using employment data and estimated average weekly earnings.
Cargo Handling: This data was taken from Statistics Canada, Shipping in Canada.
Tourism: Estimates of GDP, employment and labour income were estimated in-house by theDepartment of Finance using information from the Department of Tourism, Culture and Recreation’s1997 air and auto exit surveys for non-resident activity and the Canadian Travel Survey (StatisticsCanada) for resident activity.61