Embed Size (px)
Citation preview

1
Etisalat Group
A Profitable Growth Story
EFG-Hermes- 2nd London MENA Conference
November 1st-2nd 2012, London.
2
Emirates Telecommunications Corporation and its subsidiaries
(“Etisalat” or the “Company”) have prepared this presentation
(“Presentation”) in good faith, however, no warranty or representation,
express or implied is made as to the adequacy, correctness,
completeness or accuracy of any numbers, statements, opinions or
estimates, or other information contained in this Presentation.
The information contained in this Presentation is an overview, and
should not be considered as the giving of investment advice by the
Company or any of its shareholders, directors, officers, agents,
employees or advisers. Each party to whom this Presentation is made
available must make its own independent assessment of the Company
after making such investigations and taking such advice as may be
deemed necessary.
Where this Presentation contains summaries of documents, those
summaries should not be relied upon and the actual documentation
must be referred to for its full effect.
This Presentation includes certain “ forward-looking statements”. Such
forward looking statements are not guarantees of future performance
and involve risks of uncertainties. Actual results may differ materially
from these forward looking statements.
Disclaimer
3
Etisalat Snapshot
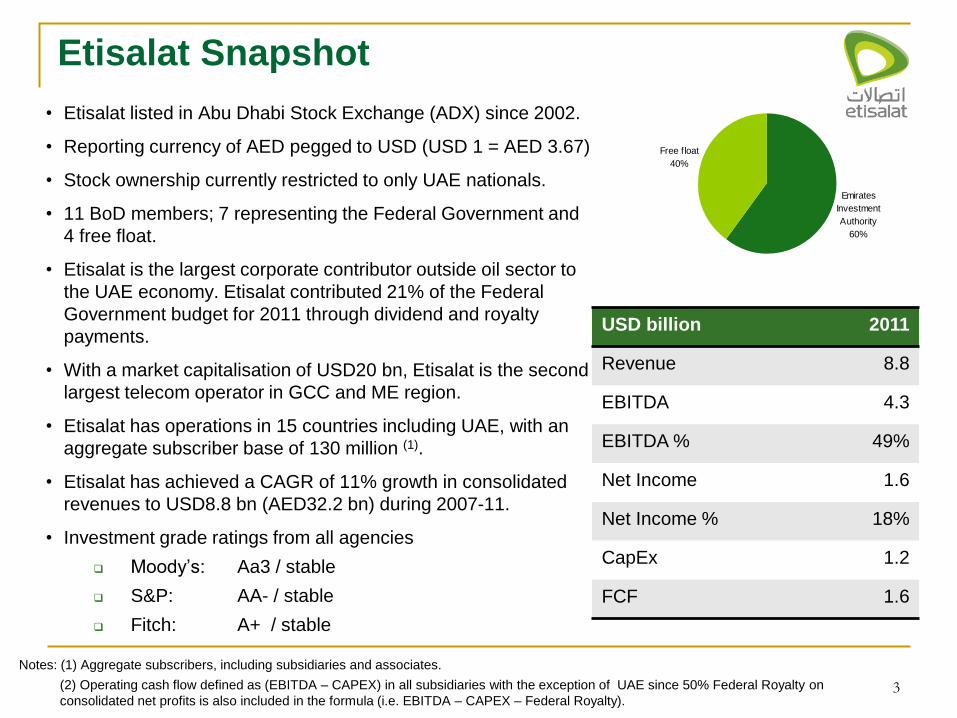
• Etisalat listed in Abu Dhabi Stock Exchange (ADX) since 2002.
• Reporting currency of AED pegged to USD (USD 1 = AED 3.67)
• Stock ownership currently restricted to only UAE nationals.
• 11 BoD members; 7 representing the Federal Government and
4 free float.
• Etisalat is the largest corporate contributor outside oil sector to
the UAE economy. Etisalat contributed 21% of the Federal
Government budget for 2011 through dividend and royalty
payments.
• With a market capitalisation of USD20 bn, Etisalat is the second
largest telecom operator in GCC and ME region.
• Etisalat has operations in 15 countries including UAE, with an
aggregate subscriber base of 130 million (1).
• Etisalat has achieved a CAGR of 11% growth in consolidated
revenues to USD8.8 bn (AED32.2 bn) during 2007-11.
• Investment grade ratings from all agencies
Moody’s: Aa3 / stable
S&P: AA- / stable
Fitch: A+ / stable
Emirates
Investment
Authority
60%
Free float
40%
Notes: (1) Aggregate subscribers, including subsidiaries and associates.
USD billion 2011
Revenue 8.8
EBITDA 4.3
EBITDA % 49%
Net Income 1.6
Net Income % 18%
CapEx 1.2
FCF 1.6
(2) Operating cash flow defined as (EBITDA – CAPEX) in all subsidiaries with the exception of UAE since 50% Federal Royalty on
consolidated net profits is also included in the formula (i.e. EBITDA – CAPEX – Federal Royalty).
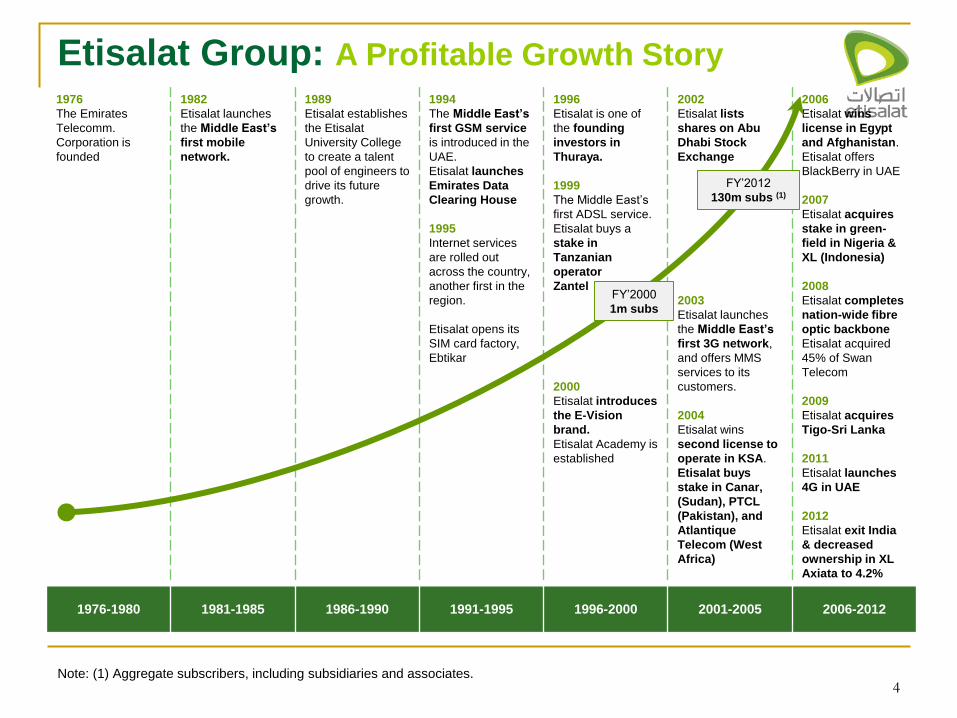
1976
The Emirates
Telecomm.
Corporation is
founded
1982
Etisalat launches
the Middle East’s
first mobile
network.
1989
Etisalat establishes
the Etisalat
University College
to create a talent
pool of engineers to
drive its future
growth.
1994
The Middle East’s
first GSM service
is introduced in the
UAE.
Etisalat launches
Emirates Data
Clearing House
1995
Internet services
are rolled out
across the country,
another first in the
region.
Etisalat opens its
SIM card factory,
Ebtikar
1996
Etisalat is one of
the founding
investors in
Thuraya.
1999
The Middle East’s
first ADSL service.
Etisalat buys a
stake in
Tanzanian
operator
Zantel
2000
Etisalat introduces
the E-Vision
brand.
Etisalat Academy is
established
2002
Etisalat lists
shares on Abu
Dhabi Stock
Exchange
2003
Etisalat launches
the Middle East’s
first 3G network,
and offers MMS
services to its
customers.
2004
Etisalat wins
second license to
operate in KSA.
Etisalat buys
stake in Canar,
(Sudan), PTCL
(Pakistan), and
Atlantique
Telecom (West
Africa)
2006
Etisalat wins
license in Egypt
and Afghanistan.
Etisalat offers
BlackBerry in UAE
2007
Etisalat acquires
stake in green-
field in Nigeria &
XL (Indonesia)
2008
Etisalat completes
nation-wide fibre
optic backbone
Etisalat acquired
45% of Swan
Telecom
2009
Etisalat acquires
Tigo-Sri Lanka
2011
Etisalat launches
4G in UAE
2012
Etisalat exit India
& decreased
ownership in XL
Axiata to 4.2%
1976-1980 1981-1985 1986-1990 1991-1995 1996-2000 2001-2005 2006-2012
4
Etisalat Group: A Profitable Growth Story
FY’2012
130m subs (1)
FY’2000
1m subs
Note: (1) Aggregate subscribers, including subsidiaries and associates.
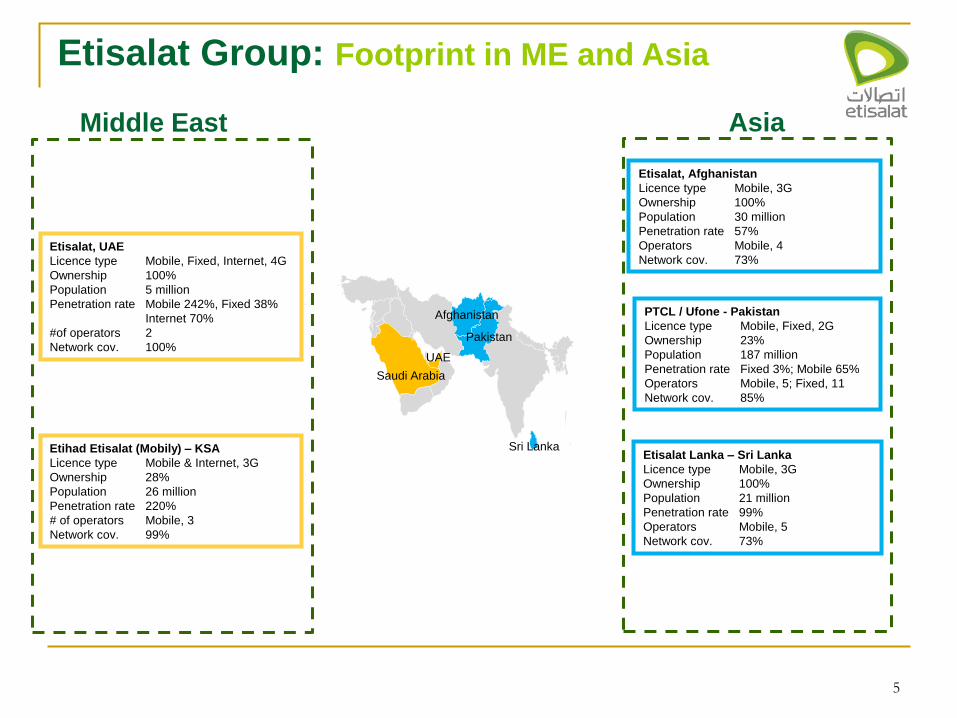
Sri Lanka
Saudi Arabia
UAE
Pakistan
Afghanistan
5
Etisalat Group: Footprint in ME and Asia
Etisalat, UAE
Licence type Mobile, Fixed, Internet, 4G
Ownership 100%
Population 5 million
Penetration rate Mobile 242%, Fixed 38%
Internet 70%
#of operators 2
Network cov. 100%
Etihad Etisalat (Mobily) – KSA
Licence type Mobile & Internet, 3G
Ownership 28%
Population 26 million
Penetration rate 220%
# of operators Mobile, 3
Network cov. 99%
Etisalat, Afghanistan
Licence type Mobile, 3G
Ownership 100%
Population 30 million
Penetration rate 57%
Operators Mobile, 4
Network cov. 73%
PTCL / Ufone - Pakistan
Licence type Mobile, Fixed, 2G
Ownership 23%
Population 187 million
Penetration rate Fixed 3%; Mobile 65%
Operators Mobile, 5; Fixed, 11
Network cov. 85%
Etisalat Lanka – Sri Lanka
Licence type Mobile, 3G
Ownership 100%
Population 21 million
Penetration rate 99%
Operators Mobile, 5
Network cov. 73%
Middle East Asia
Niger
Central African Republic
Gabon
Nigeria
Togo Cote d’Ivoire
Benin
Egypt
Sudan
Tanzania
6
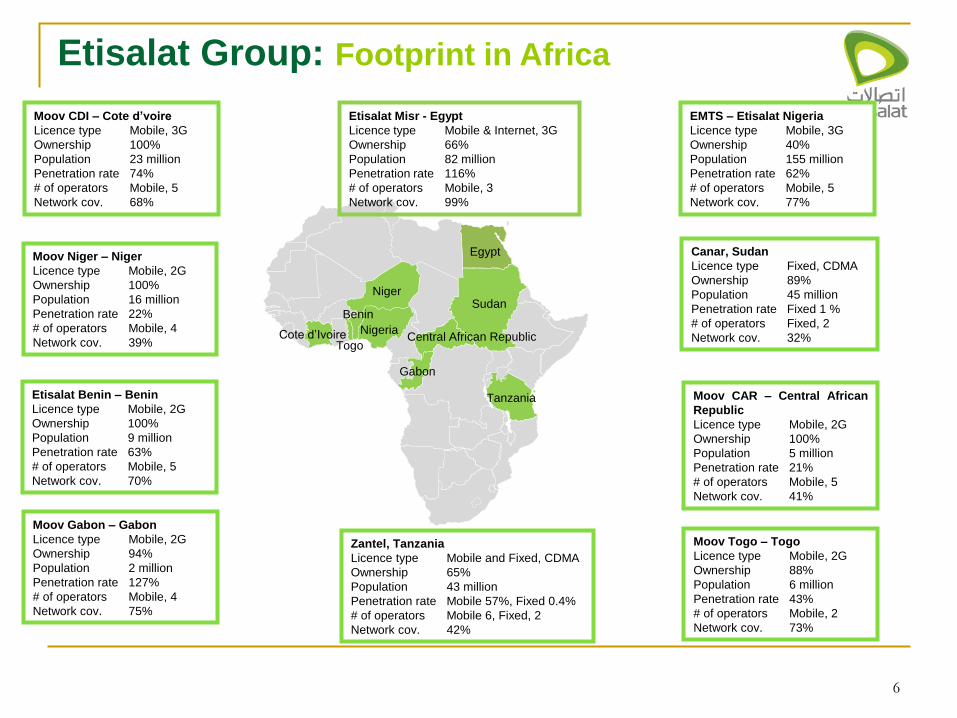
Etisalat Group: Footprint in Africa
Etisalat Misr - Egypt
Licence type Mobile & Internet, 3G
Ownership 66%
Population 82 million
Penetration rate 116%
# of operators Mobile, 3
Network cov. 99%
Canar, Sudan
Licence type Fixed, CDMA
Ownership 89%
Population 45 million
Penetration rate Fixed 1 %
# of operators Fixed, 2
Network cov. 32%
EMTS – Etisalat Nigeria
Licence type Mobile, 3G
Ownership 40%
Population 155 million
Penetration rate 62%
# of operators Mobile, 5
Network cov. 77%
Zantel, Tanzania
Licence type Mobile and Fixed, CDMA
Ownership 65%
Population 43 million
Penetration rate Mobile 57%, Fixed 0.4%
# of operators Mobile 6, Fixed, 2
Network cov. 42%
Moov CDI – Cote d’voire
Licence type Mobile, 3G
Ownership 100%
Population 23 million
Penetration rate 74%
# of operators Mobile, 5
Network cov. 68%
Etisalat Benin – Benin
Licence type Mobile, 2G
Ownership 100%
Population 9 million
Penetration rate 63%
# of operators Mobile, 5
Network cov. 70%
Moov Gabon – Gabon
Licence type Mobile, 2G
Ownership 94%
Population 2 million
Penetration rate 127%
# of operators Mobile, 4
Network cov. 75%
Moov Niger – Niger
Licence type Mobile, 2G
Ownership 100%
Population 16 million
Penetration rate 22%
# of operators Mobile, 4
Network cov. 39%
Moov Togo – Togo
Licence type Mobile, 2G
Ownership 88%
Population 6 million
Penetration rate 43%
# of operators Mobile, 2
Network cov. 73%
Moov CAR – Central African
Republic
Licence type Mobile, 2G
Ownership 100%
Population 5 million
Penetration rate 21%
# of operators Mobile, 5
Network cov. 41%
7
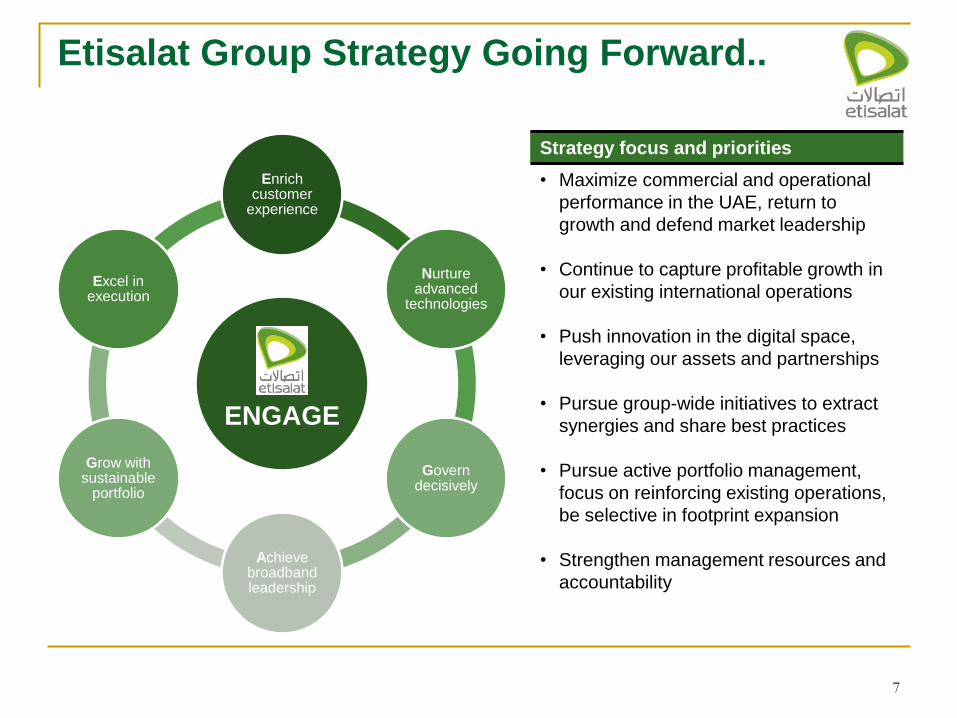
Etisalat Group Strategy Going Forward..
ENGAGE
Enrich customer
experience
Nurture advanced
technologies
Govern decisively
Achieve broadband leadership
Grow with sustainable
portfolio
Excel in execution
Strategy focus and priorities
• Maximize commercial and operational
performance in the UAE, return to
growth and defend market leadership
• Continue to capture profitable growth in
our existing international operations
• Push innovation in the digital space,
leveraging our assets and partnerships
• Pursue group-wide initiatives to extract
synergies and share best practices
• Pursue active portfolio management,
focus on reinforcing existing operations,
be selective in footprint expansion
• Strengthen management resources and
accountability
8
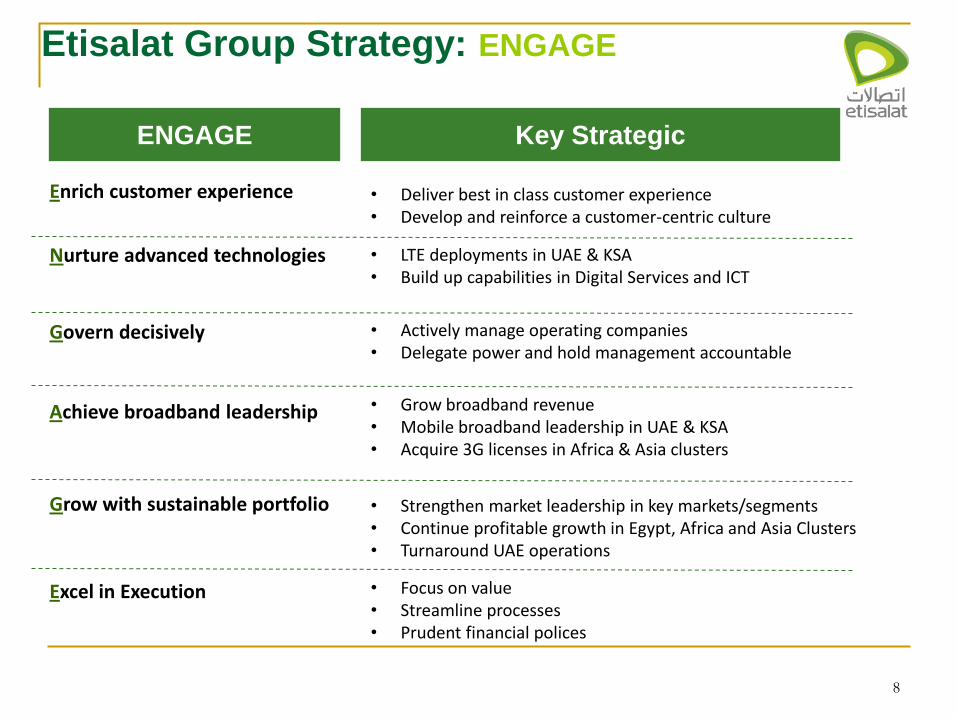
Enrich customer experience
Nurture advanced technologies
Govern decisively
Achieve broadband leadership
Grow with sustainable portfolio
Excel in Execution
ENGAGE Key Strategic
• LTE deployments in UAE & KSA • Build up capabilities in Digital Services and ICT
• Actively manage operating companies • Delegate power and hold management accountable
• Grow broadband revenue • Mobile broadband leadership in UAE & KSA • Acquire 3G licenses in Africa & Asia clusters
• Strengthen market leadership in key markets/segments • Continue profitable growth in Egypt, Africa and Asia Clusters • Turnaround UAE operations
• Focus on value • Streamline processes • Prudent financial polices
• Deliver best in class customer experience • Develop and reinforce a customer-centric culture
Etisalat Group Strategy: ENGAGE
9
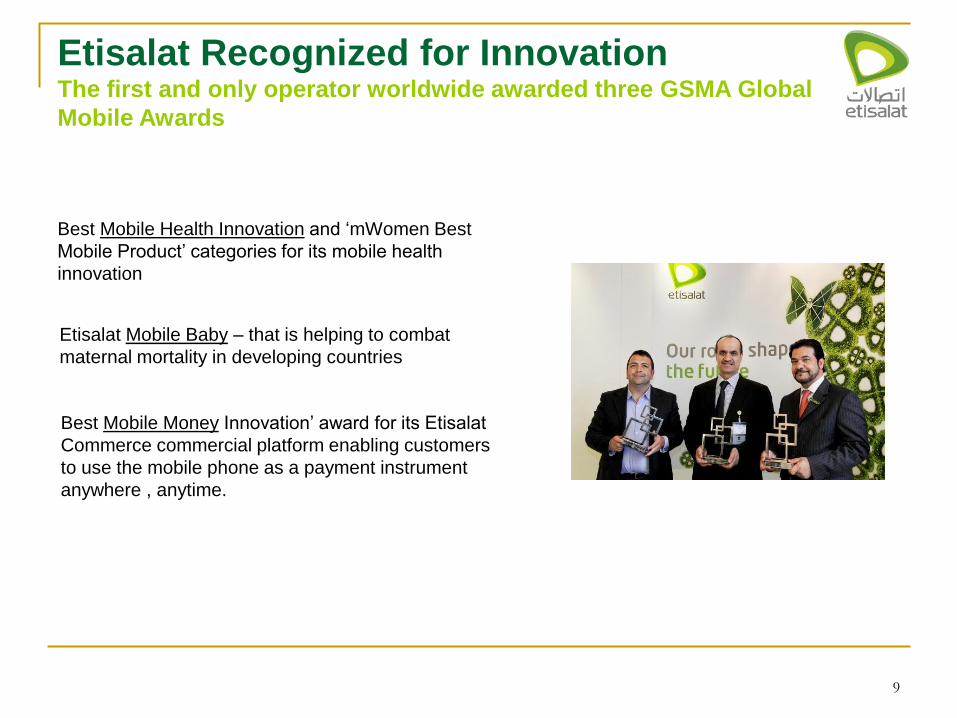
Etisalat Recognized for Innovation The first and only operator worldwide awarded three GSMA Global
Mobile Awards
Best Mobile Health Innovation and ‘mWomen Best
Mobile Product’ categories for its mobile health
innovation
Etisalat Mobile Baby – that is helping to combat
maternal mortality in developing countries
Best Mobile Money Innovation’ award for its Etisalat
Commerce commercial platform enabling customers
to use the mobile phone as a payment instrument
anywhere , anytime.
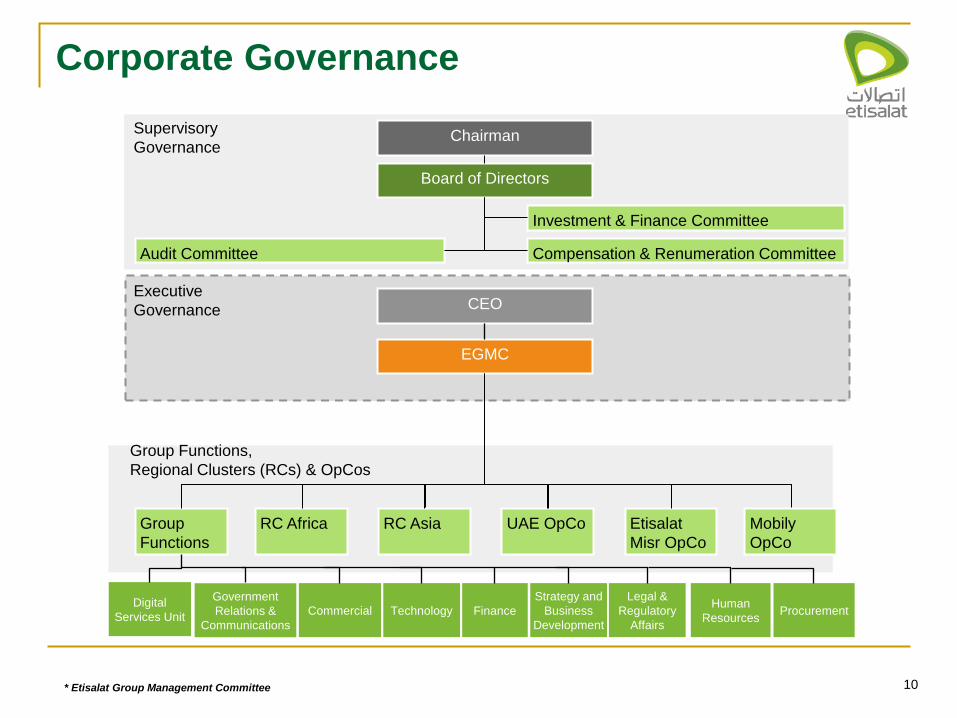
EGMC
Board of Directors
CEO
Chairman
Compensation & Renumeration Committee Audit Committee
Investment & Finance Committee
Supervisory
Governance
Executive
Governance
Group
Functions
UAE OpCo
Group Functions,
Regional Clusters (RCs) & OpCos
RC Africa
10
RC Asia Etisalat
Misr OpCo
Mobily
OpCo
* Etisalat Group Management Committee
Corporate Governance
Commercial Technology Finance
Strategy and
Business
Development
Legal &
Regulatory
Affairs
Human
Resources Procurement
Government
Relations &
Communications
Digital
Services Unit
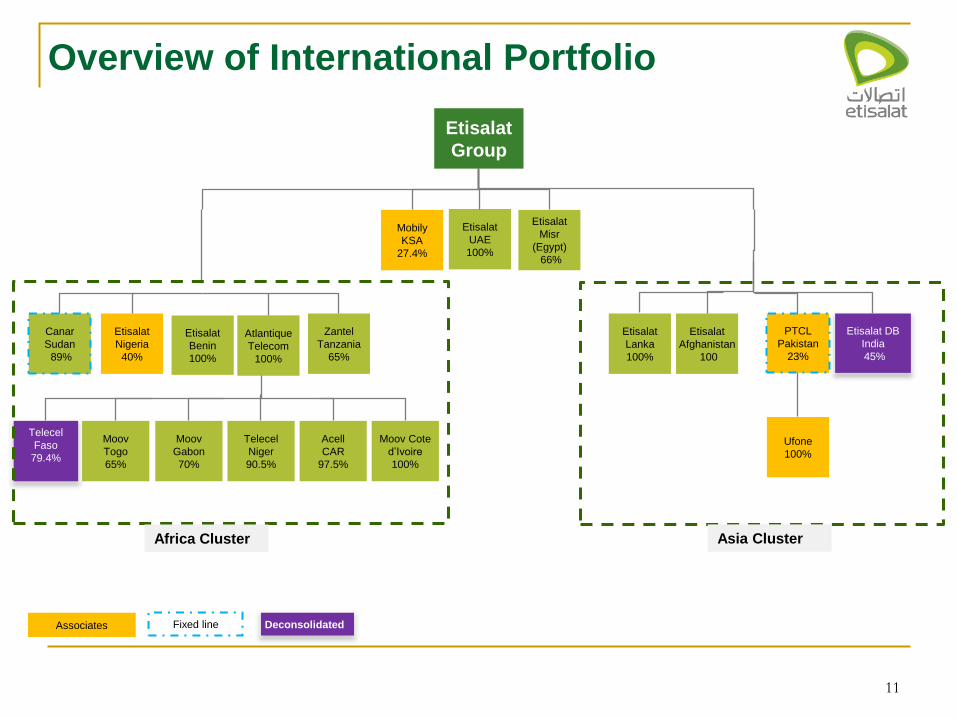
Etisalat
Group
Canar
Sudan
89%
Etisalat
Nigeria
40%
Zantel
Tanzania
65%
Mobily
KSA
27.4%
Etisalat
UAE
100%
Etisalat
Misr
(Egypt)
66%
Etisalat
Lanka
100%
Etisalat
Afghanistan
100
PTCL
Pakistan
23%
Etisalat DB
India
45%
Moov
Togo
65%
Moov
Gabon
70%
Telecel
Niger
90.5%
Acell
CAR
97.5%
Moov Cote
d’Ivoire
100%
Telecel
Faso
79.4%
Atlantique
Telecom
100%
Overview of International Portfolio
Etisalat
Benin
100%
Ufone
100%
Deconsolidated Fixed line Associates
11
Africa Cluster Asia Cluster
12
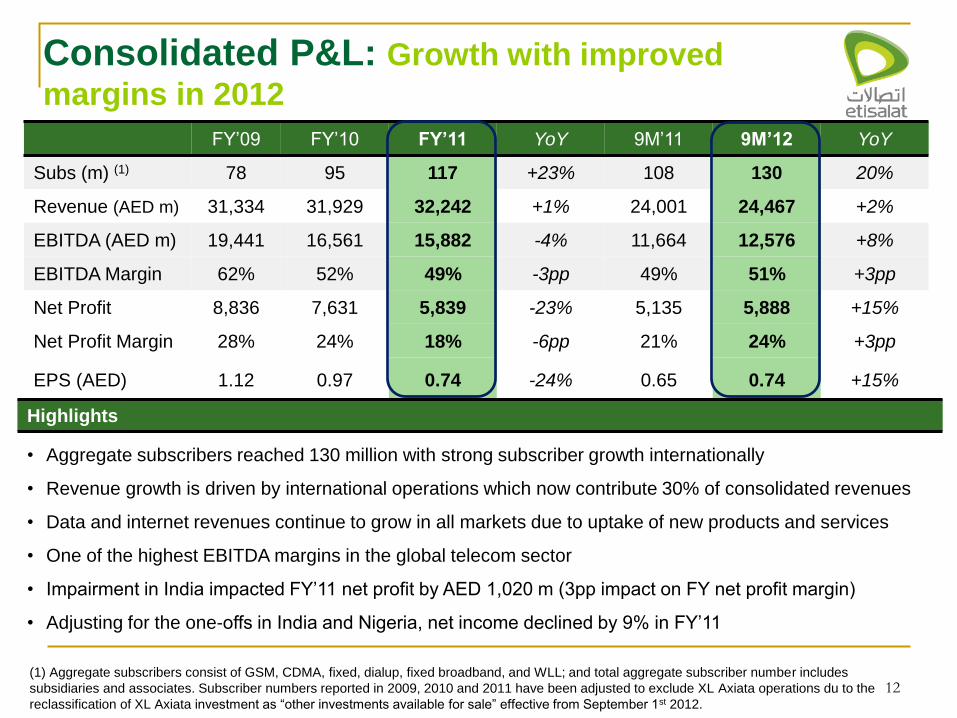
Consolidated P&L: Growth with improved
margins in 2012
FY’09 FY’10 FY’11 YoY 9M’11 9M’12 YoY
Subs (m) (1) 78 95 117 +23% 108 130 20%
Revenue (AED m) 31,334 31,929 32,242 +1% 24,001 24,467 +2%
EBITDA (AED m) 19,441 16,561 15,882 -4% 11,664 12,576 +8%
EBITDA Margin 62% 52% 49% -3pp 49% 51% +3pp
Net Profit 8,836 7,631 5,839 -23% 5,135 5,888 +15%
Net Profit Margin 28% 24% 18% -6pp 21% 24% +3pp
EPS (AED) 1.12 0.97 0.74 -24% 0.65 0.74 +15%
Highlights
• Aggregate subscribers reached 130 million with strong subscriber growth internationally
• Revenue growth is driven by international operations which now contribute 30% of consolidated revenues
• Data and internet revenues continue to grow in all markets due to uptake of new products and services
• One of the highest EBITDA margins in the global telecom sector
• Impairment in India impacted FY’11 net profit by AED 1,020 m (3pp impact on FY net profit margin)
• Adjusting for the one-offs in India and Nigeria, net income declined by 9% in FY’11
(1) Aggregate subscribers consist of GSM, CDMA, fixed, dialup, fixed broadband, and WLL; and total aggregate subscriber number includes
subsidiaries and associates. Subscriber numbers reported in 2009, 2010 and 2011 have been adjusted to exclude XL Axiata operations du to the
reclassification of XL Axiata investment as “other investments available for sale” effective from September 1st 2012.
13
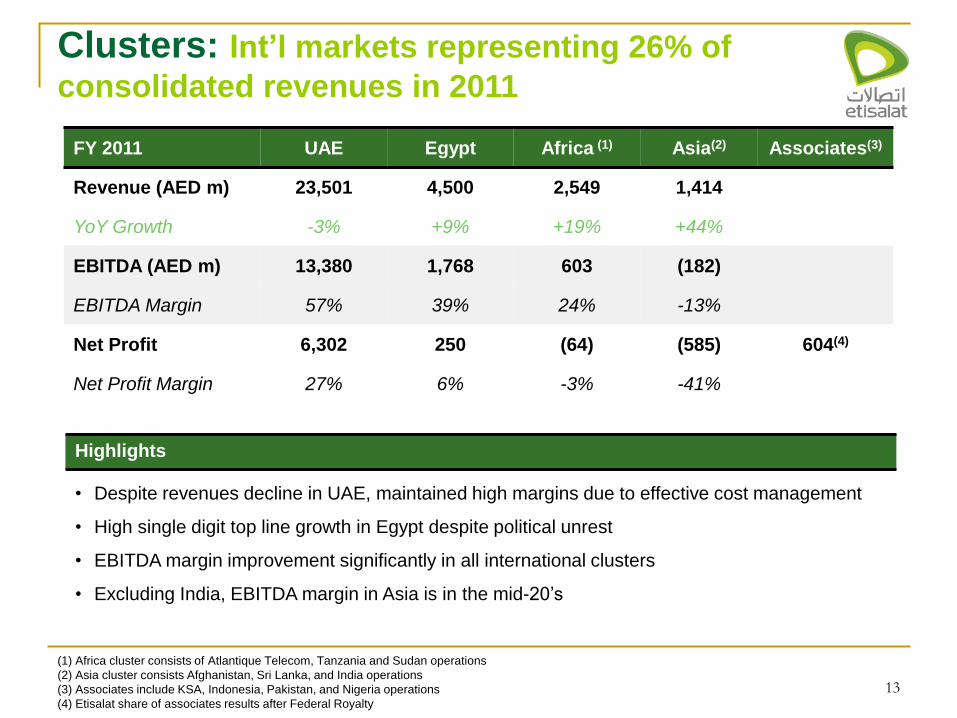
Clusters: Int’l markets representing 26% of
consolidated revenues in 2011
FY 2011 UAE Egypt Africa (1) Asia(2) Associates(3)
Revenue (AED m) 23,501 4,500 2,549 1,414
YoY Growth -3% +9% +19% +44%
EBITDA (AED m) 13,380 1,768 603 (182)
EBITDA Margin 57% 39% 24% -13%
Net Profit 6,302 250 (64) (585) 604(4)
Net Profit Margin 27% 6% -3% -41%
(1) Africa cluster consists of Atlantique Telecom, Tanzania and Sudan operations
(2) Asia cluster consists Afghanistan, Sri Lanka, and India operations
(3) Associates include KSA, Indonesia, Pakistan, and Nigeria operations
(4) Etisalat share of associates results after Federal Royalty
Highlights
• Despite revenues decline in UAE, maintained high margins due to effective cost management
• High single digit top line growth in Egypt despite political unrest
• EBITDA margin improvement significantly in all international clusters
• Excluding India, EBITDA margin in Asia is in the mid-20’s
14
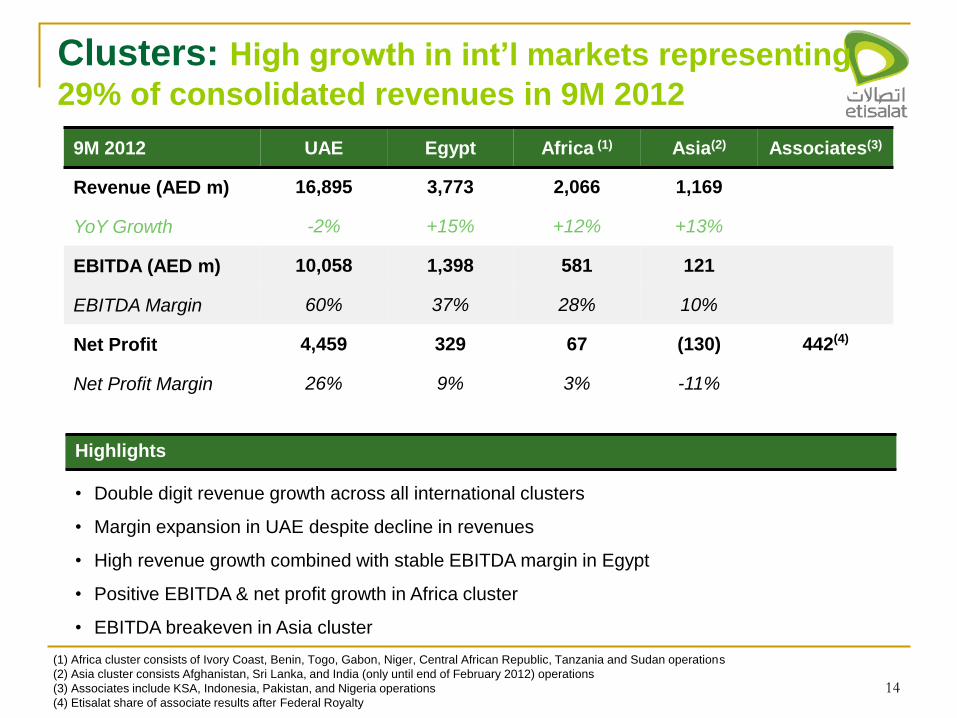
Clusters: High growth in int’l markets representing
29% of consolidated revenues in 9M 2012
9M 2012 UAE Egypt Africa (1) Asia(2) Associates(3)
Revenue (AED m) 16,895 3,773 2,066 1,169
YoY Growth -2% +15% +12% +13%
EBITDA (AED m) 10,058 1,398 581 121
EBITDA Margin 60% 37% 28% 10%
Net Profit 4,459 329 67 (130) 442(4)
Net Profit Margin 26% 9% 3% -11%
Highlights
• Double digit revenue growth across all international clusters
• Margin expansion in UAE despite decline in revenues
• High revenue growth combined with stable EBITDA margin in Egypt
• Positive EBITDA & net profit growth in Africa cluster
• EBITDA breakeven in Asia cluster
(1) Africa cluster consists of Ivory Coast, Benin, Togo, Gabon, Niger, Central African Republic, Tanzania and Sudan operations
(2) Asia cluster consists Afghanistan, Sri Lanka, and India (only until end of February 2012) operations
(3) Associates include KSA, Indonesia, Pakistan, and Nigeria operations
(4) Etisalat share of associate results after Federal Royalty
32.231.931.3
15
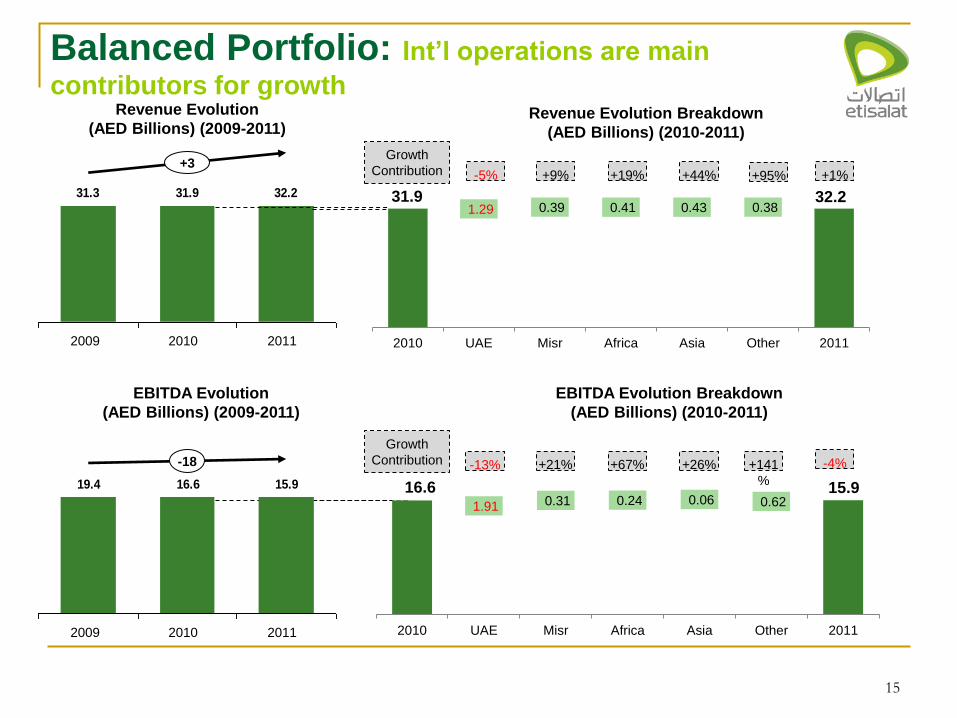
Balanced Portfolio: Int’l operations are main
contributors for growth Revenue Evolution
(AED Billions) (2009-2011) Revenue Evolution Breakdown
(AED Billions) (2010-2011)
EBITDA Evolution
(AED Billions) (2009-2011)
EBITDA Evolution Breakdown
(AED Billions) (2010-2011)
+21% +67% +26% +141
%
Growth
Contribution
-5% +9% +19% +44%
Growth
Contribution +1% +95% +3
2011 2010 2009
15.916.619.4
-18
2011 2010 2009
-13%
1.29 0.39 0.41 0.43 0.38
2010 UAE Misr Africa Asia Other 2011
31.9 32.2
1.91 0.31 0.24 0.06 0.62
2010 UAE Misr Africa Asia Other 2011
16.6 15.9
-4%
Revenue (AED b) and YoY growth (%)
Sources of Revenue growth – 9M’11 vs 9M’12
16
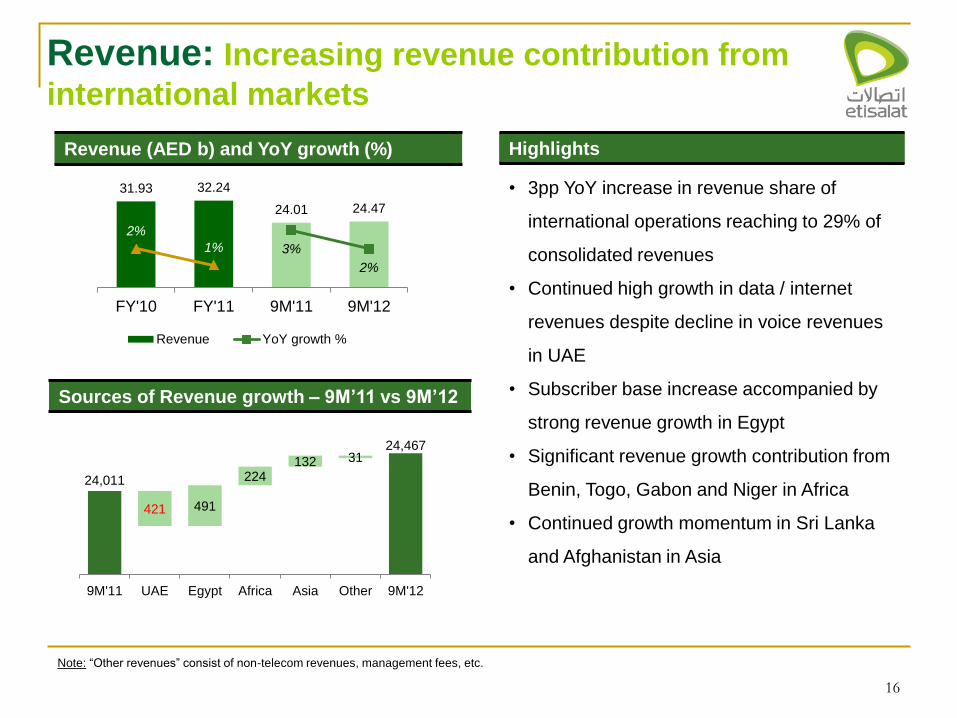
Revenue: Increasing revenue contribution from
international markets
31.93 32.24
24.01 24.47
3%
2%
2%
1%
-0.01
0.01
0.03
0.05
(5.00)
5.00
15.00
25.00
35.00
FY'10 FY'11 9M'11 9M'12
Revenue YoY growth %
24,011
23,590 23,590
24,081 24,305 24,406
24,467
421 491
224 132 31
23,000
23,200
23,400
23,600
23,800
24,000
24,200
24,400
24,600
9M'11 UAE Egypt Africa Asia Other 9M'12
Note: “Other revenues” consist of non-telecom revenues, management fees, etc.
Highlights
• 3pp YoY increase in revenue share of
international operations reaching to 29% of
consolidated revenues
• Continued high growth in data / internet
revenues despite decline in voice revenues
in UAE
• Subscriber base increase accompanied by
strong revenue growth in Egypt
• Significant revenue growth contribution from
Benin, Togo, Gabon and Niger in Africa
• Continued growth momentum in Sri Lanka
and Afghanistan in Asia
17
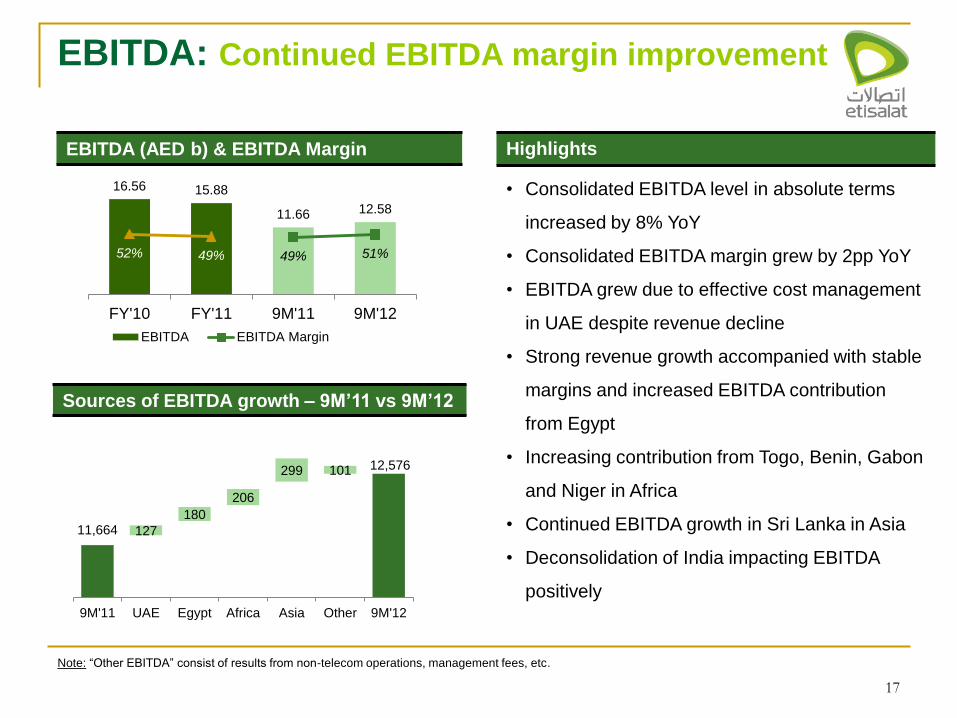
EBITDA (AED b) & EBITDA Margin
Sources of EBITDA growth – 9M’11 vs 9M’12
EBITDA: Continued EBITDA margin improvement
Highlights
• Consolidated EBITDA level in absolute terms
increased by 8% YoY
• Consolidated EBITDA margin grew by 2pp YoY
• EBITDA grew due to effective cost management
in UAE despite revenue decline
• Strong revenue growth accompanied with stable
margins and increased EBITDA contribution
from Egypt
• Increasing contribution from Togo, Benin, Gabon
and Niger in Africa
• Continued EBITDA growth in Sri Lanka in Asia
• Deconsolidation of India impacting EBITDA
positively
16.56 15.88
11.66 12.58
49% 51% 52% 49%
-0.15
0.05
0.25
0.45
0.65
0.85
0.00
5.00
10.00
15.00
FY'10 FY'11 9M'11 9M'12
EBITDA EBITDA Margin
11,664
11,791 11,971
12,177 12,475 12,576
12,576
127
180
206
299 101
11,000
11,200
11,400
11,600
11,800
12,000
12,200
12,400
12,600
12,800
13,000
9M'11 UAE Egypt Africa Asia Other 9M'12
Note: “Other EBITDA” consist of results from non-telecom operations, management fees, etc.
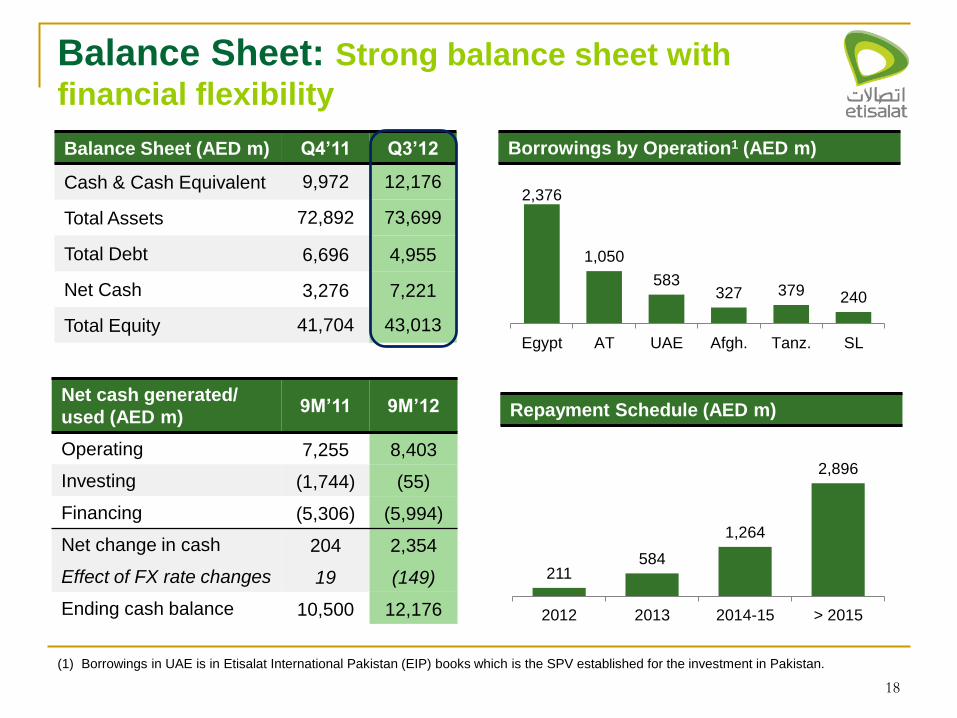
Balance Sheet (AED m) Q4’11 Q3’12
Cash & Cash Equivalent 9,972 12,176
Total Assets 72,892 73,699
Total Debt 6,696 4,955
Net Cash 3,276 7,221
Total Equity 41,704 43,013
18
Balance Sheet: Strong balance sheet with
financial flexibility
Borrowings by Operation1 (AED m)
2,376
1,050
583 327 379 240
0
500
1,000
1,500
2,000
2,500
Egypt AT UAE Afgh. Tanz. SL
Repayment Schedule (AED m)
211 584
1,264
2,896
0
500
1,000
1,500
2,000
2,500
3,000
3,500
2012 2013 2014-15 > 2015
(1) Borrowings in UAE is in Etisalat International Pakistan (EIP) books which is the SPV established for the investment in Pakistan.
Net cash generated/
used (AED m) 9M’11 9M’12
Operating 7,255 8,403
Investing (1,744) (55)
Financing (5,306) (5,994)
Net change in cash 204 2,354
Effect of FX rate changes 19 (149)
Ending cash balance 10,500 12,176
19
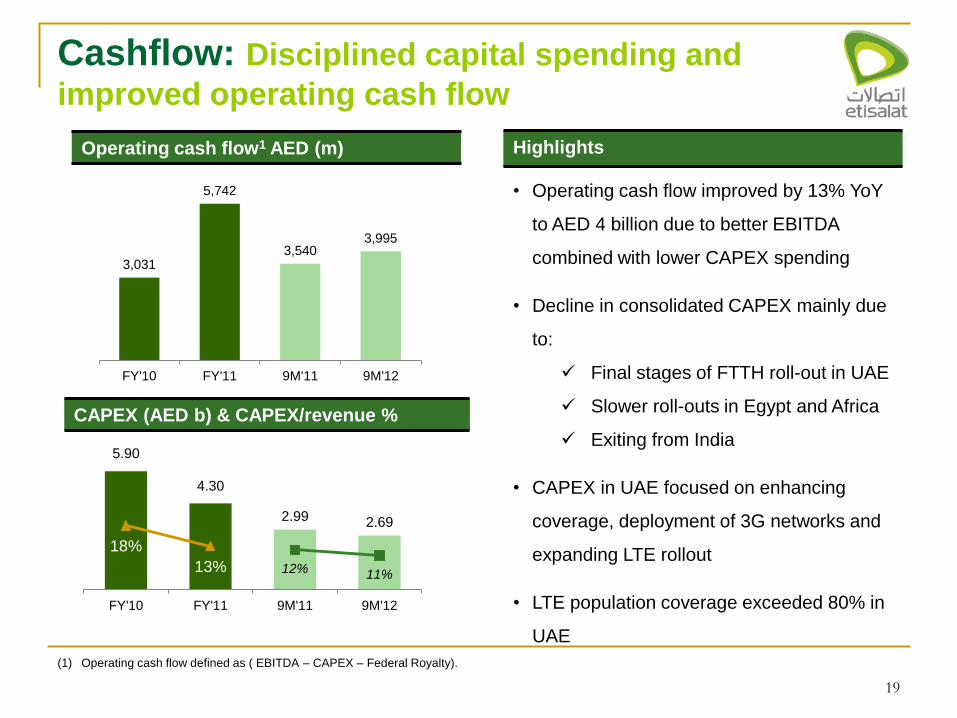
CAPEX (AED b) & CAPEX/revenue %
Cashflow: Disciplined capital spending and
improved operating cash flow
5.90
4.30
2.99 2.69
12% 11%
18%
13%
0
0.05
0.1
0.15
0.2
0.25
0.3
0.35
(0.50)
0.50
1.50
2.50
3.50
4.50
5.50
6.50
FY'10 FY'11 9M'11 9M'12
Highlights
• Operating cash flow improved by 13% YoY
to AED 4 billion due to better EBITDA
combined with lower CAPEX spending
• Decline in consolidated CAPEX mainly due
to:
Final stages of FTTH roll-out in UAE
Slower roll-outs in Egypt and Africa
Exiting from India
• CAPEX in UAE focused on enhancing
coverage, deployment of 3G networks and
expanding LTE rollout
• LTE population coverage exceeded 80% in
UAE
(1) Operating cash flow defined as ( EBITDA – CAPEX – Federal Royalty).
Operating cash flow1 AED (m)
3,031
5,742
3,540 3,995
FY'10 FY'11 9M'11 9M'12
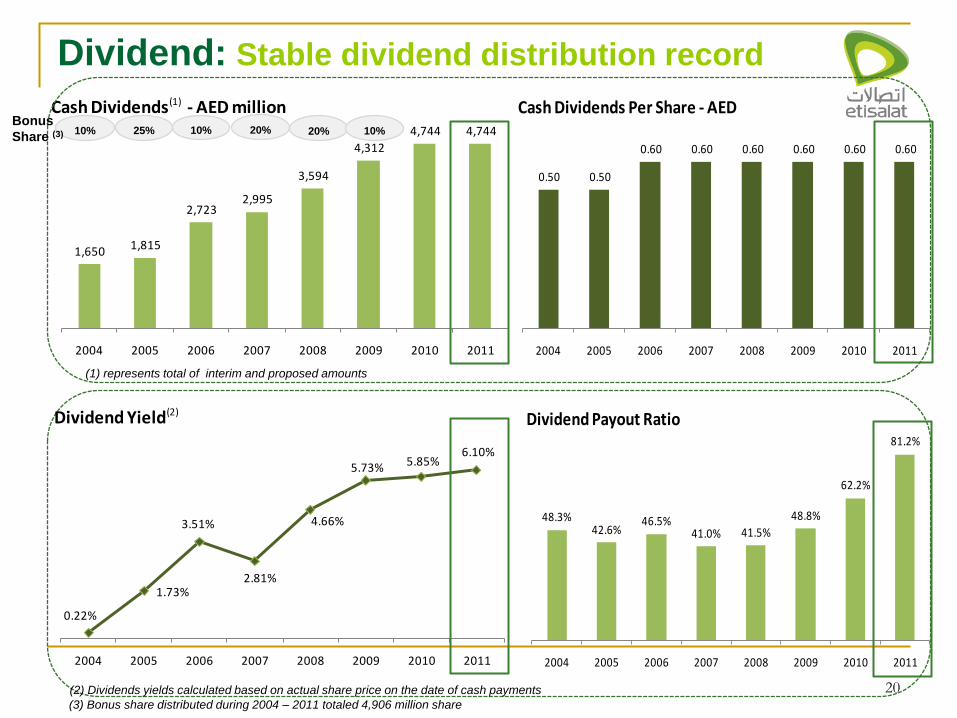
1,650 1,815
2,723 2,995
3,594
4,312
4,744 4,744
2004 2005 2006 2007 2008 2009 2010 2011
Cash Dividends(1) - AED million
20
Dividend: Stable dividend distribution record
(1) represents total of interim and proposed amounts
(2) Dividends yields calculated based on actual share price on the date of cash payments
0.50 0.50
0.60 0.60 0.60 0.60 0.60 0.60
2004 2005 2006 2007 2008 2009 2010 2011
Cash Dividends Per Share - AED
0.22%
1.73%
3.51%
2.81%
4.66%
5.73% 5.85%6.10%
2004 2005 2006 2007 2008 2009 2010 2011
Dividend Yield(2)
48.3%42.6%
46.5%41.0% 41.5%
48.8%
62.2%
81.2%
2004 2005 2006 2007 2008 2009 2010 2011
Dividend Payout Ratio
10% Bonus
Share (3) 25% 10% 20% 20% 10%
(3) Bonus share distributed during 2004 – 2011 totaled 4,906 million share
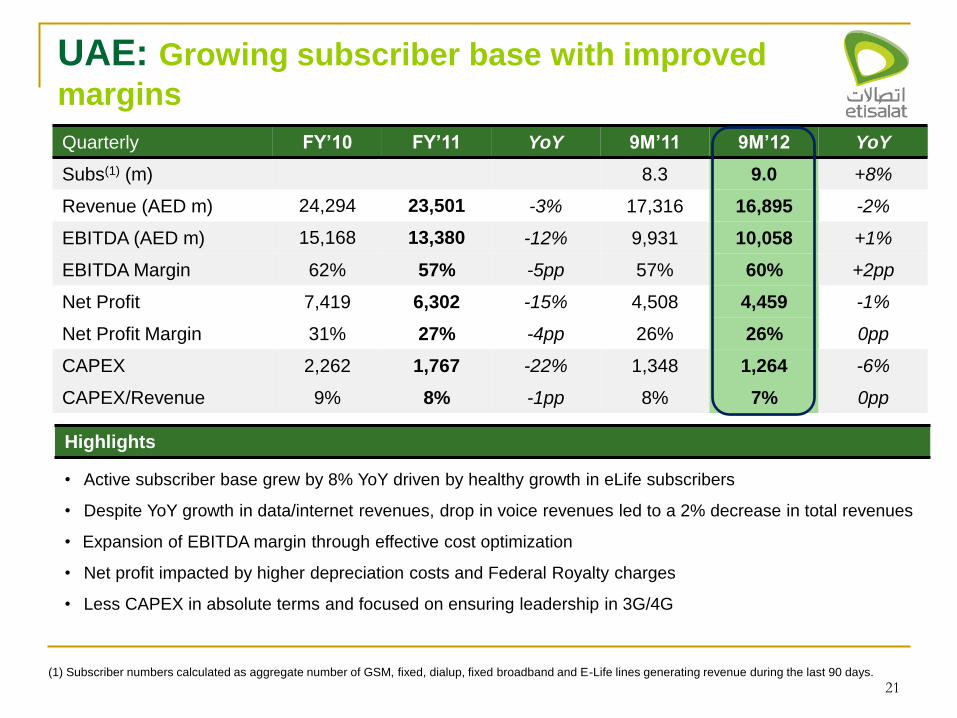
21
UAE: Growing subscriber base with improved
margins
Quarterly FY’10 FY’11 YoY 9M’11 9M’12 YoY
Subs(1) (m) 8.3 9.0 +8%
Revenue (AED m) 24,294 23,501 -3% 17,316 16,895 -2%
EBITDA (AED m) 15,168 13,380 -12% 9,931 10,058 +1%
EBITDA Margin 62% 57% -5pp 57% 60% +2pp
Net Profit 7,419 6,302 -15% 4,508 4,459 -1%
Net Profit Margin 31% 27% -4pp 26% 26% 0pp
CAPEX 2,262 1,767 -22% 1,348 1,264 -6%
CAPEX/Revenue 9% 8% -1pp 8% 7% 0pp
Highlights
• Active subscriber base grew by 8% YoY driven by healthy growth in eLife subscribers
• Despite YoY growth in data/internet revenues, drop in voice revenues led to a 2% decrease in total revenues
• Expansion of EBITDA margin through effective cost optimization
• Net profit impacted by higher depreciation costs and Federal Royalty charges
• Less CAPEX in absolute terms and focused on ensuring leadership in 3G/4G
(1) Subscriber numbers calculated as aggregate number of GSM, fixed, dialup, fixed broadband and E-Life lines generating revenue during the last 90 days.
22
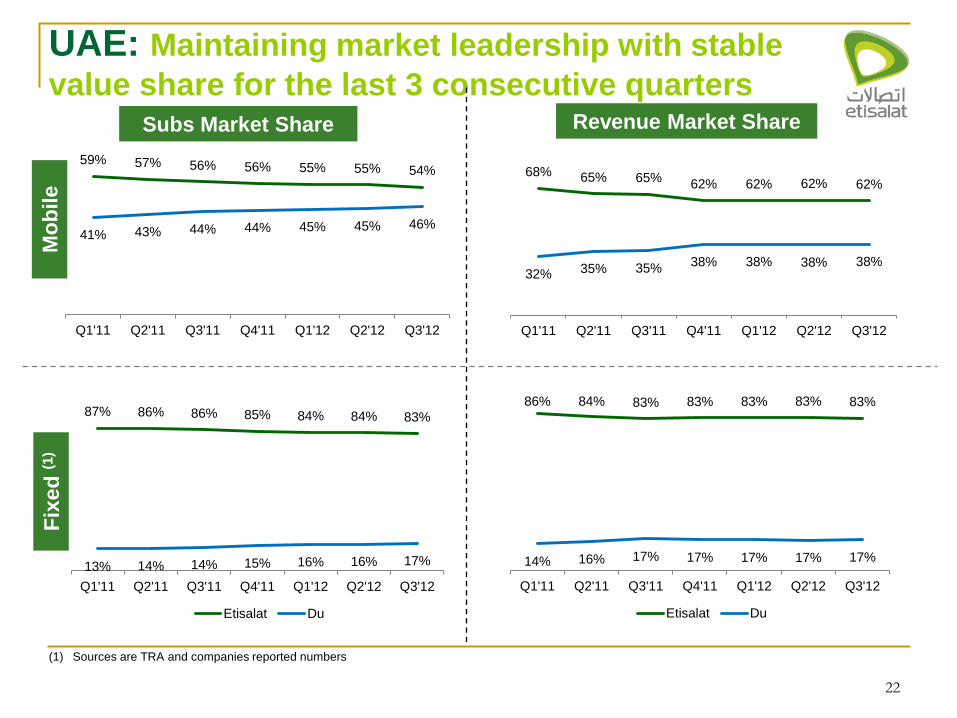
UAE: Maintaining market leadership with stable
value share for the last 3 consecutive quarters
(1) Sources are TRA and companies reported numbers
Mo
bile
Subs Market Share
Fix
ed
(1)
Revenue Market Share
59% 57% 56% 56% 55% 55% 54%
41% 43% 44% 44% 45% 45% 46%
Q1'11 Q2'11 Q3'11 Q4'11 Q1'12 Q2'12 Q3'12
87% 86% 86% 85% 84% 84% 83%
13% 14% 14% 15% 16% 16% 17%
Q1'11 Q2'11 Q3'11 Q4'11 Q1'12 Q2'12 Q3'12
Etisalat Du
68% 65% 65% 62% 62% 62% 62%
32% 35% 35% 38% 38% 38% 38%
Q1'11 Q2'11 Q3'11 Q4'11 Q1'12 Q2'12 Q3'12
86% 84% 83% 83% 83% 83% 83%
14% 16% 17% 17% 17% 17% 17%
Q1'11 Q2'11 Q3'11 Q4'11 Q1'12 Q2'12 Q3'12
Etisalat Du
23
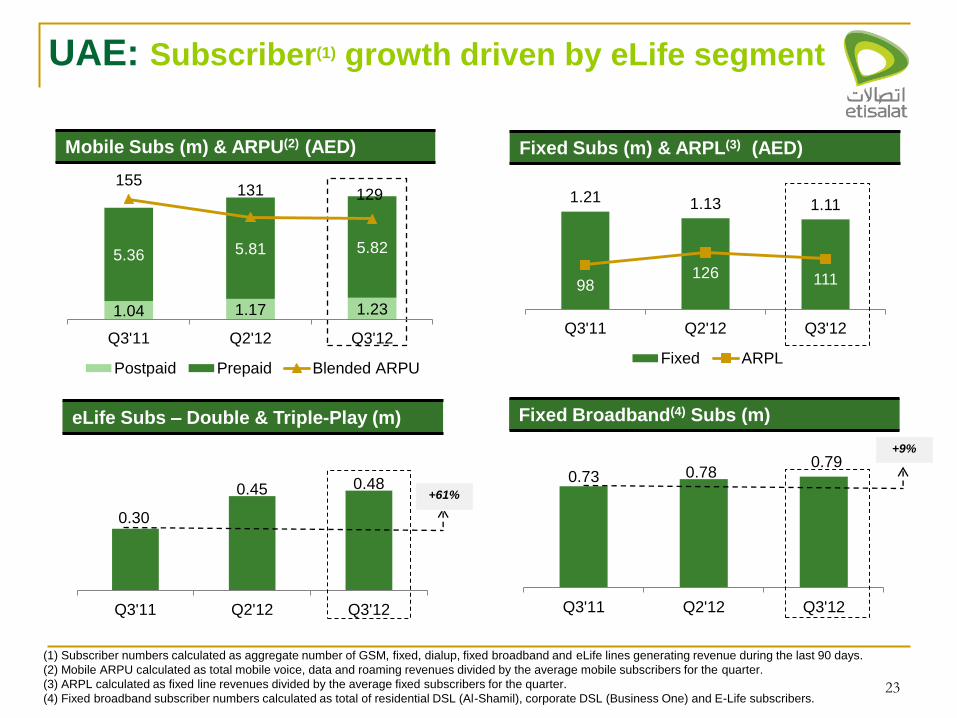
UAE: Subscriber(1) growth driven by eLife segment
(1) Subscriber numbers calculated as aggregate number of GSM, fixed, dialup, fixed broadband and eLife lines generating revenue during the last 90 days.
(2) Mobile ARPU calculated as total mobile voice, data and roaming revenues divided by the average mobile subscribers for the quarter.
(3) ARPL calculated as fixed line revenues divided by the average fixed subscribers for the quarter.
(4) Fixed broadband subscriber numbers calculated as total of residential DSL (Al-Shamil), corporate DSL (Business One) and E-Life subscribers.
Mobile Subs (m) & ARPU(2) (AED)
1.04 1.17 1.23
5.36 5.81 5.82
155 131 129
0
20
40
60
80
100
120
140
160
180
0.00
1.00
2.00
3.00
4.00
5.00
6.00
7.00
8.00
Q3'11 Q2'12 Q3'12
Postpaid Prepaid Blended ARPU
Fixed Subs (m) & ARPL(3) (AED)
1.21 1.13 1.11
98 126 111
0
50
100
150
200
250
0.00
0.20
0.40
0.60
0.80
1.00
1.20
1.40
Q3'11 Q2'12 Q3'12
Fixed ARPL
Fixed Broadband(4) Subs (m)
0.73 0.78 0.79
0.00
0.10
0.20
0.30
0.40
0.50
0.60
0.70
0.80
0.90
Q3'11 Q2'12 Q3'12
eLife Subs – Double & Triple-Play (m)
0.30
0.45 0.48
0.00
0.10
0.20
0.30
0.40
0.50
0.60
Q3'11 Q2'12 Q3'12
+61%
+9%
24
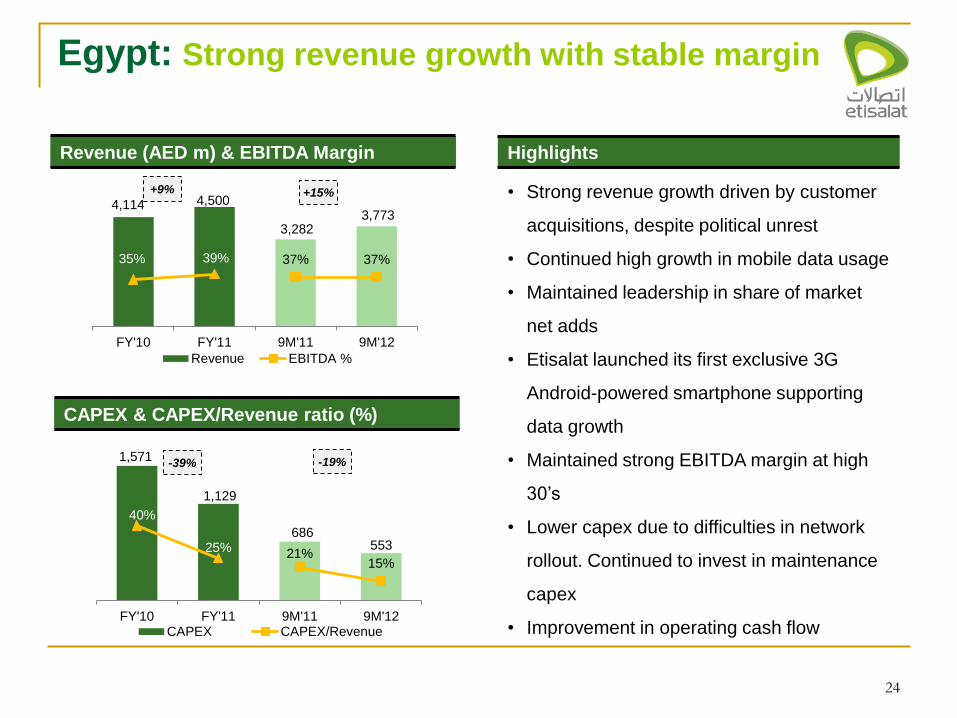
Egypt: Strong revenue growth with stable margin
Revenue (AED m) & EBITDA Margin
4,114 4,500
3,282 3,773
37% 37% 35% 39%
0
0.1
0.2
0.3
0.4
0.5
0.6
0.7
0.8
0.9
1
0
500
1,000
1,500
2,000
2,500
3,000
3,500
4,000
4,500
5,000
FY'10 FY'11 9M'11 9M'12
Revenue EBITDA %
+9% +15%
CAPEX & CAPEX/Revenue ratio (%)
1,571
1,129
686 553
21% 15%
40%
25%
0
0.1
0.2
0.3
0.4
0.5
0.6
0.7
(150)
50
250
450
650
850
1,050
1,250
1,450
1,650
FY'10 FY'11 9M'11 9M'12CAPEX CAPEX/Revenue
-39% -19%
Highlights
• Strong revenue growth driven by customer
acquisitions, despite political unrest
• Continued high growth in mobile data usage
• Maintained leadership in share of market
net adds
• Etisalat launched its first exclusive 3G
Android-powered smartphone supporting
data growth
• Maintained strong EBITDA margin at high
30’s
• Lower capex due to difficulties in network
rollout. Continued to invest in maintenance
capex
• Improvement in operating cash flow
25
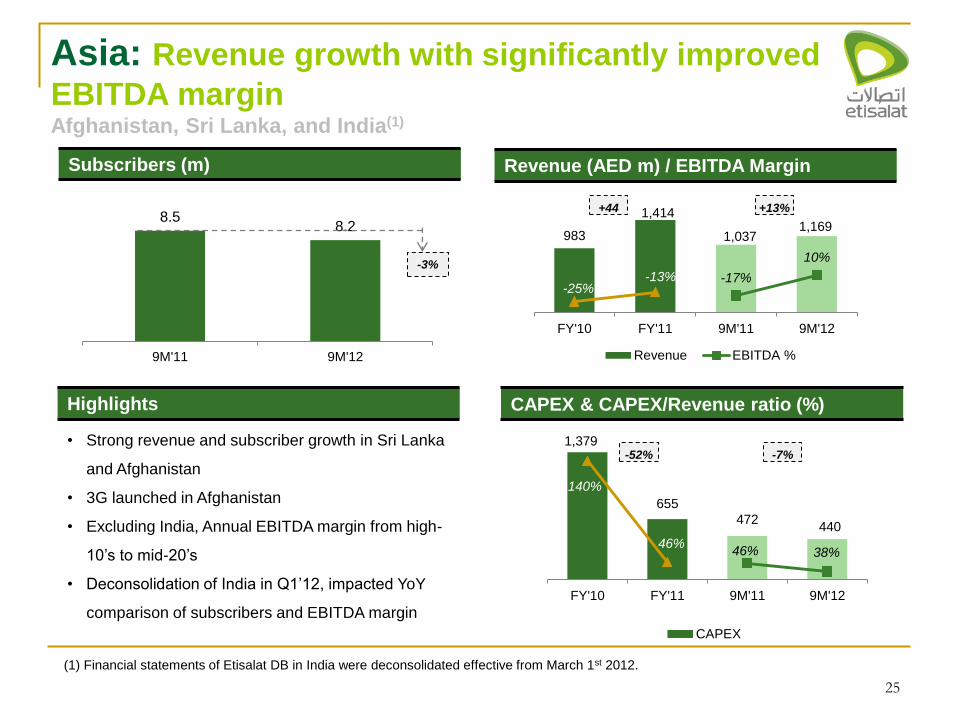
Asia: Revenue growth with significantly improved
EBITDA margin Afghanistan, Sri Lanka, and India(1)
Highlights
• Strong revenue and subscriber growth in Sri Lanka
and Afghanistan
• 3G launched in Afghanistan
• Excluding India, Annual EBITDA margin from high-
10’s to mid-20’s
• Deconsolidation of India in Q1’12, impacted YoY
comparison of subscribers and EBITDA margin
Revenue (AED m) / EBITDA Margin
983
1,414
1,037 1,169
-17%
10%
-25% -13%
-0.4
-0.2
0
0.2
0.4
0.6
0.8
1
0
200
400
600
800
1,000
1,200
1,400
1,600
FY'10 FY'11 9M'11 9M'12
Revenue EBITDA %
+44 +13%
CAPEX & CAPEX/Revenue ratio (%)
Subscribers (m)
1,379
655
472 440
46% 38%
140%
46%
0.3
0.5
0.7
0.9
1.1
1.3
1.5
0
200
400
600
800
1,000
1,200
1,400
FY'10 FY'11 9M'11 9M'12
CAPEX
-52% -7%
8.5 8.2
9M'11 9M'12
-3%
(1) Financial statements of Etisalat DB in India were deconsolidated effective from March 1st 2012.
26
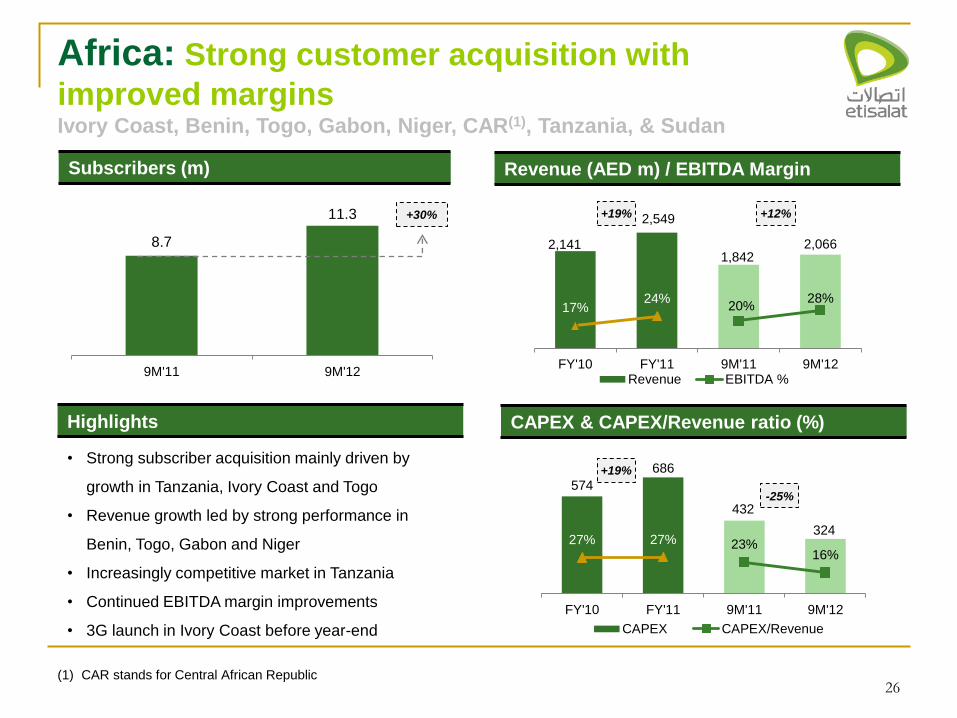
Highlights
• Strong subscriber acquisition mainly driven by
growth in Tanzania, Ivory Coast and Togo
• Revenue growth led by strong performance in
Benin, Togo, Gabon and Niger
• Increasingly competitive market in Tanzania
• Continued EBITDA margin improvements
• 3G launch in Ivory Coast before year-end
Africa: Strong customer acquisition with
improved margins Ivory Coast, Benin, Togo, Gabon, Niger, CAR(1), Tanzania, & Sudan
Revenue (AED m) / EBITDA Margin
2,141
2,549
1,842 2,066
20% 28%
17% 24%
0
0.1
0.2
0.3
0.4
0.5
0.6
0.7
0.8
0.9
1
0
500
1,000
1,500
2,000
2,500
3,000
FY'10 FY'11 9M'11 9M'12Revenue EBITDA %
+19% +12%
CAPEX & CAPEX/Revenue ratio (%)
Subscribers (m)
8.7
11.3
0.0
2.0
4.0
6.0
8.0
10.0
12.0
9M'11 9M'12
+30%
574
686
432
324 23%
16% 27% 27%
0
0.1
0.2
0.3
0.4
0.5
0.6
0.7
0.8
0.9
1
0
100
200
300
400
500
600
700
800
FY'10 FY'11 9M'11 9M'12
CAPEX CAPEX/Revenue
+19%
-25%
(1) CAR stands for Central African Republic
Subscribers (m)
9.6
14.6
0.0
2.0
4.0
6.0
8.0
10.0
12.0
14.0
16.0
9M'11 9M'12
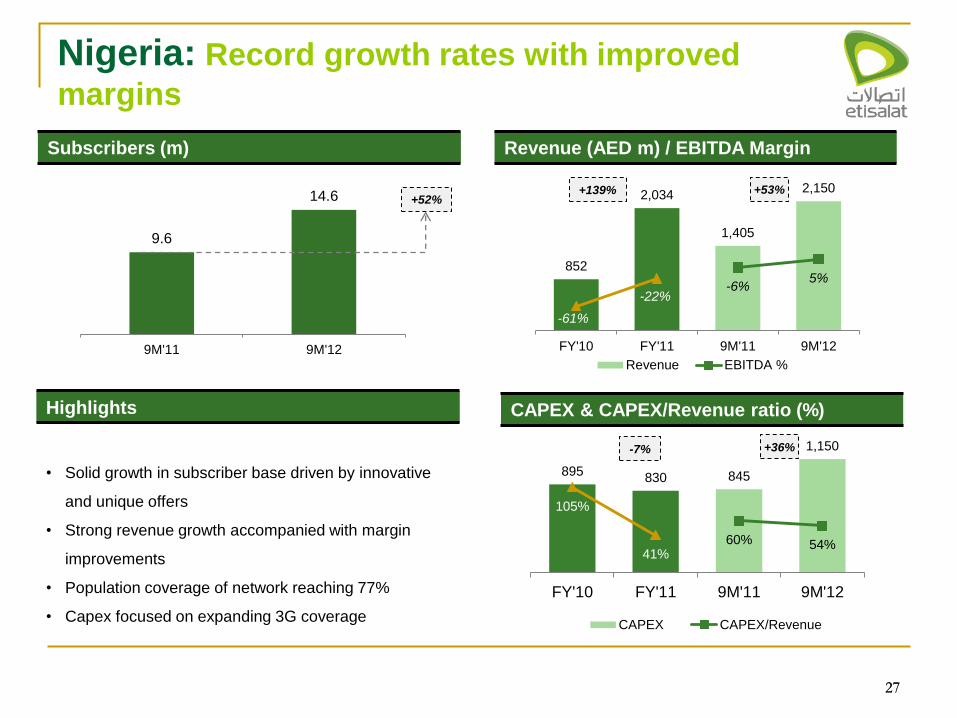
27 27
Nigeria: Record growth rates with improved
margins
Highlights
• Solid growth in subscriber base driven by innovative
and unique offers
• Strong revenue growth accompanied with margin
improvements
• Population coverage of network reaching 77%
• Capex focused on expanding 3G coverage
+52%
Revenue (AED m) / EBITDA Margin
852
2,034
1,405
2,150
-6% 5%
-61%
-22%
(1)
(1)
(1)
(0)
(0)
0
0
0
1
1
0
500
1,000
1,500
2,000
FY'10 FY'11 9M'11 9M'12
Revenue EBITDA %
CAPEX & CAPEX/Revenue ratio (%)
+53%
895 830 845
1,150
60% 54%
105%
41%
(0)
0
0
1
1
1
1
1
2
0
200
400
600
800
1,000
1,200
FY'10 FY'11 9M'11 9M'12
CAPEX CAPEX/Revenue
+36%
+139%
-7%
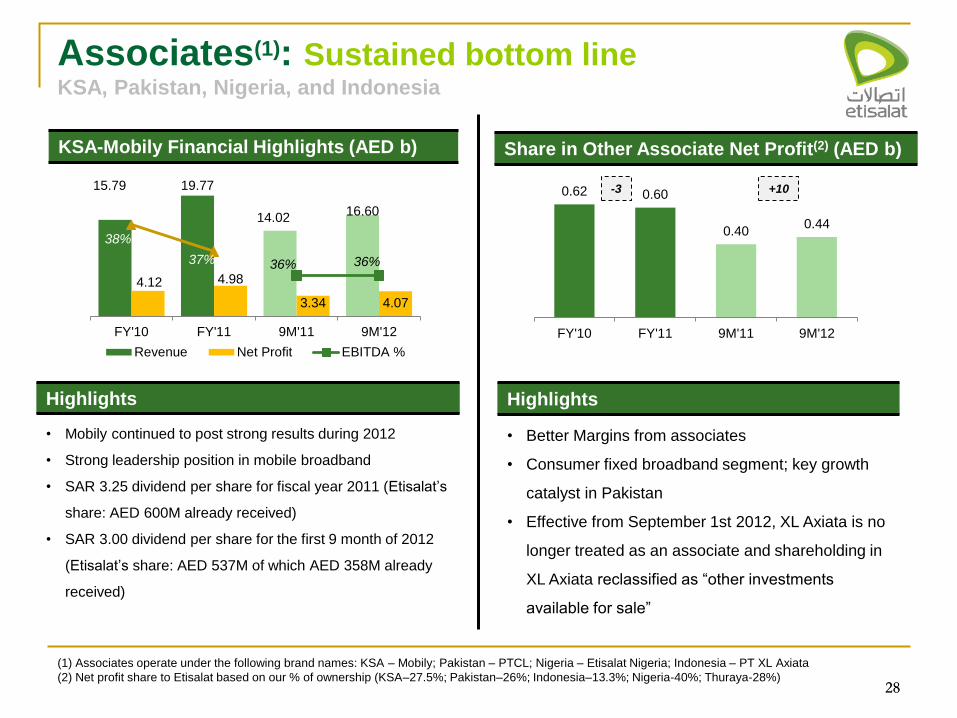
28
Share in Other Associate Net Profit(2) (AED b) KSA-Mobily Financial Highlights (AED b)
28
Associates(1): Sustained bottom line KSA, Pakistan, Nigeria, and Indonesia
(1) Associates operate under the following brand names: KSA – Mobily; Pakistan – PTCL; Nigeria – Etisalat Nigeria; Indonesia – PT XL Axiata
(2) Net profit share to Etisalat based on our % of ownership (KSA–27.5%; Pakistan–26%; Indonesia–13.3%; Nigeria-40%; Thuraya-28%)
Highlights
• Mobily continued to post strong results during 2012
• Strong leadership position in mobile broadband
• SAR 3.25 dividend per share for fiscal year 2011 (Etisalat’s
share: AED 600M already received)
• SAR 3.00 dividend per share for the first 9 month of 2012
(Etisalat’s share: AED 537M of which AED 358M already
received)
Highlights
• Better Margins from associates
• Consumer fixed broadband segment; key growth
catalyst in Pakistan
• Effective from September 1st 2012, XL Axiata is no
longer treated as an associate and shareholding in
XL Axiata reclassified as “other investments
available for sale”
15.79 19.77
14.02 16.60
4.12 4.98
3.34 4.07
36% 36%
38%
37%
0.34
0.35
0.36
0.37
0.38
0.39
0.4
0.002.004.006.008.00
10.0012.0014.0016.0018.0020.00
FY'10 FY'11 9M'11 9M'12
Revenue Net Profit EBITDA %
0.62 0.60
0.40 0.44
0.00
0.10
0.20
0.30
0.40
0.50
0.60
0.70
FY'10 FY'11 9M'11 9M'12
-3 +10

29
Etisalat Investor Relations
Email: [email protected]
Website: www.etisalat.com/html/ir
ADX ticker: Etisalat
ADX website: www.adx.ae