Embed Size (px)
Citation preview

Evaluation and
the Program
Life Cycle Linda Blanton
Michael A. Harnar
Prashant Rajvaidya
I
II
III IV
V

Agenda
Introductions and Setting the Stage
Goals
5-Phase Approach
Dashboards
Discussion

Setting The Stage

Goals
Participants will understand the concept
of a program life cycle.
Participants will learn a set of evaluation
questions that are appropriate for each
program life cycle stage.
Participants will leave with a set of tools to
help guide developing an evaluation
plan around their program’s life cycle.

Challenge 1
Local communities & administrators
want information to demonstrate
impact and to help support
continuous program improvements
Challenge 3
Public & private community groups
use data to illustrate local issues of
access, quality, and results
Challenge 2
Policy makers want evidence that
early childhood services are a valid
public investment
Challenge 4
Researchers are interested in
answering a wide range of questions
that can be addressed only through
longitudinal data systems
GOAL
OUR PATH
The Challenge
Evaluation: Support various
constituencies’ information needs.
- Formative
- Summative

Program Life Cycle
I
II
III IV
V

Phases
I. Design – Pre-launch
II. Early Implementation – First days
III. Ongoing Development – Stabilized
IV. Advanced Implementation – Testing
V. Mature Program – Replicate & Disseminate
I
II
III IV
V

Design
I
Early Implement
ation
Ongoing Developm
ent
Advanced Implement
ation
Mature Program

I. Design
Timeline
Before implementation
New elements added
Periodic review
Question
What do I want to do?
Activities
Theory explication
Needs assessment
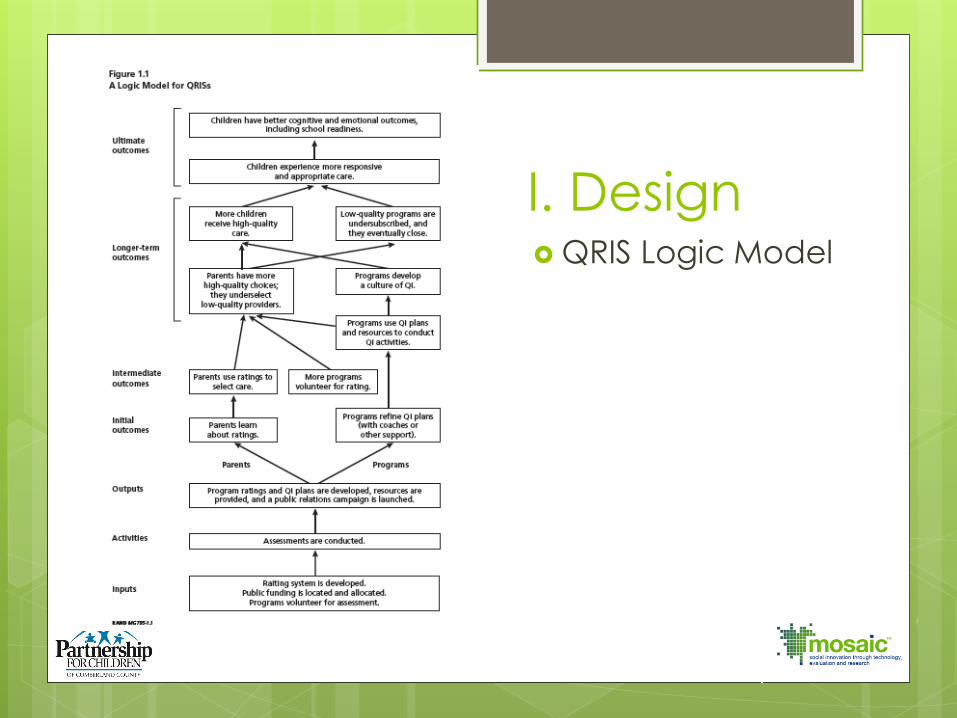
I. Design QRIS Logic Model

I. Design
Needs Assessment
Performance Need (survey, research, etc.)
What result am I looking for?
Program Need/Selection/Design
What is the best solution to achieve that
result?

I. Design
Technology
Solutions
Thought
modeling (e.g.,
www.mindomo.
com)
Online/electroni
c surveys

Early Implementation
Design
II
Ongoing Developm
ent
Advanced Implement
ation
Mature Program

II. Early Implementation
Timeline
Pilot Phase
Initial stages of the delivery
Question(s)
What am I doing? Is it what I said I would do?
Develop evidence of program functioning
Test program theory of change
Test program delivery model
Build the case for causal efficacy

II. Early Implementation
Activities
Implementation description
Management & accountability of efforts
Activity tracking
Program description
Measurement validity
Technology Solution(s)
Data collection system development
High export/reporting activity

II. Early Implementation
Examples
QRIS
participation rates; surveys with users
Providers PD
knowledge gains; reach
Home Visitation
coaching events;
paperwork completion;
data entry

II. Early Implementation
Technological Solutions
One-Touch reports
Preliminary Dashboards

6
3
12
3
0
2
4
6
8
10
12
14
16
Evidence Based Evidence Inform
24 Smart Start Grantees
Emerging
Promising
Established
Well Established
9
7
6
3
0 2 4 6 8 10
EC&E Subsidy
EC&E Quality
Health/Family
System
Areas of Priority
Smart Start Grantee Dashboard

Smart Start Allocation Dashboard
$3,300,779
$1,786,900
$619,543 $741,812
$0
$500,000
$1,000,000
$1,500,000
$2,000,000
$2,500,000
$3,000,000
$3,500,000
Smart Start Allocation
EC&E
Subsidy
50% EC&E
Quality
28%
Health/
Family
10%
System
12%
Smart Start Allocation

Ongoing Development
Design
Early Implement
ation
III Advanced Implement
ation
Mature Program

III. Ongoing Development
Timeline
Stable, normalized program
Question(s)
Am I doing it well?
Monitor program quality & fidelity
Report program activity
Am I getting the results I expect?
III. Ongoing Development
Evaluation activities
Process/Fidelity studies
Outcome studies
Technology Solution(s)
Real-time dashboards
Cross-site reports
Data aggregating and filtering
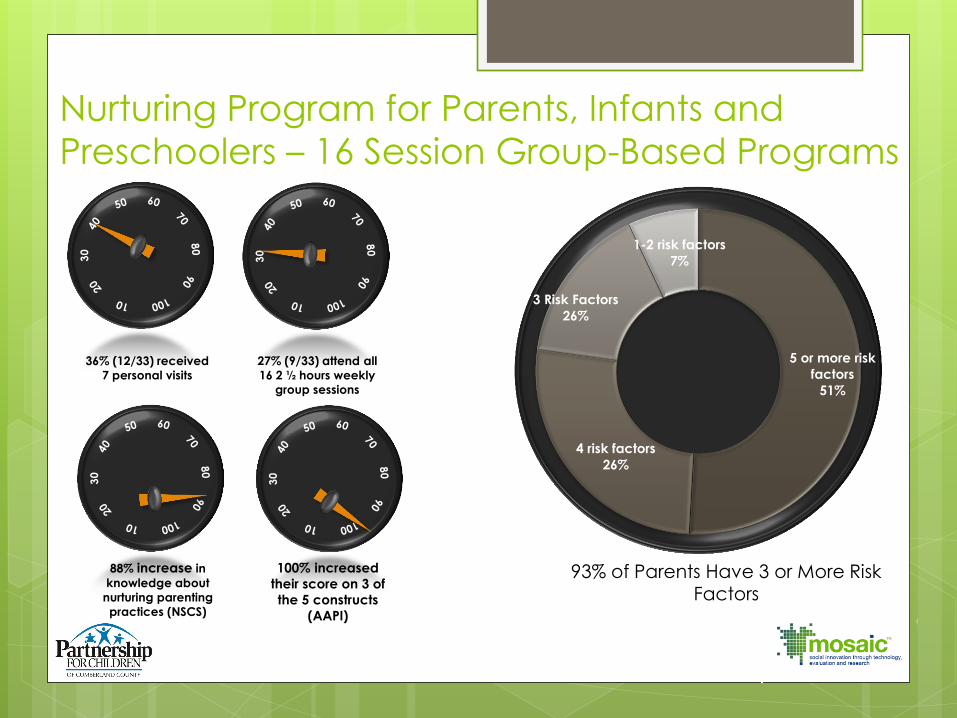
Nurturing Program for Parents, Infants and
Preschoolers – 16 Session Group-Based Programs
5 or more risk
factors
51%
4 risk factors
26%
3 Risk Factors
26%
1-2 risk factors
7%
93% of Parents Have 3 or More Risk Factors
36% (12/33) received 7 personal visits
27% (9/33) attend all 16 2 ½ hours weekly
group sessions
88% increase in
knowledge about
nurturing parenting
practices (NSCS)
100% increased
their score on 3 of
the 5 constructs
(AAPI)

2011-12 Quality Enhancement &
Maintenance Grant [2-Year Program]
63% of QEG
participants up for
re-assessment in the
next 2 years
100% of QEG participants
in the QEG program were
re-assessed within the 2
year term
57% of QEG
participants with 3-
stars or lower
increased their star
rating
80% of QEG participants 4-
stars or higher, at a minimum,
maintain their star rating
Temp
Ctr
2-Star
Ctr
3-Star
Ctr
4-Star
Ctr
5-Star
Ctr
3-Star
FCCH
4-Star
FCCH
H 1
M 1 1
L 2 8 4 1 1 1
0
1
2
3
4
5
6
7
8
9

Advanced
Implementation
Design
Early Implement
ation
Ongoing Developm
ent IV
Mature Program

IV. Advanced Implementation
Timeline
Stable program is “functioning” and
outcomes are seen
Ideal program is clear
Theory “works”
Question(s)
Am I doing it efficiently (better than other
programs)?
Outcome efficiency
Outcome-based accountability

IV. Advanced Implementation
Activities
Outcomes study
Summative reporting
Impact study
Cost analyses
Technology Solution(s)
Regular reports
Data aggregation
Performance-based reports
Real-time dashboards

IV. Advanced Implementation
Examples
Six-county study of Smart Start on
kindergarten entry
Data exports for evaluators

A RED LIGHT indicates STOP AND REVIEW;
planned activities are not producing the desired
outcomes.
YELLOW LIGHT indicates PROCEED WITH CAUTION;
slow down and evaluate; planned activities are
not producing consistent desired outcomes.
A GREEN LIGHT indicates GO: planned
activities are producing the desired outcomes.
Performance Based Incentive
System (PBIS) Dashboard

Performance Based Incentive
System (PBIS) Dashboard PBIS Criteria
*Denotes selected criteria
Minimum Std
High
Performing
Std (HP)
State Avg
(SA)
Cumberland County
3 Year Trend (T) % From High
Performing
Standard 11-12 10-11 09-10
^PLA40: Child Placement – Average star rating:
Average star rating for children enrolled in care
>=3.25 or >=3.25 and 4.08 3.84 3.61 3.36 AT GOAL
^PLA40: Child Placement – Average star rating:
%
of children in 4 & 5 star care
>=50% >=50% 70% 64% 56% 41%
^PLA 50: Subsidized placement – Average star
rating: Average star rating for children enrolled in
care
>=3.25 or >=3.25 and 4.19 4.13 3.87 3.64 AT GOAL
^PLA 50: Subsidized placement – Average star
rating: % of children in 4 & 5 star care
>=60% >=60% 81% 82% 70% 57%
*PLA 60: Subsidy/Special Needs - Average star
rating: Average star rating of subsidized child
placements for children with special/
developmental needs
>=4.00 or >=4.00 and 4.40 4.39 4.07 4.24 AT GOAL
*PLA 60: Subsidy/Special Needs - Average star
rating % of special needs children in low income
families in 4 & 5 star facilities
>=75% >=75% 94% 94% 85% 86%
PLA70: Accredited Programs
% of children enrolled in nationally accredited child
care programs
>=12% >=20% 7% 22% 14% 15% AT GOAL
hit the
ideal
target
not on target,
but close
under-
target
Children Enrolled In Child Care Facilities
with A 4- Or 5-star Rating

Performance Based Incentive
System (PBIS) Dashboard
PBIS Criteria
*Denotes selected criteria
Minimum Std
High
Performing
Std (HP)
State Avg
(SA)
Cumberland County
3 Year Trend (T) % From High
Performing
Standard 11-12 10-11 09-10
^EDU10: Lead Teacher: % children enrolled in 1-5
star rated child care centers that have at least 5
lead teacher education points
>=60% >=60%
and
68% 67% 63% 51% 8%
^EDU10: Lead Teacher: %
of children enrolled in 1-5 star rated child care centers that have 7 lead teacher education points
>=35% 36% 32% 18% 17%
EDU 20: Administrator: %
of children enrolled in 1-5 star rated child care centers that have at least 5 administrator education points
>=60% >=60%
and
77% 73% 66% 57% AT GOAL
EDU 20: Administrator: %
of children enrolled in 1-5 star rated child care centers that have at least 7 administrator education points
>=35% 53% 46% 38% 28%
EDU 30: Family Child Care Provider: % of children
enrolled in 1-5 star rated child care homes that
have at least 5 family child care provider education
points
>=60% >=60%
and
46% 56% 53% 47% 34%
EDU 30: Family Child Care Provider: %
of children enrolled in 1-5 star rated child care homes that have at least 7 family child care provider education points
>=35% 24% 23% 21% 18%
hit the ideal
target
not on target, but close
under-target Children Enrolled In Child Care Facilities
with 7 Education Points

Mature Program
Design
Early Implement
ation
Ongoing Developm
ent
Advanced Implement
ation
V

V. Mature Program
Timeline
Exemplary, tested program is ready for
adoption by others
Field experts and best practices emerge
Question(s)
How can what I am doing help others?
Replication/Dissemination
Systems Change

V. Mature Program
Activities
Expert consultations to other programs
Data sharing
Publications/Presentations
Technology Solution
Data exports
Data system linkages to other data systems

Program Life Cycle
I
II
III IV
V

Linda Blanton
Michael A. Harnar mharnar@mosaic-
network.com
Prashant Rajvaidya
Evaluation and
the Program Life
Cycle Design
Early Implement
ation
Ongoing Developm
ent
Advanced Implement
ation
Mature Program


![Golden Code PBIS Program Golden Ring Middle School Syretta James [PBIS Coach] Gina Peller [PBIS Team Member] Linda Salihi [PBIS Team Leader] Kevin Roberts](https://img.pdfslide.net/doc/110x75/56649f305503460f94c4b850/golden-code-pbis-program-golden-ring-middle-school-syretta-james-pbis-coach.jpg)