Embed Size (px)
Citation preview
Export Growth, Capacity Utilization and Productivity Growth: Evidence from Canadian Manufacturing Plants
by John R. Baldwin, Wulong Gu and Beiling Yan
Economic Analysis Division18-F, R.H. Coats Building, 100 Tunney’s Pasture DrivewayTelephone: 1-800-263-1136
Catalogue no. 11F0027M — No. 075
ISSN 1703-0404
ISBN 978-1-100-19822-4
Research Paper
Economic Analysis (EA) Research Paper Series
Export Growth, Capacity Utilization and Productivity Growth: Evidence from Canadian Manufacturing
Plants
by
John R. Baldwin, Wulong Gu and Beiling Yan
11F0027M No. 075 ISSN 1703-0404
ISBN 978-1-100-19822-4
Statistics Canada Economic Analysis Division
18-F, R.H. Coats Building, 100 Tunney‘s Pasture Driveway Ottawa K1A 0T6
How to obtain more information:
National inquiries line: 1-800-263-1136 E-Mail inquiries: [email protected]
December 2011
We would like to thank Isabelle Amano, Claude Lavoie, Alla Lileeva, Annette Ryan, Jianmin Tang, Ben Tomlin and seminar participants at Industry Canada and Statistics Canada for their comments and Danny Leung for his help with GMM estimation.
Authors‘ names are listed alphabetically.
Published by authority of the Minister responsible for Statistics Canada
© Minister of Industry, 2011
All rights reserved. The content of this electronic publication may be reproduced, in whole or in part, and by any means, without further permission from Statistics Canada, subject to the following conditions: that it be done solely for the purposes of private study, research, criticism, review or newspaper summary, and/or for non-commercial purposes; and that Statistics Canada be fully acknowledged as follows: Source (or ―Adapted from‖, if appropriate): Statistics Canada, year of publication, name of product, catalogue number, volume and issue numbers, reference period and page(s). Otherwise, no part of this publication may be reproduced, stored in a retrieval system or transmitted in any form, by any means—electronic, mechanical or photocopy—or for any purposes without prior
written permission of Licensing Services, Information Management Division, Statistics Canada, Ottawa, Ontario,
Canada K1A 0T6. La version française de cette publication est disponible (n
o 11F0027M au catalogue, n
o 075).
Note of appreciation
Canada owes the success of its statistical system to a long-standing partnership between Statistics Canada, the citizens of Canada, its businesses, governments and other institutions. Accurate and timely statistical information could not be produced without their continued cooperation and goodwill.
Standards of service to the public
Statistics Canada is committed to serving its clients in a prompt, reliable and courteous manner. To this end, the agency has developed standards of service which its employees observe in serving its clients. To obtain a copy of these service standards, please contact Statistics Canada toll free at 1-800-263-1136. The service standards are also published on www.statcan.gc.ca. Under ―Our agency‖ click About us > The agency > and select ―Providing services to Canadians‖.
Economic Analysis Research Paper Series
The Economic Analysis Research Paper Series provides for the circulation of research conducted by the staff of National Accounts and Analytical Studies, visiting Fellows and academic associates. The research paper series is meant to stimulate discussion on a range of topics including the impact of the New Economy, productivity issues, firm profitability, technology usage, the effect of financing on firm growth, depreciation functions, the use of satellite accounts, savings rates, leasing, firm dynamics, hedonic estimations, diversification patterns, investment patterns, the differences in the performance of small and large, or domestic and multinational firms, and purchasing power parity estimates. Readers of the series are encouraged to contact the authors with comments, criticisms and suggestions.
The primary distribution medium for the papers is the Internet. These papers can be downloaded from the Internet at www.statcan.gc.ca for free.
All papers in the Economic Analysis Series go through institutional and peer review to ensure that they conform to Statistics Canada's mandate as a government statistical agency and adhere to generally accepted standards of good professional practice.
The papers in the series often include results derived from multivariate analysis or other statistical techniques. It should be recognized that the results of these analyses are subject to uncertainty in the reported estimates.
The level of uncertainty will depend on several factors: the nature of the functional form used in the multivariate analysis; the type of econometric technique employed; the appropriateness of the statistical assumptions embedded in the model or technique; the comprehensiveness of the variables included in the analysis; and the accuracy of the data that are utilized. The peer group review process is meant to ensure that the papers in the series have followed accepted standards to minimize problems in each of these areas.
Publications Review Committee Analytical Studies Branch, Statistics Canada
18th Floor, R.H. Coats Building Ottawa, Ontario K1A 0T6
Symbols
The following standard symbols are used in Statistics Canada publications: . not available for any reference period .. not available for a specific reference period … not applicable 0 true zero or a value rounded to zero 0
s value rounded to 0 (zero) where there is a meaningful distinction between true zero and the value that
was rounded p preliminary
r revised x suppressed to meet the confidentiality requirements of the Statistics Act E use with caution
F too unreliable to be published * significantly different from reference category (p < 0.05)
Analytical Studies — Research Paper Series - 4 - Statistics Canada – Catalogue no. 11F0027M, no. 075
Table of contents
Abstract ..................................................................................................................................... 5
Executive summary .................................................................................................................. 6
1 Introduction ......................................................................................................................... 8
2 Restructuring and productivity growth ........................................................................... 10
3 Methodology ..................................................................................................................... 13
3.1 Aggregate production function and production possibility frontier ................................ 15
3.2 Direct aggregation across plants ................................................................................. 16
4 Data .................................................................................................................................... 21
5 Empirical results ............................................................................................................... 25
5.1 Production function estimation .................................................................................... 25
5.2 Decomposition results for the aggregate manufacturing sector ................................... 26
5.3 Robustness check ....................................................................................................... 30
6 Contributions of exporters versus non-exporters and foreign- versus domestic-controlled plants ............................................................................................................... 31
7 Decomposition results for durable and non-durable goods manufacturing industries .......................................................................................................................... 34
8 Conclusion ........................................................................................................................ 35
9 Appendix ........................................................................................................................... 37
References .............................................................................................................................. 39
Analytical Studies — Research Paper Series - 5 - Statistics Canada – Catalogue no. 11F0027M, no. 075
Abstract
Labour productivity growth in the Canadian business sector slowed substantially after 2000. Most of the slowdown occurred in the manufacturing sector. This paper examines how this slowdown was associated with the restructuring that occurred in manufacturing as a result of the increase in excess capacity, the dramatic increase in the Canada–U.S. exchange rate and a slowdown in export growth. The paper finds that at least half of the slowdown in aggregate productivity growth is because of the pro-cyclical nature of productivity growth arising from capacity utilization. Almost all of the aggregate productivity growth slowdown is driven by exporters, who had large declines in labour productivity growth in the post-2000 period.
Analytical Studies — Research Paper Series - 6 - Statistics Canada – Catalogue no. 11F0027M, no. 075
Executive summary
Growth in Canadian labour productivity fell in the post-2000 decade compared with the 1990s. The manufacturing sector was responsible for most of this slowdown.
This paper examines the conditions that were related to this event. It focuses first on key differences in the general economic environment in the two decades. It then decomposes changes in productivity into underlying components to examine whether differences in those components suggest causes that relate to changes in the economic environment.
The 1990s and the period from 2000 to 2006 differed in terms of underlying demand conditions faced by the manufacturing sector. During the period from 1990 to 1996, average tariffs on Canada–U.S. trade fell significantly as the North American Free Trade Agreement (NAFTA) was implemented. In addition, the Canada–U.S. exchange rate depreciated over much of this period. The trading environment post-2000 was very different. Most of the tariff reductions pursuant to the Canada–U.S. free trade treaties had already been implemented; at the same time, the Canadian dollar appreciated relative to the U.S. dollar post-2003, making Canadian exports less competitive in U.S. markets. Reflecting these tariff and exchange rate movements, the export/sales ratios of the manufacturing sector rose in the 1990s and then declined after 2000.
The post-2000 period also saw the development of excess capacity in the Canadian manufacturing sector. Overall, capacity utilization in manufacturing averaged 86% in 1999, then declined to 81% in 2003, and only returned to 83% in 2006. Capacity utilization declined in 16 out of the 20 manufacturing industries in that period.
Some of the excess capacity that developed post 2000 originated in the general economic slowdown in North America and resulting large declines in exports that occurred early in the period; however, after 2000 several industries experienced significant declines in demand that were also related to major long-term structural adjustments. The electronic product manufacturing sector went through readjustment after the collapse of the dot-com bubble in the early 2000s. Pulp and paper contracted as newspapers in the United States faced increasing competition from the Internet. Petroleum refining declined as energy demand declined in response to rising energy prices. Non-durable goods industries such as textiles, leather and clothing were faced with increasing global competition from imports from emerging economies that resulted in falling output volumes in these industries.
The accompanying slowdown in productivity growth and output growth after 2000 in manufacturing was widespread. Of the 45 manufacturing industries at a North American Industry Classification System (NAICS) three-digit level of aggregation, 35 industries saw declines in labour productivity growth after 2000 compared with the period from 1988 to 2000.
To understand the role of restructuring in the productivity growth slowdown, this paper decomposes total labour productivity growth into components: a within-plant component that captured the effect of capital deepening, technological progress, scale economies, and variable input utilization at the plant level, and a between-plant component that reflects the effect of the reallocation of inputs and outputs across plants on aggregate capital deepening and aggregate multifactor productivity (MFP) growth.
The question of interest is the extent to which most of the decline in labour productivity growth came from a decline in capacity utilization or whether it came from other sources—a decline in general efficiency or a decline in the impact of the reallocation of resources that generally tend to affect productivity growth. As a by-product, the analysis also provides estimates of the extent to which the benefits of reallocation come from a shift in the importance of businesses that have higher capital intensity or higher efficiency.
Analytical Studies — Research Paper Series - 7 - Statistics Canada – Catalogue no. 11F0027M, no. 075
The decomposition uses microdata on manufacturing plants in the Canadian manufacturing sector in the 1990s and post-2000 period. These microdata are especially constructed for the project from data derived from administrative and survey records maintained by Statistics Canada.
The analytical exercise requires empirical estimates of the parameters of a production function that determine the impact of changing capacity utilization on productivity. These are estimated in this paper using microrecords derived from plant data. Different econometric techniques are used to examine the robustness of the conclusions to alternate estimation strategies.
The estimates indicate that from 55% to 90% of the aggregate productivity slowdown is because of the pro-cyclical nature of productivity arising from changes in the level of capacity utilization. In the post-2000 period, the economy grew more slowly: the Canadian manufacturing sector contracted at an annual average rate of 0.3% in the 2000-to-2006 period compared with 3.4% annual growth in the 1990-to-1999 period. Non-instantaneous adjustment of production inputs such as capital and labour led to excess capacity and lower productivity estimates (as unobservable capacity utilization results in over-measurement of variable production inputs). Alternate estimation techniques yield even larger estimates of the degree to which the slowdown was the result of the development of excess capacity.
Differences in the impact of excess capacity across sectors indicate this impact was particularly severe for firms and industries that served export markets: this supports the interpretation that this development stemmed from changes in the trade environment, as exporters had large declines in labour productivity growth in the post-2000 period. Indeed, almost all of the aggregate labour productivity growth slowdown after 2000 was driven by exporters. The decline in labour productivity growth is more pronounced in foreign-controlled plants than domestic-controlled plants, as foreign-controlled plants are more export-oriented. In addition, the effect of excess capacity was observed more in durable goods industries where the impact of excess capacity on productivity is greatest because of the nature of the production process.
Analytical Studies — Research Paper Series - 8 - Statistics Canada – Catalogue no. 11F0027M, no. 075
1 Introduction
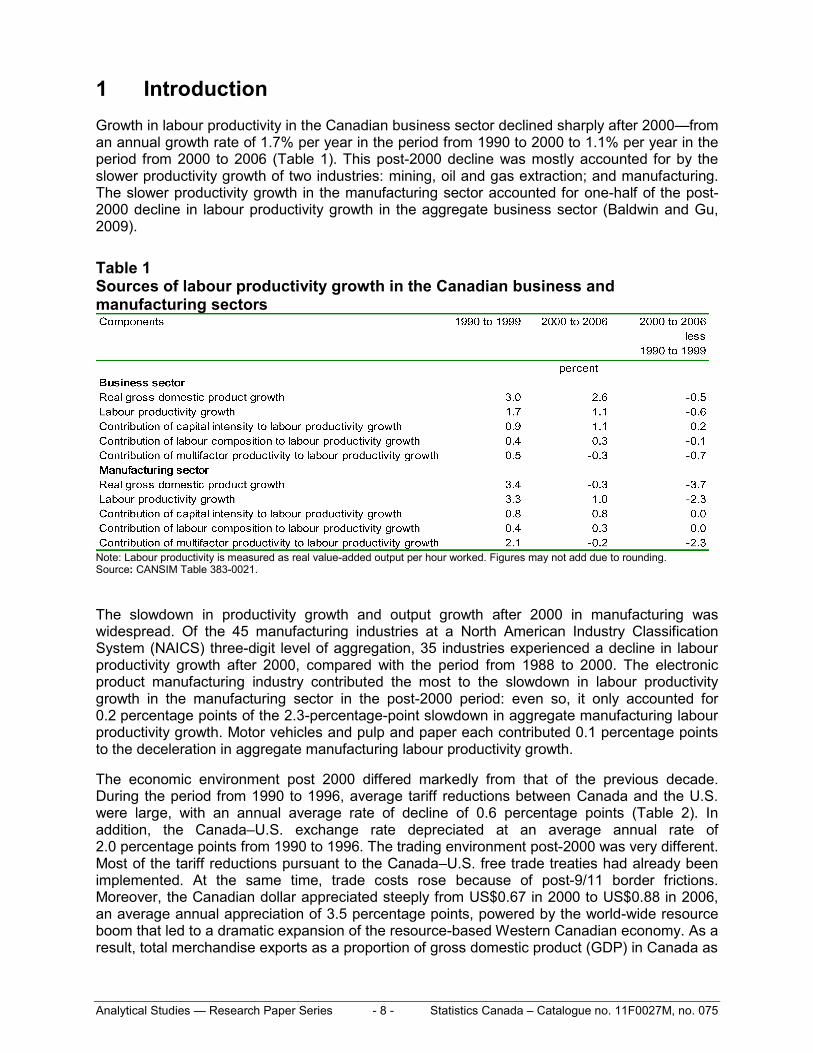
Growth in labour productivity in the Canadian business sector declined sharply after 2000—from an annual growth rate of 1.7% per year in the period from 1990 to 2000 to 1.1% per year in the period from 2000 to 2006 (Table 1). This post-2000 decline was mostly accounted for by the slower productivity growth of two industries: mining, oil and gas extraction; and manufacturing. The slower productivity growth in the manufacturing sector accounted for one-half of the post-2000 decline in labour productivity growth in the aggregate business sector (Baldwin and Gu, 2009).
Table 1 Sources of labour productivity growth in the Canadian business and manufacturing sectors
Note: Labour productivity is measured as real value-added output per hour worked. Figures may not add due to rounding. Source: CANSIM Table 383-0021.
The slowdown in productivity growth and output growth after 2000 in manufacturing was widespread. Of the 45 manufacturing industries at a North American Industry Classification System (NAICS) three-digit level of aggregation, 35 industries experienced a decline in labour productivity growth after 2000, compared with the period from 1988 to 2000. The electronic product manufacturing industry contributed the most to the slowdown in labour productivity growth in the manufacturing sector in the post-2000 period: even so, it only accounted for 0.2 percentage points of the 2.3-percentage-point slowdown in aggregate manufacturing labour productivity growth. Motor vehicles and pulp and paper each contributed 0.1 percentage points to the deceleration in aggregate manufacturing labour productivity growth.
The economic environment post 2000 differed markedly from that of the previous decade. During the period from 1990 to 1996, average tariff reductions between Canada and the U.S. were large, with an annual average rate of decline of 0.6 percentage points (Table 2). In addition, the Canada–U.S. exchange rate depreciated at an average annual rate of 2.0 percentage points from 1990 to 1996. The trading environment post-2000 was very different. Most of the tariff reductions pursuant to the Canada–U.S. free trade treaties had already been implemented. At the same time, trade costs rose because of post-9/11 border frictions. Moreover, the Canadian dollar appreciated steeply from US$0.67 in 2000 to US$0.88 in 2006, an average annual appreciation of 3.5 percentage points, powered by the world-wide resource boom that led to a dramatic expansion of the resource-based Western Canadian economy. As a result, total merchandise exports as a proportion of gross domestic product (GDP) in Canada as
Analytical Studies — Research Paper Series - 9 - Statistics Canada – Catalogue no. 11F0027M, no. 075
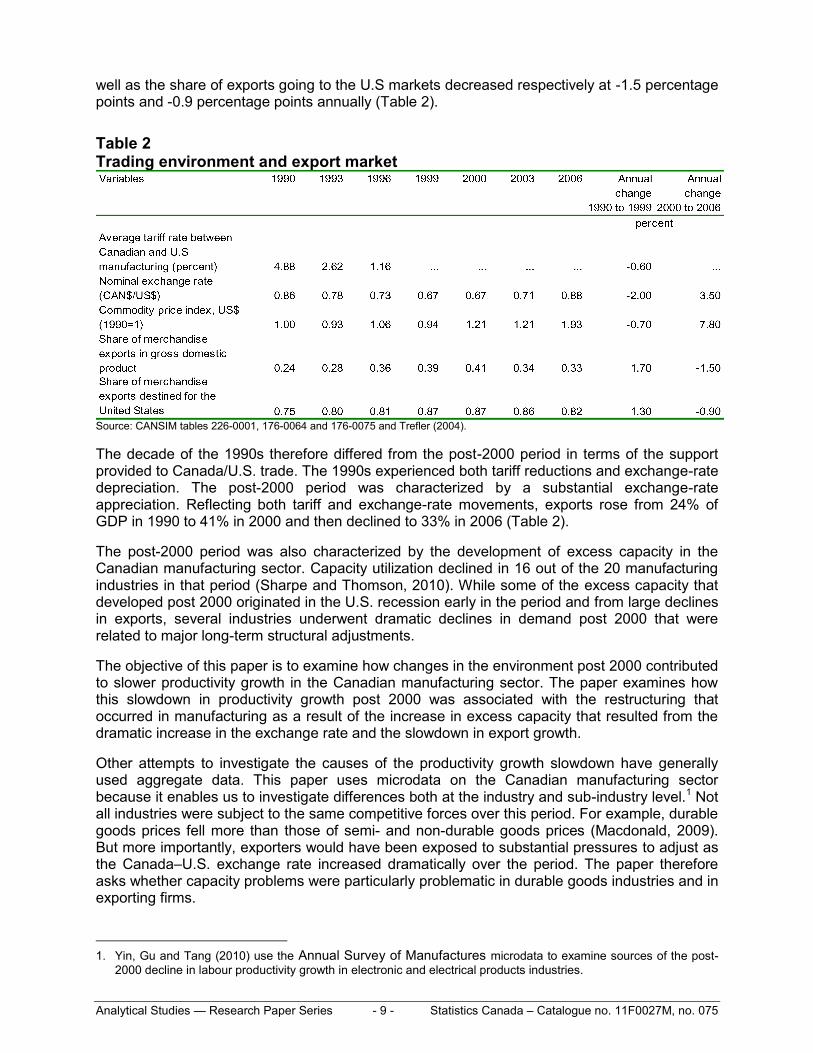
well as the share of exports going to the U.S markets decreased respectively at -1.5 percentage points and -0.9 percentage points annually (Table 2).
Table 2 Trading environment and export market
Source: CANSIM tables 226-0001, 176-0064 and 176-0075 and Trefler (2004).
The decade of the 1990s therefore differed from the post-2000 period in terms of the support provided to Canada/U.S. trade. The 1990s experienced both tariff reductions and exchange-rate depreciation. The post-2000 period was characterized by a substantial exchange-rate appreciation. Reflecting both tariff and exchange-rate movements, exports rose from 24% of GDP in 1990 to 41% in 2000 and then declined to 33% in 2006 (Table 2).
The post-2000 period was also characterized by the development of excess capacity in the Canadian manufacturing sector. Capacity utilization declined in 16 out of the 20 manufacturing industries in that period (Sharpe and Thomson, 2010). While some of the excess capacity that developed post 2000 originated in the U.S. recession early in the period and from large declines in exports, several industries underwent dramatic declines in demand post 2000 that were related to major long-term structural adjustments.
The objective of this paper is to examine how changes in the environment post 2000 contributed to slower productivity growth in the Canadian manufacturing sector. The paper examines how this slowdown in productivity growth post 2000 was associated with the restructuring that occurred in manufacturing as a result of the increase in excess capacity that resulted from the dramatic increase in the exchange rate and the slowdown in export growth.
Other attempts to investigate the causes of the productivity growth slowdown have generally used aggregate data. This paper uses microdata on the Canadian manufacturing sector because it enables us to investigate differences both at the industry and sub-industry level.1 Not all industries were subject to the same competitive forces over this period. For example, durable goods prices fell more than those of semi- and non-durable goods prices (Macdonald, 2009). But more importantly, exporters would have been exposed to substantial pressures to adjust as the Canada–U.S. exchange rate increased dramatically over the period. The paper therefore asks whether capacity problems were particularly problematic in durable goods industries and in exporting firms.
1. Yin, Gu and Tang (2010) use the Annual Survey of Manufactures microdata to examine sources of the post-
2000 decline in labour productivity growth in electronic and electrical products industries.
Analytical Studies — Research Paper Series - 10 - Statistics Canada – Catalogue no. 11F0027M, no. 075
To understand the role of restructuring in the productivity growth slowdown, the paper proposes a decomposition method that delves deeper into the microcomponents of aggregate labour productivity growth: a within-plant component that captures the effect of capital deepening, technological progress, scale economies and variable input utilization at the plant level, and a between-plant component that reflects the effect of the reallocation of inputs and outputs across plants on aggregate capital deepening and aggregate MFP growth. The question of interest is the extent to which most of the decline in labour productivity growth came from a decline in capacity utilization or whether it came from other sources—a decline in generally efficiency or a decline in the impact of the reallocation of resources that generally tend to contribute to productivity growth.
The decomposition builds on earlier work (Jorgenson, Gollop and Fraumeni, 1987 and Jorgenson, Ho and Stiroh, 2005) that decomposes aggregate productivity growth into its industry components but, in this instance, applies it to the plant level. The methodologies of Jorgenson and his collaborators were developed under the assumption of perfect competition and constant returns to scale. This paper introduces non-neoclassical features of the plant-level economic environment, such as imperfect competition and economies of scale. It also takes into account the effect of changes in capacity utilization using the production structure of Berndt and Fuss (1982) and Berndt and Hess (1986).2
2 Restructuring and productivity growth
The two leading explanations for the slower productivity growth in the Canadian manufacturing sector during this period are both related to the short- and long-term restructuring that occurred in the Canadian manufacturing sector post 2000. The first explanation is the diminishing effect of scale economies or the positive feedback effect between output growth and productivity growth after 2000 (Verdoorn, 1980; Kaldor, 1966; and Scott, 1989). Increased output that is associated with an expanding market will lead to increased economies of scale, greater product specialization, and increased investment in advanced technology, which leads to higher productivity growth. After strong output growth in the late 1990s, the manufacturing sector had little output growth after 2000. Real GDP growth in manufacturing declined from 3.4% per year in the period from 1988 to 2000 to -0.3% in the period from 2000 to 2006. This coincides with the decline in demand for the output of manufacturing and the decline in manufacturing exports following the strong appreciation of the Canadian dollar after 2002.
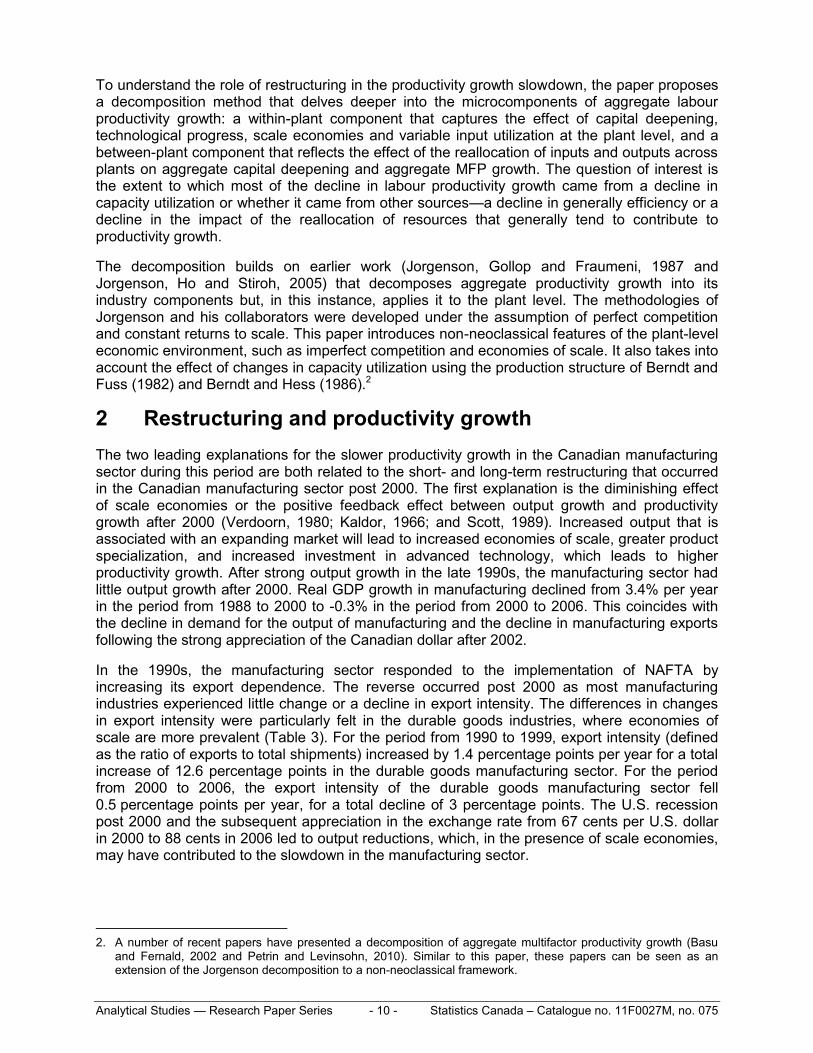
In the 1990s, the manufacturing sector responded to the implementation of NAFTA by increasing its export dependence. The reverse occurred post 2000 as most manufacturing industries experienced little change or a decline in export intensity. The differences in changes in export intensity were particularly felt in the durable goods industries, where economies of scale are more prevalent (Table 3). For the period from 1990 to 1999, export intensity (defined as the ratio of exports to total shipments) increased by 1.4 percentage points per year for a total increase of 12.6 percentage points in the durable goods manufacturing sector. For the period from 2000 to 2006, the export intensity of the durable goods manufacturing sector fell 0.5 percentage points per year, for a total decline of 3 percentage points. The U.S. recession post 2000 and the subsequent appreciation in the exchange rate from 67 cents per U.S. dollar in 2000 to 88 cents in 2006 led to output reductions, which, in the presence of scale economies, may have contributed to the slowdown in the manufacturing sector.
2. A number of recent papers have presented a decomposition of aggregate multifactor productivity growth (Basu
and Fernald, 2002 and Petrin and Levinsohn, 2010). Similar to this paper, these papers can be seen as an extension of the Jorgenson decomposition to a non-neoclassical framework.
Analytical Studies — Research Paper Series - 11 - Statistics Canada – Catalogue no. 11F0027M, no. 075
Table 3 Average annual changes in export intensity of durable and non-durable goods
1. Non-durable = 0. 2. Durable = 1. Source: Statistics Canada, authors‘ tabulation from the Annual Survey of Manufacturers.
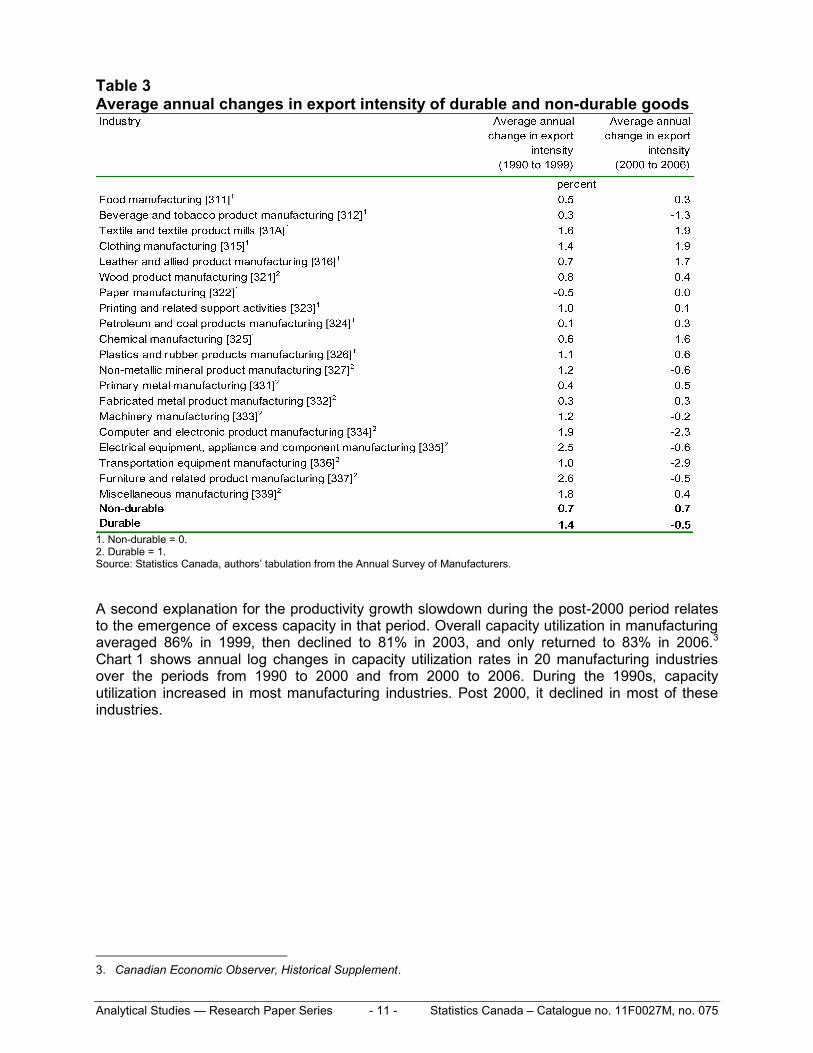
A second explanation for the productivity growth slowdown during the post-2000 period relates to the emergence of excess capacity in that period. Overall capacity utilization in manufacturing averaged 86% in 1999, then declined to 81% in 2003, and only returned to 83% in 2006.3 Chart 1 shows annual log changes in capacity utilization rates in 20 manufacturing industries over the periods from 1990 to 2000 and from 2000 to 2006. During the 1990s, capacity utilization increased in most manufacturing industries. Post 2000, it declined in most of these industries.
3. Canadian Economic Observer, Historical Supplement.
Analytical Studies — Research Paper Series - 12 - Statistics Canada – Catalogue no. 11F0027M, no. 075
Chart 1 Annual log changes in capacity utilization in the manufacturing industries
-3 -2 -1 0 1 2 3 4
All31131231A315316321322323324325326327331332333334335336337339
percent
1990 to 2000 2000 to 2006
North american industry classification system (NAICS)
Source: Authors' calculations.
Some of the excess capacity that developed post 2000 originated from the U.S. recession early in the period and from large declines in exports; however, several industries also experienced significant declines in demand post 2000 that were related to major long-term structural adjustments. The increase in high tech production experienced during the late 1990s was followed by the bursting of the dot-com bubble and the associated reduction in economic activity, particularly in manufacturing, and declining production in electronic product manufacturing. At the same time, the major Canadian multinational and exporter Nortel began its slow decline into bankruptcy. Capacity utilization in the electrical products industry fell from 92% in 2000 to 73% in 2003, and only returned to 80% by 2006. While the bursting of the dot-com bubble is an important part of the explanation for the slower productivity growth in the manufacturing sector, it is not the whole story. The decline in the productivity growth of electronic products manufacturing accounted for less than 10% of the decline in manufacturing productivity growth after 2000.
Structural adjustments were also occurring in other industries during this time. Through the late 1990s and the first decade of the 21st century, the rise of the Internet, falling newspaper circulation, and deregulation of electricity markets in Ontario produced adverse conditions for forest producers. Pulp and paper firms began closing plants because of falling demand and weak prices. Pulp production declined from 27 million tonnes in 2000 to 17 million tonnes in 2009. Newsprint production declined as dramatically over the same period, from 9 million to 4 million tonnes.
The automotive industry also abruptly reversed course after 2000, as North American producers began to succumb to competition from Asian producers that had set up North American production facilities (Roy and Kimanyi, 2007). Total Canadian vehicle production increased from 2.1 million units in 1995 to 2.7 million in 1999, only to decrease to 2.0 million units by 2006—a 30% drop.
Analytical Studies — Research Paper Series - 13 - Statistics Canada – Catalogue no. 11F0027M, no. 075
The decline in these industries affected supplier industries like chemicals that served both pulp and paper and the automotive industry and suppliers. With exports accounting for more than three-quarters of production, the industry was particularly susceptible to declines in U.S. output in the early post-2000 period. It was also harmed by rising costs of feedstock—the price of natural gas increased post 1988.
During this time, the meat processing sector of the food industry was affected by the temporary banning of Canadian cattle exports to the United States after the discovery of bovine spongiform encephalopathy (commonly known as ‗mad cow disease‘) in Alberta in 2003, leading to a large decline in agriculture exports. The partial re-opening of the border in August 2003 alleviated some of the pressure on ranchers, but the border was not fully re-opened until 2007.
The post-2000 period also experienced a resource boom with most commodity prices increasing rapidly to record levels. Sharp rises in energy prices affected the demand for refined petroleum products, and capacity utilization in petroleum fell from 92% in 2000 to 83% in 2006.
Several of the non-durable goods manufacturing industries also saw actual declines in output, as imports from developing nations increased dramatically during this period. In 2006, real GDP in furniture was 87% of its level in 2000; for textiles, it was 68%; for clothing, 59%; and for leather goods, 41%. Production declines were accompanied by plant closings, but also by the emergence of excess capacity. For example, capacity utilization in clothing fell from 85% in 2000 to 76% in 2006.
Thus, a second explanation for the productivity slowdown during the post-2000 period is not just a slowdown in growth but also the emergence of excess capacity. The structural adjustments of the post-2000 period would have affected productivity growth not only because they reduced the economic growth that facilitates exploitation of scale economies. As well, productivity declines can be expected where excess capacity develops—especially where there are economies of scale. In capital-intensive industries, declines in production from full capacity lead to steep increases in short-term average costs and declines in labour productivity.
Normally, official productivity estimates generally produce labour and MFP growth estimates that do not explicitly consider capacity utilization.4 The productivity estimates are designed to generate summary statistics that track movements in technical progress over long periods of time like a full business cycle: changes in capacity utilization balance out and, therefore, need not be explicitly taken into account. By comparing productivity growth from peak to peak over a business cycle, analysts can minimize the impact of changes in capacity utilization.
But the industrial restructuring that took place in the post-2000 period was of the type and size that suggests the normal assumption about capacity balancing over a cycle may not hold for this period. Therefore, this paper investigates the extent to which the slowdown in productivity growth in the post-2000 period was a result of both the short- and long-term restructuring that affected the manufacturing sector.
3 Methodology
To examine the role of restructuring in the productivity growth slowdown in the Canadian manufacturing sector, the paper proposes a method that decomposes aggregate labour productivity growth into components. This methodology has been used by Jorgenson, Gollop and Fraumeni (1987) and Jorgenson, Ho and Stiroh (2005) to examine how economy-wide
4. While this is true of the labour productivity measures produced by Statistics Canada, the multifactor productivity
estimates use a methodology that potentially accounts for excess capacity.
Analytical Studies — Research Paper Series - 14 - Statistics Canada – Catalogue no. 11F0027M, no. 075
estimates of output growth can be traced to their industry origins. This paper adopts the same methodology to examine firm-level sources of industry labour productivity growth.
Aggregate labour productivity growth is driven by what takes place at the micro level (i.e., plant levels). Aggregate labour productivity can increase if all plants increase their labour productivity. It can also increase if inputs and outputs are reallocated toward those plants that have higher labour productivity levels. The former is often called the ‗within-plant‘ component of productivity growth; the latter is called the ‗reallocation‘ component. Reallocation can take place from declining plants to growing plants, or from the exiting plants to entering plants.
Within-plant labour productivity growth may occur because firms become more capital intensive or because they become more efficient as measured by multifactor productivity. So too, a reallocation effect may occur if output shifts to plants that are inherently more efficient—that have higher multifactor productivity—because they are more capital intensive or because they are operating closer to capacity and therefore closer to the minimum point on the average cost curve.
A number of empirical studies have decomposed aggregate productivity growth into the effect of reallocation and the effect of within-plant growth (Baldwin et al., 1995; Griliches and Regev, 1995; Foster, Haltiwanger and Krizan, 2001; and Baldwin and Gu, 2006 and 2011). The original decomposition methods used in these studies focused only on aggregate labour productivity or aggregate multifactor productivity and the extent to which shifts in output and inputs across firms enhanced productivity growth.
However, previous empirical studies did not focus on the underlying causes of changes in productivity at the firm level that arose from changes in capital intensity or changes in multifactor productivity—only on whether changes were internal to the firm or were caused by the reallocation of outputs across firms that arose from the dynamic competitive process. To proceed further, we must introduce production functions at the firm level to improve our understanding of the sources of the within-plant growth effect and the between-plant reallocation effect for overall productivity growth.
This paper extends the previous work that just examined the size of within- and between-plant components to enable us to delve deeper into these components using the methodologies of Jorgenson and his collaborators.5 These methodologies were developed under the assumption of perfect competition and constant returns to scale. This paper introduces non-neoclassical features of the plant-level economic environment, such as imperfect competition and increased returns to scale, as in Hall (1988, 1990), Basu and Fernald (2002), and Petrin and Levinsohn (2010). It also takes into account the effect of changes in capacity utilization using the production structure of Berndt and Fuss (1982).
The aggregate estimates of output growth and the sources of the growth are constructed here using two alternative methods—an aggregate production function or a less restrictive production possibility frontier, and the direct aggregation across microproducers (firms or plants). The two methods make use of same source data—the longitudinal file that is built from the Annual Survey of Manufactures (ASM).6 The differences between the two estimates reflect the impact of the different assumptions that the two methods use, and can be used to measure the impact of relaxing certain of these assumptions. Comparing the two estimates provides a decomposition of the aggregate output growth into the sources of the growth at the plant level.
5. Previous work also extends that analysis by not just examining the effects of the reallocation of labour or other
inputs (as is done here), but by investigating the impact of shifting market share so as to quantify the impact of competition on productivity growth.
6. Variously referred to over the years as the Census of Manufactures, the Annual Survey of Manufactures and the Annual Survey of Manufactures and Logging.
Analytical Studies — Research Paper Series - 15 - Statistics Canada – Catalogue no. 11F0027M, no. 075
The aggregate production function underlies the growth accounting framework that statistical agencies use to examine the sources of output growth (Schreyer, 2001). This framework is used to decompose output growth into two main components: the contribution of combined capital and labour inputs, and the contribution of MFP growth. Jorgenson, Gollop and Fraumeni (1987) show that the existence of an aggregation production imposes very strict assumptions about the production technology and the relative prices and mobility of the primary factors of production: capital and labour inputs. Jorgenson, Gollop and Fraumeni (1987) and Jorgenson (1990) discuss the key assumptions that are necessary for the existence of an aggregate production function. In the context of the estimation of the aggregate output growth and the sources of the growth, those key assumptions are as follows. First, the production function is the same across all plants, up to a scale multiple. Second, labour and capital must receive the same price in all plants.7 That is, all workers are paid the same wages and capital inputs are paid the same rental price of capital.
An alternative method for estimating aggregate output growth and examining the sources of aggregate output growth is to aggregate across plants, which relaxes the assumptions that are necessary for the existence of an aggregate production function. This direct aggregation approach makes no assumptions about the common production function for all plants. Neither does it make assumptions about the common prices of capital and labour inputs. It treats an industry as an aggregate of the plants that comprise the industry.
For the remainder of the section, we will first present the two alternative methods for estimating output growth and examining the sources of output growth. We will then compare the two methods used to decompose aggregate labour productivity growth into its microcomponents.
3.1 Aggregate production function and production possibility frontier
An aggregate production function expresses aggregate value-added (V) as a function of aggregate labour input (L) and aggregate capital input (K), and a time variable that proxies technology (T):
( , , ).V F K L T (1)
Under the assumption that the product and factor markets are competitive and the aggregate production function is characterized by constant returns to scale, the growth of value-added can be decomposed into the contributions of capital and labour inputs and the contribution of MFP growth. The sources of labour productivity growth can be decomposed into the contribution of capital deepening and MFP growth
,ln ln( / )k TP K L v (2)
where ln denotes the change between periods t-1 and t in logarithm, P denotes labour productivity defined as the ratio of value-added to labour input, K capital input, L labour input,
and Tv MFP growth, k is the average share of capital input in nominal value-added in the two
periods. The first term represents the contribution of capital deepening to labour productivity
7. If value-added is used as an aggregate measure of output, additional assumptions need to be employed. Each
plant must have a gross output production that is separable in value-added, where value-added is a function of capital, labour and technology. The value-added functions must be the same across all plants up to scale multiple. If there are heterogeneous types of capital and labour, the functions that aggregate different types of capital and labour must be identical for all plants for the existence of aggregate production functions. Each specific type of capital and labour must receive the same price across plants.
Analytical Studies — Research Paper Series - 16 - Statistics Canada – Catalogue no. 11F0027M, no. 075
growth. It captures the effect of increases in capital intensity on labour productivity growth. The second term represents the contribution of MFP growth, which is a residual component that captures the effect of other factors including technical progress, organizational innovations, scale economies, better management practices and investment in worker skills.
When capital and labour inputs receive the same price in all individual plants,8 the quantity of aggregate capital input and labour input is the simple sum across all plants
, .i i
i i
K K L L (3)
One necessary condition for the existence of an aggregate value-added production function is that each firm must have the same value-added production function. This assumption, combined with the assumption that capital and labour inputs receive the same price, implies that the price of value-added is the same and that aggregate value-added is the simple summation across all plants (Jorgenson, Ho and Stiroh, 2005).
Jorgenson (1966) developed a less restrictive approach using the production possibility frontier. This approach relaxes the assumption that each plant has the same value-added production function. It has been employed by Jorgenson, Ho and Stiroh (2005). As the value-added function here differs across plants, the price of value-added is no longer the same across all plants. Also, the aggregate value-added is no longer the simple summation across plants. Instead, the aggregate value-added from the production possibility frontier is calculated as a Tornqvist aggregation of value-added across plants
ln ln ,i i
i
V w V (4)
where iw is the share of plant value-added in aggregate nominal value-added, averaged over
the two periods.
3.2 Direct aggregation across plants
The alternative approach for estimating the aggregate output growth and examining the sources of growth is direct aggregation across plants. This approach was proposed by Jorgenson, Gollop and Fraumeni (1987) and used by Jorgenson, Ho and Stiroh (2005) to examine the sources of economy-wide output growth through the direct aggregation of industries: but it can be extended in a relatively straightforward fashion to the plant level. The approach enables tracing of aggregate productivity growth and aggregate input growth to their underlying sources at the plant level.
In this paper, this approach is extended to take into account non-neoclassical features of the economic environment facing plants. More specifically, it is assumed that the plant production function is characterized by increasing returns to scale, and that competition in the product market is imperfect.
The approach adopted here focuses on output as measured by value-added.9 Each plant is assumed to have a production function for value-added
8. The capital and labour inputs will have the same marginal product as each firm has the same value-added
production. 9. The aggregation method differs if gross output production for each individual plant is the focus of the analysis.
The alternate method is presented in Jorgenson, Ho and Stiroh (2005).
Analytical Studies — Research Paper Series - 17 - Statistics Canada – Catalogue no. 11F0027M, no. 075
( , , ),i
i Ki i Li i iV F K L T (5)
where iV is value-added of plant i , iK and iL are capital inputs and labour inputs ,Ki Li are
the unobserved utilization of capital and labour inputs, and iT indexes technology. The
production function is homogeneous of degree i . The parameter i is the degree of returns to
scale.
The economic environment of individual plants is assumed to be characterized by imperfect competition and firms may have market power. Following Hall (1990), and Basu and Fernald (2001, 2002), output growth can be written as
,ln ln ln ,i i i i i T iV X a e v (6)
where ln iX is the growth in the revenue share-weighted inputs:
ln ln lni Ki i Li iX K L ; and ln ie is growth in revenue share-weighted utilization of
labour and capital inputs ln ln lni Ki ki Li lie . As well, ki is the average share of
capital costs in total revenue. li is the average share of labour costs in total revenue. ,T iv is
MFP growth. ia represents the effect of changes in capacity utilization on output growth. i is
the mark-up over marginal cost, which is related to the returns to scale i , and the ratio of
economic profits to total revenue is by
/ (1 ).i i is (7)
Equation (6) will be used to obtain estimates of mark-up and the coefficients on input utilization using a sample of continuing plants in the Canadian manufacturing sector over the time period being examined.
Subtracting the labour input growth from both sides of equation (6) gives the following decomposition for the growth of labour productivity at plant i :
,ln ( 1) ln ln( / ) ln ln .i i i ki i i i i i i T iP X K L s L a e v (8)
The growth in plant labour productivity depends on scale economies, capital deepening, variable input utilization and technological progress. If there are economic profits, the share of capital and labour costs in total revenue will be less than 1, and increases in labour will lead to declines in plant labour productivity (the third term on the right of equation 8). In the empirical analysis that follows, economic profits will be assumed to be 0. This will be the case if the industry is characterized by monopolistic competition. Under that assumption, equation (8) can be simplified as
,ln ( 1) ln ln( / ) ln .i i i ki i i i i T iP X K L a e v (9)
When there are economic profits, i represents both the degree of returns to scale and mark-
up.
These plant-based estimates derived from equation (9) must be incorporated into an aggregate measure of value-added. Estimates of aggregate value-added are derived from the production possibility frontier, where aggregate value-added is a weighted sum of value-added growth
Analytical Studies — Research Paper Series - 18 - Statistics Canada – Catalogue no. 11F0027M, no. 075
across all plants (equation 4). Aggregate labour productivity growth, defined as the difference between growth in aggregate value-added from the production possibility frontier and growth in aggregate labour input, can be written as:
ln ln ln
ln ln ln .i i i i
i i
P V L
w P w L L
(10)
The first term in equation (10) is a ‗within-plant effect‘ or ‗direct productivity effect‘ and is equal to the weighted average of the labour productivity growth of individual plants. The within-plant effect measures the contribution of growth within individual plants, holding their shares of output constant, to overall productivity growth. The second term is the between-plant effect that represents the effect of the reallocation of labour input on aggregate labour productivity growth. The reallocation is positive if firms with higher value-added per unit of labour have faster growth in labour input.
Variants of equation (10) are used to account for the effect on labour productivity growth of reallocation across firms because of competitive restructuring (Griliches and Regev, 1995; Foster, Haltiwanger and Krizan, 2001; and Baldwin and Gu, 2006 and 2011). Those studies find that reallocation through entry and exit and among incumbents makes a significant contribution to labour productivity growth, and the importance of reallocation to aggregate productivity growth differs across industries. Baldwin and Gu (2011) and Foster, Haltiwanger and Krizan (2006) find that reallocation is more important in the retail trade sector than for the manufacturing sector. For the U.S. and Canadian manufacturing sectors, reallocation accounts for about 20% to 30% of labour productivity growth over a 10-year period. For the retail trade sectors in the two countries, reallocation accounts for most of the aggregate labour productivity growth. For the rest of the paper, decomposition (10) is referred to as the Griliches and Regev type (GR-type) decomposition, to be contrasted with the Jorgenson-type decomposition used in this paper.
The within-plant component in equation (10) can be traced to the various determinants of labour productivity growth at the plant level using equation (9):
,ln ( 1) ln ln( / ) ln
+ ln ln .
i i i i ki i i i i i i T i
i i i i
i i
i
P w X w K L wa e wv
w L L
(11)
This equation relates aggregate labour productivity growth to several sources at the plant level. The first term on the right side is the contribution of scale economies to aggregate labour productivity growth. The second term is the direct capital deepening effect, which represents the effect of within-plant capital deepening on aggregate labour productivity growth. The third term is the effect of variable input utilization. The fourth term is the direct MFP growth effect estimated as the weighted average of the MFP growth of individual plants. The last term captures the effect of the reallocation of labour on aggregate labour productivity growth.
A comparison of the source of growth equation (2) from the production possibility frontier with the source of growth equation (11) from the direct aggregation across plants yields a decomposition of aggregate labour productivity growth into its microcomponents. More specifically, equation (11) is subtracted from equation (2), and the terms are rearranged to yield a decomposition of aggregate MFP growth
Analytical Studies — Research Paper Series - 19 - Statistics Canada – Catalogue no. 11F0027M, no. 075
,( 1) ln ln ,T i i i i i i i T i K L
i i i
v w X wa e wv REALL REALL (12)
where
ln ln ,K K ki i
i
REALL w K K
,ki i
ki
k
P Kw
P K
ln ln ,L L li i
i
REALL w L L
,li i
li
l
P Lw
PL
liw is the share of plant i ‘s labour income in the total labour income, averaged over two
periods. kiw is the share of plant i ‘s capital income in the total capital income, averaged over
two periods. kiP is the price that capital input receives at plant i and kP is the price that capital
input receives across all plants if capital is paid the same price across all plants. liP is the price
that labour input receives at plant i and lP is the price that labour input receives across all
plants if labour is paid the same price across all plants.
Equation (12) shows how the aggregate MFP growth from the production possibility frontier relates to the sources of growth at the plant level. The aggregate MFP growth is decomposed into the effects of scale economies, the effect of variable utilization, the effect of MFP growth at individual plants, and the last two terms that capture the effects of the reallocation of capital and
labour inputs on aggregate MFP growth. The reallocation of capital input ( KREALL ) contributes
to aggregate MFP growth if the plants with higher capital input prices and a higher marginal product of capital have higher growth rates in capital input. The reallocation of labour inputs
( LREALL ) contributes to aggregate MFP growth if the firms with higher labour input prices and
a higher marginal product of labour have higher growth rates in labour input. The MFP decomposition (12) simplifies to decomposition (31) in Jorgenson, et al. (2007) under the assumption of constant returns to scale, perfect composition and no excess capacity.
Recent studies have presented a decomposition of aggregate MFP growth (Basu and Fernald, 2002 and Petrin and Levinsohn, 2010). These papers, like this one, can be seen as an extension of the Jorgenson decomposition to a non-neoclassical framework. For example, the MFP decomposition in Basu and Fernald (2002) (equation 28) and in Petrin and Levinsohn (2010) (equation 9) are variants of equation (12) in this paper.
The aggregate capital deepening effect from the production possibility frontier differs from the within-plant capital deepening effect, which is the weighted sum of capital deepening effects at the plant level. The aggregate deepening effect is the sum of the within-plant capital deepening effects plus a reallocation term that captures the effect of the reallocation of capital and labour inputs on aggregate capital deepening:
ln( / ) ln( / ) ln( / ) ln( / ) .k i ki i i K ki i i
i i
K L w K L K L w K L
(13)
The aggregate capital deepening effect from the production possibility frontier assumes that capital and labour inputs receive the same price. The direct aggregation of the capital deepening effect across plants does not make that assumption because of the limited mobility of capital and labour inputs across plants. The aggregate capital deepening effect will be less than
Analytical Studies — Research Paper Series - 20 - Statistics Canada – Catalogue no. 11F0027M, no. 075
the direct aggregation of capital inputs when there is movement of capital toward those plants with higher prices of capital input. The difference reflects the effect of compositional shifts of capital input. However, the aggregate capital deepening effect will be more than the direct aggregation of capital deepening effects across plants if labour moves toward those plants with higher capital prices and higher marginal products of capital.
Equations (11), (12) and (13) trace aggregate labour productivity growth and its two components (aggregate MFP growth and aggregate capital deepening effect) to their sources at the micro level.
The decompositions in equations (11), (12) and (13) extend the GR-type decomposition (10) to provide a richer understanding of the microcomponents of the within-plant effect and between-plant reallocation effect. It can be shown that the within-plant effect in equation (10) is the sum of the following components: within-plant MFP growth effects and within-plant capital deepening effects, plus scale effects and variable input utilization effects if there are scale economies and changes in capacity utilization. The between-plant reallocation effect in equation (10) can be traced to the effect of the reallocation of labour and capital inputs on MFP growth and the effect of the reallocation of inputs on capital deepening. Specifically, it can be shown that the following two equations hold:
,ln ln( / ) ( 1) ln ln ,i i i T i i ki i i i i i i i i
i i i i i
w P wv w K L w X wa e (14)
and
ln ln ln( / ) ln( / ) .i i K L K ki i i
i i
w L L REALL REALL K L w K L
(15)
The decomposition in equations (10), (11), (12) and (13) can be extended to approximate the effect of entrants and exiters. For entrants, inputs and outputs are only observed at the end of the period, while for exiters, inputs and outputs are only observed at the start of the period. As such, the growth rates of inputs, outputs and productivity over a period cannot be calculated for entrants and exiters. In order to carry out the decomposition, it is assumed that a hypothetical plant exists whose inputs and outputs at the start of the period are set equal to those of exiters, and whose inputs and outputs at the end of the period are set equal to those of entrants at the end of the period. The construction of the hypothetical plant can be thought of as an assumption that entrants displace exiters.10
The construct of the hypothetical plant enables us to examine the contribution of plant entry and exit to labour productivity growth and its two main components: MFP growth and capital deepening. For example, equation (10) can be rewritten to take into account the effect of entry and exit as follows:
ln ln ln ln ln .i i i i i i
i C i H i
P w P w P w L L
(16)
The first component represents the within-plant contribution of continuing plants. The second component is the contribution of the hypothetical plants and is calculated as the log difference in labour productivity between entrants and exiters multiplied by the average share of entrants and
10. For a discussion of the empirical validity of this assumption for the manufacturing sector, see Baldwin et al.
(1995). Because this does not exactly correspond to reality, the amount of productivity that jointly is attributed to continuing and to entering and exiting firms will not exactly correspond to the amount of within plant productivity estimated by the Jorgenson approach—but as will be shown here, the difference is minor.
Analytical Studies — Research Paper Series - 21 - Statistics Canada – Catalogue no. 11F0027M, no. 075
exitors in value-added. It measures the contribution of net entry. The third component represents the between-plant reallocations.
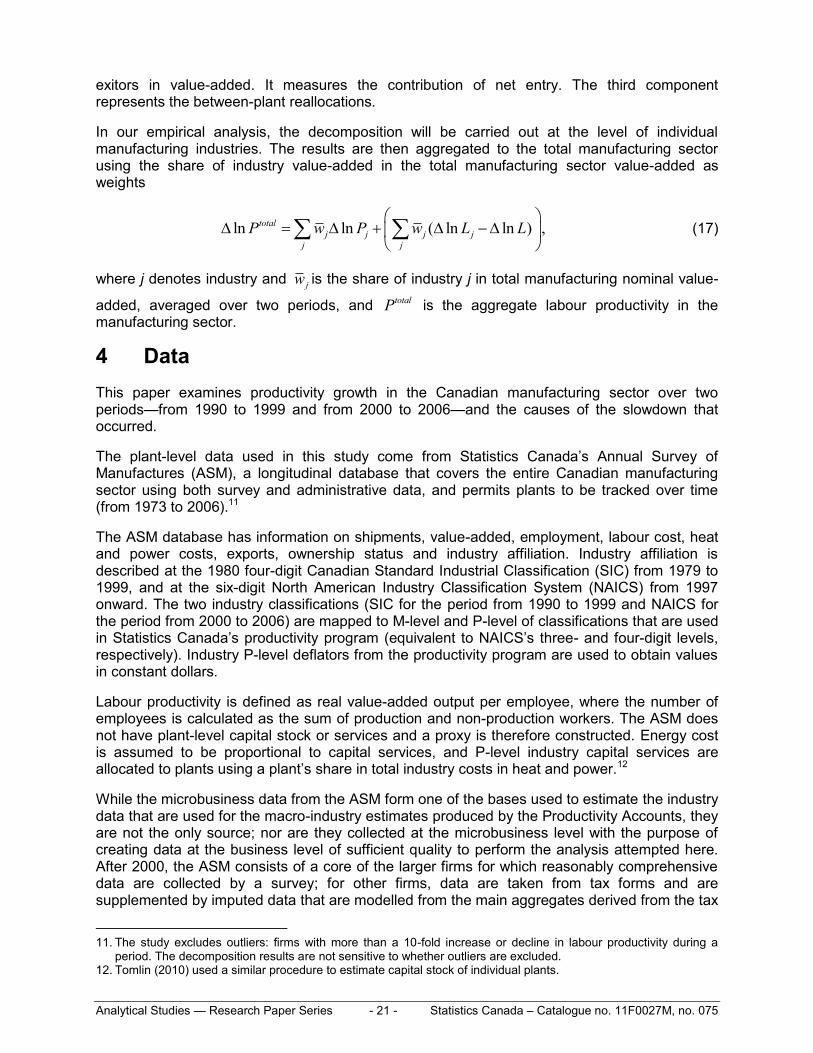
In our empirical analysis, the decomposition will be carried out at the level of individual manufacturing industries. The results are then aggregated to the total manufacturing sector using the share of industry value-added in the total manufacturing sector value-added as weights
ln ln ( ln ln ) ,total
j j j j
j j
P w P w L L
(17)
where j denotes industry and jw is the share of industry j in total manufacturing nominal value-
added, averaged over two periods, and totalP is the aggregate labour productivity in the
manufacturing sector.
4 Data
This paper examines productivity growth in the Canadian manufacturing sector over two periods—from 1990 to 1999 and from 2000 to 2006—and the causes of the slowdown that occurred.
The plant-level data used in this study come from Statistics Canada‘s Annual Survey of Manufactures (ASM), a longitudinal database that covers the entire Canadian manufacturing sector using both survey and administrative data, and permits plants to be tracked over time (from 1973 to 2006).11
The ASM database has information on shipments, value-added, employment, labour cost, heat and power costs, exports, ownership status and industry affiliation. Industry affiliation is described at the 1980 four-digit Canadian Standard Industrial Classification (SIC) from 1979 to 1999, and at the six-digit North American Industry Classification System (NAICS) from 1997 onward. The two industry classifications (SIC for the period from 1990 to 1999 and NAICS for the period from 2000 to 2006) are mapped to M-level and P-level of classifications that are used in Statistics Canada‘s productivity program (equivalent to NAICS‘s three- and four-digit levels, respectively). Industry P-level deflators from the productivity program are used to obtain values in constant dollars.
Labour productivity is defined as real value-added output per employee, where the number of employees is calculated as the sum of production and non-production workers. The ASM does not have plant-level capital stock or services and a proxy is therefore constructed. Energy cost is assumed to be proportional to capital services, and P-level industry capital services are allocated to plants using a plant‘s share in total industry costs in heat and power.12
While the microbusiness data from the ASM form one of the bases used to estimate the industry data that are used for the macro-industry estimates produced by the Productivity Accounts, they are not the only source; nor are they collected at the microbusiness level with the purpose of creating data at the business level of sufficient quality to perform the analysis attempted here. After 2000, the ASM consists of a core of the larger firms for which reasonably comprehensive data are collected by a survey; for other firms, data are taken from tax forms and are supplemented by imputed data that are modelled from the main aggregates derived from the tax
11. The study excludes outliers: firms with more than a 10-fold increase or decline in labour productivity during a
period. The decomposition results are not sensitive to whether outliers are excluded. 12. Tomlin (2010) used a similar procedure to estimate capital stock of individual plants.
Analytical Studies — Research Paper Series - 22 - Statistics Canada – Catalogue no. 11F0027M, no. 075
data. While the imputation process produces aggregate data that meet acceptable standards, it does not always preserve important relationships among the variables at the micro level.
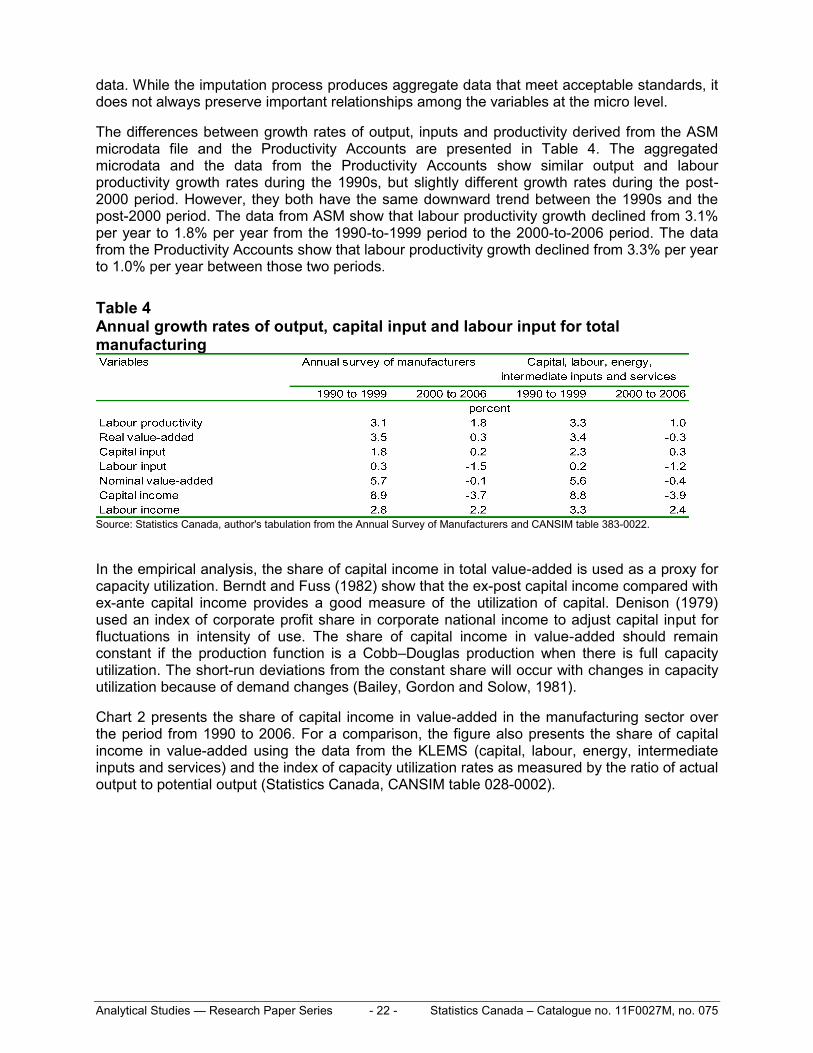
The differences between growth rates of output, inputs and productivity derived from the ASM microdata file and the Productivity Accounts are presented in Table 4. The aggregated microdata and the data from the Productivity Accounts show similar output and labour productivity growth rates during the 1990s, but slightly different growth rates during the post-2000 period. However, they both have the same downward trend between the 1990s and the post-2000 period. The data from ASM show that labour productivity growth declined from 3.1% per year to 1.8% per year from the 1990-to-1999 period to the 2000-to-2006 period. The data from the Productivity Accounts show that labour productivity growth declined from 3.3% per year to 1.0% per year between those two periods.
Table 4 Annual growth rates of output, capital input and labour input for total manufacturing
Source: Statistics Canada, author's tabulation from the Annual Survey of Manufacturers and CANSIM table 383-0022.
In the empirical analysis, the share of capital income in total value-added is used as a proxy for capacity utilization. Berndt and Fuss (1982) show that the ex-post capital income compared with ex-ante capital income provides a good measure of the utilization of capital. Denison (1979) used an index of corporate profit share in corporate national income to adjust capital input for fluctuations in intensity of use. The share of capital income in value-added should remain constant if the production function is a Cobb–Douglas production when there is full capacity utilization. The short-run deviations from the constant share will occur with changes in capacity utilization because of demand changes (Bailey, Gordon and Solow, 1981).
Chart 2 presents the share of capital income in value-added in the manufacturing sector over the period from 1990 to 2006. For a comparison, the figure also presents the share of capital income in value-added using the data from the KLEMS (capital, labour, energy, intermediate inputs and services) and the index of capacity utilization rates as measured by the ratio of actual output to potential output (Statistics Canada, CANSIM table 028-0002).
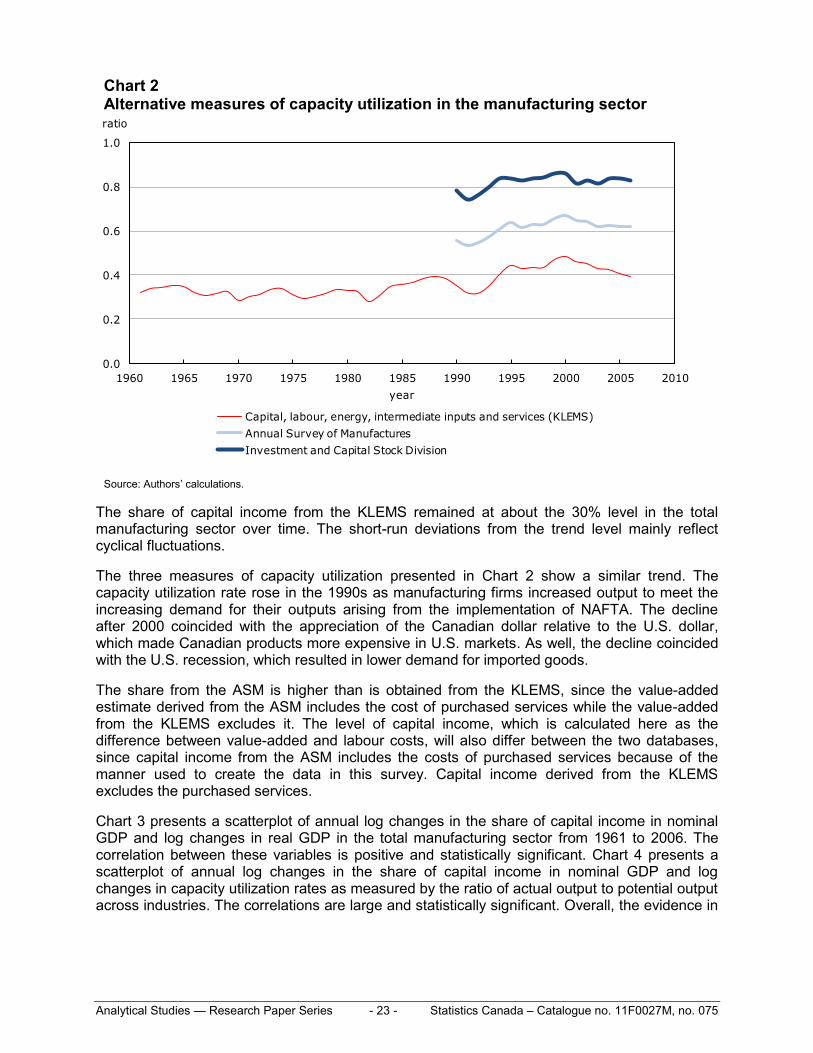
Analytical Studies — Research Paper Series - 23 - Statistics Canada – Catalogue no. 11F0027M, no. 075
Chart 2 Alternative measures of capacity utilization in the manufacturing sector
0.0
0.2
0.4
0.6
0.8
1.0
1960 1965 1970 1975 1980 1985 1990 1995 2000 2005 2010
ratio
year
Capital, labour, energy, intermediate inputs and services (KLEMS)
Annual Survey of Manufactures
Investment and Capital Stock Division
Source: Authors‘ calculations.
The share of capital income from the KLEMS remained at about the 30% level in the total manufacturing sector over time. The short-run deviations from the trend level mainly reflect cyclical fluctuations.
The three measures of capacity utilization presented in Chart 2 show a similar trend. The capacity utilization rate rose in the 1990s as manufacturing firms increased output to meet the increasing demand for their outputs arising from the implementation of NAFTA. The decline after 2000 coincided with the appreciation of the Canadian dollar relative to the U.S. dollar, which made Canadian products more expensive in U.S. markets. As well, the decline coincided with the U.S. recession, which resulted in lower demand for imported goods.
The share from the ASM is higher than is obtained from the KLEMS, since the value-added estimate derived from the ASM includes the cost of purchased services while the value-added from the KLEMS excludes it. The level of capital income, which is calculated here as the difference between value-added and labour costs, will also differ between the two databases, since capital income from the ASM includes the costs of purchased services because of the manner used to create the data in this survey. Capital income derived from the KLEMS excludes the purchased services.
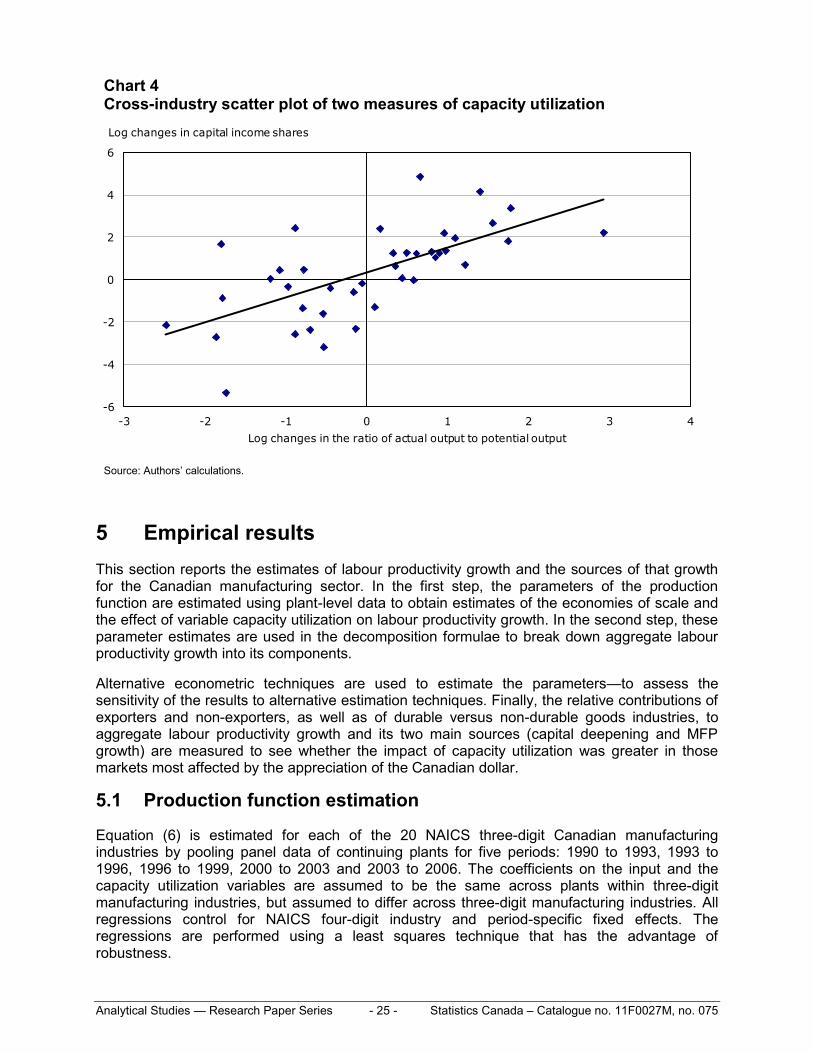
Chart 3 presents a scatterplot of annual log changes in the share of capital income in nominal GDP and log changes in real GDP in the total manufacturing sector from 1961 to 2006. The correlation between these variables is positive and statistically significant. Chart 4 presents a scatterplot of annual log changes in the share of capital income in nominal GDP and log changes in capacity utilization rates as measured by the ratio of actual output to potential output across industries. The correlations are large and statistically significant. Overall, the evidence in
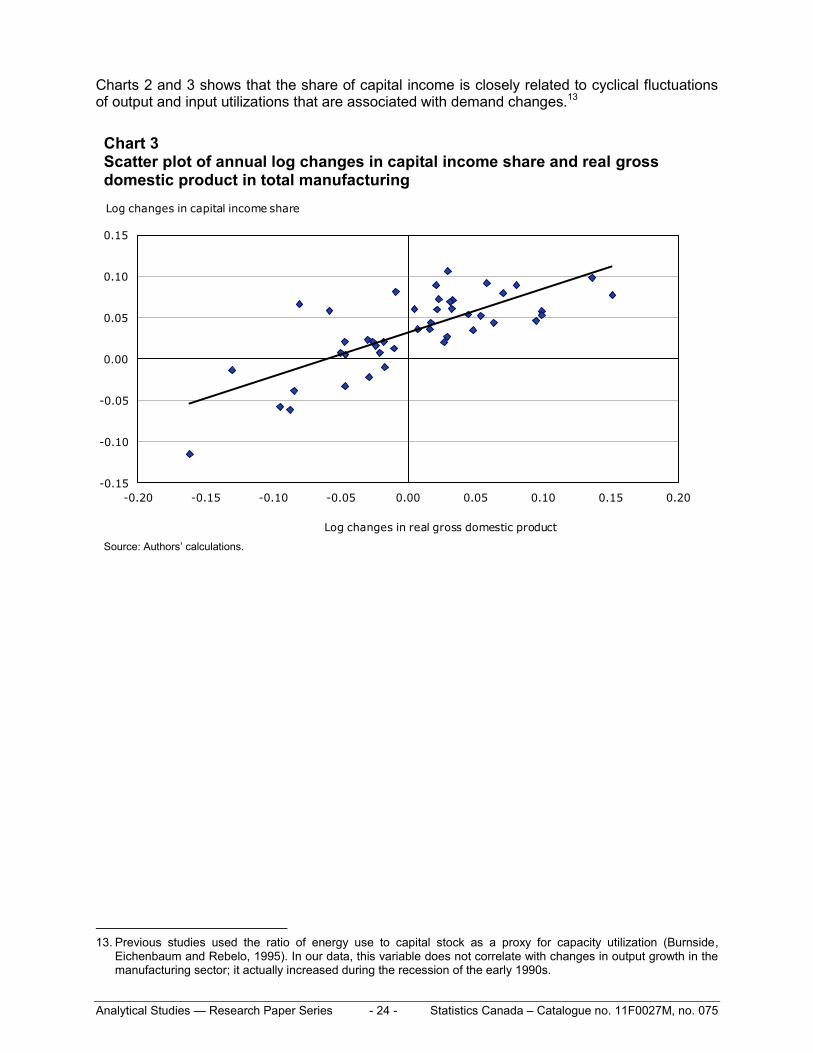
Analytical Studies — Research Paper Series - 24 - Statistics Canada – Catalogue no. 11F0027M, no. 075
Charts 2 and 3 shows that the share of capital income is closely related to cyclical fluctuations of output and input utilizations that are associated with demand changes.13
Chart 3 Scatter plot of annual log changes in capital income share and real gross domestic product in total manufacturing
-0.15
-0.10
-0.05
0.00
0.05
0.10
0.15
-0.20 -0.15 -0.10 -0.05 0.00 0.05 0.10 0.15 0.20
Log changes in real gross domestic product
Log changes in capital income share
Source: Authors‘ calculations.
13. Previous studies used the ratio of energy use to capital stock as a proxy for capacity utilization (Burnside,
Eichenbaum and Rebelo, 1995). In our data, this variable does not correlate with changes in output growth in the manufacturing sector; it actually increased during the recession of the early 1990s.
Analytical Studies — Research Paper Series - 25 - Statistics Canada – Catalogue no. 11F0027M, no. 075
Chart 4 Cross-industry scatter plot of two measures of capacity utilization
-6
-4
-2
0
2
4
6
-3 -2 -1 0 1 2 3 4
Log changes in the ratio of actual output to potential output
Log changes in capital income shares
Source: Authors‘ calculations.
5 Empirical results
This section reports the estimates of labour productivity growth and the sources of that growth for the Canadian manufacturing sector. In the first step, the parameters of the production function are estimated using plant-level data to obtain estimates of the economies of scale and the effect of variable capacity utilization on labour productivity growth. In the second step, these parameter estimates are used in the decomposition formulae to break down aggregate labour productivity growth into its components.
Alternative econometric techniques are used to estimate the parameters—to assess the sensitivity of the results to alternative estimation techniques. Finally, the relative contributions of exporters and non-exporters, as well as of durable versus non-durable goods industries, to aggregate labour productivity growth and its two main sources (capital deepening and MFP growth) are measured to see whether the impact of capacity utilization was greater in those markets most affected by the appreciation of the Canadian dollar.
5.1 Production function estimation
Equation (6) is estimated for each of the 20 NAICS three-digit Canadian manufacturing industries by pooling panel data of continuing plants for five periods: 1990 to 1993, 1993 to 1996, 1996 to 1999, 2000 to 2003 and 2003 to 2006. The coefficients on the input and the capacity utilization variables are assumed to be the same across plants within three-digit manufacturing industries, but assumed to differ across three-digit manufacturing industries. All regressions control for NAICS four-digit industry and period-specific fixed effects. The regressions are performed using a least squares technique that has the advantage of robustness.
Analytical Studies — Research Paper Series - 26 - Statistics Canada – Catalogue no. 11F0027M, no. 075
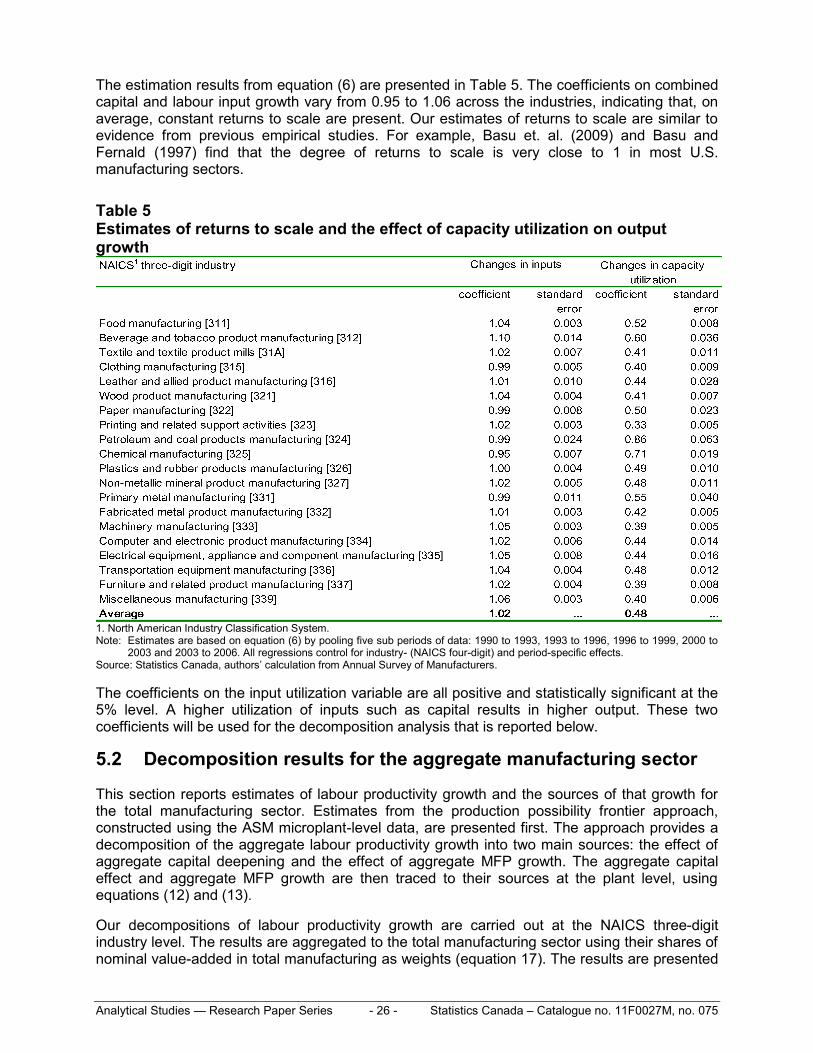
The estimation results from equation (6) are presented in Table 5. The coefficients on combined capital and labour input growth vary from 0.95 to 1.06 across the industries, indicating that, on average, constant returns to scale are present. Our estimates of returns to scale are similar to evidence from previous empirical studies. For example, Basu et. al. (2009) and Basu and Fernald (1997) find that the degree of returns to scale is very close to 1 in most U.S. manufacturing sectors.
Table 5 Estimates of returns to scale and the effect of capacity utilization on output growth
1. North American Industry Classification System. Note: Estimates are based on equation (6) by pooling five sub periods of data: 1990 to 1993, 1993 to 1996, 1996 to 1999, 2000 to
2003 and 2003 to 2006. All regressions control for industry- (NAICS four-digit) and period-specific effects. Source: Statistics Canada, authors‘ calculation from Annual Survey of Manufacturers.
The coefficients on the input utilization variable are all positive and statistically significant at the 5% level. A higher utilization of inputs such as capital results in higher output. These two coefficients will be used for the decomposition analysis that is reported below.
5.2 Decomposition results for the aggregate manufacturing sector
This section reports estimates of labour productivity growth and the sources of that growth for the total manufacturing sector. Estimates from the production possibility frontier approach, constructed using the ASM microplant-level data, are presented first. The approach provides a decomposition of the aggregate labour productivity growth into two main sources: the effect of aggregate capital deepening and the effect of aggregate MFP growth. The aggregate capital effect and aggregate MFP growth are then traced to their sources at the plant level, using equations (12) and (13).
Our decompositions of labour productivity growth are carried out at the NAICS three-digit industry level. The results are aggregated to the total manufacturing sector using their shares of nominal value-added in total manufacturing as weights (equation 17). The results are presented
Analytical Studies — Research Paper Series - 27 - Statistics Canada – Catalogue no. 11F0027M, no. 075
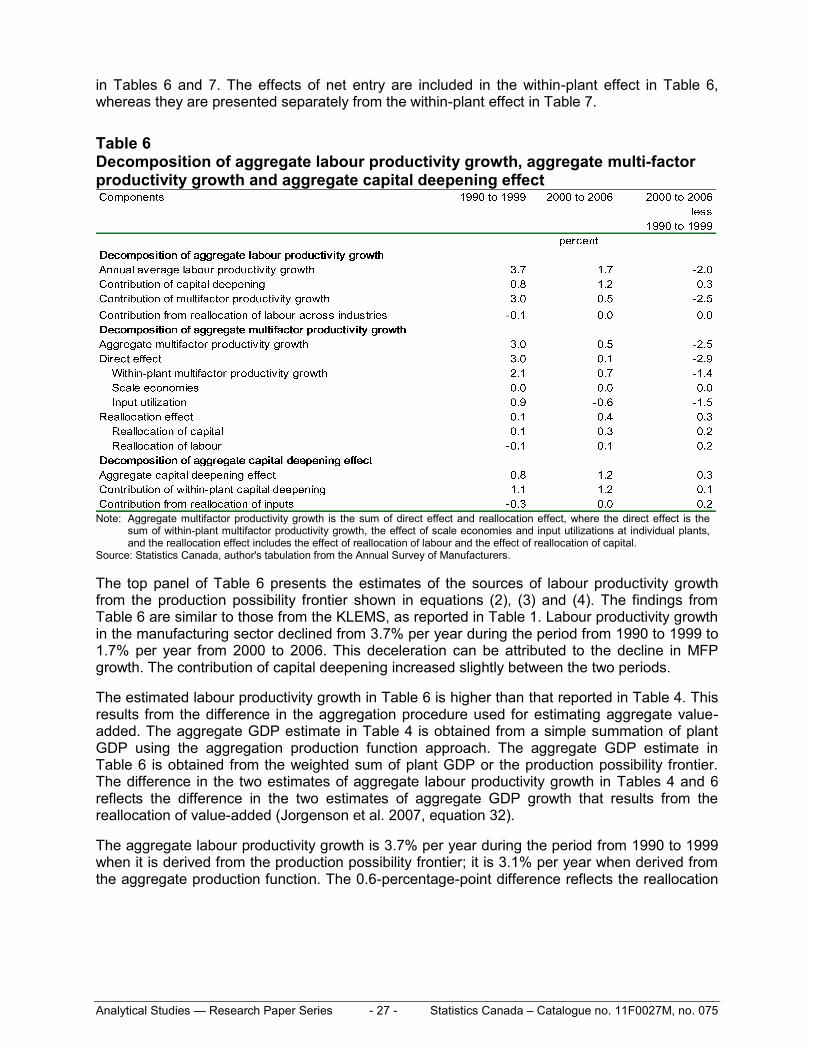
in Tables 6 and 7. The effects of net entry are included in the within-plant effect in Table 6, whereas they are presented separately from the within-plant effect in Table 7.
Table 6 Decomposition of aggregate labour productivity growth, aggregate multi-factor productivity growth and aggregate capital deepening effect
Note: Aggregate multifactor productivity growth is the sum of direct effect and reallocation effect, where the direct effect is the
sum of within-plant multifactor productivity growth, the effect of scale economies and input utilizations at individual plants, and the reallocation effect includes the effect of reallocation of labour and the effect of reallocation of capital.
Source: Statistics Canada, author's tabulation from the Annual Survey of Manufacturers.
The top panel of Table 6 presents the estimates of the sources of labour productivity growth from the production possibility frontier shown in equations (2), (3) and (4). The findings from Table 6 are similar to those from the KLEMS, as reported in Table 1. Labour productivity growth in the manufacturing sector declined from 3.7% per year during the period from 1990 to 1999 to 1.7% per year from 2000 to 2006. This deceleration can be attributed to the decline in MFP growth. The contribution of capital deepening increased slightly between the two periods.
The estimated labour productivity growth in Table 6 is higher than that reported in Table 4. This results from the difference in the aggregation procedure used for estimating aggregate value-added. The aggregate GDP estimate in Table 4 is obtained from a simple summation of plant GDP using the aggregation production function approach. The aggregate GDP estimate in Table 6 is obtained from the weighted sum of plant GDP or the production possibility frontier. The difference in the two estimates of aggregate labour productivity growth in Tables 4 and 6 reflects the difference in the two estimates of aggregate GDP growth that results from the reallocation of value-added (Jorgenson et al. 2007, equation 32).
The aggregate labour productivity growth is 3.7% per year during the period from 1990 to 1999 when it is derived from the production possibility frontier; it is 3.1% per year when derived from the aggregate production function. The 0.6-percentage-point difference reflects the reallocation
Analytical Studies — Research Paper Series - 28 - Statistics Canada – Catalogue no. 11F0027M, no. 075
of value-added across plants over the period. This indicates that plants with higher relative prices were growing relatively faster.14
The bottom panel of Table 6 presents the decomposition results for the aggregate MFP growth and aggregate capital deepening effect. They are each decomposed into within-plant and between-plant reallocation effects. Growth in aggregate capital deepening mainly reflects the growth occurring at individual plants. The reallocation of inputs is not a significant factor for the overall MFP growth in the 1990s. In contrast, the reallocation of inputs across plants is found to be an important factor contributing to overall MFP growth in the period from 2000 to 2006, accounting for more than half of the 0.5% growth in the aggregate MFP growth for that period. For the period from 1990 to 1999, aggregate MFP growth derives mainly from growth within plants. The reallocation of inputs is not an important factor for overall MFP growth. During the post-2000 period, when the manufacturing sector was facing adjustment challenges such as the Canada–U.S. exchange-rate appreciation, the impact of reallocation was felt considerably more.
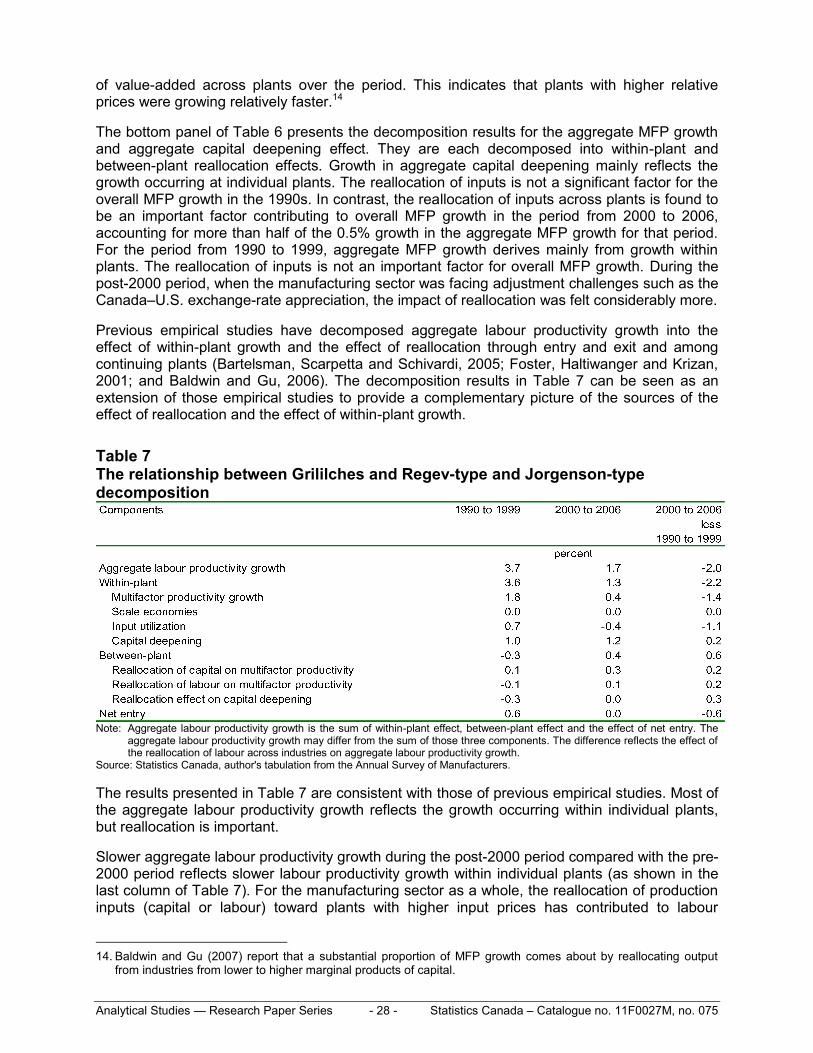
Previous empirical studies have decomposed aggregate labour productivity growth into the effect of within-plant growth and the effect of reallocation through entry and exit and among continuing plants (Bartelsman, Scarpetta and Schivardi, 2005; Foster, Haltiwanger and Krizan, 2001; and Baldwin and Gu, 2006). The decomposition results in Table 7 can be seen as an extension of those empirical studies to provide a complementary picture of the sources of the effect of reallocation and the effect of within-plant growth.
Table 7 The relationship between Grililches and Regev-type and Jorgenson-type decomposition
Note: Aggregate labour productivity growth is the sum of within-plant effect, between-plant effect and the effect of net entry. The
aggregate labour productivity growth may differ from the sum of those three components. The difference reflects the effect of the reallocation of labour across industries on aggregate labour productivity growth.
Source: Statistics Canada, author's tabulation from the Annual Survey of Manufacturers.
The results presented in Table 7 are consistent with those of previous empirical studies. Most of the aggregate labour productivity growth reflects the growth occurring within individual plants, but reallocation is important.
Slower aggregate labour productivity growth during the post-2000 period compared with the pre-2000 period reflects slower labour productivity growth within individual plants (as shown in the last column of Table 7). For the manufacturing sector as a whole, the reallocation of production inputs (capital or labour) toward plants with higher input prices has contributed to labour
14. Baldwin and Gu (2007) report that a substantial proportion of MFP growth comes about by reallocating output
from industries from lower to higher marginal products of capital.
Analytical Studies — Research Paper Series - 29 - Statistics Canada – Catalogue no. 11F0027M, no. 075
productivity growth at the aggregate level during the post-2000 period (0.6 percentage points).15 However, the benefits from the reallocation effect are not large enough to compensate for the sharp decline in labour productivity growth within individual plants (-2.2 percentage points).
Of the contribution from the within-plant effect (-2.2 percentage points), -1.1 percentage points come from declines in capacity utilization and -1.4 percentage points from declines in MFP growth. Scale economies and capital deepening contributed little to the decline in the within-plant effect. The results suggest that the slowdown in aggregate productivity growth during the 2000-to-2006 period is driven by under-utilization of production capacity and a worsening of MFP growth.
Around 55%—or 1.1 percentage points—of the 2.2-percentage-point decline in aggregate labour productivity is because of the pro-cyclical nature of productivity arising from capacity utilization. In the post-2000 period, the economy grew more slowly: the Canadian manufacturing sector contracted at an annual average rate of -0.3% in the 2000-to-2006 period compared with an average growth of 3.4% in the 1990-to-1999 period. The non-instantaneous adjustment of production inputs such as capital and labour led to excess capacity and lower productivity estimates (unobservable capacity utilization results in over-measurement of variable production inputs). In addition, the sharp increase in energy prices following the commodity boom in the post-2000 period may have made capital of earlier vintages obsolete—much as occurred in the 1970s with the first oil shock. Berndt and Wood (1984) have examined the impact of energy prices on the flow of services from a given stock of capital in this earlier period: they argue that the earlier energy price shock led to the obsolescence of capital.
Besides capacity utilization, the reduction in MFP growth is another important factor in explaining within-plant and aggregate labour productivity slowdown. MFP here reflects impacts from factors such as changes in technology, both in the organization of production and in managerial skills. When output growth slows down, so do investment and productivity growth. Growth opportunities are associated with improvements in productivity. Scott (1989) focuses on how investment facilitates learning and growth. In turn, growth facilitates experimentation with new techniques that can then be applied to inframarginal production. The results reported here suggest that growth opportunities are associated with improvements in productivity because of rising incentives to invest and boost efficiency.
The other contributor to aggregate labour productivity change was capital deepening. It contributes 1.0 percentage points of the 3.7-percentage-point growth in labour productivity in the 1990s and 1.2 percentage points of the 1.7-percentage-point growth in the post-2000 period (Table 7). While the appreciation of the Canadian dollar against the U.S. dollar post-2000 made imported capital less expensive, and was associated with more capital deepening, this source of improvement in labour productivity was too small to offset the effect of declining MFP.
The decline in aggregate productivity growth in the 2000-to-2006 period is the result of a decline of within-plant growth. Net entry also contributed to the decline. The reallocation among continuing plants, however, raised labour productivity growth in the post-2000 period.16 Its impact is greater in the post-2000 period when the manufacturing sector was adjusting to exchange rate appreciation than it was during the 1990s when the sector was expanding in response to the implementation of NAFTA. The contribution of reallocation among continuing
15. It is calculated as the sum of reallocation effects on aggregate MFP growth and on the aggregate capital
deepening effect. 16. Yin, Gu and Tang (2010) used the data from the ASM longitudinal file to decompose the aggregate labour
productivity growth in the electronic and electrical products manufacturing into the with-plant growth effect and between-plant reallocation effect. They found that the decline in within-plant growth is the dominant factor behind the slow labour productivity growth in that sector. The between-plant reallocation among incumbents and entry and exit is a not significant factor.
Analytical Studies — Research Paper Series - 30 - Statistics Canada – Catalogue no. 11F0027M, no. 075
plants to increased aggregate labour productivity growth in the 2000-to-2006 period (0.6 percentage points, Table 7) is the sum of the effect of reallocating inputs on MFP growth (0.4 percentage points) and the effect of reallocating inputs on capital deepening (0.3 percentage points).
The estimated capital income for individual plants from the ASM includes the cost of purchased services. When the capital income for individual plants are benchmarked to the capital income estimates in the KLEMS and adjusted capital income is used as a proxy for capacity utilization, the adjusted share of capital income in GDP is found to decline at a faster rate. The deceleration in labour productivity growth and MFP growth from the 1990-to-1999 period to the 2000-to-2006 period is found to be entirely accounted for by the changes in capacity utilization and development of excess capacity in the period from 2000 to 2006. Within-plant MFP growth actually increased between the two periods (Table 11 in the Appendix).
The results from alternative measures of capacity utilization suggest that the development of excess capacity accounted for a least half of the decline in aggregate labour productivity growth. The remainder was mostly accounted for by the declining MFP growth at the plant level.
5.3 Robustness check
The decomposition results presented in the previous section are based on the estimates of scale economies and the effect of capacity utilization from estimating equation (6) that relates the output growth to input growth and changes in capacity utilization. The equation is the first difference of the following Cobb–Douglas production function:
ln ln ln ln ( ),it it it it t i it itV K L a e m (18)
where t is a year-fixed effect. The equation includes three error terms: i is an unobserved
plant fixed effect, it is a possibly autoregressive productivity shock, and itm reflects serially
uncorrelated measurement errors. The returns to scale is the sum of the coefficients on capital
and labour inputs, and .
The first-differenced equation (6) eliminates the unobserved plant-specific effects in equation (18). If error terms are uncorrelated with the input and capacity utilization variables, the first-difference estimates from equation (6) are unbiased. However, the error terms could be correlated with the regressors. For example, a negative productivity shock could lead to a loss in market shares of Canadian firms in international markets, which in turn would lead to the decline in input utilization. If the error terms are correlated with the input variables and the capacity utilization variable, the first-difference estimates will be biased—though whether this is important for our purpose is an empirical issue.
To address the impact of the possible endogeneity of the error terms in the production function, we employed the System-generalized method of moments (SYS-GMM) and Difference (DIFF)-GMM estimation methods (Blundell and Bond, 2000 and Arellano and Bond, 1991).
The sample used when employing GMM methods consists of all plants in the ASM longitudinal file that existed for at least five years in the period from 1990 to 2006. The sample of plants that existed for at least 10 years or in all years during the sample period is also employed; the resulting estimates are similar.
The estimates of the degree of returns to scale and the effect of capacity utilization are presented in Table 12 in the Appendix. The estimates are derived using SYS-GMM and
Analytical Studies — Research Paper Series - 31 - Statistics Canada – Catalogue no. 11F0027M, no. 075
DIFF-GMM allowing for AR(1) error in the level equation.17 The Arellano and Bond test of second-order and third-order serial correlation both reject serial correlation in the differenced equation in most industries. However, the Sargan test rejects the null hypothesis that the overidentifying restrictions are valid. As the Sargan test is prone to weakness, its results may not necessarily mean that the instruments in the GMM estimator are invalid.
The estimated degree of returns to scale from the SYS-GMM and DIFF-GMM is slightly lower than the estimate from the first difference estimates, whereas the estimated effect of capacity utilization is higher than the first-difference estimates.
The results of the decomposition of aggregate labour productivity growth in the manufacturing sector using the estimates from SYS-GMM and DIFF-GMM estimation are presented in Table 13 in the Appendix. Overall, the conclusions are even more striking regarding the importance of capacity utilization compared with those obtained using the first-difference estimates and a simpler statistical technique. With this approach, about 90% of the post-2000 decline in labour productivity growth is because of the changes in capacity utilization, compared with some 55% using the benchmark method.
Choosing between these two estimates requires a decision: should the simpler method be adopted that has been found to be robust to numerous problems if data are less than perfect or if functional forms are only approximations to reality; or should a more complex method be adopted that focuses on the possible existence of one particular problem and offers a superior estimate. However, for our purposes, this choice is not necessary. This paper to simply notes the importance of considering the impact of changing capacity utilization on our interpretation of changes in labour productivity. Together, the two techniques used here provide a lower bound of at least 55% of the decline in labour productivity caused by the economic environment that raised excess capacity over the post-2000 period. More importantly, at least one of the variants show that MFP growth over this period continued to be positive, not negative.
6 Contributions of exporters versus non-exporters and foreign- versus domestic-controlled plants
Together, the changes in the economic environment and the importance of excess capacity suggest that changes in the trading environment are a primary cause behind the slowdown in productivity growth post 2000. To corroborate this interpretation, we examined differences in the direct contribution of exporters and non-exporters and foreign- and domestic-controlled plants to aggregate labour productivity growth.
Canada is a trade-dependent country. In 2006, the ratio of merchandise exports to GDP was 0.33, and some 84% of merchandise exports were destined for the U.S. market (Table 2).
To investigate how the expansion and contraction in export markets impacted aggregate productivity growth, continuing plants in a period are classified into four types according to their export status over the period: continuing exporters that export at both the start and end of the period; entrants to export markets over the period; exiters from export markets; and plants that did not export at both the start and end of the period.
17. SYS-GMM and Difference-GMM without AR(1) error were employed. But the Arellano and Bond (1991) test does
not reject the second- and third-order serial correlation in the differenced equation. The Levinsohn–Petrin estimation technique (Levinsohn and Petrin, 2003) was also employed. But the estimated degree of returns to scale was unreasonably low in the latter. This may be because of the collinearity problem associate with Levinsohn–Petrin estimation as shown by Ackerberg, Caves and Frazer (2005). If the LP estimate had been employed in the decomposition analysis, the productivity slowdown resulted from a failure to exploit economies of scale rather than excess short-run capacity. The implications as to how we interpret the post-2000 slowdown are not greatly affected one way or the other.
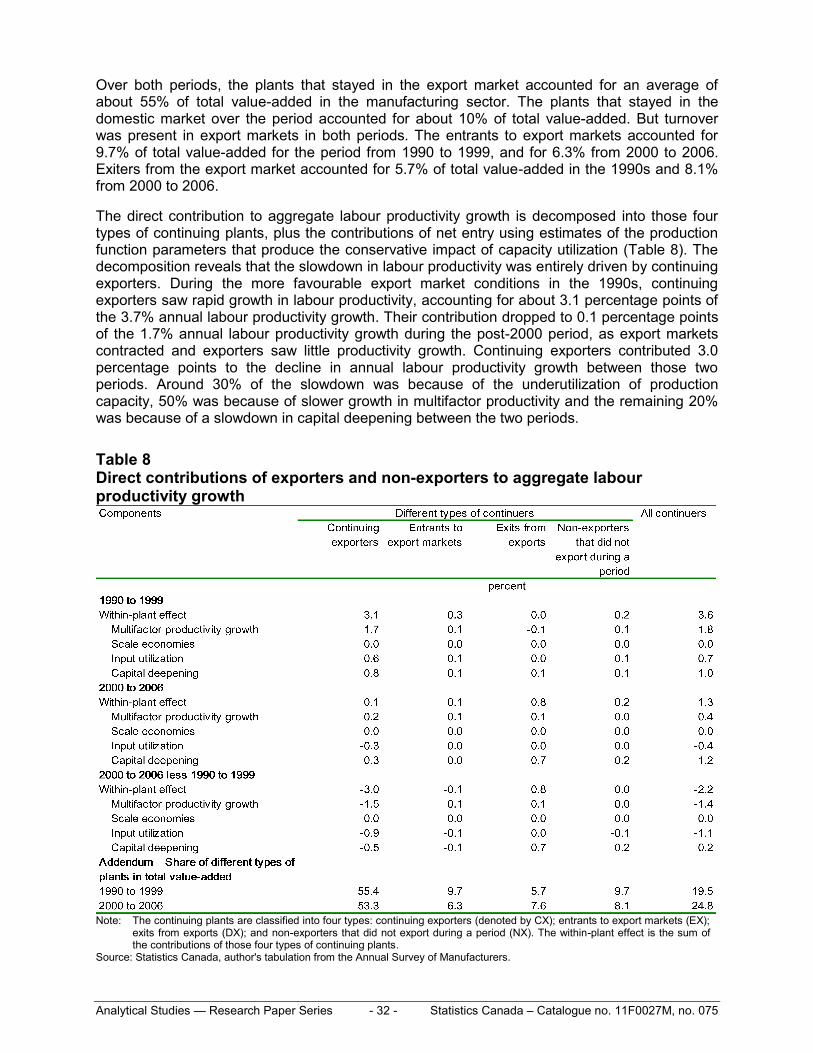
Analytical Studies — Research Paper Series - 32 - Statistics Canada – Catalogue no. 11F0027M, no. 075
Over both periods, the plants that stayed in the export market accounted for an average of about 55% of total value-added in the manufacturing sector. The plants that stayed in the domestic market over the period accounted for about 10% of total value-added. But turnover was present in export markets in both periods. The entrants to export markets accounted for 9.7% of total value-added for the period from 1990 to 1999, and for 6.3% from 2000 to 2006. Exiters from the export market accounted for 5.7% of total value-added in the 1990s and 8.1% from 2000 to 2006.
The direct contribution to aggregate labour productivity growth is decomposed into those four types of continuing plants, plus the contributions of net entry using estimates of the production function parameters that produce the conservative impact of capacity utilization (Table 8). The decomposition reveals that the slowdown in labour productivity was entirely driven by continuing exporters. During the more favourable export market conditions in the 1990s, continuing exporters saw rapid growth in labour productivity, accounting for about 3.1 percentage points of the 3.7% annual labour productivity growth. Their contribution dropped to 0.1 percentage points of the 1.7% annual labour productivity growth during the post-2000 period, as export markets contracted and exporters saw little productivity growth. Continuing exporters contributed 3.0 percentage points to the decline in annual labour productivity growth between those two periods. Around 30% of the slowdown was because of the underutilization of production capacity, 50% was because of slower growth in multifactor productivity and the remaining 20% was because of a slowdown in capital deepening between the two periods.
Table 8 Direct contributions of exporters and non-exporters to aggregate labour productivity growth
Note: The continuing plants are classified into four types: continuing exporters (denoted by CX); entrants to export markets (EX);
exits from exports (DX); and non-exporters that did not export during a period (NX). The within-plant effect is the sum of the contributions of those four types of continuing plants.
Source: Statistics Canada, author's tabulation from the Annual Survey of Manufacturers.
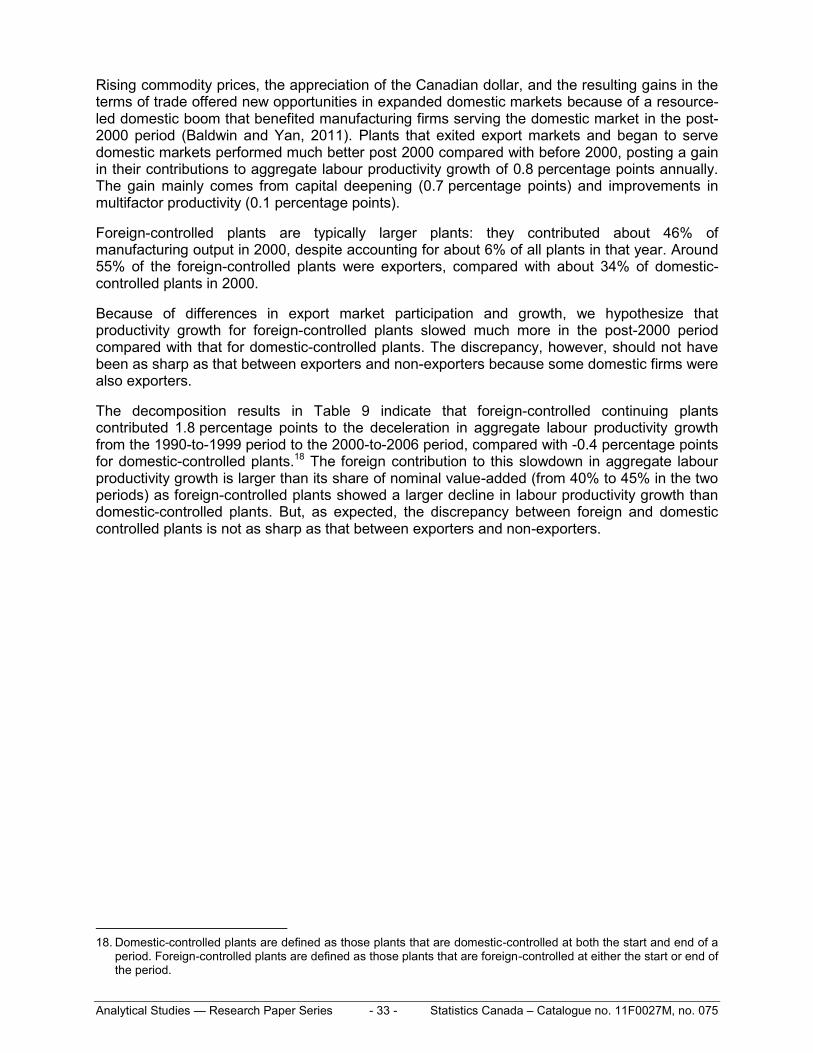
Analytical Studies — Research Paper Series - 33 - Statistics Canada – Catalogue no. 11F0027M, no. 075
Rising commodity prices, the appreciation of the Canadian dollar, and the resulting gains in the terms of trade offered new opportunities in expanded domestic markets because of a resource-led domestic boom that benefited manufacturing firms serving the domestic market in the post-2000 period (Baldwin and Yan, 2011). Plants that exited export markets and began to serve domestic markets performed much better post 2000 compared with before 2000, posting a gain in their contributions to aggregate labour productivity growth of 0.8 percentage points annually. The gain mainly comes from capital deepening (0.7 percentage points) and improvements in multifactor productivity (0.1 percentage points).
Foreign-controlled plants are typically larger plants: they contributed about 46% of manufacturing output in 2000, despite accounting for about 6% of all plants in that year. Around 55% of the foreign-controlled plants were exporters, compared with about 34% of domestic-controlled plants in 2000.
Because of differences in export market participation and growth, we hypothesize that productivity growth for foreign-controlled plants slowed much more in the post-2000 period compared with that for domestic-controlled plants. The discrepancy, however, should not have been as sharp as that between exporters and non-exporters because some domestic firms were also exporters.
The decomposition results in Table 9 indicate that foreign-controlled continuing plants contributed 1.8 percentage points to the deceleration in aggregate labour productivity growth from the 1990-to-1999 period to the 2000-to-2006 period, compared with -0.4 percentage points for domestic-controlled plants.18 The foreign contribution to this slowdown in aggregate labour productivity growth is larger than its share of nominal value-added (from 40% to 45% in the two periods) as foreign-controlled plants showed a larger decline in labour productivity growth than domestic-controlled plants. But, as expected, the discrepancy between foreign and domestic controlled plants is not as sharp as that between exporters and non-exporters.
18. Domestic-controlled plants are defined as those plants that are domestic-controlled at both the start and end of a
period. Foreign-controlled plants are defined as those plants that are foreign-controlled at either the start or end of the period.
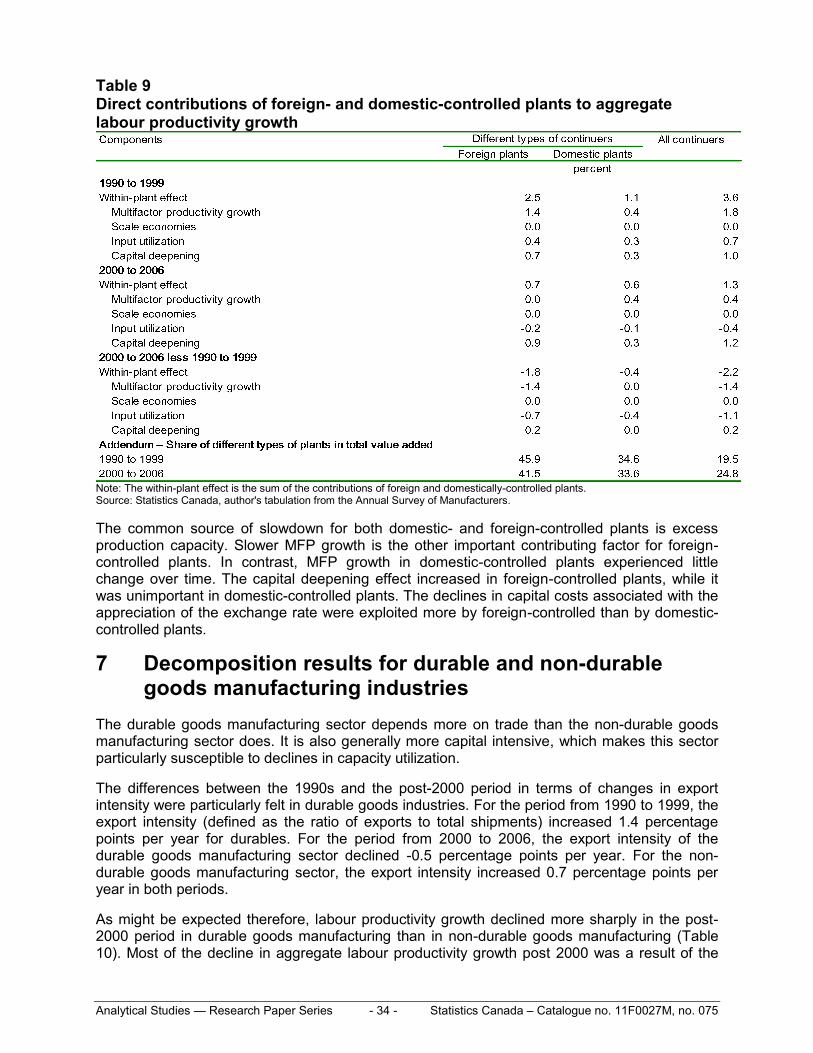
Analytical Studies — Research Paper Series - 34 - Statistics Canada – Catalogue no. 11F0027M, no. 075
Table 9 Direct contributions of foreign- and domestic-controlled plants to aggregate labour productivity growth
Note: The within-plant effect is the sum of the contributions of foreign and domestically-controlled plants. Source: Statistics Canada, author's tabulation from the Annual Survey of Manufacturers.
The common source of slowdown for both domestic- and foreign-controlled plants is excess production capacity. Slower MFP growth is the other important contributing factor for foreign-controlled plants. In contrast, MFP growth in domestic-controlled plants experienced little change over time. The capital deepening effect increased in foreign-controlled plants, while it was unimportant in domestic-controlled plants. The declines in capital costs associated with the appreciation of the exchange rate were exploited more by foreign-controlled than by domestic-controlled plants.
7 Decomposition results for durable and non-durable goods manufacturing industries
The durable goods manufacturing sector depends more on trade than the non-durable goods manufacturing sector does. It is also generally more capital intensive, which makes this sector particularly susceptible to declines in capacity utilization.
The differences between the 1990s and the post-2000 period in terms of changes in export intensity were particularly felt in durable goods industries. For the period from 1990 to 1999, the export intensity (defined as the ratio of exports to total shipments) increased 1.4 percentage points per year for durables. For the period from 2000 to 2006, the export intensity of the durable goods manufacturing sector declined -0.5 percentage points per year. For the non-durable goods manufacturing sector, the export intensity increased 0.7 percentage points per year in both periods.
As might be expected therefore, labour productivity growth declined more sharply in the post-2000 period in durable goods manufacturing than in non-durable goods manufacturing (Table 10). Most of the decline in aggregate labour productivity growth post 2000 was a result of the
Analytical Studies — Research Paper Series - 35 - Statistics Canada – Catalogue no. 11F0027M, no. 075
decline in labour productivity growth at continuing plants in both durable and non-durable goods manufacturing. The reallocation effect within continuing plants increased from the 1990s to the post-2000 period. The effect of entry and exit declined over the two periods.
Table 10 Sources of aggregate labour productivity growth in durable and non-durable manufacturing
Source: Statistics Canada, author's tabulation from the Annual Survey of Manufacturers.
The decline in the within-plant component in the durable goods manufacturing sector in the post-2000 period can be traced to the declines in MFP growth, capital deepening and input utilization. The decline in the within-plant component in non-durable manufacturing in the post-2000 period reflects the declines in MFP growth and input utilization. The capital deepening effect increased in the post-2000 period in the non-durable goods manufacturing sector.
8 Conclusion
The Canadian manufacturing sector underwent considerable restructuring as a result of the development of excess capacity and the slowdown in export growth in the post-2000 period. This paper demonstrates the close connection between this restructuring and the slowdown in productivity growth for that period.
The decomposition of overall productivity growth into its components reveals that most, if not all, of the decline in aggregate labour productivity growth was a result of the decline in labour productivity growth within plants and not from the restructuring and reallocation of resources. Also, most of this decline came from an emergence of excess capacity. While differences in our estimates of the exact proportion originating from excess capacity depend on the estimation technique used, these differences do not affect the overall conclusion that deteriorating productivity performance in manufacturing during the 1990s stems largely from the economic conditions that led to the development of excess capacity.
The effect of net entry also slowed down in the post-2000 period, contributing to the post-2000 labour productivity growth slowdown. In a related paper, Baldwin and Yan (2011) demonstrate that much of this decline in the effect of net entry was also associated with the appreciation of the Canadian dollar in that period. The appreciation of the Canadian dollar in the post-2000 period led to the exit of a large number of exporters that are relatively more productive and larger. As a result, the exitors in that period were as productive as the entrants: the process of entry and exit contributed little to productivity growth. The reallocation of inputs within continuing plants did not decline during the post-2000 period, and was not a factor in the decline in labour
Analytical Studies — Research Paper Series - 36 - Statistics Canada – Catalogue no. 11F0027M, no. 075
productivity growth post 2000. Indeed, the positive impact of reallocation rose post 2000, but not sufficiently to offset the impact of increases in excess capacity.
The source of this impact of excess capacity was the export markets. Almost all of the aggregate labour productivity growth slowdown after 2000 was driven by exporters. The decline in labour productivity growth was more pronounced in foreign-controlled plants than domestic-controlled plants, as foreign-controlled plants are more export-oriented. The decline was also more pronounced in durable goods manufacturing than non-durable goods manufacturing, a result of relatively high export intensity in durable goods manufacturing and the capital intensity of its production process, which makes its performance especially sensitive to the emergence of excess capacity.
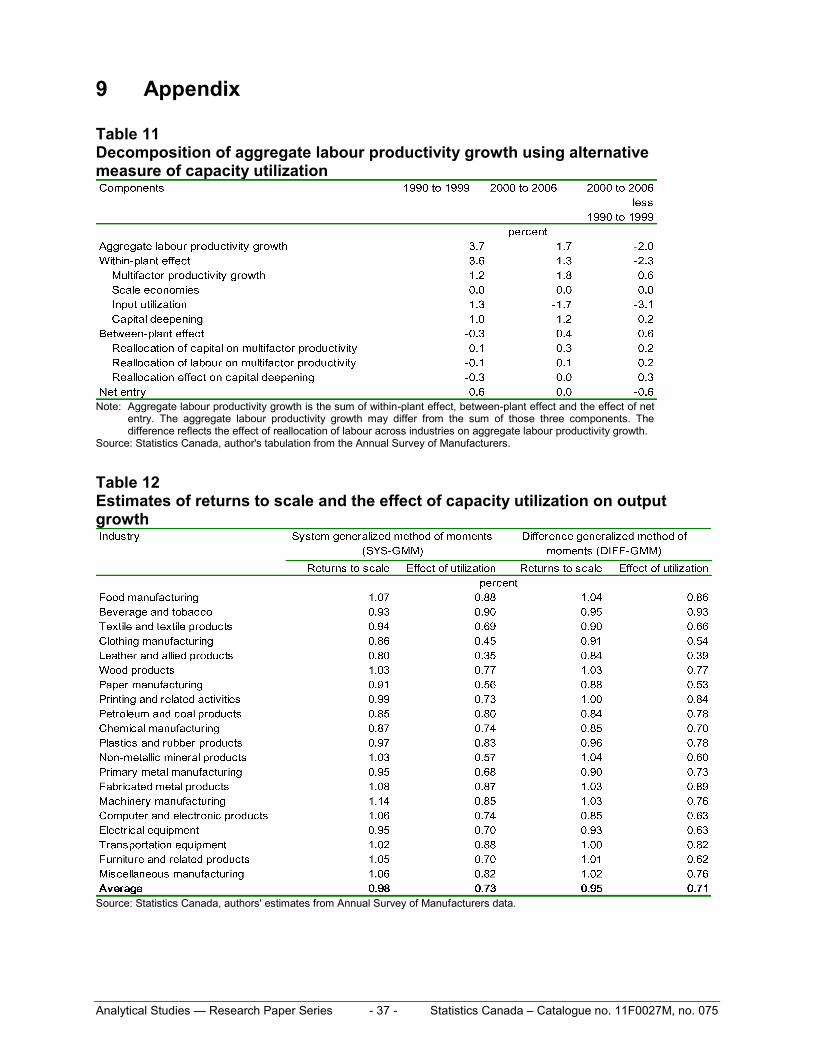
Analytical Studies — Research Paper Series - 37 - Statistics Canada – Catalogue no. 11F0027M, no. 075
9 Appendix
Table 11 Decomposition of aggregate labour productivity growth using alternative measure of capacity utilization
Note: Aggregate labour productivity growth is the sum of within-plant effect, between-plant effect and the effect of net
entry. The aggregate labour productivity growth may differ from the sum of those three components. The difference reflects the effect of reallocation of labour across industries on aggregate labour productivity growth.
Source: Statistics Canada, author's tabulation from the Annual Survey of Manufacturers.
Table 12 Estimates of returns to scale and the effect of capacity utilization on output growth
Source: Statistics Canada, authors' estimates from Annual Survey of Manufacturers data.
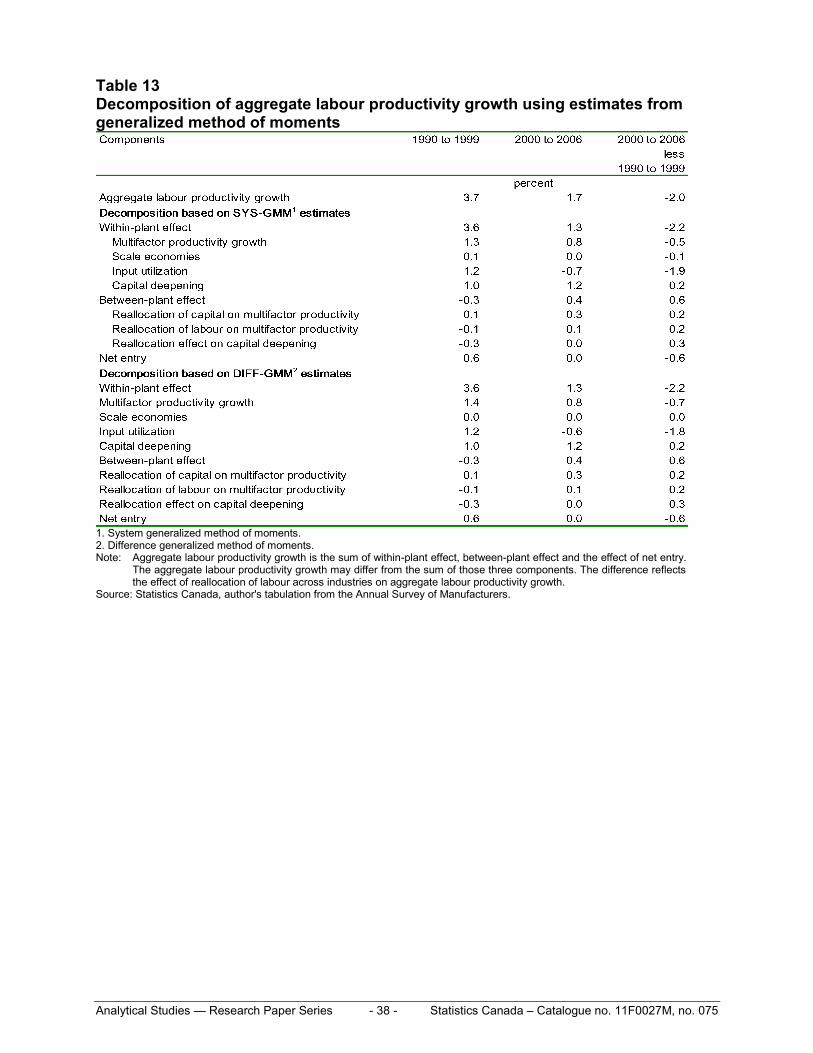
Analytical Studies — Research Paper Series - 38 - Statistics Canada – Catalogue no. 11F0027M, no. 075
Table 13 Decomposition of aggregate labour productivity growth using estimates from generalized method of moments
1. System generalized method of moments. 2. Difference generalized method of moments. Note: Aggregate labour productivity growth is the sum of within-plant effect, between-plant effect and the effect of net entry.
The aggregate labour productivity growth may differ from the sum of those three components. The difference reflects the effect of reallocation of labour across industries on aggregate labour productivity growth.
Source: Statistics Canada, author's tabulation from the Annual Survey of Manufacturers.
Analytical Studies — Research Paper Series - 39 - Statistics Canada – Catalogue no. 11F0027M, no. 075
References
Ackerberg, D. A., K. Caves and G. Frazer. 2005. Structural identification of production functions. Applied Micro Summer Lunch Series. Yale Department of Economics. New Haven, New Jersey. http://www.econ.yale.edu/seminars/apmicro/am05/ackerberg-050421.pdf.
Arellano, M. and S. Bond. 1991. ―Some Tests of Specification for Panel Data: Monte Carlo Evidence and an Application to Employment Equations.‖ Review of Economic Studies. Vol. 14. p. 277–297.
Baily, M.N., R.J. Gordon and R.M. Solow. 1981. ―Productivity and the Services of Capital and Labour.‖ Brookings Papers on Economic Activity. No. 1. p. 1–65.
Baldwin, J.R., P. Gorecki, R. E. Caves, T. Dunne and J. Haltiwanger. 1995. The Dynamics of Industrial Competition: A North American Perspective. Cambridge, Massachusetts. Cambridge University Press.
Baldwin, J.R. and W. Gu. 2006. ―Plant Turnover and Productivity Growth in Canadian Manufacturing.‖ Industrial and Corporate Change. Vol. 5. No. 3. p. 417–465.
Baldwin, J.R. and W. Gu. 2007. Multifactor Productivity in Canada: An Evaluation of Alternative Methods of Estimating Capital Services. Statistics Canada, Catalogue no. 15-206-X. Ottawa. Canadian Productivity Review. No. 9.
Baldwin, J.R. and W. Gu. 2009. ―Productivity Performance in Canada, 1961 to 2008: An Update on Long-term Trends‖. Canadian Productivity Review. Statistics Canada, Catalogue no. 15-206-X. Ottawa.. No. 25.
Baldwin, J.R. and W. Gu. 2011. ―Firm Dynamics and Productivity Growth: A Comparison of the Retail Trade and Manufacturing Sectors.‖ Industrial and Corporate Change. Vol. 20. No. 2. p. 367–395.
Baldwin, J.R. and B. Yan. 2011. ―Export Market Dynamics and Plant-level Productivity: Impact of Tariff Reductions and Exchange Rate Cycles.‖ Scandinavian Journal of Economics. Forthcoming.
Bartelsman, E.J., S. Scarpetta and F. Schivardi. 2005. ―Comparative Analysis of Firm Demographics and Survival: Evidence from Micro-level Sources in OECD Countries.‖ Industrial and Corporate Change. Vol. 14. No 3. p. 365–391.
Basu, S. 1996. ―Procyclical productivity increasing returns or cyclical utilization.‖ The Quarterly Journal of Economics. Vol. 111. No. 3. p. 719–751.
Basu. S. and J.G. Fernald. 1997. ―Returns to Scale in U.S. Production: Estimates and Implications.‖ Journal of Political Economy. Vol. 105. No. 2. p. 249–283.
Basu. S. and J.G. Fernald. 2001. ―Why is Productivity Procyclical? Why do We Care?‖ New Development in Productivity Analysis. C.R. Hulten, E.R. Dean and M.J. Harper (eds). Chicago. The University of Chicago Press. p. 225–301.
Basu. S. and J.G. Fernald. 2002. ―Aggregate Productivity and Aggregate Technology.‖ European Economic Review. Vol. 46. No. 6. p. 963–991.
Analytical Studies — Research Paper Series - 40 - Statistics Canada – Catalogue no. 11F0027M, no. 075
Basu, S., L. Pascali, F. Schiantarelli and L. Serven. 2009. Productivity, Welfare and Reallocation: Theory and Plant-level Evidence. Cambridge, Massachusetts. National Bureau of Economic Research Working Paper. No. 15579.
Beaulieu, J.J. and J. Mattey. 1998. ―The work week of capital and capital utilization in manufacturing.‖ Journal of Productivity Analysis. Vol. 10. No. 2. p. 199–223.
Beckstead, D. and W.M. Brown. 2005. ―An Anatomy of Growth and Decline: High-tech Industries Through the Boom and Bust Years, 1997–2003‖. Insights on the Canadian Economy. Statistics Canada, Catalogue no. 11-624-M. Ottawa. No 10.
Berndt, E.R. and M.A. Fuss. 1982. Productivity Measurement using Capital Asset Valuation to Adjust for Variations in Utilization. Cambridge, Massachusetts. National Bureau of Economic Research Working Paper. No. 895.
Berndt, E.R. and D.M. Hess. 1986. ―Measuring and Assessing Capacity Utilization in the Manufacturing Sectors of Nine OECD Countries.‖ European Economic Review. Vol. 30. No. 5. p. 961–989.
Berndt. E.R. and D.O. Wood. 1984. Energy Prices Changes and the Induced Revaluation of Durable Capital in the United States Manufacturing during the OPED Decade. MIT Center for Energy Policy Research.
Blundell, R. and S. Bond. 1998. ―Initial Conditions and Moment Restrictions in Dynamic Panel Data.‖ Journal of Econometrics. Vol. 87. No. 1. p. 115–143.
Blundell, R. and S. Bond. 2000. ―GMM Estimation with Persistent Panel Data: an Application to Production Functions.‖ Econometric Reviews. Vol. 19. No. 3. p. 321–340.
Bun, M.J.G. and F. Windmeijer. 2007. The Weak Instrument Problem of the System GMM Estimator in Dynamics Panel Data Models. Bristol, United Kingdom. University of Bristol Discussion Paper. No. 07/595.
Burnside, C., M. Eichenbaum and S. Rebelo. 1995. ―Capital utilization and returns to scale.‖ NBER Macroeconomics Annual 1995. B.S. Bernanke and J.J. Rotemberg (eds). Cambridge, Massachusetts. MIT Press. p. 67–110.
Denison, E. F. 1979. Accounting for Slower Economic Growth: The United States in the 1970's, Washington, DC: The Brookings Institution.
Foster, L., J. Haltiwanger and C.J. Krizan. 2001. ―Aggregate Productivity: Lessons from Microeconomic Evidence.‖ New Developments in Productivity Analysis. C.R. Hulten, E.R. Dean and M.J. Harper (eds). Chicago. University of Chicago Press. p. 303–372.
Foster, L., J. Haltiwanger and C.J. Krizan. 2006. ―Market Selection, Reallocation and Restructuring in the U.S. Retail Trade Sector in the 1990s.‖ Review of Economics and Statistics. Vol. 88. No. 4. p. 748–758.
Griliches, Z. and H. Regev. 1995. ―Firm productivity in Israeli industry 1979-1988.‖ Journal of Econometrics. Vol. 65. No. 1. p. 175–203.
Hall, R.E. 1988. ―The Relation between Price and Marginal Cost in U.S. Industries.‖ Journal of Political Economy. Vol. 96. No. 5. p. 921–947.
Analytical Studies — Research Paper Series - 41 - Statistics Canada – Catalogue no. 11F0027M, no. 075
Hall, R.E. 1990. ―Invariance Properties of Solow‘s Productivity Residual.‖ Growth-Productivity-Employment: Essays to Celebrate Bob Solow’s Birthday. P. Diamond (ed). Cambridge, Massachusetts. MIT Press. p. 71–112.
Jorgenson, D.W. 1966. ―Embodiment Hypothesis.‖ Journal of Political Economy. Vol. 74. No. 1. p. 1–17.
Jorgenson, D.W. 1990. ―Productivity and Productivity Growth.‖ Fifty Years of Economic Measurement. E.R. Berndt and J.E. Triplett (eds.). Chicago: University of Chicago Press. p. 19–117.
Jorgenson, D.W., F.M. Gollop and B.M. Fraumeni. 1987. Productivity and U.S. Economic Growth. Cambridge, Massachusetts. Harvard University Press.
Jorgenson, D.W., M.S. Ho and K.J. Stiroh. 2005. Productivity Volume 3: Information Technology and the American Growth Resurgence. Cambridge, Massachusetts. MIT Press.
Jorgenson, D.W., M.S. Ho, J.D. Samuels and K.J. Stiroh. 2007. ―Industry Origins of the American Productivity Resurgence.‖ Economic Systems Research. Vol. 19. No. 3. p. 229–252.
Kaldor, N. 1966, Causes of the Slow Rate of Economic Growth of the United Kingdom. Cambridge University Press.
Levinsohn, J. and A. Petrin. 2003. ―Estimating production functions using inputs to control for unobservables.‖ Review of Economic Studies. Vol. 70. No. 2. p. 317–341.
Macdonald, R. 2009. ―The Terms of Trade in Central Canada.‖ Insights on the Canadian Economy. Statistics Canada, Catalogue no. 11-624-M. Ottawa No. 22.
Petrin, A., T.K. White and J.P. Reiter. 2009. The Impact of Plant-level Resource Reallocations and Technical Progress on U.S. Macro Economic Growth. Washington, DC. U.S. Census Bureau Center for Economic Studies Working Papers. No. 09-43.
Petrin, A. and J. Levinsohn. 2010. ―Measuring Aggregate Productivity Growth using Plant-level Data.‖ Forthcoming.
Roy, F. and C. Kimanyi. 2007. ―Canada‘s Changing Auto Industry.‖ Canadian Economic Observer. Statistics Canada, Catalogue no. 11-010-X. Vol. 20. No. 5.
Organisation for Economic Co-operation and Development (OECD). 2001. OECD Manual: Measuring Productivity. Paris. OECD.
Scott, M.C. 1989. A New View of Economic Growth. New York. Oxford University Press.
Sharpe, A. and E. Thomson. 2010. ―Insights into Canada‘s Abysmal Post-2000 Productivity Performance from Decompositions of Labour Productivity Growth by Industry and Province.‖ 44th Annual Meeting of the Canadian Economics Association. Québec, Quebec. May 28 to 30.
Syverson, C. 2010. What Determines Productivity. Cambridge, Massachusetts. National Bureau of Economic Research Working Paper. No. 15712.
Tomlin, B. 2010. Exchange Rate Volatility, Plant Turnover and Productivity. Boston. Boston University Department of Economics.
Analytical Studies — Research Paper Series - 42 - Statistics Canada – Catalogue no. 11F0027M, no. 075
http://people.bu.edu/btomlin/Ben_Tomlin_files/Tomlin%20-%20ExchangeRateVolatility.pdf.
Trefler, D. 2004. ―The Long and Short of the Canada–U.S. Free Trade Agreement.‖ American Economic Review. Vol. 94. No. 4. p. 870–895.
Verdoorn, P.J. 1980, ―Verdoorn‘s Law in Retrospect: a comment,‖ Economic Journal. Vol. 90. No. 358. p. 382–385.
Yin, K.K., W. Gu and J. Tang. 2010. ―Industry Mix, Plant Turnover and Productivity Growth: A Case Study of the Electronic and Electrical Product Manufacturing Industry.‖ 44th Annual Meeting of the Canadian Economics Association. Québec, Quebec. May 28 to 30.