Embed Size (px)
Citation preview
Technische Universität München
Fakultät für Informatik
Bachelorarbeit in Informatik
A framework for remote usability evaluation
on mobile devices
Daniel Bader

Technische Universität München
Fakultät für Informatik
Bachelorarbeit in Informatik
A framework for remote usability evaluation
on mobile devices
Ein Framework für Remote Usability
Evaluation auf mobilen Geräten
Author: Daniel BaderSupervisor: Prof. Bernd Brügge, PhD.Advisors: Dipl.-Inf. Univ. Dennis Pagano
Dipl.-Inf. Univ. Damir Ismailović
Submission Date: February 28, 2011

I assure the single handed composition of this bachelor’s thesis only sup-ported by declared resources.
Date, Signature: . . . . . . . . . . . . . . . . . . . . . . . . . . . . . . . . . . . . . . . . . .(Daniel Bader)

Abstract
On mobile platforms, such as Google Android and Apple iOS, few software frameworksare available that support remote usability evaluation methods. Nevertheless, remoteusability evaluation methods are an interesting area for research because they can bepartly automated, thereby making them very time- and cost-efficient. In this thesis wepropose a software, the muEvaluationFramework, that allows remote usability evaluationon mobile platforms and supports automation in the capture, analysis and critique phasesof an usability evaluation. To demonstrate the abilities of the framework, we provide anapplication-independent prototypical implementation for the Apple iOS platform.
I

Kurzfassung
Auf mobilen Plattformen, wie zum Beispiel Google Android und Apple iOS, sind kaumSoftwareframeworks verfügbar welche die Durchführung von Remote Usability Evalua-tionen unterstützen. Methoden der Remote Usability Evaluation sind ein interessantesForschungsfeld da es möglich ist, sie teilweise zu automatisieren. Dadurch werden dieseMethoden sehr zeit- und kosteneffizient. In dieser Bachelorarbeit beschreiben wir eineSoftwarelösung, das muEvaluationFramework, welches die Durchführung von Remote Us-ability Evaluationen auf mobilen Geräten unterstützt und eine Automatisierung in derAufzeichnungs-, der Analyse- und der Kritikphase einer Usability Evaluation ermöglicht.Um die Fähigkeiten des Frameworks zu demonstrieren, stellen wir eine applikationsunab-hängige prototypische Implementierung für Apple iOS zu Verfügung.
III

Acknowledgment
I am grateful to my supervisors Dennis Pagano and Damir Ismailović for their strongsupport throughout the writing of my thesis.
V

Contents
1 Introduction 11.1 Problem statement . . . . . . . . . . . . . . . . . . . . . . . . . . . . . . . 11.2 Outline . . . . . . . . . . . . . . . . . . . . . . . . . . . . . . . . . . . . . . 21.3 Document conventions . . . . . . . . . . . . . . . . . . . . . . . . . . . . . 31.4 Foundations . . . . . . . . . . . . . . . . . . . . . . . . . . . . . . . . . . . 3
1.4.1 Usability of mobile applications . . . . . . . . . . . . . . . . . . . . 31.4.2 Usability evaluation . . . . . . . . . . . . . . . . . . . . . . . . . . . 51.4.3 Common usability evaluation activities . . . . . . . . . . . . . . . . 51.4.4 Remote usability evaluation . . . . . . . . . . . . . . . . . . . . . . 61.4.5 Automated usability testing . . . . . . . . . . . . . . . . . . . . . . 7
2 Requirements specification 92.1 Objectives . . . . . . . . . . . . . . . . . . . . . . . . . . . . . . . . . . . . 92.2 Related work . . . . . . . . . . . . . . . . . . . . . . . . . . . . . . . . . . 9
2.2.1 MultiDevice RemUsine . . . . . . . . . . . . . . . . . . . . . . . . . 92.2.2 EvaHelper Framework . . . . . . . . . . . . . . . . . . . . . . . . . 102.2.3 Google Analytics for Mobile . . . . . . . . . . . . . . . . . . . . . . 112.2.4 Summary . . . . . . . . . . . . . . . . . . . . . . . . . . . . . . . . 12
2.3 Scenarios . . . . . . . . . . . . . . . . . . . . . . . . . . . . . . . . . . . . . 122.3.1 Problem scenario . . . . . . . . . . . . . . . . . . . . . . . . . . . . 132.3.2 Visionary scenario . . . . . . . . . . . . . . . . . . . . . . . . . . . 142.3.3 Demo scenario . . . . . . . . . . . . . . . . . . . . . . . . . . . . . . 16
2.4 Functional requirements . . . . . . . . . . . . . . . . . . . . . . . . . . . . 172.4.1 Capture phase support . . . . . . . . . . . . . . . . . . . . . . . . . 182.4.2 Analysis phase support . . . . . . . . . . . . . . . . . . . . . . . . . 192.4.3 Critique phase support . . . . . . . . . . . . . . . . . . . . . . . . . 20
2.5 Nonfunctional requirements . . . . . . . . . . . . . . . . . . . . . . . . . . 212.5.1 Usability . . . . . . . . . . . . . . . . . . . . . . . . . . . . . . . . . 212.5.2 Reliability . . . . . . . . . . . . . . . . . . . . . . . . . . . . . . . . 222.5.3 Security . . . . . . . . . . . . . . . . . . . . . . . . . . . . . . . . . 222.5.4 Privacy . . . . . . . . . . . . . . . . . . . . . . . . . . . . . . . . . 22
VII
2.5.5 Performance . . . . . . . . . . . . . . . . . . . . . . . . . . . . . . . 222.5.6 Supportability . . . . . . . . . . . . . . . . . . . . . . . . . . . . . . 222.5.7 Implementation requirements . . . . . . . . . . . . . . . . . . . . . 22
2.6 System models . . . . . . . . . . . . . . . . . . . . . . . . . . . . . . . . . 232.6.1 Use case model . . . . . . . . . . . . . . . . . . . . . . . . . . . . . 232.6.2 Object model . . . . . . . . . . . . . . . . . . . . . . . . . . . . . . 252.6.3 Dynamic model . . . . . . . . . . . . . . . . . . . . . . . . . . . . . 37
2.7 User interface . . . . . . . . . . . . . . . . . . . . . . . . . . . . . . . . . . 41
3 System design 473.1 Design goals . . . . . . . . . . . . . . . . . . . . . . . . . . . . . . . . . . . 473.2 Subsystem decomposition . . . . . . . . . . . . . . . . . . . . . . . . . . . 47
3.2.1 Proposed software architecture . . . . . . . . . . . . . . . . . . . . . 483.2.2 Capture subsystem . . . . . . . . . . . . . . . . . . . . . . . . . . . 493.2.3 Analysis subsystem . . . . . . . . . . . . . . . . . . . . . . . . . . . 513.2.4 Critique subsystem . . . . . . . . . . . . . . . . . . . . . . . . . . . 51
3.3 Hardware/software mapping . . . . . . . . . . . . . . . . . . . . . . . . . . 523.4 Persistent data management . . . . . . . . . . . . . . . . . . . . . . . . . . 54
4 Object design 554.1 Interface documentation guidelines . . . . . . . . . . . . . . . . . . . . . . 554.2 Subsystems . . . . . . . . . . . . . . . . . . . . . . . . . . . . . . . . . . . 55
4.2.1 Capture subsystem . . . . . . . . . . . . . . . . . . . . . . . . . . . 564.2.2 Analysis subsystem . . . . . . . . . . . . . . . . . . . . . . . . . . . 644.2.3 Critique subsystem . . . . . . . . . . . . . . . . . . . . . . . . . . . 67
5 Prototypical implementation 715.1 Overview . . . . . . . . . . . . . . . . . . . . . . . . . . . . . . . . . . . . . 715.2 Capture support . . . . . . . . . . . . . . . . . . . . . . . . . . . . . . . . 715.3 Analysis support . . . . . . . . . . . . . . . . . . . . . . . . . . . . . . . . 735.4 Critique support . . . . . . . . . . . . . . . . . . . . . . . . . . . . . . . . 74
6 Future work 776.1 Evaluation of a real product . . . . . . . . . . . . . . . . . . . . . . . . . . 776.2 Web-based automated usability evaluation . . . . . . . . . . . . . . . . . . 776.3 Google Android support . . . . . . . . . . . . . . . . . . . . . . . . . . . . 78
7 Conclusion 79
Bibliography 80
List of Figures
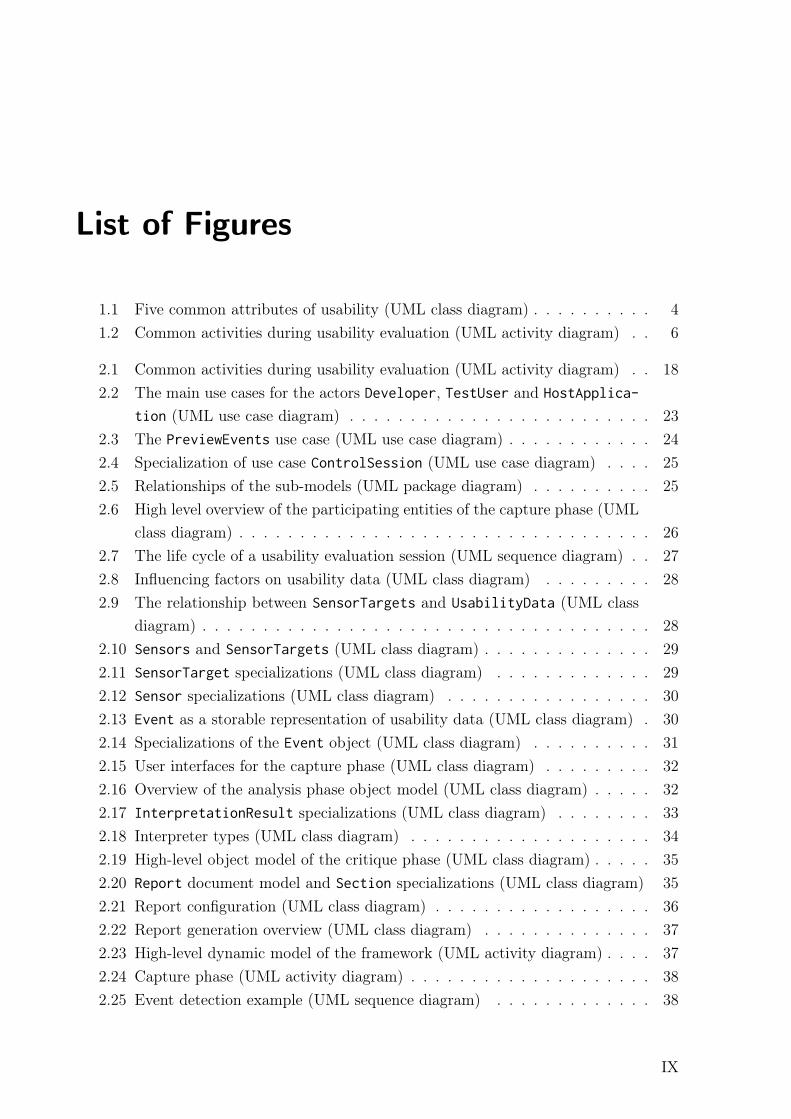
1.1 Five common attributes of usability (UML class diagram) . . . . . . . . . . 41.2 Common activities during usability evaluation (UML activity diagram) . . 6
2.1 Common activities during usability evaluation (UML activity diagram) . . 182.2 The main use cases for the actors Developer, TestUser and HostApplica-
tion (UML use case diagram) . . . . . . . . . . . . . . . . . . . . . . . . . 232.3 The PreviewEvents use case (UML use case diagram) . . . . . . . . . . . . 242.4 Specialization of use case ControlSession (UML use case diagram) . . . . 252.5 Relationships of the sub-models (UML package diagram) . . . . . . . . . . 252.6 High level overview of the participating entities of the capture phase (UML
class diagram) . . . . . . . . . . . . . . . . . . . . . . . . . . . . . . . . . . 262.7 The life cycle of a usability evaluation session (UML sequence diagram) . . 272.8 Influencing factors on usability data (UML class diagram) . . . . . . . . . 282.9 The relationship between SensorTargets and UsabilityData (UML class
diagram) . . . . . . . . . . . . . . . . . . . . . . . . . . . . . . . . . . . . . 282.10 Sensors and SensorTargets (UML class diagram) . . . . . . . . . . . . . . 292.11 SensorTarget specializations (UML class diagram) . . . . . . . . . . . . . 292.12 Sensor specializations (UML class diagram) . . . . . . . . . . . . . . . . . 302.13 Event as a storable representation of usability data (UML class diagram) . 302.14 Specializations of the Event object (UML class diagram) . . . . . . . . . . 312.15 User interfaces for the capture phase (UML class diagram) . . . . . . . . . 322.16 Overview of the analysis phase object model (UML class diagram) . . . . . 322.17 InterpretationResult specializations (UML class diagram) . . . . . . . . 332.18 Interpreter types (UML class diagram) . . . . . . . . . . . . . . . . . . . . 342.19 High-level object model of the critique phase (UML class diagram) . . . . . 352.20 Report document model and Section specializations (UML class diagram) 352.21 Report configuration (UML class diagram) . . . . . . . . . . . . . . . . . . 362.22 Report generation overview (UML class diagram) . . . . . . . . . . . . . . 372.23 High-level dynamic model of the framework (UML activity diagram) . . . . 372.24 Capture phase (UML activity diagram) . . . . . . . . . . . . . . . . . . . . 382.25 Event detection example (UML sequence diagram) . . . . . . . . . . . . . 38
IX
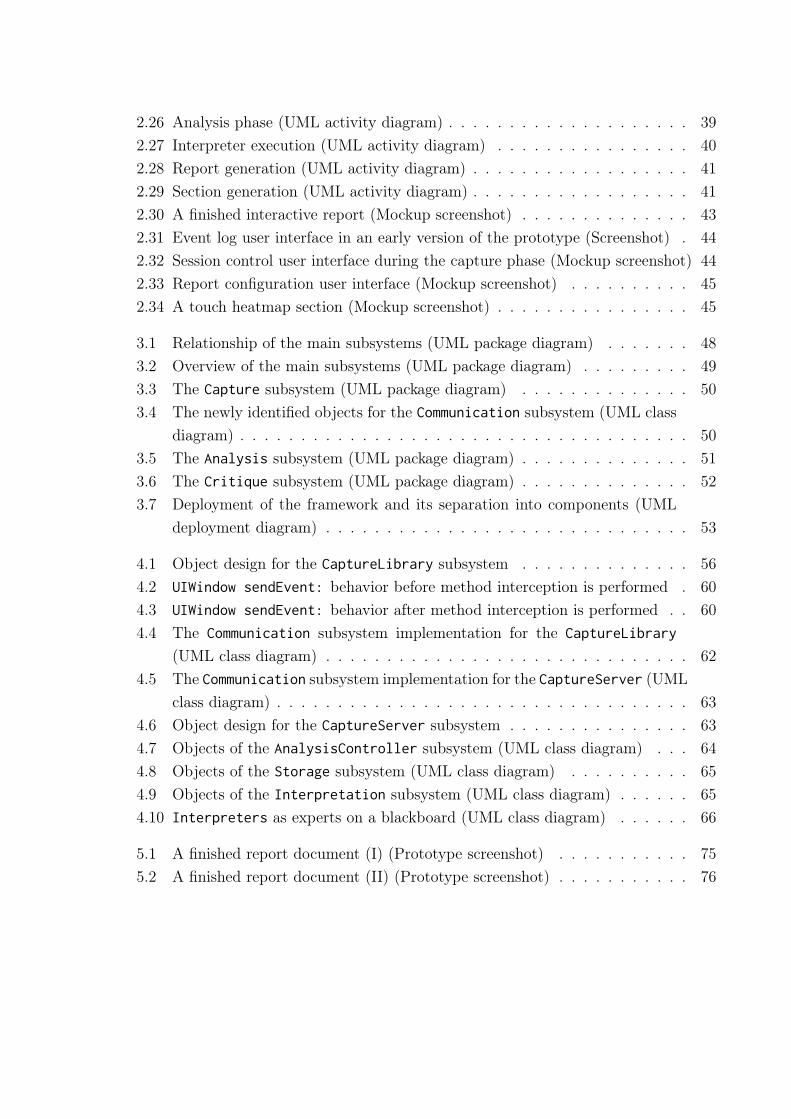
2.26 Analysis phase (UML activity diagram) . . . . . . . . . . . . . . . . . . . . 392.27 Interpreter execution (UML activity diagram) . . . . . . . . . . . . . . . . 402.28 Report generation (UML activity diagram) . . . . . . . . . . . . . . . . . . 412.29 Section generation (UML activity diagram) . . . . . . . . . . . . . . . . . . 412.30 A finished interactive report (Mockup screenshot) . . . . . . . . . . . . . . 432.31 Event log user interface in an early version of the prototype (Screenshot) . 442.32 Session control user interface during the capture phase (Mockup screenshot) 442.33 Report configuration user interface (Mockup screenshot) . . . . . . . . . . 452.34 A touch heatmap section (Mockup screenshot) . . . . . . . . . . . . . . . . 45
3.1 Relationship of the main subsystems (UML package diagram) . . . . . . . 483.2 Overview of the main subsystems (UML package diagram) . . . . . . . . . 493.3 The Capture subsystem (UML package diagram) . . . . . . . . . . . . . . 503.4 The newly identified objects for the Communication subsystem (UML class
diagram) . . . . . . . . . . . . . . . . . . . . . . . . . . . . . . . . . . . . . 503.5 The Analysis subsystem (UML package diagram) . . . . . . . . . . . . . . 513.6 The Critique subsystem (UML package diagram) . . . . . . . . . . . . . . 523.7 Deployment of the framework and its separation into components (UML
deployment diagram) . . . . . . . . . . . . . . . . . . . . . . . . . . . . . . 53
4.1 Object design for the CaptureLibrary subsystem . . . . . . . . . . . . . . 564.2 UIWindow sendEvent: behavior before method interception is performed . 604.3 UIWindow sendEvent: behavior after method interception is performed . . 604.4 The Communication subsystem implementation for the CaptureLibrary
(UML class diagram) . . . . . . . . . . . . . . . . . . . . . . . . . . . . . . 624.5 The Communication subsystem implementation for the CaptureServer (UML
class diagram) . . . . . . . . . . . . . . . . . . . . . . . . . . . . . . . . . . 634.6 Object design for the CaptureServer subsystem . . . . . . . . . . . . . . . 634.7 Objects of the AnalysisController subsystem (UML class diagram) . . . 644.8 Objects of the Storage subsystem (UML class diagram) . . . . . . . . . . 654.9 Objects of the Interpretation subsystem (UML class diagram) . . . . . . 654.10 Interpreters as experts on a blackboard (UML class diagram) . . . . . . 66
5.1 A finished report document (I) (Prototype screenshot) . . . . . . . . . . . 755.2 A finished report document (II) (Prototype screenshot) . . . . . . . . . . . 76
1 Introduction
On mobile devices, such as smartphones or tablet computers, good software usabilityis especially important. This is because users may interact with their devices underdifficult and distracting conditions, for example in noisy environments or at low lightlevels. Although good usability is vital on these platforms it is still difficult to sampleand collect data about user interactions. This also affects popular platforms like theApple iPhone. We believe that is mainly the case because tool support for collecting andanalyzing usability data is not very good or even nonexistent on most mobile platforms.
However, there is room to improve this situation by taking technologies and ideas fromanother area of software development, namely performance analysis, and applying themto the context of usability testing. Tools like profilers are readily available to the modernmobile application developer and allow for structured examination and analysis of ap-plication performance using software-based sensors. With similar techniques interactionpatterns can be captured, and in a further step, be examined using heuristic algorithmsthat find and point out usability problems. This is called automated usability evalua-tion. If we also remove the need for human evaluation experts to be present during anevaluation session then the technique becomes automated remote usability evaluation.
This thesis describes a framework for automated remote usability evaluation on mobiledevices. We provide a sample implementation for the Apple iOS platform and use it withthe two open-source applications Wordpress for iOS and PlainNote.
1.1 Problem statement
Software usability is important for every application on every platform and usually toolsand methodologies exist to help developers improve the usability of their software. How-ever, there is a lack of software support for usability evaluation on mobile platforms [9,23].Thus, usability evaluations on these platforms are often problematic and involve compli-cated laboratory setups to film screen contents and user interactions [15].
The users are also removed from their natural environment during a laboratory evaluationand thus do not experience many of the distractions (such as bad lighting, movement ornoise) that are common in a mobile context. This makes evaluation results less valid inreal life usage scenarios [22].
1
CHAPTER 1. INTRODUCTION
Several approaches have been taken to mitigate these problems. For example, remote us-ability evaluation for mobile devices allows to perform usability evaluation outside labora-tories [27]. But these evaluation methods are not available for all mobile device platformsand the methods focus on older or by now deprecated platforms.
Especially on the rather novel class of touch-enabled devices, like the Apple iPhone, therestill is no proper software support for conducting remote usability evaluations. There-fore, we propose a framework for remote usability evaluation on mobile platforms calledmuEvaluationFramework (“mobile usability Evaluation Framework”). The framework sup-ports logging and analyzing usability data in both traditional laboratory-based evaluationsand field tests.
1.2 Outline
Chapter 2 provides an overview of the application domain of the framework and in-troduces three existing technologies for remote usability evaluation. To document therequirements elicitation phase, the chapter describes the high-level functional and non-functional requirements. In addition, the chapter also describes the analysis model inthe form of use cases, object models and dynamic models for the framework. It containsthe complete functional specification and therefore it can be seen as the RequirementsAnalysis Document (RAD) for the framework.
Chapter 3 supplies an overview of framework’s software architecture and documentsthe system design model with the subsystem decomposition, hardware/software mappingand information about persistent data management. This chapter represents the SystemDesign Document (SDD).
Chapter 4 is organized by the packages documented in Chapter 3 and is considered tobe the Object Design Document (ODD).
Chapter 5 describes the prototypical implementation of the framework that was devel-oped during the writing of the thesis.
Chapter 6 gives several ideas for future work on the framework.
Chapter 7 shows conclusions drawn from the development of the framework.
2
1.3. DOCUMENT CONVENTIONS
1.3 Document conventions
The following conventions are used throughout the document:
Typographical conventions
• The names of system and modeling elements such as classes, packages, attributes,and methods are written in typewriter font.
• Important parts of the text are highlighted by using italics.
Notation and diagrams
• We use the Unified Modeling Language (UML) version 2.1.2 for all diagrams of thethesis [26].
1.4 Foundations
This section introduces the terms and concepts that are required to understand the ap-plication domain of the muEvaluationFramework. First, we define the term usability andexplain how it is used in the context of mobile applications. Second, we briefly describe sixstate-of-the-art approaches towards usability evaluation. Third, we provide an overviewof common activities in usability evaluations that we use as an overall structure for thethesis. Fourth, we introduce remote usability evaluation and two ways to perform it.Finally, we summarize the advantages and disadvantages of automated usability testing.
1.4.1 Usability of mobile applications
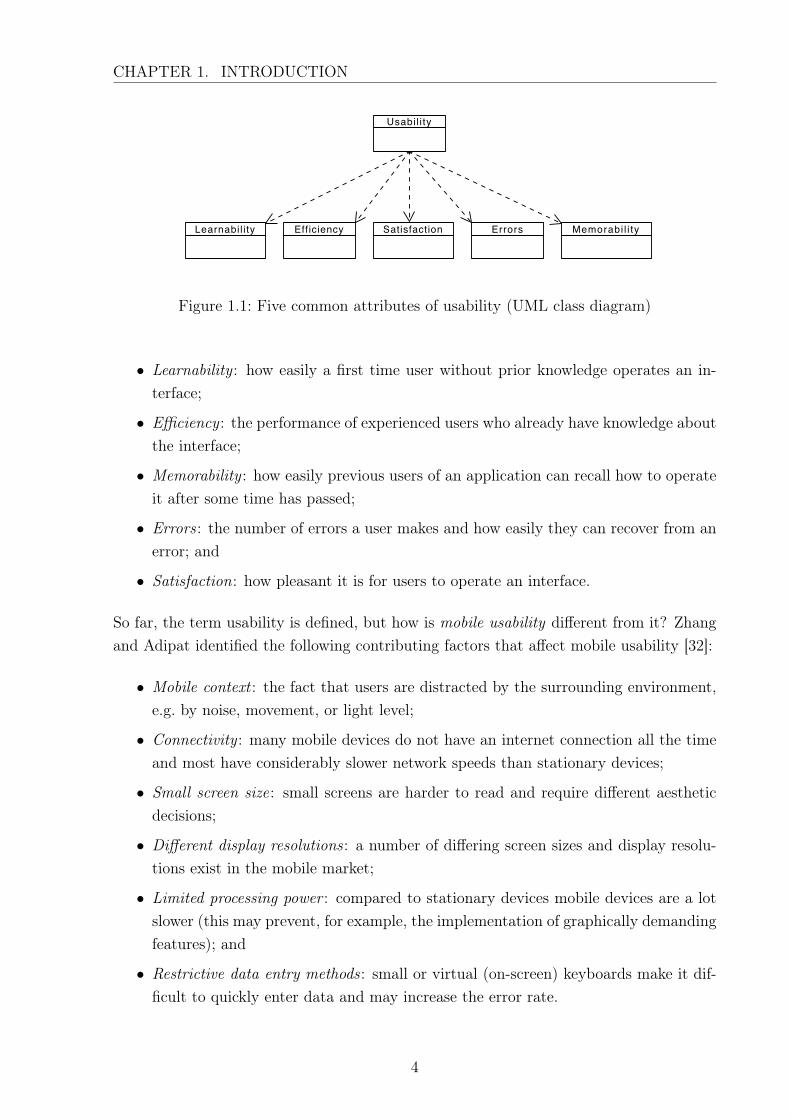
While the importance of usability is now widely recognized, there remains a confusionregarding the exact meaning of the term [11]. Generally, usability is an indicator for theease of use and the acceptability of a system [20]. Researchers frequently define usabilityas the sum of five common attributes [8, 24,32] (Figure 1.1):
3
CHAPTER 1. INTRODUCTION
Usabil i ty
Learnabil i ty Efficiency Satisfaction Errors Memorabi l i ty
Visual Paradigm for UML Standard Edition(TUM - Institut fuer Informatik - Lehrstuhl 1)
Figure 1.1: Five common attributes of usability (UML class diagram)
• Learnability : how easily a first time user without prior knowledge operates an in-terface;
• Efficiency : the performance of experienced users who already have knowledge aboutthe interface;
• Memorability : how easily previous users of an application can recall how to operateit after some time has passed;
• Errors : the number of errors a user makes and how easily they can recover from anerror; and
• Satisfaction: how pleasant it is for users to operate an interface.
So far, the term usability is defined, but how is mobile usability different from it? Zhangand Adipat identified the following contributing factors that affect mobile usability [32]:
• Mobile context : the fact that users are distracted by the surrounding environment,e.g. by noise, movement, or light level;
• Connectivity : many mobile devices do not have an internet connection all the timeand most have considerably slower network speeds than stationary devices;
• Small screen size: small screens are harder to read and require different aestheticdecisions;
• Different display resolutions: a number of differing screen sizes and display resolu-tions exist in the mobile market;
• Limited processing power : compared to stationary devices mobile devices are a lotslower (this may prevent, for example, the implementation of graphically demandingfeatures); and
• Restrictive data entry methods: small or virtual (on-screen) keyboards make it dif-ficult to quickly enter data and may increase the error rate.
4
1.4. FOUNDATIONS
1.4.2 Usability evaluation
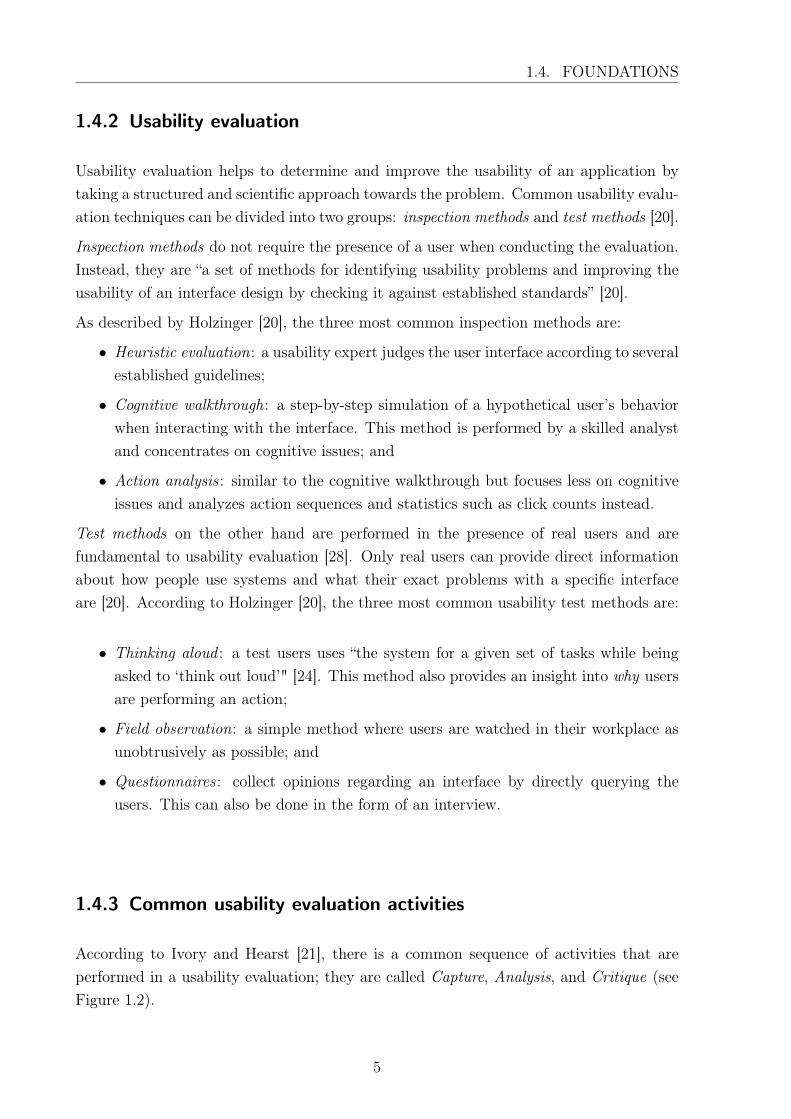
Usability evaluation helps to determine and improve the usability of an application bytaking a structured and scientific approach towards the problem. Common usability evalu-ation techniques can be divided into two groups: inspection methods and test methods [20].
Inspection methods do not require the presence of a user when conducting the evaluation.Instead, they are “a set of methods for identifying usability problems and improving theusability of an interface design by checking it against established standards” [20].
As described by Holzinger [20], the three most common inspection methods are:
• Heuristic evaluation: a usability expert judges the user interface according to severalestablished guidelines;
• Cognitive walkthrough: a step-by-step simulation of a hypothetical user’s behaviorwhen interacting with the interface. This method is performed by a skilled analystand concentrates on cognitive issues; and
• Action analysis : similar to the cognitive walkthrough but focuses less on cognitiveissues and analyzes action sequences and statistics such as click counts instead.
Test methods on the other hand are performed in the presence of real users and arefundamental to usability evaluation [28]. Only real users can provide direct informationabout how people use systems and what their exact problems with a specific interfaceare [20]. According to Holzinger [20], the three most common usability test methods are:
• Thinking aloud : a test users uses “the system for a given set of tasks while beingasked to ‘think out loud’" [24]. This method also provides an insight into why usersare performing an action;
• Field observation: a simple method where users are watched in their workplace asunobtrusively as possible; and
• Questionnaires : collect opinions regarding an interface by directly querying theusers. This can also be done in the form of an interview.
1.4.3 Common usability evaluation activities
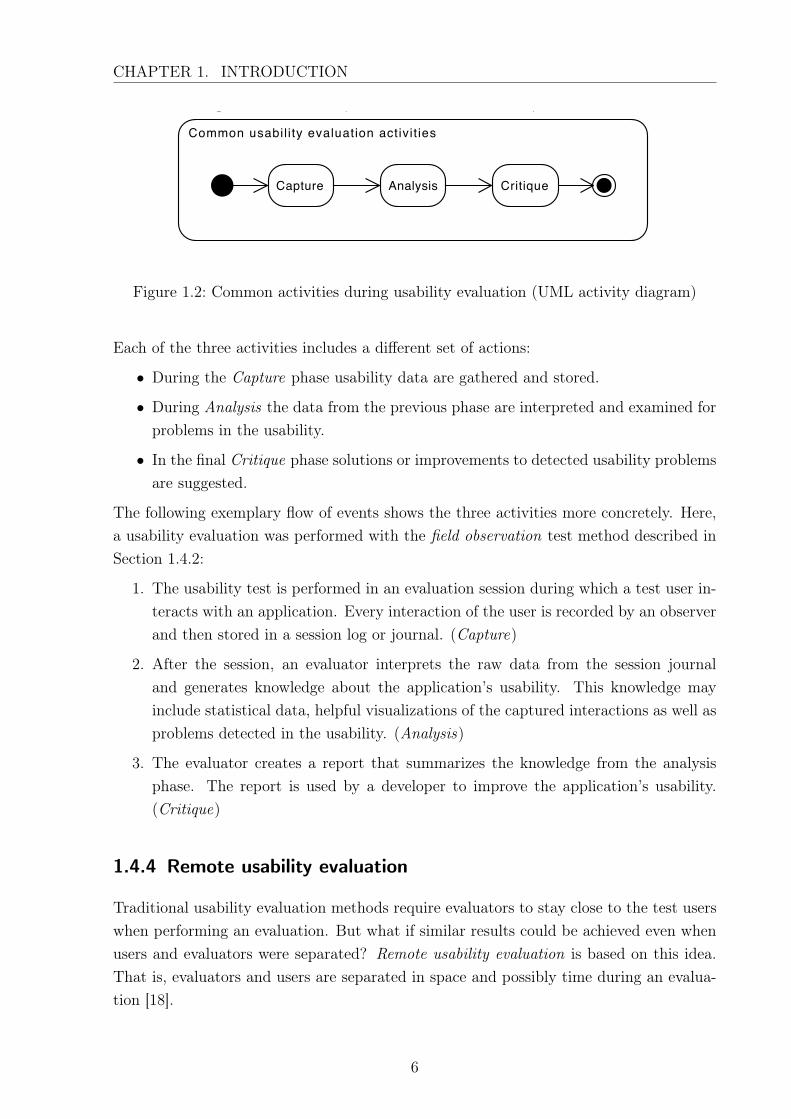
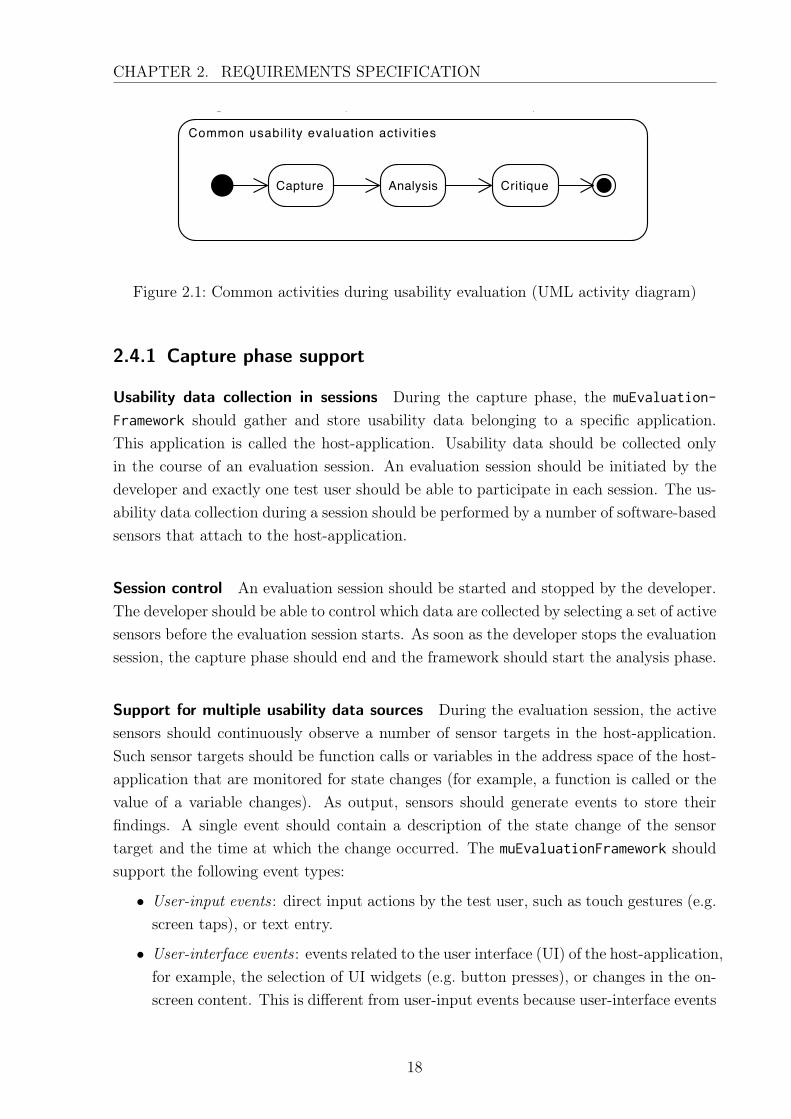
According to Ivory and Hearst [21], there is a common sequence of activities that areperformed in a usability evaluation; they are called Capture, Analysis, and Critique (seeFigure 1.2).
5
CHAPTER 1. INTRODUCTION
Common usabil i ty evaluation activit ies
Capture Analysis Critique
Visual Paradigm for UML Standard Edition(TUM - Institut fuer Informatik - Lehrstuhl 1)
Figure 1.2: Common activities during usability evaluation (UML activity diagram)
Each of the three activities includes a different set of actions:
• During the Capture phase usability data are gathered and stored.
• During Analysis the data from the previous phase are interpreted and examined forproblems in the usability.
• In the final Critique phase solutions or improvements to detected usability problemsare suggested.
The following exemplary flow of events shows the three activities more concretely. Here,a usability evaluation was performed with the field observation test method described inSection 1.4.2:
1. The usability test is performed in an evaluation session during which a test user in-teracts with an application. Every interaction of the user is recorded by an observerand then stored in a session log or journal. (Capture)
2. After the session, an evaluator interprets the raw data from the session journaland generates knowledge about the application’s usability. This knowledge mayinclude statistical data, helpful visualizations of the captured interactions as well asproblems detected in the usability. (Analysis)
3. The evaluator creates a report that summarizes the knowledge from the analysisphase. The report is used by a developer to improve the application’s usability.(Critique)
1.4.4 Remote usability evaluation
Traditional usability evaluation methods require evaluators to stay close to the test userswhen performing an evaluation. But what if similar results could be achieved even whenusers and evaluators were separated? Remote usability evaluation is based on this idea.That is, evaluators and users are separated in space and possibly time during an evalua-tion [18].
6
1.4. FOUNDATIONS
Remote evaluation is becoming more and more popular because it offers several advantagescompared to other, laboratory-based evaluation methods. For example, it allows thecollection of usability data in real usage situations or locations where users are difficultto assess by direct observation [27]. Furthermore, users behave more naturally when theevaluation is conducted in their familiar environment [27].
Available remote evaluation methods can be grouped into the two categories of syn-chronous and asynchronous methods. Andreasen et al. summarize the difference betweenthe two categories as follows:
“With a synchronous method, the evaluator is separated from the user spa-tially, but not temporally. When conducting an asynchronous test, the evalu-ator is separated from the user both temporally and spatially.” [1]
1.4.5 Automated usability testing
Automated usability testing tries to remedy some of the disadvantages and problems asso-ciated with established usability evaluation methods. For example, traditional evaluationmethods are often not systematic and predictable enough [21]. One solution for this prob-lem is to automate some of the common usability activities described in Section 1.4.3 [21].Au et al. [8] also conclude, that it would be a “logical solution [. . . ] to automate as manyaspects of usability testing as possible” because traditional evaluation methods carry sev-eral disadvantages, for example high complexity and resource inefficiency.
Automated usability evaluation methods, on the other hand, can be very cost- and time-efficient. Automation leads to several potential benefits, such as decreased costs, increasedconsistency between results, and a reduced need for evaluation expertise [21]. Becausecompanies are still often reluctant to employ the traditional, cost-intensive usability eval-uation methods they have a disadvantage in the market against companies that make useof remote evaluation. Automation can help to boost the acceptance of usability evaluationand leads to better products and better market performances [8].
Based on the work of Balbo [10], Ivory and Hearst [21] use a taxonomy that discriminatesbetween four approaches towards automated usability testing. The taxonomy is closelylinked to the common usability evaluation activities described in Section 1.4.3:
• No automation: all steps of the evaluation method are performed by the evaluator,i.e. there is no automation at all;
• Automatic capture: software automatically logs usability data such as interface us-age, user speech, or visual data;
• Automatic analysis : software identifies usability problems automatically by usinglogged data; and
7
CHAPTER 1. INTRODUCTION
• Automatic critique: software points at improvements and fully automates analysis.
While automated usability evaluation is a solution to many problems in the field, itmust be noted that automation might miss important subjective information such aspreferences and misconceptions of the users [21]. To mitigate these issues, automatedusability evaluation should be used in combination with traditional evaluation methods,such as heuristic evaluation or questionnaires. These traditional methods are describedin Section 1.4.2.
8
2 Requirements specification
In this chapter we describe the muEvaluationFramework in terms of external behavior.This includes a use case model to present the functionalities of the framework, an objectmodel that explains the application domain concepts, a dynamic model that shows theframework’s behavior in terms of interactions, and the nonfunctional requirements thatrepresent user-visible aspects of the framework that are not directly related with thefunctional behavior.
2.1 Objectives
As mentioned before it is the goal of this thesis to develop a framework that allows adeveloper to monitor and analyze the usability of mobile applications. The frameworkshould be capable of monitoring the activity of the user and be able to capture usabilityrelated data. The information collected during this step should be analyzed and finallyreported to the developer in an understandable and well-readable fashion.
2.2 Related work
In this section we present three existing frameworks that support remote usability eval-uation for mobile devices. The first framework is called MultiDevice REMUsine. It isused to analyze the usability of Windows CE applications by comparing user behavior toa planned task model. The second project is the EvaHelper Framework that helps devel-opers to analyze the usability of applications on the Google Android platform. The thirdsoftware is Google Analytics for Mobile which extends Google’s existing user trackingtechnology for web pages towards the Google Android and Apple iOS mobile platforms.
2.2.1 MultiDevice RemUsine
Paternò et al. describe a framework called MultiDevice RemUsine for the remote evalu-ation of mobile applications on the Microsoft Windows CE platform [27]. The solution
9
CHAPTER 2. REQUIREMENTS SPECIFICATION
focuses on the collection of contextual information, that is, about the surrounding envi-ronment of the users. The MultiDevice RemUsine framework consists of a logging toolthat collects usability data (capture), as well as a software that analyzes the collecteddata and provides an interactive view of the results (analysis and critique).
The logging tool, called Mobile Logger, supports the detection of user interactions withinmobile applications and also the detection of environmental conditions that might affectthe user’s activity. Such conditions are, for example, noise in the environment or thebattery level of the device. The logging component stores usability data as events andsupports four event classes: contextual events that are created as a consequence of updatedcontextual information; intention events that allow users to indicate that they changedthe target task; system events that are generated by the system as a response to user ac-tions; and interaction events which are further specialized into categories such as clicking,selecting, and scrolling. All event types are collected by tracking the internal messagesthat are sent to the application by the Windows CE operating system. Because numerousmessage types exist, the logging functionality is distributed across several modules thattrack the activity of the user in one specific aspect.
To analyze the collected usability data, the framework uses an internal task model thatdescribes how a user should complete tasks in the application. The task model has to beprovided by a developer in a preparation step. The collected events are then analyzed bycomparing the planned user behavior (the task model) and actual user behavior (the se-quence of events that the user performed). This allows the framework to detect deviationsfrom the internal task model; these deviations can then be investigated by a developerto see if there is a problem with the application’s usability or if the task model must beupdated to accept the new user behavior.
2.2.2 EvaHelper Framework
Balagtas-Fernandez and Hussmann found that software-supported usability testing onmobile devices is often troublesome because the devices have many restrictions and soft-ware tools for usability testing are missing. They describe a framework, called EvaHelper,which provides tool-support for usability evaluations on the Google Android platform [9].
The process of conducting a usability evaluation with the EvaHelper framework is struc-tured by the authors into four common activities that are performed as consecutive phases:First, preparation, where the developer sets up the application for the logging of usabilitydata. Second, collection, where usability data about the application are collected. Third,extraction, where the collected data are made available for interpretation. And fourth,analysis, where the extracted data are interpreted to detect usability problems in theapplication. The EvaHelper framework consists of several tools which support each of theactivities.
10
2.2. RELATED WORK
Usability data are made available to the framework by calling log functions in the applica-tion that should be analyzed. These source code modifications must be performed by thedeveloper, but the authors also propose a software tool which automatically inserts thenecessary code into the application. Once this preparation step is complete, the frameworkis able to collect usability data. The data are stored in a text file as comma-separatedvalues (CSV).
The framework also performs an analysis of the collected data by generating a graph thatvisualizes the user interactions. Each user interface (UI) element that was accessed by theuser is represented as a node in this graph. The UI elements are then grouped by assigningthem to containers which represent the screens or views of the application. Interactions ortransitions are represented by the edges of the graph. This approach to visualization allowsevaluators to retrieve information about an application’s usability in the learnability,efficiency, memorability, effectiveness, error rate and simplicity dimensions.
While its approach towards automated usability evaluation is generally very nice, wethink that the the EvaHelper framework could be improved in two ways. First, it ispossible to detect user interactions automatically by using the reflection abilities of modernprogramming languages. This means that no additional software tool that inserts loggingcode into the application would be needed. Hence, the preparation step would becomemuch easier for the developer because no source code must be changed. Second, we believethat on today’s graphically-rich mobile UIs, it is important to collect user interactionsgraphically, for example as screenshots or video sequences. We believe that this yieldsvaluable insights to the usability of an application, and especially so in an asynchronousremote evaluation setting.
2.2.3 Google Analytics for Mobile
Google Analytics allows a webmaster to track user activity on standard web pages. Thisis done by adding the Analytics JavaScript code to existing web pages. The embeddedcode, which is provided by Google Inc., collects information about actions that the usersperform on the web page, for example navigating to a different web page or interactingwith elements within one page. This tracking data are then sent to Google’s servers wherethey are analyzed and a report is prepared that can be browsed by the webmaster.
Google Analytics for Mobile is an extension of the Google Analytics framework for webpages, and similarly, it allows developers to track user interactions within mobile ap-plications [17]. The Google Analytics for Mobile framework is available for the GoogleAndroid and the Apple iOS platforms. It consists of two parts: First, a native softwaredevelopment kit (SDK) that replaces the JavaScript code of the web-based version. Andsecond, an underlying web service, which is provided by Google free of charge, that storesand analyzes the collected data.
11
CHAPTER 2. REQUIREMENTS SPECIFICATION
Before data can be collected, developers must setup an account with Google Inc. and mustthen link the application they want to analyze against a library from the Analytics SDK.Data collection or tracking is performed in a similar way to Google Analytics for webpages, but is less automated, i.e. developers have to trigger named events and pageviews(which provide a mechanism for grouping events) at appropriate times by calling a specialfunction in the Analytics library. On the Google Android platform, the framework can alsotrack clicks on advertisements that are embedded into the application. The collected dataare stored internally into a SQLite1 database and are wirelessly transmitted to Google’sweb service. Data transmission is performed in batches and developers can choose whenthe data should be dispatched.
The framework provides a web application which summarizes the collected data from allusers and presents it to the developers; this data processing step can include the collecteddata of thousands of users. Developers have access to several tools, such as a graphing tooland detail reports, which they can use to inform themselves about several variables: howoften the application is launched by the users (visits), how long users interact with theapplication (session length), the percentage of users that leave the application very quicklyand never return (bounce rate) and the number of unique users who use an application(unique visitors). The data are displayed anonymously, that is, developers cannot getinformation about individual users.
2.2.4 Summary
We examined three existing approaches towards automated remote usability evaluationon mobile devices in the related work section. While the presented solutions are verysatisfying in some aspects, we think that there is a distinct lack of such systems forthe Apple iOS platform even though it is very popular at the moment. Furthermore,existing systems ignore the graphically-rich user interfaces of modern, touch-based mobileplatforms and provide no support to graphically record user interactions, for example, asscreenshots or video sequences.
2.3 Scenarios
In this section we present three usage scenarios for the muEvaluationFramework: First, aproblem scenario that documents the issues and pitfalls with current approaches towardsusability evaluation on mobile platforms. Second, a visionary scenario that includes a
1SQLite is a lightweight relational database that implements most of the SQL standard. It is often usedin the software of mobile devices [19].
12
2.3. SCENARIOS
view of how usability evaluation on mobile platforms could be performed in the future.And third, a demo scenario that shows how the muEvaluationFramework helps a developerto conduct an usability evaluation.
2.3.1 Problem scenario
Scenario name Problem scenarioParticipating
actor instances
John and Clara (developers); Alice, Marcus, and Mona (test users)
Flow of events: 1. The mobile application developer John is working on the weMake-Words application for the Apple iOS platform. The aim of the soft-ware is to playfully teach Chinese characters to children aged fourto eight. John performs an usability evaluation of the weMakeWordsapplication using an iPod Touch device.
2. After adding a feature that makes a new character available for learn-ing, John notices that the five year old user Alice has trouble playingthrough a full session of the game. The application seems to freezebefore Alice can finish the session. This never happens when Johninteracts with the application. John asks Alice about the problemshe is having with the program. But, because of her age, Alice failsto explain the steps she took before the problem appeared.
3. John decides to monitor Alice’s interactions with the game in orderto find out what leads to the problem. While Alice is using weMake-Words once more, John sits besides her and takes written notes ofher actions.
4. Alice is shifting around a lot while interacting with the iPod Touchmobile device and thus it is hard for John to take proper notes of allinteractions. Later looking at them, it is hard for him to rememberall steps that Alice performed and he fails to reproduce the problemthat came up during the session.
5. John comes up with a new idea and tries to record Alice’s interactionsby using a video camera. The resulting video again is not very useful,as Alice is obstructing the camera view with her fingers. And shebecomes upset because she cannot freely move around with the devicein her hands while the screen is being filmed.
6. Sadly, the video of the recorded session also proves inconclusive be-cause the issue did not appear this time. John has now been workingeffortlessly for about two hours. He resolves to filming more sessions
13
CHAPTER 2. REQUIREMENTS SPECIFICATION
and invites two other children, Marcus and Mona, to interact withthe application in order to reproduce the freezing issue. To take goodcare of the bigger test group he requires the help of another softwaredeveloper, Clara.
7. After spending several hours recording the children’s interactions to-gether with Clara, John starts watching the recorded videos andsearches them for occurrences of the problem.
8. Feeling very exhausted, he finally manages to fix the fault aroundmidnight after a long and dull evening watching recorded interac-tions.
Problems in this scenario:
1. Recording user interactions by hand is tedious for John, even more so on mobileplatforms. The quality of the monitoring results is not very good, because the smallscreens get obstructed easily and taking notes by hand is slow.
2. Conducting a larger number of usability evaluation sessions becomes very workintensive. John cannot do this by himself.
3. He has to search for potential problem areas by hand. It is difficult for him to browsemany recorded sessions in order to find a single issue. Application freezes could bedetected easily by a simple heuristic that scans for screen updates, for example.
4. In order to allow for proper monitoring of her interactions, Alice is not allowed touse the software the way she would in an unrestricted situation, that is, she is forcedto be still while playing with the program so that the screen can be filmed or notescan be taken.
2.3.2 Visionary scenario
Scenario name Visionary scenarioParticipating
actor instances
John (developer)
Flow of events: 1. The developer John wants to test a new version of the Wordpressfor iOS application with a test group of 40 individuals. As a free-lance developer he has only limited testing resources available, so hegoes online and decides to acquire application testers via the web-site www.evaluate-my-app.com. He makes a request to the systemfor 40 test users and specifies their required properties: they should
14
2.3. SCENARIOS
be 20 to 30 years old; half of them should be male, half of them fe-male; they should all own iPhone 4 devices, and one third of themshould be novice users. Additionally, John wants the testing sessionto be less expensive than 500 EUR. The system chooses the testersautomatically according to their profile and previous work.
2. All testers are guided through the process of installing the applica-tion. John gives each of them a common task that stresses the newlyimplemented Delete weblog posting feature.
3. The testers begin working on the tasks they were given. The moni-toring framework records all the user interactions in the test group.It generates an interactive report from the cumulative data.
4. The report contains:
• a timeline of events for each of the testers; including touchevents, device motion and shake gestures
• visual and audio recordings of the interactions for think-aloudprotocols (Screen touches are indicated via graphical effects)
• the think-aloud audio recordings are transcribed automaticallyto text form
• the think-aloud audio recordings are searched for user exclama-tions (“Oh no!”, “What happened?”, etc.) that hint at problems
• a video recording of the testers face via the built-in front camerathat is scanned for strong emotions (being upset, surprise, etc.)
• a graphical representation of the tester’s navigation through theapplications’s view hierarchy
• a list of the most used views and user interface (UI) elements
• a rating of the applications’s performance and visual fluidity
• a list of to small or hard to read text elements
• a list of buttons or UI elements that were missed by users severaltimes. This is hinting at the elements being to small to use well.
• a list of areas that might be hard to read for people with disabil-ities, for example people with colorblindness. Also pointed outare the UI elements that do not have good accessibility metadata(iOS has support for users with impaired vision, for example)
• eye-tracking data that graphically shows where the user waslooking at; these data are either recorded via an external systemor inferred from the front camera video feed
15
CHAPTER 2. REQUIREMENTS SPECIFICATION
• a reachability graph of all the views; hints where shortcuts mightbe needed
• a list of occasions where identical information was repeatedlyentered by the user; this hints at areas where the data mightbe simply entered by the application itself to minimize typingrequired by the user
• a list of interactions that did not cause visual feedback whenthe user performed them
• a list of “UI design rules of thumb”-violations, e.g. the applica-tion is using to many different fonts or using inconsistent colors
5. Using the report John can now more easily identify problem areas inthe usability of his application. John has saved several days of workbecause he did not have to do the usability evaluation on his own.
2.3.3 Demo scenario
Scenario name Demo scenarioParticipating
actor instances
John (developer); Jack, Jill, and Jane (test users)
Flow of events: 1. Mobile application developer John is working on Wordpress for iOS,an editing software for weblogs. He wants to know how a group oftesters, Jack, Jill and Jane, are interacting with the software whengiven the task of publishing a new posting to a weblog.
2. John includes the muEvaluationFramework framework into the appli-cation, making only minor changes to the project source code. Forexample, he triggers events when key locations in the interface codeare reached by using simple function calls to mark them: [monitorbeginEvent: @”Edit blog posting"].
3. After that, he starts the MobileMonitor application, launches theWordpress for iOS application on three iPod Touch devices and givesthem to the testers. They were each given a written statement withthe task of publishing a new blog posting. Also, they were asked tothink aloud about their actions while interacting with the application.
4. While the testers are working, the muEvaluationFramework recordsuser interactions with the Wordpress for iOS application and for-wards them to an instance of the Mobile Monitor application running
16
2.4. FUNCTIONAL REQUIREMENTS
on John’s computer. Screen contents of the devices and the voices ofthe testers are also recorded and forwarded.
5. After Jack, Jill and Jane finish their assigned tasks, John uses theReport Generator software on the data recorded by the framework.A human-readable report is generated and John can view it using aweb browser.
6. The report includes a timeline of the testers interactions with theWordpress for iOS application. It includes generic events such asButton “Publish” was pressed or User entered view “Write posting”and also custom events that were defined by John: for example,User executes a shake gesture or User selects category “Work”. Johncan choose to exclude certain events from the timeline in order tomake the stream of events less cluttered. Furthermore, the reportincludes summarizing information concerning the whole interaction.For example, a list of the most often generated events or the mostoften used views as well as a heat map for each view that shows wherethe user touched the screen.
7. John now uses the information from the report to improve usabilityissues in the Wordpress for iOS application. Also, he finds out abouthot spots in the interaction; that is, user interface elements that wereaccessed frequently by Jack, Jill and Jane. Using this data he canlater decide efficiently on what area of the application he should workon next in order to improve usability where it is most important.
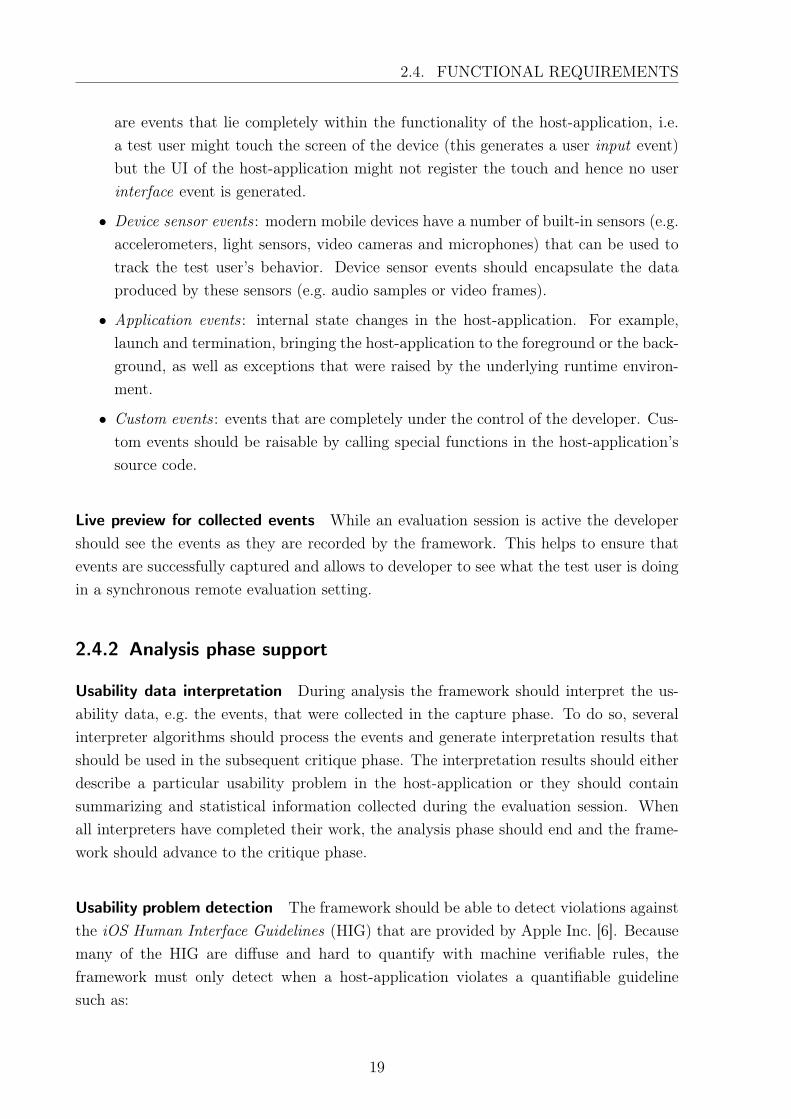
2.4 Functional requirements
In this section we describe how users and any external systems interact with the mu-
EvaluationFramework. The functional requirements are independent of the framework’simplementation and follow the structure of the three common usability activities describedin Section 1.4.3: First, the capture phase, during which usability data are collected. Sec-ond, the analysis phase, where the collected data are interpreted and examined for usabil-ity problems. And third, the critique phase, where improvements to the detected usabilityproblems are suggested.
17
CHAPTER 2. REQUIREMENTS SPECIFICATION
Common usabil i ty evaluation activit ies
Capture Analysis Critique
Visual Paradigm for UML Standard Edition(TUM - Institut fuer Informatik - Lehrstuhl 1)
Figure 2.1: Common activities during usability evaluation (UML activity diagram)
2.4.1 Capture phase support
Usability data collection in sessions During the capture phase, the muEvaluation-
Framework should gather and store usability data belonging to a specific application.This application is called the host-application. Usability data should be collected onlyin the course of an evaluation session. An evaluation session should be initiated by thedeveloper and exactly one test user should be able to participate in each session. The us-ability data collection during a session should be performed by a number of software-basedsensors that attach to the host-application.
Session control An evaluation session should be started and stopped by the developer.The developer should be able to control which data are collected by selecting a set of activesensors before the evaluation session starts. As soon as the developer stops the evaluationsession, the capture phase should end and the framework should start the analysis phase.
Support for multiple usability data sources During the evaluation session, the activesensors should continuously observe a number of sensor targets in the host-application.Such sensor targets should be function calls or variables in the address space of the host-application that are monitored for state changes (for example, a function is called or thevalue of a variable changes). As output, sensors should generate events to store theirfindings. A single event should contain a description of the state change of the sensortarget and the time at which the change occurred. The muEvaluationFramework shouldsupport the following event types:
• User-input events : direct input actions by the test user, such as touch gestures (e.g.screen taps), or text entry.
• User-interface events : events related to the user interface (UI) of the host-application,for example, the selection of UI widgets (e.g. button presses), or changes in the on-screen content. This is different from user-input events because user-interface events
18
2.4. FUNCTIONAL REQUIREMENTS
are events that lie completely within the functionality of the host-application, i.e.a test user might touch the screen of the device (this generates a user input event)but the UI of the host-application might not register the touch and hence no userinterface event is generated.
• Device sensor events: modern mobile devices have a number of built-in sensors (e.g.accelerometers, light sensors, video cameras and microphones) that can be used totrack the test user’s behavior. Device sensor events should encapsulate the dataproduced by these sensors (e.g. audio samples or video frames).
• Application events : internal state changes in the host-application. For example,launch and termination, bringing the host-application to the foreground or the back-ground, as well as exceptions that were raised by the underlying runtime environ-ment.
• Custom events : events that are completely under the control of the developer. Cus-tom events should be raisable by calling special functions in the host-application’ssource code.
Live preview for collected events While an evaluation session is active the developershould see the events as they are recorded by the framework. This helps to ensure thatevents are successfully captured and allows to developer to see what the test user is doingin a synchronous remote evaluation setting.
2.4.2 Analysis phase support
Usability data interpretation During analysis the framework should interpret the us-ability data, e.g. the events, that were collected in the capture phase. To do so, severalinterpreter algorithms should process the events and generate interpretation results thatshould be used in the subsequent critique phase. The interpretation results should eitherdescribe a particular usability problem in the host-application or they should containsummarizing and statistical information collected during the evaluation session. Whenall interpreters have completed their work, the analysis phase should end and the frame-work should advance to the critique phase.
Usability problem detection The framework should be able to detect violations againstthe iOS Human Interface Guidelines (HIG) that are provided by Apple Inc. [6]. Becausemany of the HIG are diffuse and hard to quantify with machine verifiable rules, theframework must only detect when a host-application violates a quantifiable guidelinesuch as:
19
CHAPTER 2. REQUIREMENTS SPECIFICATION
• “Display a hint in the text field if it helps users understand its purpose,such as ‘Name’ or ‘Address.’ A text field can display such placeholder text whenthere is no other text in the field.” [6]; or
• “Maintain a hit target area of at least 44 x 44 pixels for each toolbar item.
If you crowd toolbar items too closely together, people have difficulty tapping theone they want.” [6]
Usability summary generation The summarizing and statistical interpretation resultsthat should be produced by the framework are:
• overview information regarding the evaluation session, for example, the session’sduration or the total number of events;
• a list of the most used views and UI widgets that is sorted by the time spent oneach element;
• heat maps that should graphically show the touch events for each view in the host-application;
• a representation of the test user’s navigation path through the host-application’sviews
2.4.3 Critique phase support
Report generation As final output, the muEvaluationFramework should generate a re-port that summarizes the interpretation results that were found in the analysis phase.For each usability issue that was found, the report should recommend changes to thehost-application that mitigate the issue. The developer should be able to use the reportto achieve two goals: First, to understand and to reproduce any actions the test userhas performed during the evaluation session. And second, to improve the usability ofthe host-application by making the changes that were recommended in the report. Thedeveloper should be able to view the report using a standard web browser. The reportshould be structured into sections and should offer interactive elements (such as dynam-ically filterable event logs). Where applicable, the report should include media such asimages, videos, or audio files.
Report configuration Developers should be able to configure the report in two ways:They should be able to choose the directory where the report is stored; and they shouldbe able to choose one or more sections that are included in the report. Reports shouldsupport the following section types:
20
2.5. NONFUNCTIONAL REQUIREMENTS
• an overview section that lists general information about the evaluation session, e.g.its duration or the number of recorded events;
• a graphical event log or timeline that can be interactively filtered by event type;
• a touch heat map section that graphically shows user interaction hot spots for eachview in the host-application; and
• a section that shows how the test user navigated through the views of the host-application.
• a section that shows the Human Interface Guidelines [6] violations that were de-tected.
2.5 Nonfunctional requirements
After the functional requirements of the muEvaluationFramework are defined, we specifya number of additional nonfunctional requirements. These requirements are user-visibleaspects of the framework that are not directly related with the functional behavior.
2.5.1 Usability
Minimal setup work Only minimal setup work should be required from the developerto perform a usability evaluation on an existing host-application. The framework shouldonly require two modifications to an existing host-application: first, linking the host-application against a single static library; and second, calling one method in the host-application’s source code.
User interface usability The user interface used for report configuration should be ac-cessible within five seconds after a session was recorded in order to not interrupt theworkflow of the developer. The developer should be able to start and stop an evaluationsession with a simple graphical user interface. The starting and stopping of a sessionshould be possible by performing just one mouse click. A graphical user interface shouldalso be available to configure and generate a report. The report should be pre-configuredso that the developer can generate a report with a single click.
Wireless communication with the mobile device The framework should communicatewith the mobile device over a wireless connection. This is preferable to a tethered con-nection because it allows test users to move the mobile device around freely and not feelrestricted by wires.
21
CHAPTER 2. REQUIREMENTS SPECIFICATION
2.5.2 Reliability
In order to provide meaningful results, the framework should not make the host-applicationbehave differently. Any side effects on the host-application should therefore be minimizedand influence on the test user’s behavior should be as low as possible.
2.5.3 Security
The framework may not compromise the security of the host-application. Existing safetymeasures of the operating system, such as application sandboxing, should not be affected.
2.5.4 Privacy
Recorded user interactions and other events should only be accessible to an authorizeddeveloper.
2.5.5 Performance
To ensure meaningful data, the framework should not slow down the host-application tothe point that its usability is affected. Together, the analysis and critique phases shouldtake less than 10 minutes for every hour spent in the capture phase.
2.5.6 Supportability
Full source code comments should be provided for all code in the framework. The frame-work should be structured so that it can be easily extended with new capturing abilities,interpretation algorithms, and report section types.
2.5.7 Implementation requirements
The prototypical implementation of the framework should be usable with host-applicationsdeveloped for the Apple iOS platform. Therefore, parts of it must be programmed in theObjective-C language. The framework should also be prepared for future cross-platformcompatibility. To do so, all code that does not directly run on the mobile device shouldbe programmed in the Python language.
22
2.6. SYSTEM MODELS
2.6 System models
<<ac to r>>
HostApplication
ControlSession
ConfigureReport
ViewReport
CaptureUsabilityData
muEvaluationFramework
TestUser
Developer
<< in i t ia te>>
<<in i t ia te>>
<<in i t ia te>>
<<part ic ipate>>
<<part ic ipate>>
<<in i t ia te>>
Visual Paradigm for UML Standard Edition(TUM - Institut fuer Informatik - Lehrstuhl 1)
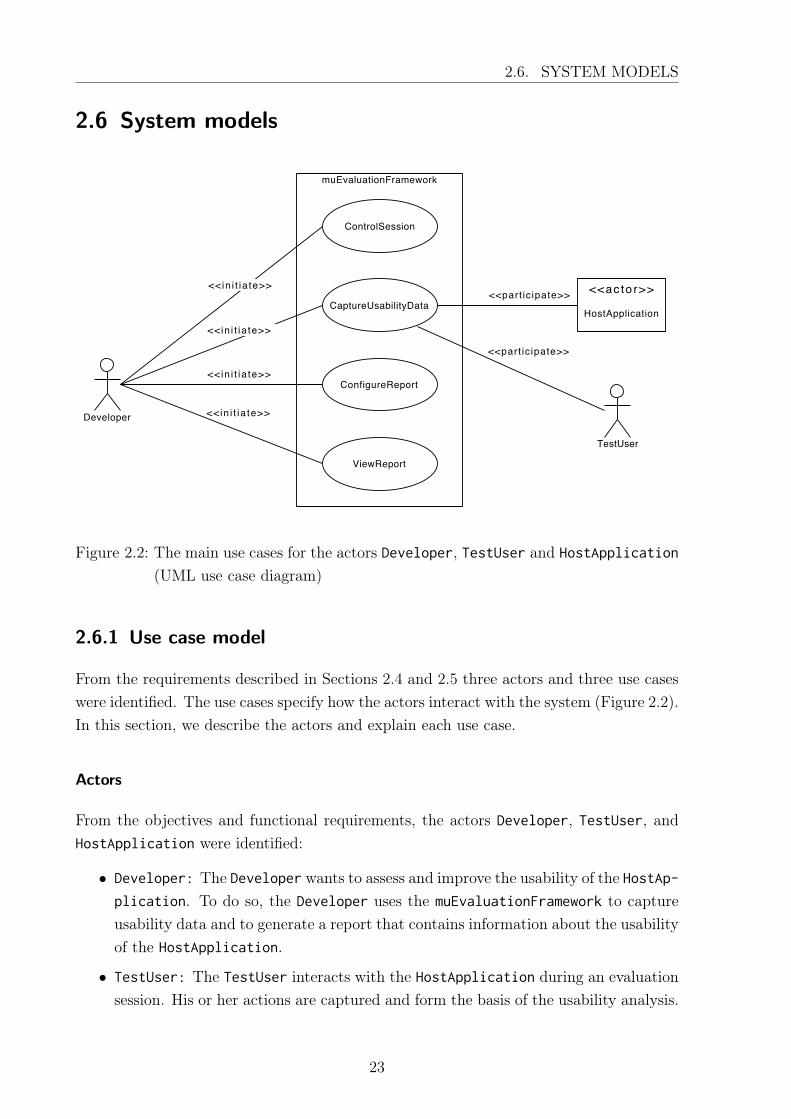
Figure 2.2: The main use cases for the actors Developer, TestUser and HostApplication
(UML use case diagram)
2.6.1 Use case model
From the requirements described in Sections 2.4 and 2.5 three actors and three use caseswere identified. The use cases specify how the actors interact with the system (Figure 2.2).In this section, we describe the actors and explain each use case.
Actors
From the objectives and functional requirements, the actors Developer, TestUser, andHostApplication were identified:
• Developer: The Developer wants to assess and improve the usability of the HostAp-plication. To do so, the Developer uses the muEvaluationFramework to captureusability data and to generate a report that contains information about the usabilityof the HostApplication.
• TestUser: The TestUser interacts with the HostApplication during an evaluationsession. His or her actions are captured and form the basis of the usability analysis.
23
CHAPTER 2. REQUIREMENTS SPECIFICATION
• HostApplication: The Developer uses the muEvaluationFramework to assess andimprove the usability of the HostApplication.
Use cases
As a result from the functional requirements, the following activity was identified as themain use case for the actors Developer, TestUser, and HostApplication (Figure 2.2):
• CaptureUsabilityData: Usability related data are captured during an evaluationsession initiated by the Developer. The actors TestUser and HostApplication
participate in the evaluation session.
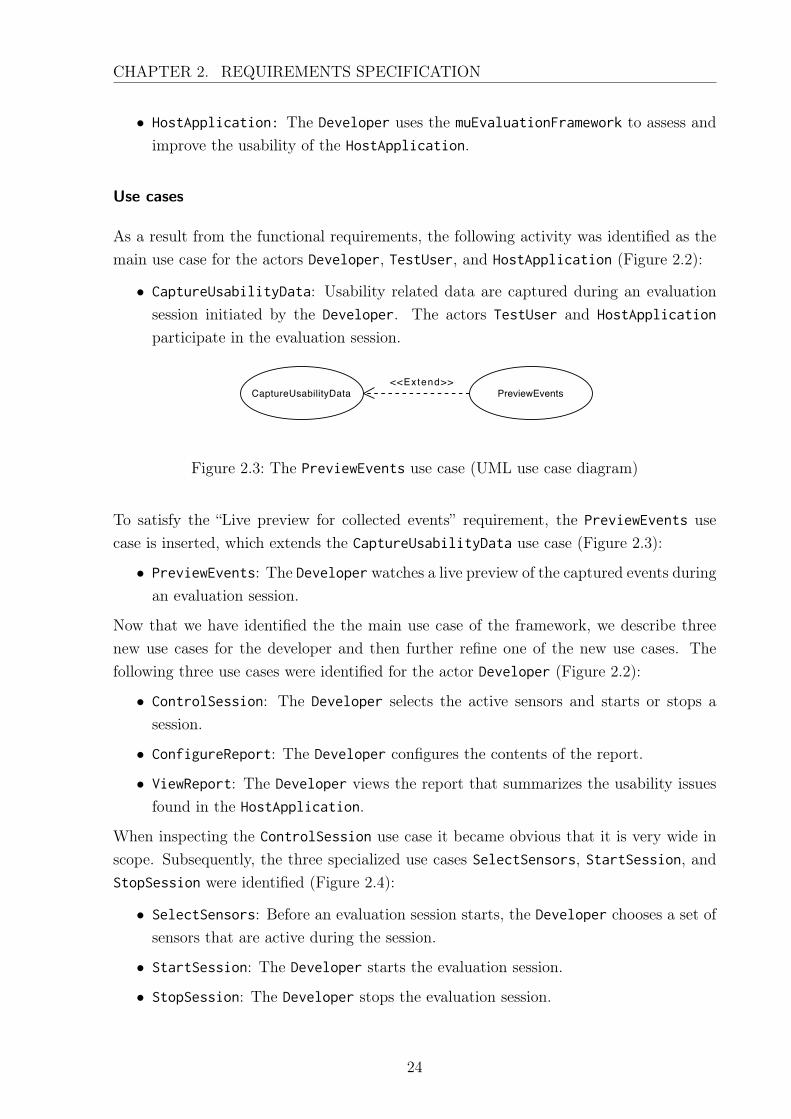
PreviewEventsCaptureUsabilityData<<Extend>>
Visual Paradigm for UML Standard Edition(TUM - Institut fuer Informatik - Lehrstuhl 1)
Figure 2.3: The PreviewEvents use case (UML use case diagram)
To satisfy the “Live preview for collected events” requirement, the PreviewEvents usecase is inserted, which extends the CaptureUsabilityData use case (Figure 2.3):
• PreviewEvents: The Developer watches a live preview of the captured events duringan evaluation session.
Now that we have identified the the main use case of the framework, we describe threenew use cases for the developer and then further refine one of the new use cases. Thefollowing three use cases were identified for the actor Developer (Figure 2.2):
• ControlSession: The Developer selects the active sensors and starts or stops asession.
• ConfigureReport: The Developer configures the contents of the report.
• ViewReport: The Developer views the report that summarizes the usability issuesfound in the HostApplication.
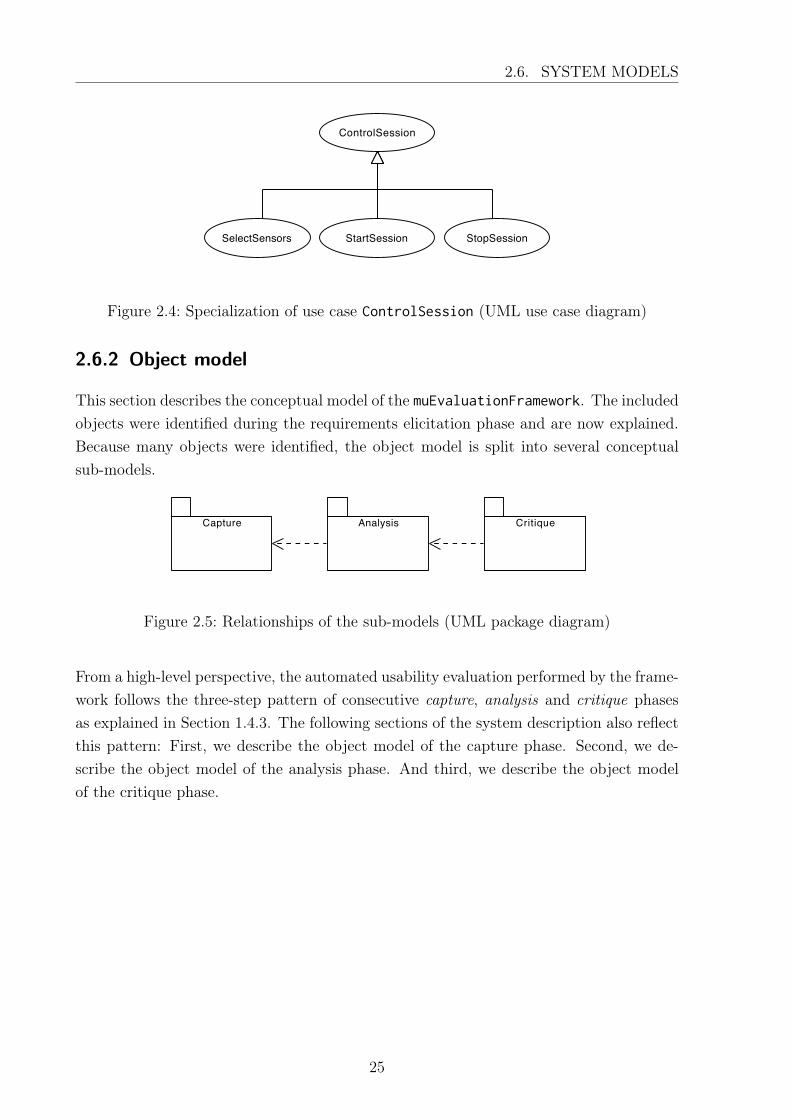
When inspecting the ControlSession use case it became obvious that it is very wide inscope. Subsequently, the three specialized use cases SelectSensors, StartSession, andStopSession were identified (Figure 2.4):
• SelectSensors: Before an evaluation session starts, the Developer chooses a set ofsensors that are active during the session.
• StartSession: The Developer starts the evaluation session.
• StopSession: The Developer stops the evaluation session.
24
2.6. SYSTEM MODELS
SelectSensors
ControlSession
StopSessionStartSession
Visual Paradigm for UML Standard Edition(TUM - Institut fuer Informatik - Lehrstuhl 1)
Figure 2.4: Specialization of use case ControlSession (UML use case diagram)
2.6.2 Object model
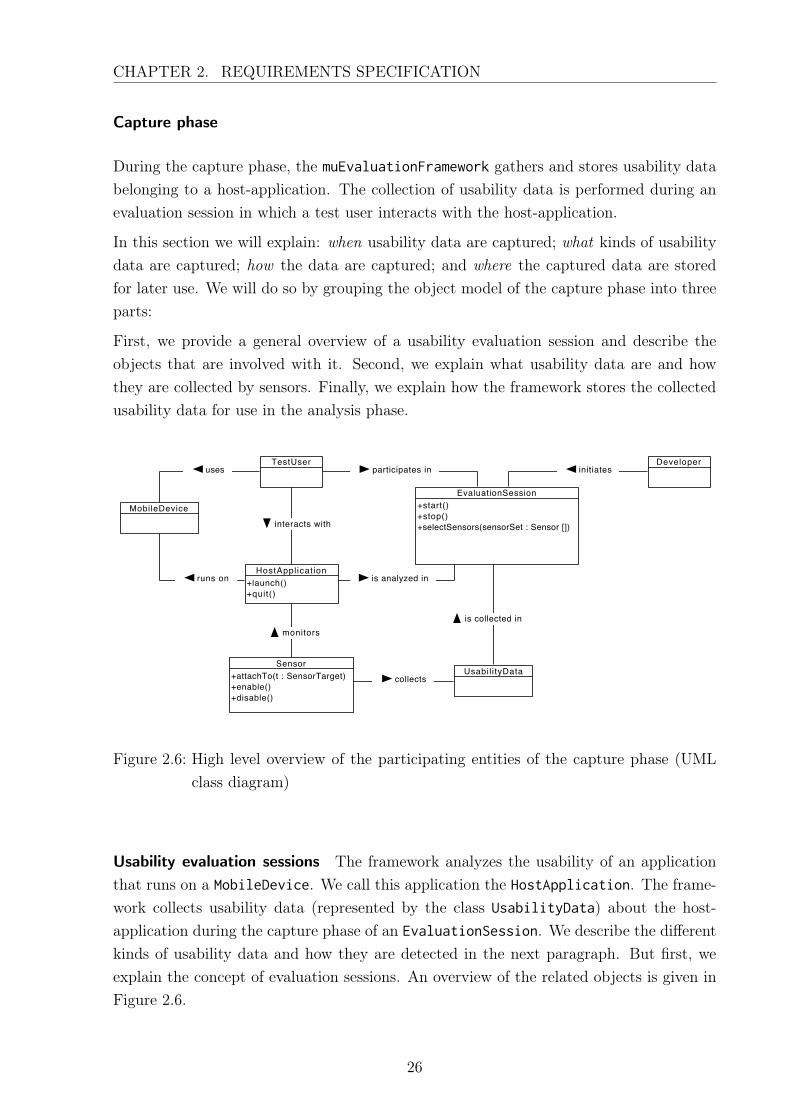
This section describes the conceptual model of the muEvaluationFramework. The includedobjects were identified during the requirements elicitation phase and are now explained.Because many objects were identified, the object model is split into several conceptualsub-models.
Capture Analysis Critique
Visual Paradigm for UML Standard Edition(TUM - Institut fuer Informatik - Lehrstuhl 1)
Figure 2.5: Relationships of the sub-models (UML package diagram)
From a high-level perspective, the automated usability evaluation performed by the frame-work follows the three-step pattern of consecutive capture, analysis and critique phasesas explained in Section 1.4.3. The following sections of the system description also reflectthis pattern: First, we describe the object model of the capture phase. Second, we de-scribe the object model of the analysis phase. And third, we describe the object modelof the critique phase.
25
CHAPTER 2. REQUIREMENTS SPECIFICATION
Capture phase
During the capture phase, the muEvaluationFramework gathers and stores usability databelonging to a host-application. The collection of usability data is performed during anevaluation session in which a test user interacts with the host-application.
In this section we will explain: when usability data are captured; what kinds of usabilitydata are captured; how the data are captured; and where the captured data are storedfor later use. We will do so by grouping the object model of the capture phase into threeparts:
First, we provide a general overview of a usability evaluation session and describe theobjects that are involved with it. Second, we explain what usability data are and howthey are collected by sensors. Finally, we explain how the framework stores the collectedusability data for use in the analysis phase.
+start()+stop()+selectSensors(sensorSet : Sensor [])
EvaluationSession
TestUser Developer
+launch()+quit()
HostAppl icat ion
Usabil i tyData
MobileDevice
+attachTo(t : SensorTarget)+enable()+disable()
Sensor
monitors
collects
runs on
uses
is collected in
is analyzed in
participates in initiates
interacts with
Visual Paradigm for UML Standard Edition(TUM - Institut fuer Informatik - Lehrstuhl 1)
Figure 2.6: High level overview of the participating entities of the capture phase (UMLclass diagram)
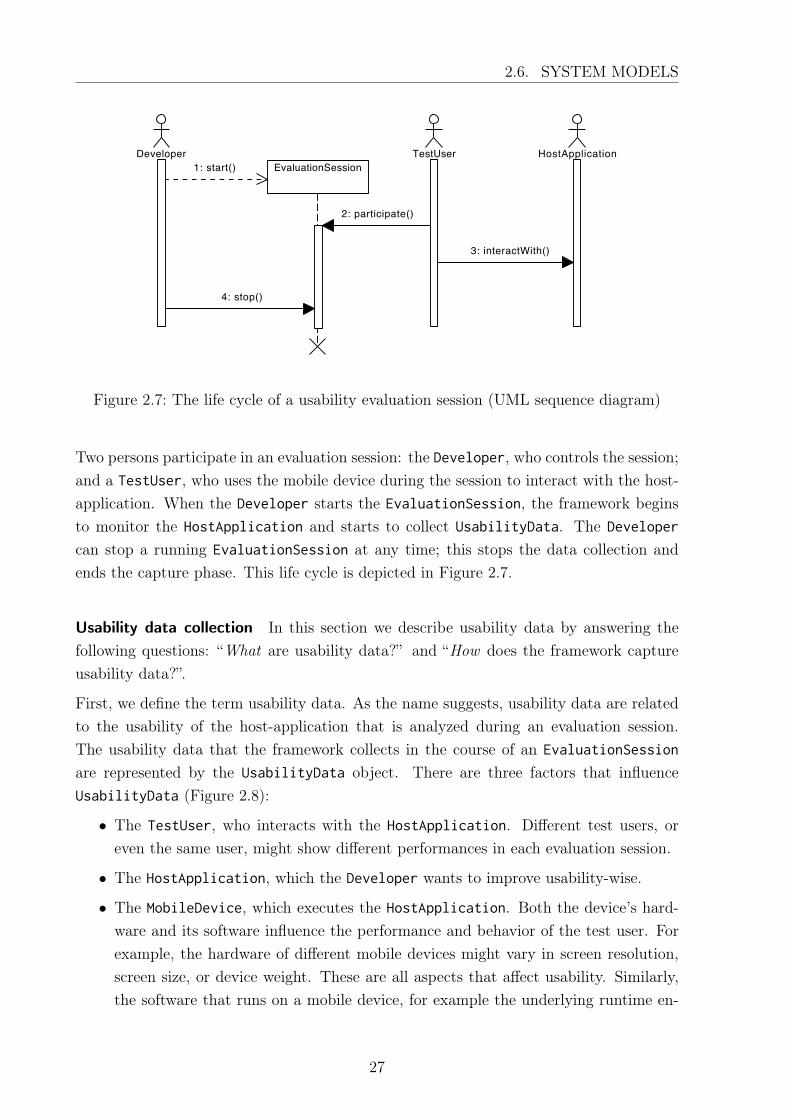
Usability evaluation sessions The framework analyzes the usability of an applicationthat runs on a MobileDevice. We call this application the HostApplication. The frame-work collects usability data (represented by the class UsabilityData) about the host-application during the capture phase of an EvaluationSession. We describe the differentkinds of usability data and how they are detected in the next paragraph. But first, weexplain the concept of evaluation sessions. An overview of the related objects is given inFigure 2.6.
26
2.6. SYSTEM MODELS
HostApplicationTestUserEvaluationSession
Developer
4: stop()
3: interactWith()
2: participate()
1: start()
Visual Paradigm for UML Standard Edition(TUM - Institut fuer Informatik - Lehrstuhl 1)
Figure 2.7: The life cycle of a usability evaluation session (UML sequence diagram)
Two persons participate in an evaluation session: the Developer, who controls the session;and a TestUser, who uses the mobile device during the session to interact with the host-application. When the Developer starts the EvaluationSession, the framework beginsto monitor the HostApplication and starts to collect UsabilityData. The Developer
can stop a running EvaluationSession at any time; this stops the data collection andends the capture phase. This life cycle is depicted in Figure 2.7.
Usability data collection In this section we describe usability data by answering thefollowing questions: “What are usability data?” and “How does the framework captureusability data?”.
First, we define the term usability data. As the name suggests, usability data are relatedto the usability of the host-application that is analyzed during an evaluation session.The usability data that the framework collects in the course of an EvaluationSession
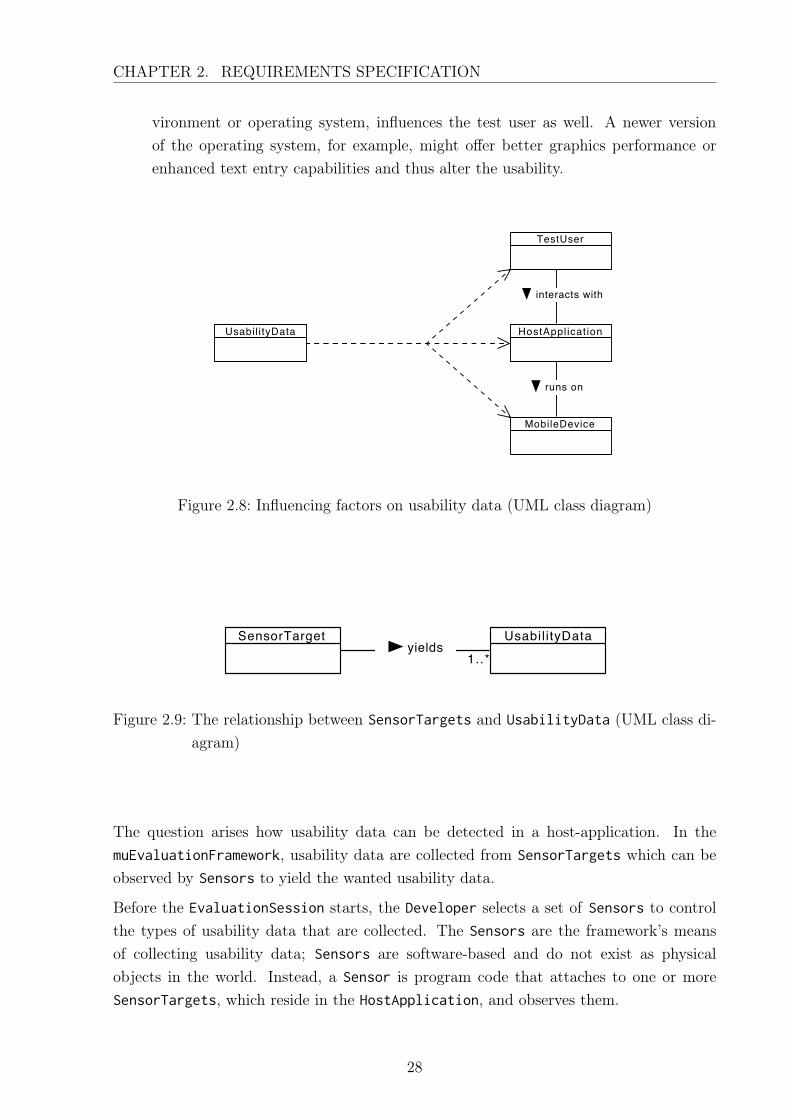
are represented by the UsabilityData object. There are three factors that influenceUsabilityData (Figure 2.8):
• The TestUser, who interacts with the HostApplication. Different test users, oreven the same user, might show different performances in each evaluation session.
• The HostApplication, which the Developer wants to improve usability-wise.
• The MobileDevice, which executes the HostApplication. Both the device’s hard-ware and its software influence the performance and behavior of the test user. Forexample, the hardware of different mobile devices might vary in screen resolution,screen size, or device weight. These are all aspects that affect usability. Similarly,the software that runs on a mobile device, for example the underlying runtime en-
27
CHAPTER 2. REQUIREMENTS SPECIFICATION
vironment or operating system, influences the test user as well. A newer versionof the operating system, for example, might offer better graphics performance orenhanced text entry capabilities and thus alter the usability.
Usabil i tyData
TestUser
HostAppl icat ion
MobileDevice
runs on
interacts with
Visual Paradigm for UML Standard Edition(TUM - Institut fuer Informatik - Lehrstuhl 1)
Figure 2.8: Influencing factors on usability data (UML class diagram)
Usabil i tyDataSensorTarget
1..*yields
Visual Paradigm for UML Standard Edition(TUM - Institut fuer Informatik - Lehrstuhl 1)
Figure 2.9: The relationship between SensorTargets and UsabilityData (UML class di-agram)
The question arises how usability data can be detected in a host-application. In themuEvaluationFramework, usability data are collected from SensorTargets which can beobserved by Sensors to yield the wanted usability data.
Before the EvaluationSession starts, the Developer selects a set of Sensors to controlthe types of usability data that are collected. The Sensors are the framework’s meansof collecting usability data; Sensors are software-based and do not exist as physicalobjects in the world. Instead, a Sensor is program code that attaches to one or moreSensorTargets, which reside in the HostApplication, and observes them.
28
2.6. SYSTEM MODELS
-isActive : boolean+attachTo(t : SensorTarget)+enable()+disable()
<<abstract>>Sensor
HostAppl icat ion
Usabil i tyData
SensorTarget
*
1..**
observes
collects
monitors
Visual Paradigm for UML Standard Edition(TUM - Institut fuer Informatik - Lehrstuhl 1)
Figure 2.10: Sensors and SensorTargets (UML class diagram)
SensorTarget
VariableMethod
Visual Paradigm for UML Standard Edition(TUM - Institut fuer Informatik - Lehrstuhl 1)
Figure 2.11: SensorTarget specializations (UML class diagram)
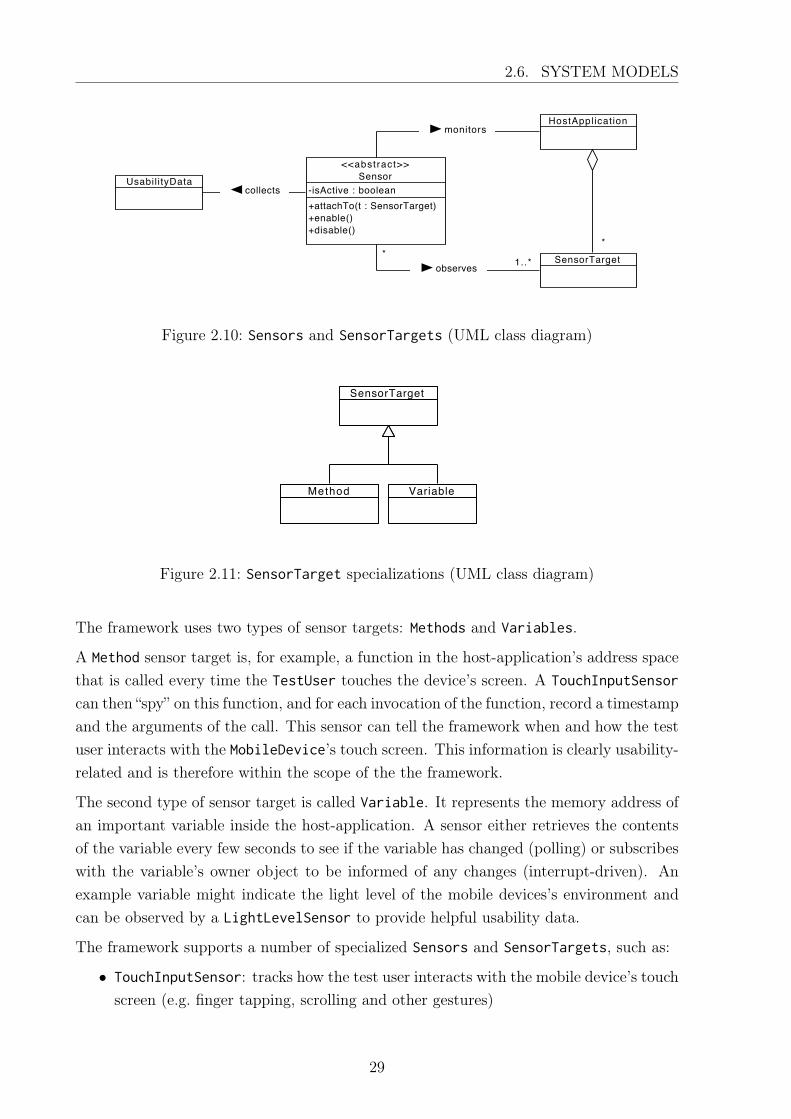
The framework uses two types of sensor targets: Methods and Variables.
A Method sensor target is, for example, a function in the host-application’s address spacethat is called every time the TestUser touches the device’s screen. A TouchInputSensor
can then “spy” on this function, and for each invocation of the function, record a timestampand the arguments of the call. This sensor can tell the framework when and how the testuser interacts with the MobileDevice’s touch screen. This information is clearly usability-related and is therefore within the scope of the the framework.
The second type of sensor target is called Variable. It represents the memory address ofan important variable inside the host-application. A sensor either retrieves the contentsof the variable every few seconds to see if the variable has changed (polling) or subscribeswith the variable’s owner object to be informed of any changes (interrupt-driven). Anexample variable might indicate the light level of the mobile devices’s environment andcan be observed by a LightLevelSensor to provide helpful usability data.
The framework supports a number of specialized Sensors and SensorTargets, such as:
• TouchInputSensor: tracks how the test user interacts with the mobile device’s touchscreen (e.g. finger tapping, scrolling and other gestures)
29
CHAPTER 2. REQUIREMENTS SPECIFICATION
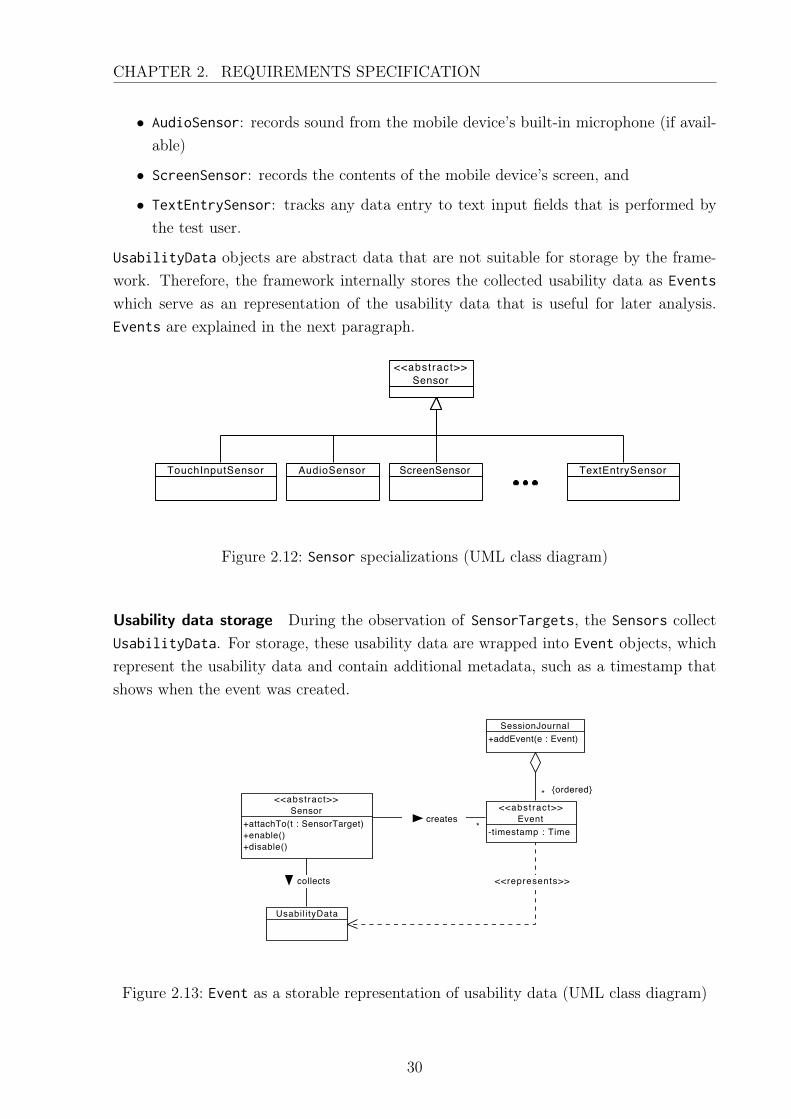
• AudioSensor: records sound from the mobile device’s built-in microphone (if avail-able)
• ScreenSensor: records the contents of the mobile device’s screen, and
• TextEntrySensor: tracks any data entry to text input fields that is performed bythe test user.
UsabilityData objects are abstract data that are not suitable for storage by the frame-work. Therefore, the framework internally stores the collected usability data as Events
which serve as an representation of the usability data that is useful for later analysis.Events are explained in the next paragraph.
<<abstract>>Sensor
TouchInputSensor AudioSensor TextEntrySensorScreenSensor
Visual Paradigm for UML Standard Edition(TUM - Institut fuer Informatik - Lehrstuhl 1)
Figure 2.12: Sensor specializations (UML class diagram)
Usability data storage During the observation of SensorTargets, the Sensors collectUsabilityData. For storage, these usability data are wrapped into Event objects, whichrepresent the usability data and contain additional metadata, such as a timestamp thatshows when the event was created.
-timestamp : Time
<<abstract>>Event+attachTo(t : SensorTarget)
+enable()+disable()
<<abstract>>Sensor
+addEvent(e : Event)SessionJournal
Usabil i tyData
*
* {ordered}
collects <<represents>>
creates
Visual Paradigm for UML Standard Edition(TUM - Institut fuer Informatik - Lehrstuhl 1)
Figure 2.13: Event as a storable representation of usability data (UML class diagram)
30
2.6. SYSTEM MODELS
<<abstract>>Event
UserInputEvent CustomEventApplicationEventUserInterfaceEvent DeviceSensorEvent
Visual Paradigm for UML Standard Edition(TUM - Institut fuer Informatik - Lehrstuhl 1)
Figure 2.14: Specializations of the Event object (UML class diagram)
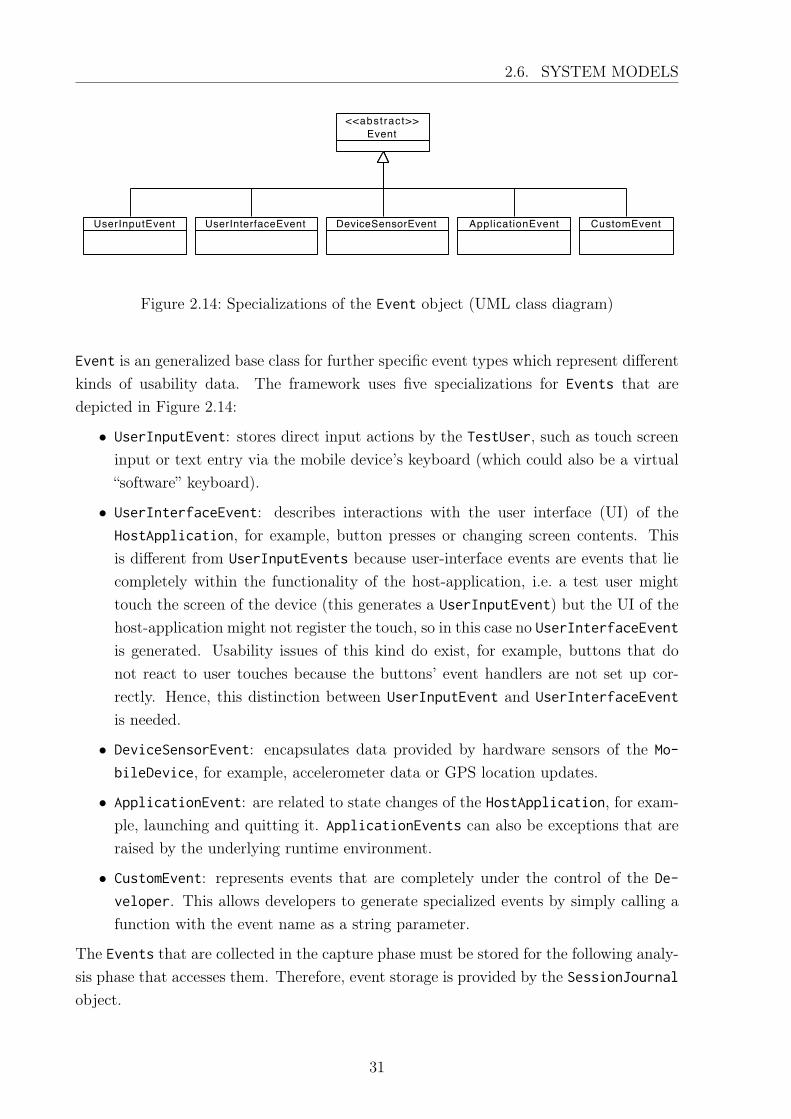
Event is an generalized base class for further specific event types which represent differentkinds of usability data. The framework uses five specializations for Events that aredepicted in Figure 2.14:
• UserInputEvent: stores direct input actions by the TestUser, such as touch screeninput or text entry via the mobile device’s keyboard (which could also be a virtual“software” keyboard).
• UserInterfaceEvent: describes interactions with the user interface (UI) of theHostApplication, for example, button presses or changing screen contents. Thisis different from UserInputEvents because user-interface events are events that liecompletely within the functionality of the host-application, i.e. a test user mighttouch the screen of the device (this generates a UserInputEvent) but the UI of thehost-application might not register the touch, so in this case no UserInterfaceEvent
is generated. Usability issues of this kind do exist, for example, buttons that donot react to user touches because the buttons’ event handlers are not set up cor-rectly. Hence, this distinction between UserInputEvent and UserInterfaceEvent
is needed.
• DeviceSensorEvent: encapsulates data provided by hardware sensors of the Mo-
bileDevice, for example, accelerometer data or GPS location updates.
• ApplicationEvent: are related to state changes of the HostApplication, for exam-ple, launching and quitting it. ApplicationEvents can also be exceptions that areraised by the underlying runtime environment.
• CustomEvent: represents events that are completely under the control of the De-
veloper. This allows developers to generate specialized events by simply calling afunction with the event name as a string parameter.
The Events that are collected in the capture phase must be stored for the following analy-sis phase that accesses them. Therefore, event storage is provided by the SessionJournal
object.
31
CHAPTER 2. REQUIREMENTS SPECIFICATION
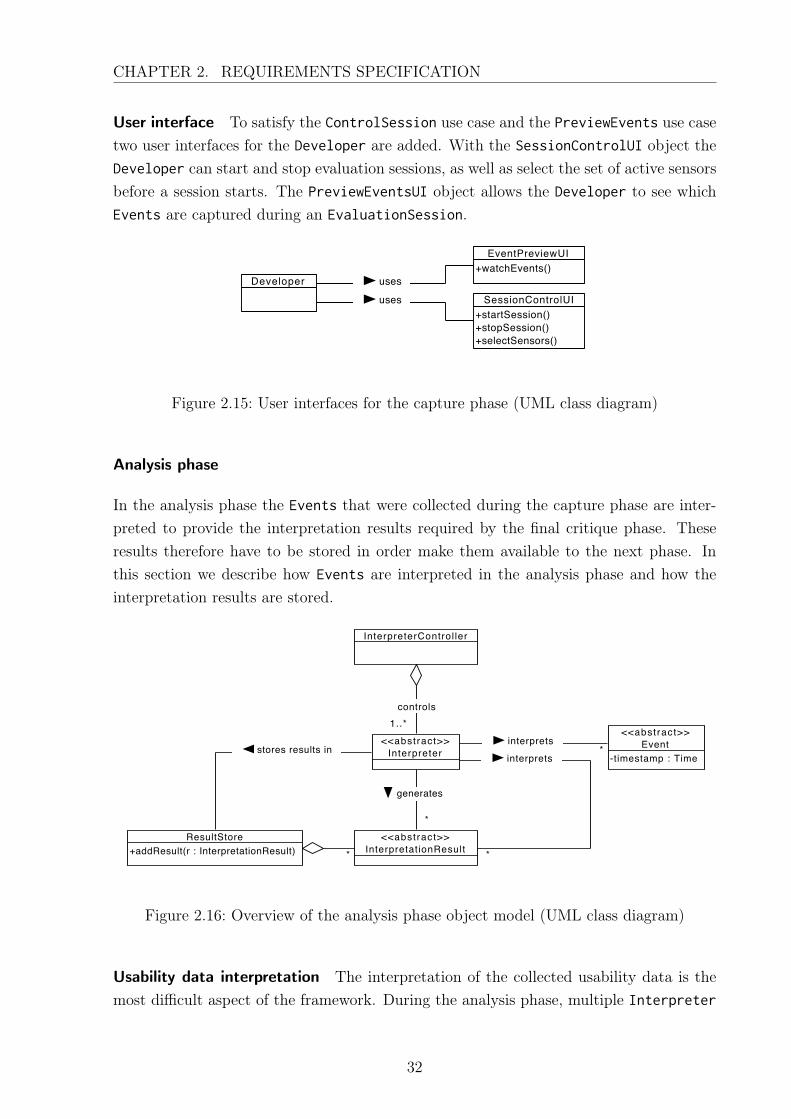
User interface To satisfy the ControlSession use case and the PreviewEvents use casetwo user interfaces for the Developer are added. With the SessionControlUI object theDeveloper can start and stop evaluation sessions, as well as select the set of active sensorsbefore a session starts. The PreviewEventsUI object allows the Developer to see whichEvents are captured during an EvaluationSession.
Developer
+startSession()+stopSession()+selectSensors()
SessionControlUI
+watchEvents()EventPreviewUI
uses
uses
Visual Paradigm for UML Standard Edition(TUM - Institut fuer Informatik - Lehrstuhl 1)
Figure 2.15: User interfaces for the capture phase (UML class diagram)
Analysis phase
In the analysis phase the Events that were collected during the capture phase are inter-preted to provide the interpretation results required by the final critique phase. Theseresults therefore have to be stored in order make them available to the next phase. Inthis section we describe how Events are interpreted in the analysis phase and how theinterpretation results are stored.
<<abstract>>InterpretationResult
<<abstract>>Interpreter
InterpreterControl ler
+addResult(r : InterpretationResult)ResultStore
-timestamp : Time
<<abstract>>Event
*
*
*
1..*
stores results in
controls
*
interprets
interprets
generates
Visual Paradigm for UML Standard Edition(TUM - Institut fuer Informatik - Lehrstuhl 1)
Figure 2.16: Overview of the analysis phase object model (UML class diagram)
Usability data interpretation The interpretation of the collected usability data is themost difficult aspect of the framework. During the analysis phase, multiple Interpreter
32
2.6. SYSTEM MODELS
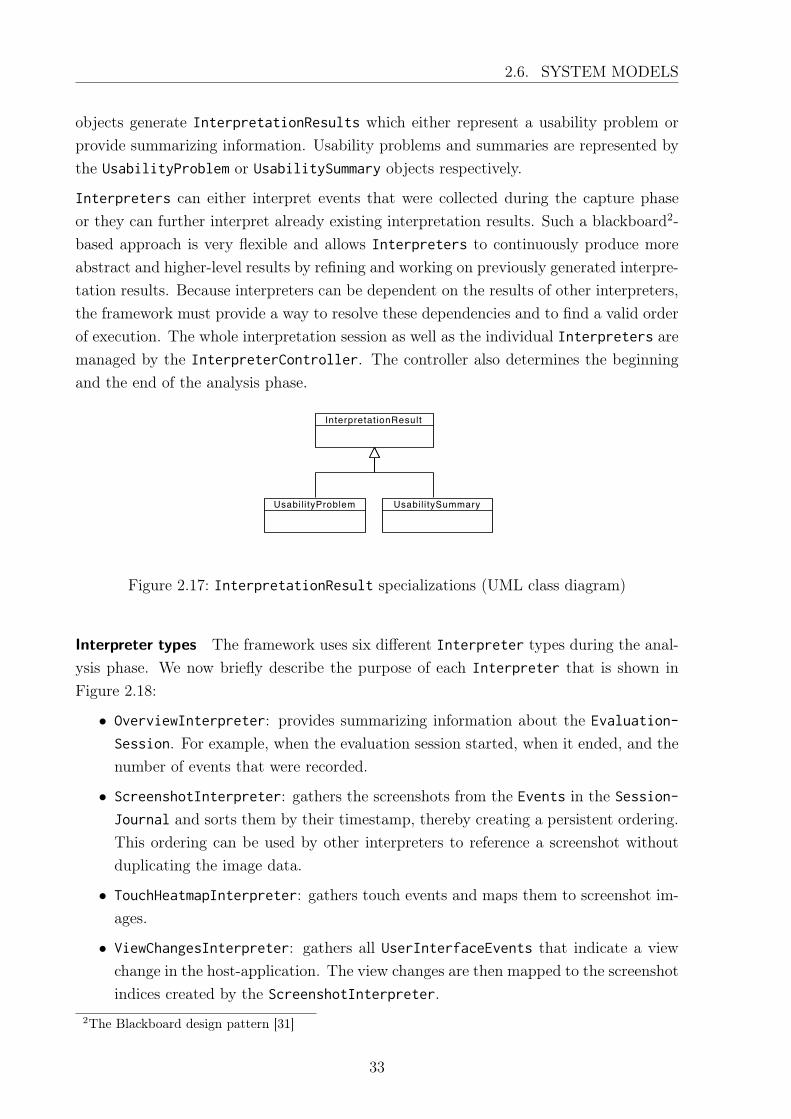
objects generate InterpretationResults which either represent a usability problem orprovide summarizing information. Usability problems and summaries are represented bythe UsabilityProblem or UsabilitySummary objects respectively.
Interpreters can either interpret events that were collected during the capture phaseor they can further interpret already existing interpretation results. Such a blackboard2-based approach is very flexible and allows Interpreters to continuously produce moreabstract and higher-level results by refining and working on previously generated interpre-tation results. Because interpreters can be dependent on the results of other interpreters,the framework must provide a way to resolve these dependencies and to find a valid orderof execution. The whole interpretation session as well as the individual Interpreters aremanaged by the InterpreterController. The controller also determines the beginningand the end of the analysis phase.
InterpretationResult
Usabil i tyProblem Usabil i tySummary
Visual Paradigm for UML Standard Edition(TUM - Institut fuer Informatik - Lehrstuhl 1)
Figure 2.17: InterpretationResult specializations (UML class diagram)
Interpreter types The framework uses six different Interpreter types during the anal-ysis phase. We now briefly describe the purpose of each Interpreter that is shown inFigure 2.18:
• OverviewInterpreter: provides summarizing information about the Evaluation-
Session. For example, when the evaluation session started, when it ended, and thenumber of events that were recorded.
• ScreenshotInterpreter: gathers the screenshots from the Events in the Session-
Journal and sorts them by their timestamp, thereby creating a persistent ordering.This ordering can be used by other interpreters to reference a screenshot withoutduplicating the image data.
• TouchHeatmapInterpreter: gathers touch events and maps them to screenshot im-ages.
• ViewChangesInterpreter: gathers all UserInterfaceEvents that indicate a viewchange in the host-application. The view changes are then mapped to the screenshotindices created by the ScreenshotInterpreter.
2The Blackboard design pattern [31]
33
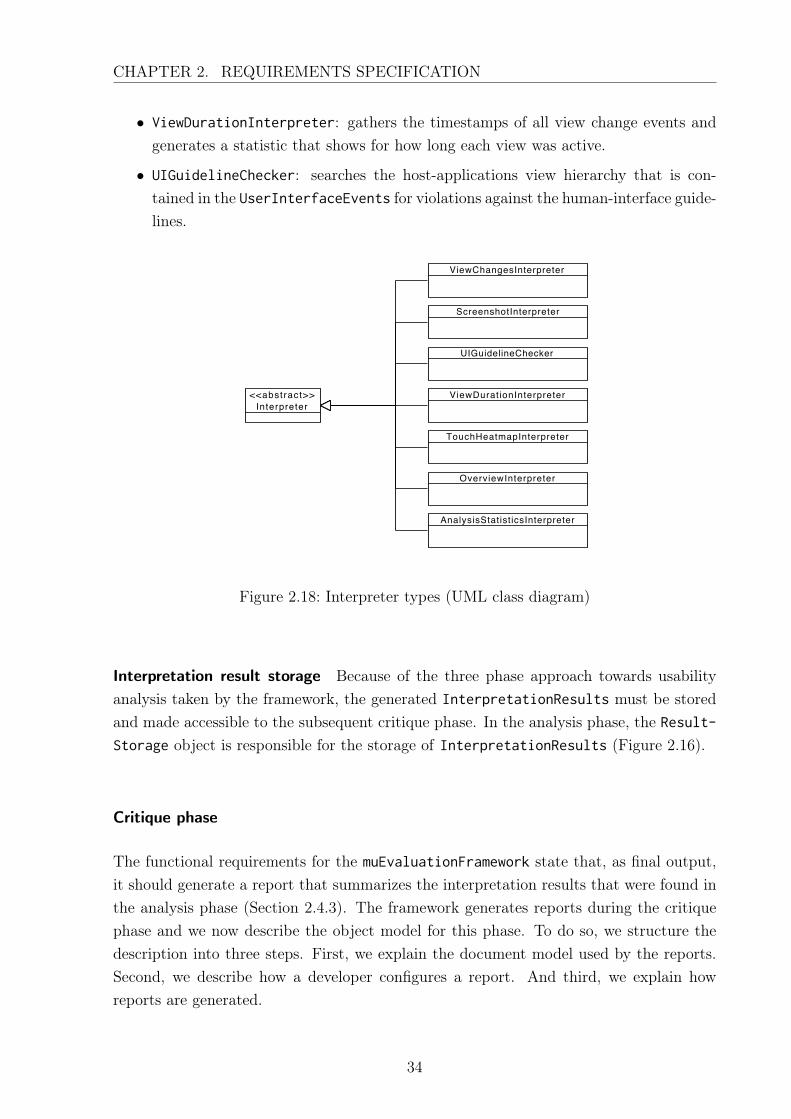
CHAPTER 2. REQUIREMENTS SPECIFICATION
• ViewDurationInterpreter: gathers the timestamps of all view change events andgenerates a statistic that shows for how long each view was active.
• UIGuidelineChecker: searches the host-applications view hierarchy that is con-tained in the UserInterfaceEvents for violations against the human-interface guide-lines.
<<abstract>>Interpreter
OverviewInterpreter
ViewChangesInterpreter
ScreenshotInterpreter
UIGuidelineChecker
ViewDurationInterpreter
TouchHeatmapInterpreter
AnalysisStatisticsInterpreter
Visual Paradigm for UML Standard Edition(TUM - Institut fuer Informatik - Lehrstuhl 1)
Figure 2.18: Interpreter types (UML class diagram)
Interpretation result storage Because of the three phase approach towards usabilityanalysis taken by the framework, the generated InterpretationResults must be storedand made accessible to the subsequent critique phase. In the analysis phase, the Result-
Storage object is responsible for the storage of InterpretationResults (Figure 2.16).
Critique phase
The functional requirements for the muEvaluationFramework state that, as final output,it should generate a report that summarizes the interpretation results that were found inthe analysis phase (Section 2.4.3). The framework generates reports during the critiquephase and we now describe the object model for this phase. To do so, we structure thedescription into three steps. First, we explain the document model used by the reports.Second, we describe how a developer configures a report. And third, we explain howreports are generated.
34
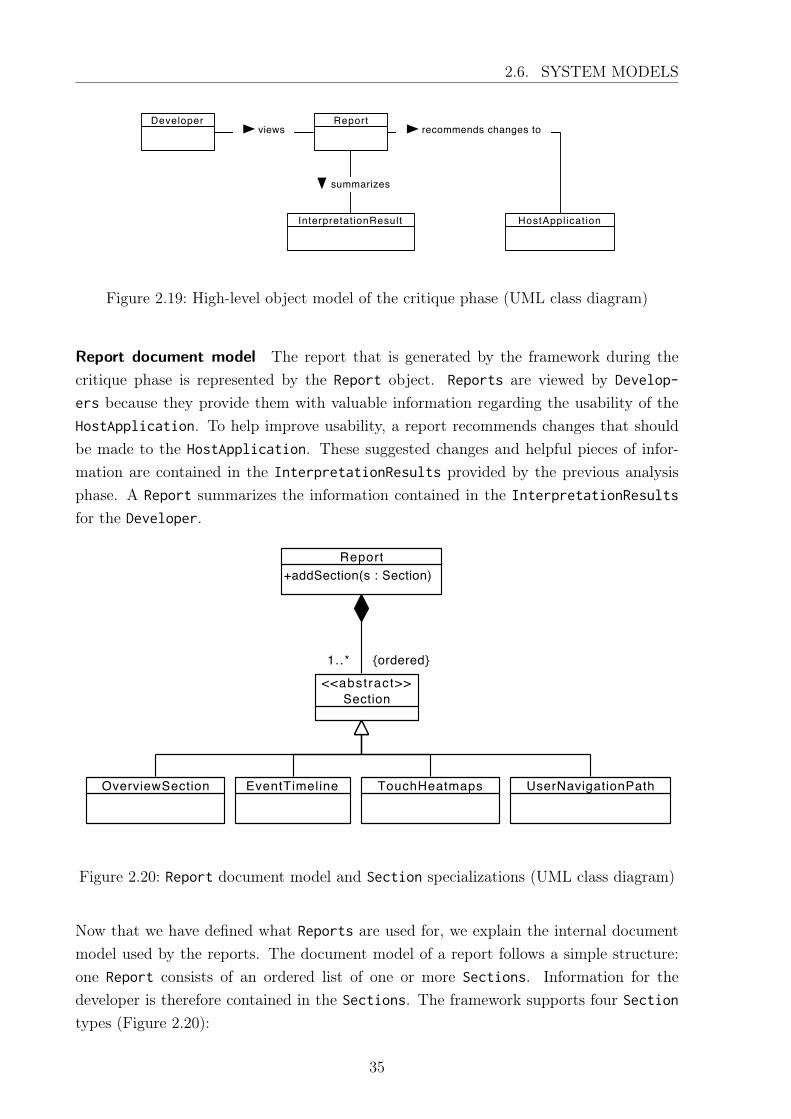
2.6. SYSTEM MODELS
Report
InterpretationResult
Developer
HostAppl icat ion
recommends changes toviews
summarizes
Visual Paradigm for UML Standard Edition(TUM - Institut fuer Informatik - Lehrstuhl 1)
Figure 2.19: High-level object model of the critique phase (UML class diagram)
Report document model The report that is generated by the framework during thecritique phase is represented by the Report object. Reports are viewed by Develop-
ers because they provide them with valuable information regarding the usability of theHostApplication. To help improve usability, a report recommends changes that shouldbe made to the HostApplication. These suggested changes and helpful pieces of infor-mation are contained in the InterpretationResults provided by the previous analysisphase. A Report summarizes the information contained in the InterpretationResults
for the Developer.
+addSection(s : Section)Report
<<abstract>>Section
OverviewSection EventTimeline TouchHeatmaps UserNavigationPath
1..* {ordered}
Visual Paradigm for UML Standard Edition(TUM - Institut fuer Informatik - Lehrstuhl 1)
Figure 2.20: Report document model and Section specializations (UML class diagram)
Now that we have defined what Reports are used for, we explain the internal documentmodel used by the reports. The document model of a report follows a simple structure:one Report consists of an ordered list of one or more Sections. Information for thedeveloper is therefore contained in the Sections. The framework supports four Section
types (Figure 2.20):
35
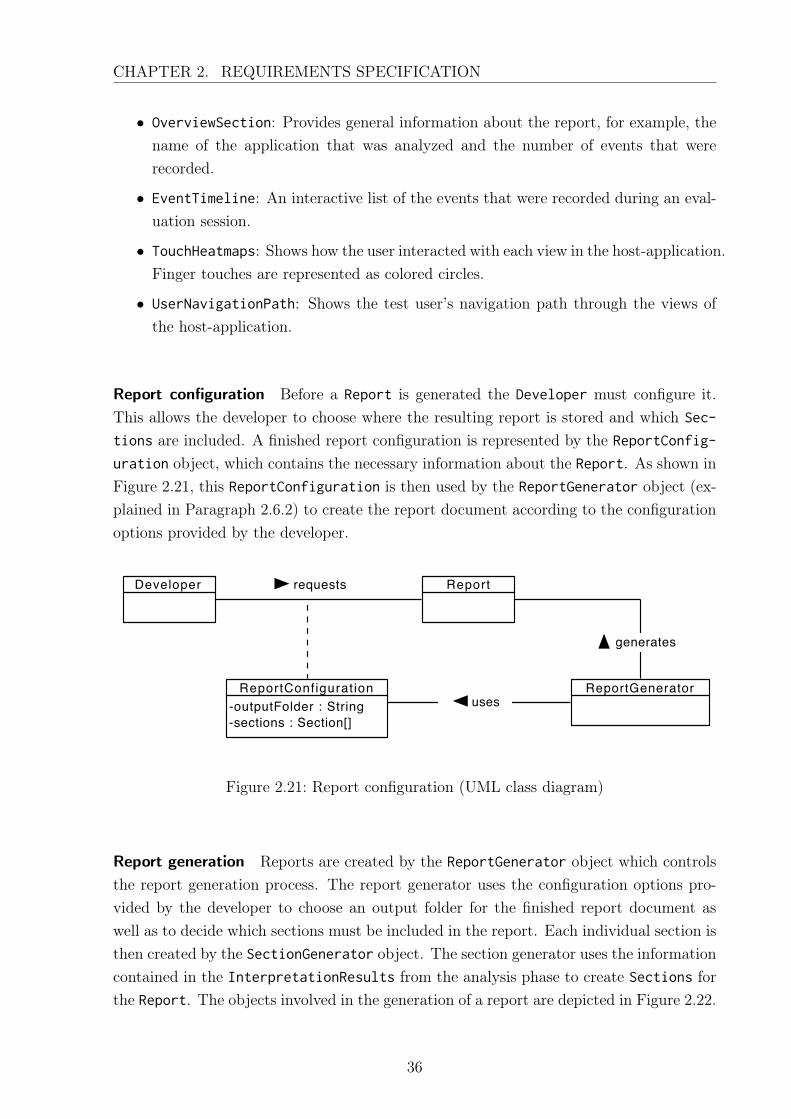
CHAPTER 2. REQUIREMENTS SPECIFICATION
• OverviewSection: Provides general information about the report, for example, thename of the application that was analyzed and the number of events that wererecorded.
• EventTimeline: An interactive list of the events that were recorded during an eval-uation session.
• TouchHeatmaps: Shows how the user interacted with each view in the host-application.Finger touches are represented as colored circles.
• UserNavigationPath: Shows the test user’s navigation path through the views ofthe host-application.
Report configuration Before a Report is generated the Developer must configure it.This allows the developer to choose where the resulting report is stored and which Sec-
tions are included. A finished report configuration is represented by the ReportConfig-
uration object, which contains the necessary information about the Report. As shown inFigure 2.21, this ReportConfiguration is then used by the ReportGenerator object (ex-plained in Paragraph 2.6.2) to create the report document according to the configurationoptions provided by the developer.
ReportGenerator
ReportDeveloper
-outputFolder : String-sections : Section[]
ReportConfigurationuses
generates
requestsVisual Paradigm for UML Standard Edition(TUM - Institut fuer Informatik - Lehrstuhl 1)
Figure 2.21: Report configuration (UML class diagram)
Report generation Reports are created by the ReportGenerator object which controlsthe report generation process. The report generator uses the configuration options pro-vided by the developer to choose an output folder for the finished report document aswell as to decide which sections must be included in the report. Each individual section isthen created by the SectionGenerator object. The section generator uses the informationcontained in the InterpretationResults from the analysis phase to create Sections forthe Report. The objects involved in the generation of a report are depicted in Figure 2.22.
36
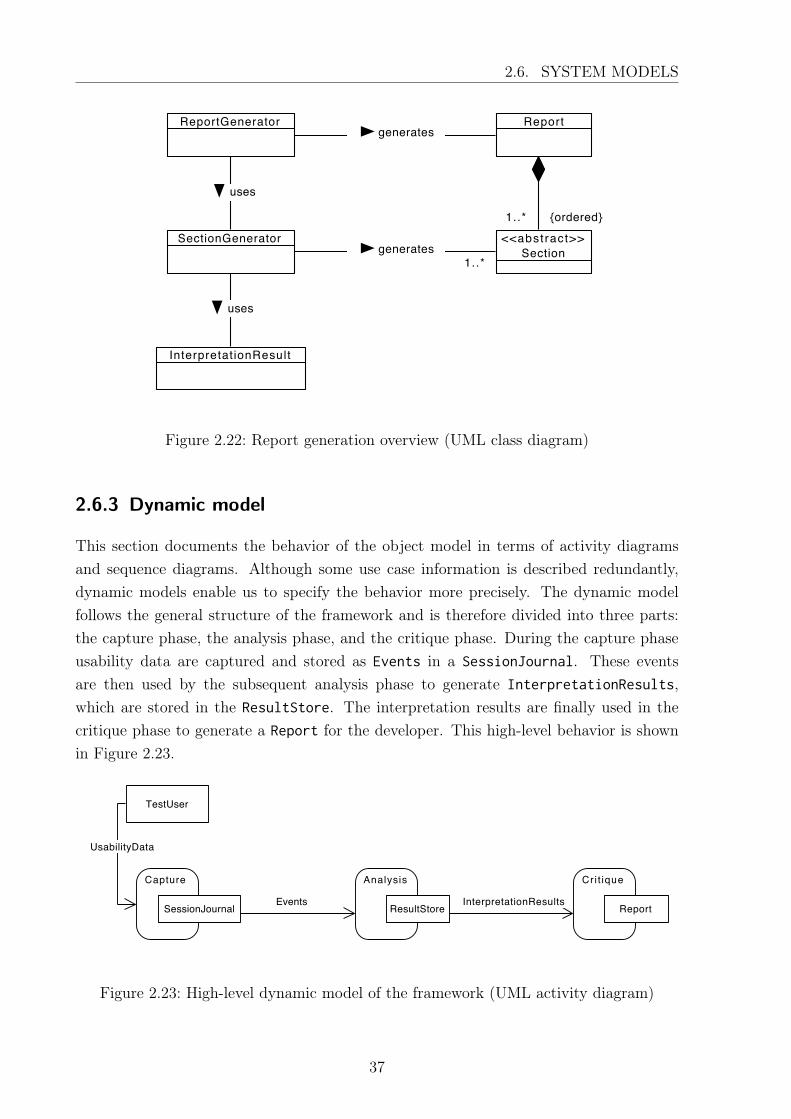
2.6. SYSTEM MODELS
ReportGenerator
InterpretationResult
<<abstract>>Section
Report
SectionGenerator
1..* {ordered}
1..*
uses
generates
uses
generates
Visual Paradigm for UML Standard Edition(TUM - Institut fuer Informatik - Lehrstuhl 1)
Figure 2.22: Report generation overview (UML class diagram)
2.6.3 Dynamic model
This section documents the behavior of the object model in terms of activity diagramsand sequence diagrams. Although some use case information is described redundantly,dynamic models enable us to specify the behavior more precisely. The dynamic modelfollows the general structure of the framework and is therefore divided into three parts:the capture phase, the analysis phase, and the critique phase. During the capture phaseusability data are captured and stored as Events in a SessionJournal. These eventsare then used by the subsequent analysis phase to generate InterpretationResults,which are stored in the ResultStore. The interpretation results are finally used in thecritique phase to generate a Report for the developer. This high-level behavior is shownin Figure 2.23.
Capture Analysis Cri t ique
TestUser
ReportResultStoreSessionJournal
UsabilityData
InterpretationResultsEvents
Visual Paradigm for UML Standard Edition(TUM - Institut fuer Informatik - Lehrstuhl 1)
Figure 2.23: High-level dynamic model of the framework (UML activity diagram)
37
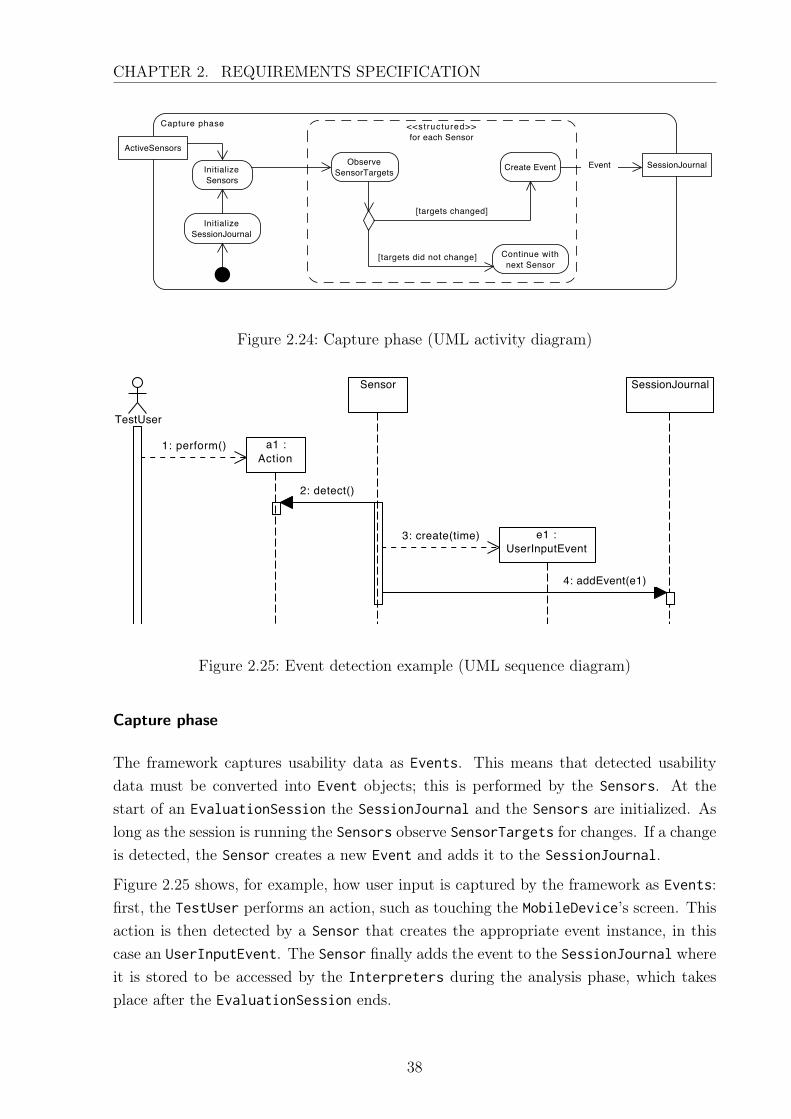
CHAPTER 2. REQUIREMENTS SPECIFICATION
Capture phase
InitializeSessionJournal
InitializeSensors
Create EventObserveSensorTargets
Continue withnext Sensor
ActiveSensors
<<structured>>for each Sensor
SessionJournal
[targets did not change]
Event
[targets changed]
Visual Paradigm for UML Standard Edition(TUM - Institut fuer Informatik - Lehrstuhl 1)
Figure 2.24: Capture phase (UML activity diagram)
SessionJournal
e1 :UserInputEvent
TestUser
a1 :Action
Sensor
2: detect()
4: addEvent(e1)
3: create(time)
1: perform()
Visual Paradigm for UML Standard Edition(TUM - Institut fuer Informatik - Lehrstuhl 1)
Figure 2.25: Event detection example (UML sequence diagram)
Capture phase
The framework captures usability data as Events. This means that detected usabilitydata must be converted into Event objects; this is performed by the Sensors. At thestart of an EvaluationSession the SessionJournal and the Sensors are initialized. Aslong as the session is running the Sensors observe SensorTargets for changes. If a changeis detected, the Sensor creates a new Event and adds it to the SessionJournal.
Figure 2.25 shows, for example, how user input is captured by the framework as Events:first, the TestUser performs an action, such as touching the MobileDevice’s screen. Thisaction is then detected by a Sensor that creates the appropriate event instance, in thiscase an UserInputEvent. The Sensor finally adds the event to the SessionJournal whereit is stored to be accessed by the Interpreters during the analysis phase, which takesplace after the EvaluationSession ends.
38
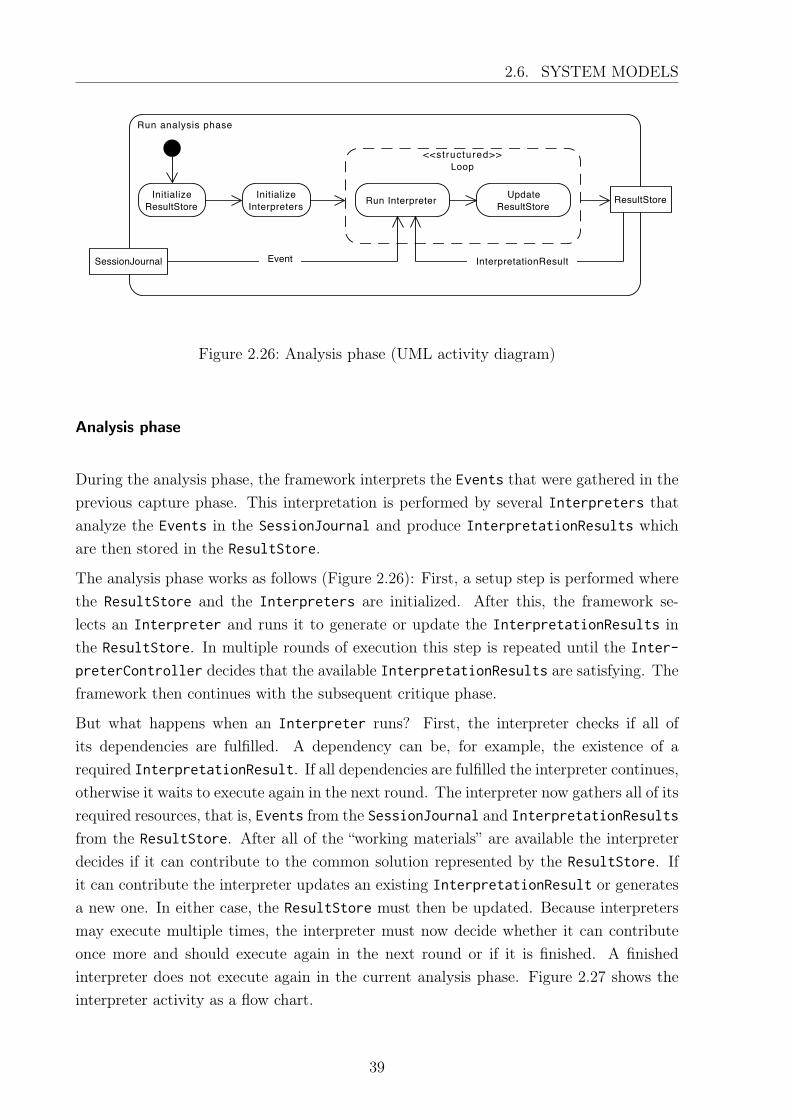
2.6. SYSTEM MODELS
Run analysis phase
InitializeResultStore
InitializeInterpreters
UpdateResultStoreRun Interpreter ResultStore
<<structured>>Loop
SessionJournal InterpretationResultEvent
Visual Paradigm for UML Standard Edition(TUM - Institut fuer Informatik - Lehrstuhl 1)
Figure 2.26: Analysis phase (UML activity diagram)
Analysis phase
During the analysis phase, the framework interprets the Events that were gathered in theprevious capture phase. This interpretation is performed by several Interpreters thatanalyze the Events in the SessionJournal and produce InterpretationResults whichare then stored in the ResultStore.
The analysis phase works as follows (Figure 2.26): First, a setup step is performed wherethe ResultStore and the Interpreters are initialized. After this, the framework se-lects an Interpreter and runs it to generate or update the InterpretationResults inthe ResultStore. In multiple rounds of execution this step is repeated until the Inter-
preterController decides that the available InterpretationResults are satisfying. Theframework then continues with the subsequent critique phase.
But what happens when an Interpreter runs? First, the interpreter checks if all ofits dependencies are fulfilled. A dependency can be, for example, the existence of arequired InterpretationResult. If all dependencies are fulfilled the interpreter continues,otherwise it waits to execute again in the next round. The interpreter now gathers all of itsrequired resources, that is, Events from the SessionJournal and InterpretationResults
from the ResultStore. After all of the “working materials” are available the interpreterdecides if it can contribute to the common solution represented by the ResultStore. Ifit can contribute the interpreter updates an existing InterpretationResult or generatesa new one. In either case, the ResultStore must then be updated. Because interpretersmay execute multiple times, the interpreter must now decide whether it can contributeonce more and should execute again in the next round or if it is finished. A finishedinterpreter does not execute again in the current analysis phase. Figure 2.27 shows theinterpreter activity as a flow chart.
39
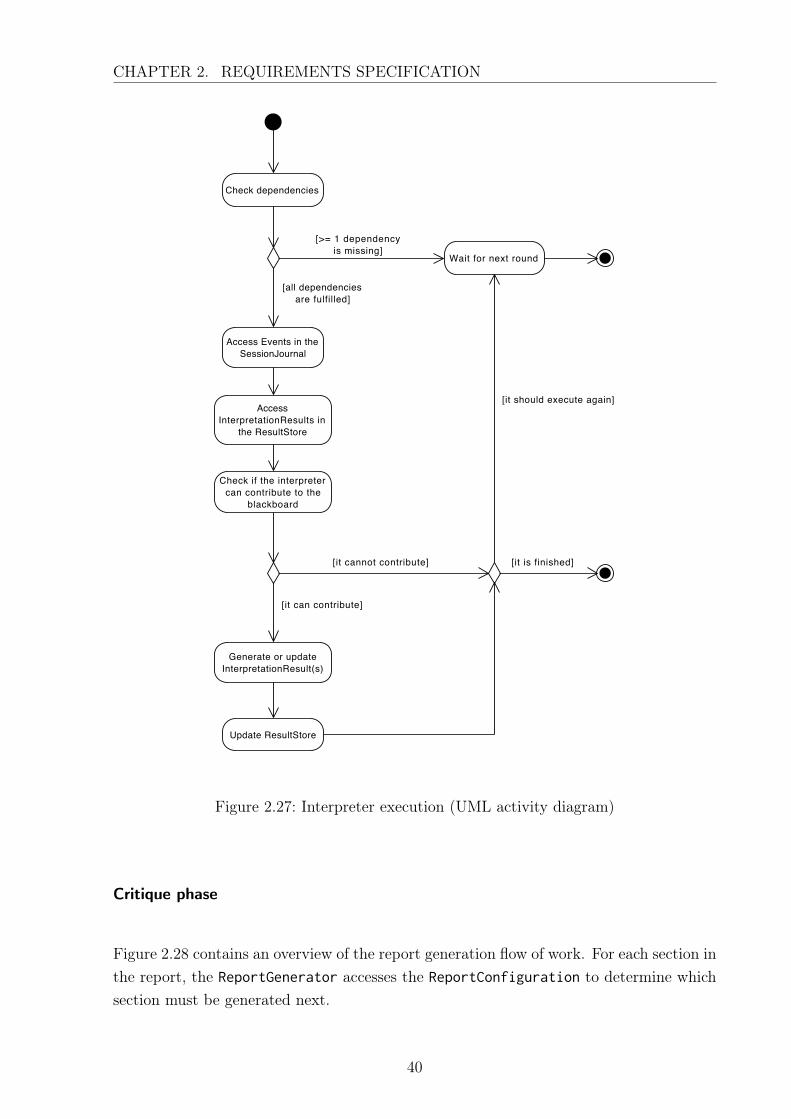
CHAPTER 2. REQUIREMENTS SPECIFICATION
Check dependencies
Access Events in theSessionJournal
AccessInterpretationResults in
the ResultStore
Wait for next round
Generate or updateInterpretationResult(s)
Update ResultStore
Check if the interpretercan contribute to the
blackboard
[it is finished]
[it should execute again]
[it can contribute]
[it cannot contribute]
[all dependenciesare fulfilled]
[>= 1 dependencyis missing]
Visual Paradigm for UML Standard Edition(TUM - Institut fuer Informatik - Lehrstuhl 1)
Figure 2.27: Interpreter execution (UML activity diagram)
Critique phase
Figure 2.28 contains an overview of the report generation flow of work. For each section inthe report, the ReportGenerator accesses the ReportConfiguration to determine whichsection must be generated next.
40
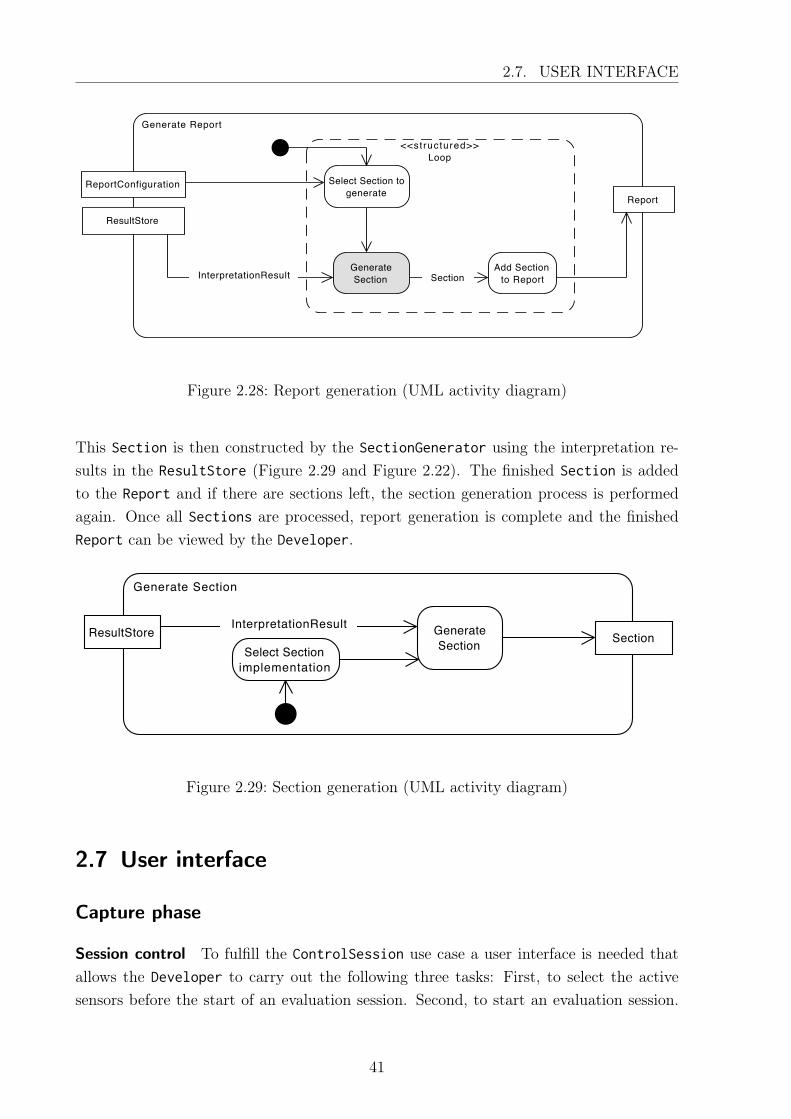
2.7. USER INTERFACE
Generate Report
Add Sectionto Report
GenerateSection
Select Section togenerate
ReportConfiguration
<<structured>>Loop
Report
ResultStore
InterpretationResult Section
Visual Paradigm for UML Standard Edition(TUM - Institut fuer Informatik - Lehrstuhl 1)
Figure 2.28: Report generation (UML activity diagram)
This Section is then constructed by the SectionGenerator using the interpretation re-sults in the ResultStore (Figure 2.29 and Figure 2.22). The finished Section is addedto the Report and if there are sections left, the section generation process is performedagain. Once all Sections are processed, report generation is complete and the finishedReport can be viewed by the Developer.
Generate Section
Select Sectionimplementation
GenerateSection SectionResultStore
InterpretationResult
Visual Paradigm for UML Standard Edition(TUM - Institut fuer Informatik - Lehrstuhl 1)
Figure 2.29: Section generation (UML activity diagram)
2.7 User interface
Capture phase
Session control To fulfill the ControlSession use case a user interface is needed thatallows the Developer to carry out the following three tasks: First, to select the activesensors before the start of an evaluation session. Second, to start an evaluation session.
41
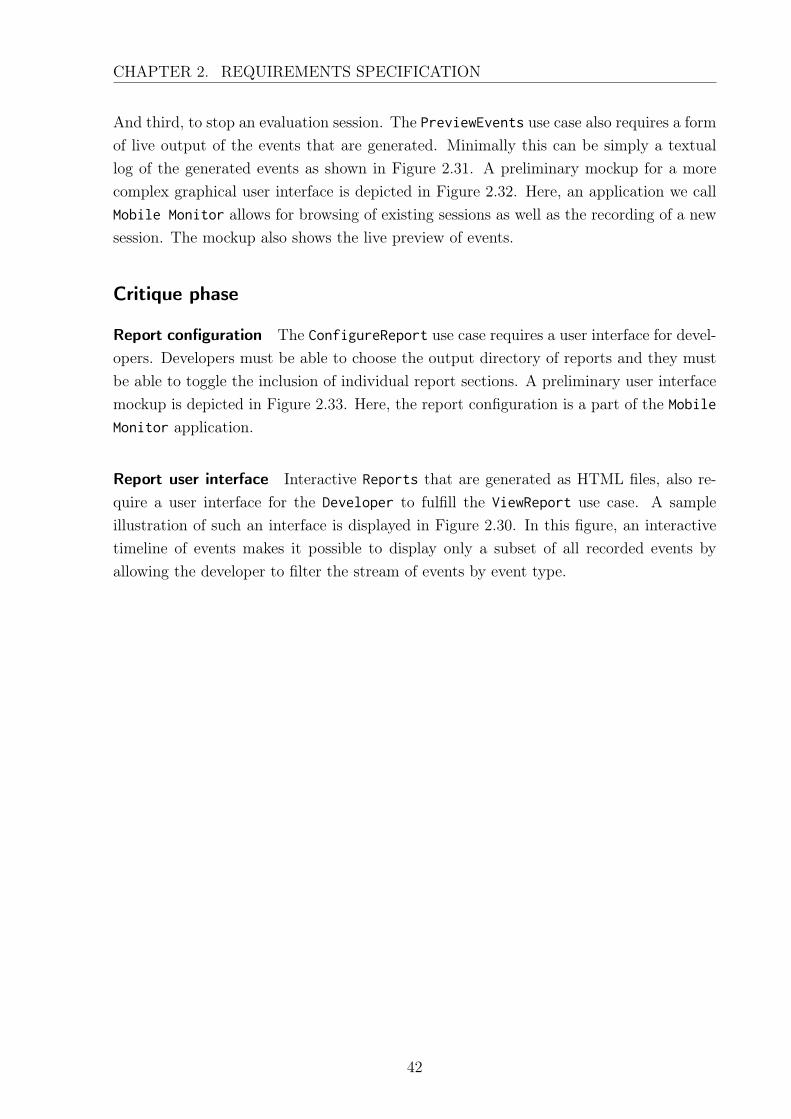
CHAPTER 2. REQUIREMENTS SPECIFICATION
And third, to stop an evaluation session. The PreviewEvents use case also requires a formof live output of the events that are generated. Minimally this can be simply a textuallog of the generated events as shown in Figure 2.31. A preliminary mockup for a morecomplex graphical user interface is depicted in Figure 2.32. Here, an application we callMobile Monitor allows for browsing of existing sessions as well as the recording of a newsession. The mockup also shows the live preview of events.
Critique phase
Report configuration The ConfigureReport use case requires a user interface for devel-opers. Developers must be able to choose the output directory of reports and they mustbe able to toggle the inclusion of individual report sections. A preliminary user interfacemockup is depicted in Figure 2.33. Here, the report configuration is a part of the Mobile
Monitor application.
Report user interface Interactive Reports that are generated as HTML files, also re-quire a user interface for the Developer to fulfill the ViewReport use case. A sampleillustration of such an interface is displayed in Figure 2.30. In this figure, an interactivetimeline of events makes it possible to display only a subset of all recorded events byallowing the developer to filter the stream of events by event type.
42
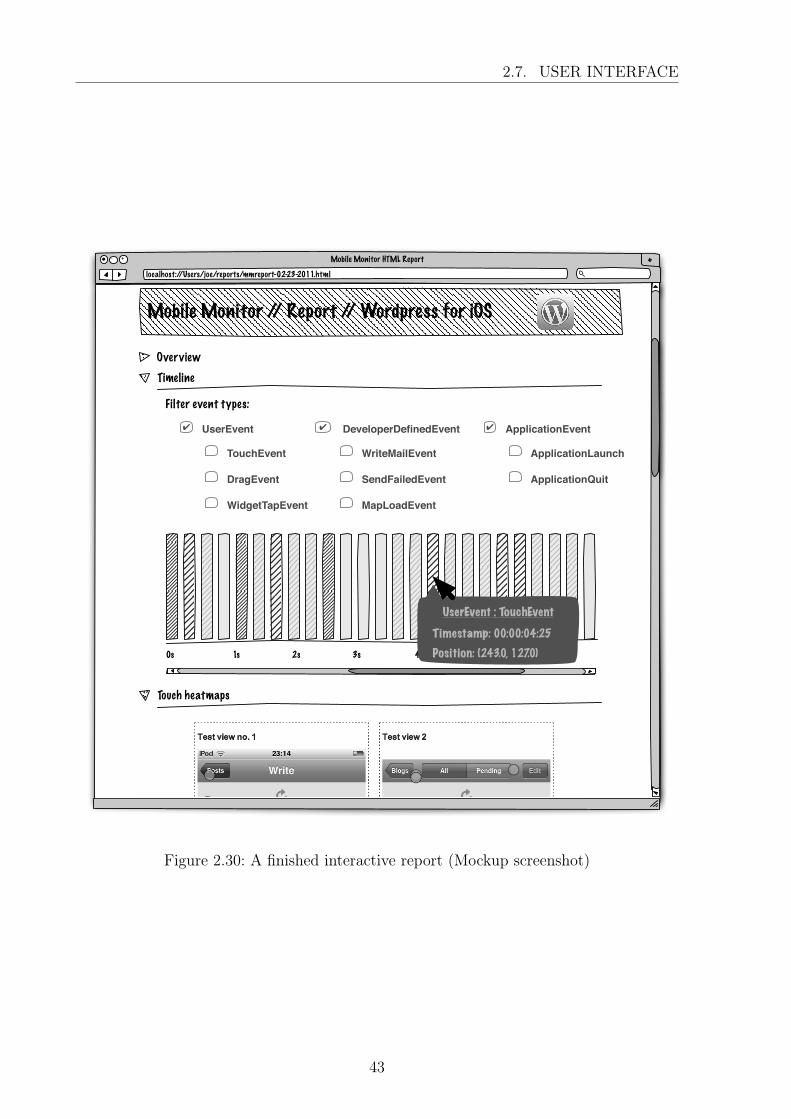
2.7. USER INTERFACE
+- + Mobile Monitor HTML Report
localhost://Users/joe/reports/mmreport-02-23-2011.html
Overview
Timeline
0s 1s 2s 3s 4s 5s 6s
Filter event types:
TouchEvent
UserEvent✔
DragEvent
WidgetTapEvent
WriteMailEvent
DeveloperDefinedEvent✔
SendFailedEvent
MapLoadEvent
ApplicationLaunch
ApplicationEvent✔
ApplicationQuit
Touch heatmaps
Mobile Monitor // Report // Wordpress for iOS
UserEvent : TouchEvent
Timestamp: 00:00:04:25
Position: (243.0, 127.0)
Figure 2.30: A finished interactive report (Mockup screenshot)
43
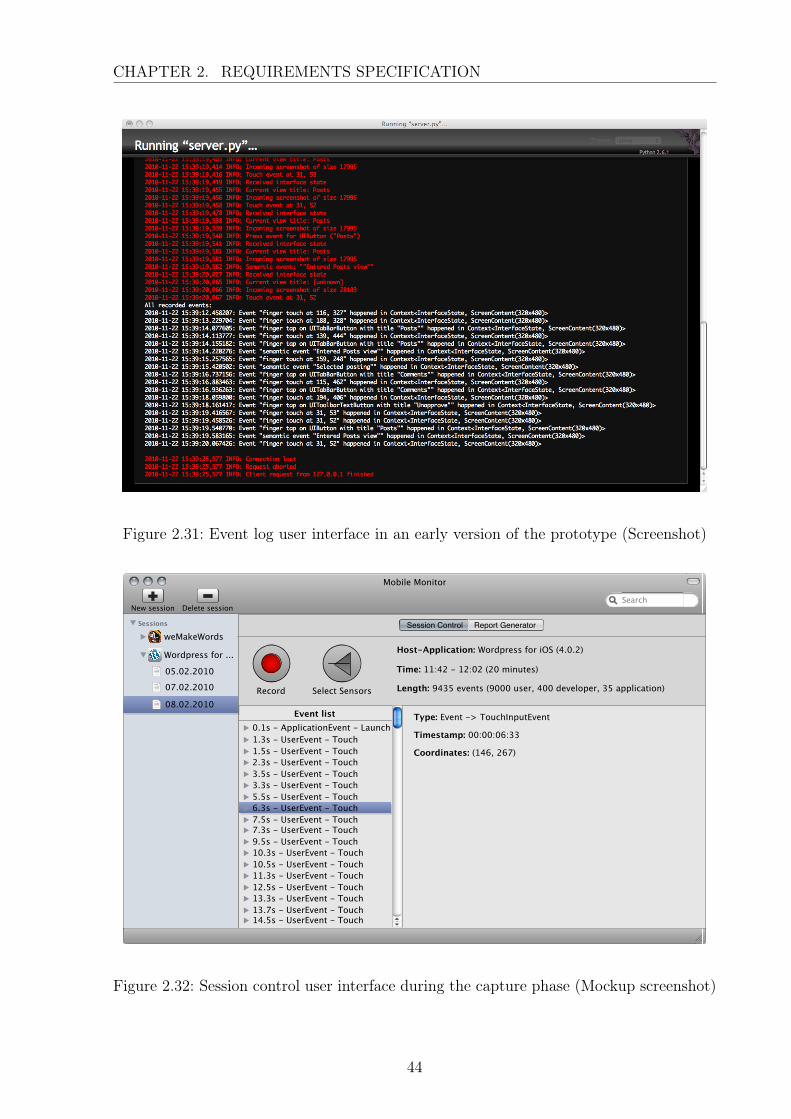
CHAPTER 2. REQUIREMENTS SPECIFICATION
Figure 2.31: Event log user interface in an early version of the prototype (Screenshot)
Mobile Monitor
Sessions
weMakeWords
Wordpress for ...
05.02.2010
07.02.2010
08.02.2010
SearchNew session Delete session
Session Control Report Generator
Record
Time: 11:42 - 12:02 (20 minutes)
Length: 9435 events (9000 user, 400 developer, 35 application)
Host-Application: Wordpress for iOS (4.0.2)
1.3s - UserEvent - Touch
Event list0.1s - ApplicationEvent - Launch
1.5s - UserEvent - Touch2.3s - UserEvent - Touch3.5s - UserEvent - Touch3.3s - UserEvent - Touch5.5s - UserEvent - Touch6.3s - UserEvent - Touch7.5s - UserEvent - Touch7.3s - UserEvent - Touch9.5s - UserEvent - Touch10.3s - UserEvent - Touch10.5s - UserEvent - Touch11.3s - UserEvent - Touch12.5s - UserEvent - Touch13.3s - UserEvent - Touch13.7s - UserEvent - Touch14.5s - UserEvent - Touch
Type: Event -> TouchInputEvent
Coordinates: (146, 267)
Timestamp: 00:00:06:33
Select Sensors
Figure 2.32: Session control user interface during the capture phase (Mockup screenshot)
44
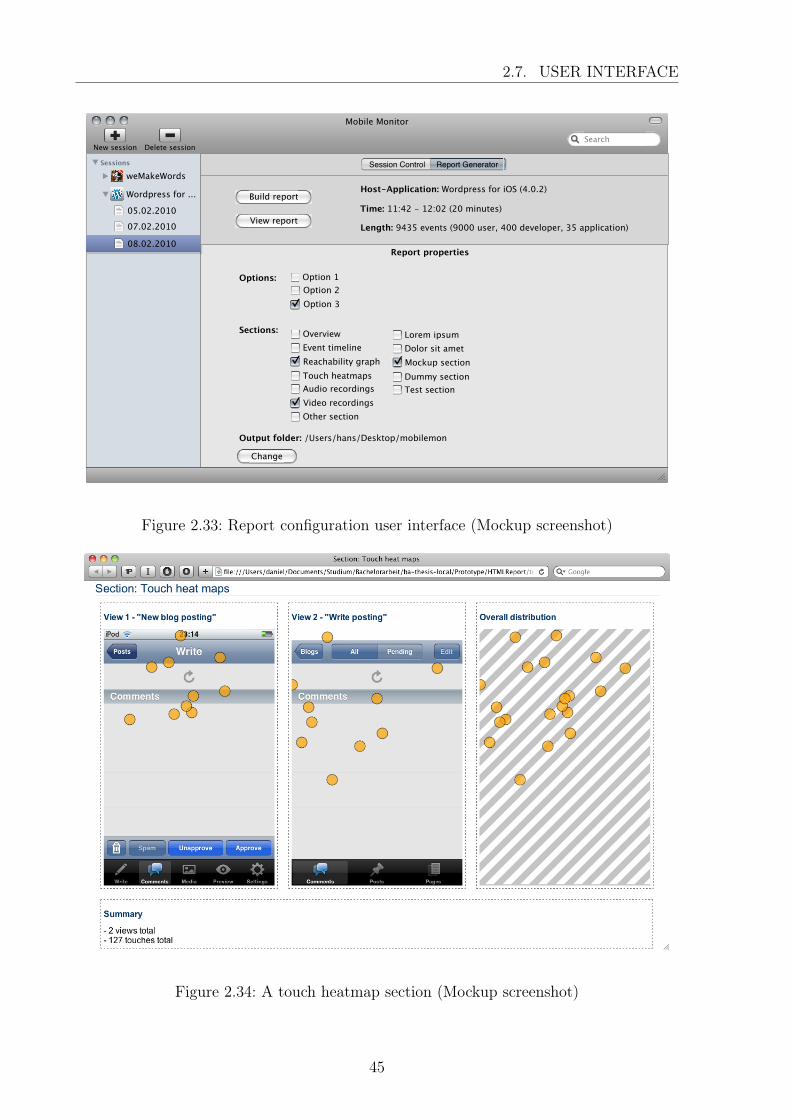
2.7. USER INTERFACE
Mobile Monitor
Sessions
weMakeWords
Wordpress for ...
05.02.2010
07.02.2010
08.02.2010
SearchNew session Delete session
Session Control Report Generator
Report properties
Build report
View report
Option 1
Option 3Option 2
Options:
Sections:
Output folder: /Users/hans/Desktop/mobilemon
Change
Overview
Reachability graphEvent timeline
Touch heatmaps
Video recordingsAudio recordings
Other section
Lorem ipsum
Mockup sectionDolor sit amet
Dummy sectionTest section
Time: 11:42 - 12:02 (20 minutes)
Length: 9435 events (9000 user, 400 developer, 35 application)
Host-Application: Wordpress for iOS (4.0.2)
Figure 2.33: Report configuration user interface (Mockup screenshot)
Figure 2.34: A touch heatmap section (Mockup screenshot)
45

CHAPTER 2. REQUIREMENTS SPECIFICATION
46
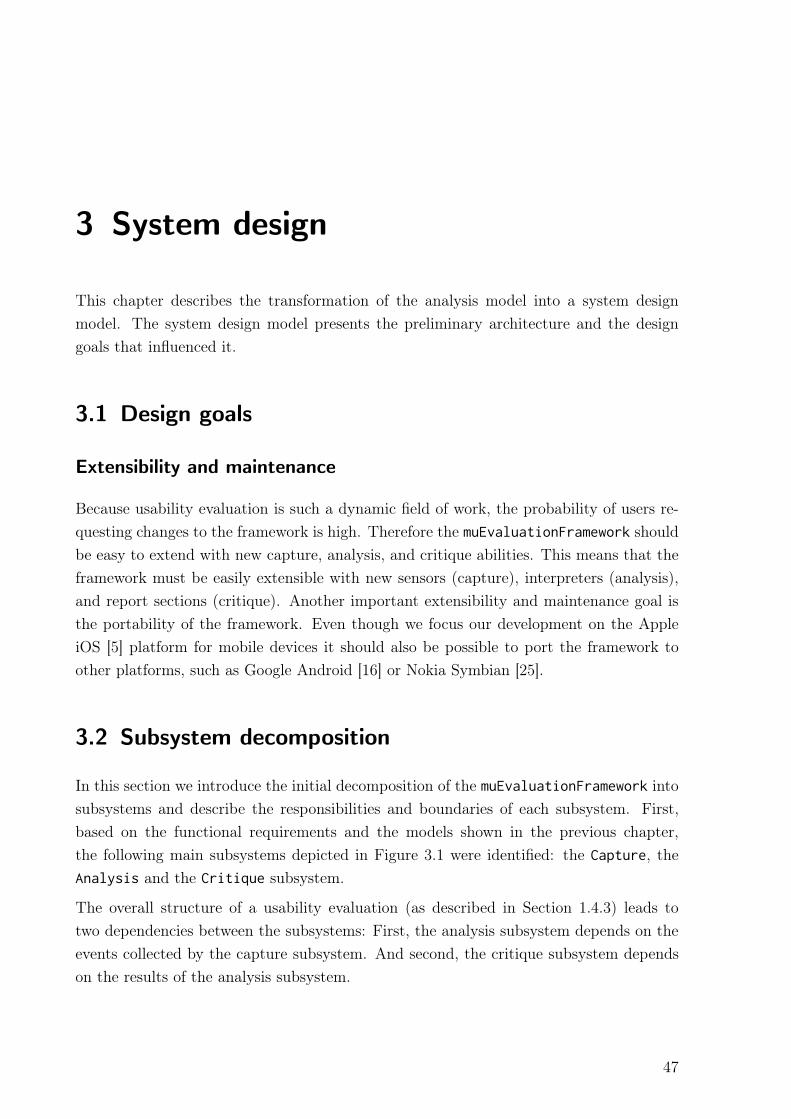
3 System design
This chapter describes the transformation of the analysis model into a system designmodel. The system design model presents the preliminary architecture and the designgoals that influenced it.
3.1 Design goals
Extensibility and maintenance
Because usability evaluation is such a dynamic field of work, the probability of users re-questing changes to the framework is high. Therefore the muEvaluationFramework shouldbe easy to extend with new capture, analysis, and critique abilities. This means that theframework must be easily extensible with new sensors (capture), interpreters (analysis),and report sections (critique). Another important extensibility and maintenance goal isthe portability of the framework. Even though we focus our development on the AppleiOS [5] platform for mobile devices it should also be possible to port the framework toother platforms, such as Google Android [16] or Nokia Symbian [25].
3.2 Subsystem decomposition
In this section we introduce the initial decomposition of the muEvaluationFramework intosubsystems and describe the responsibilities and boundaries of each subsystem. First,based on the functional requirements and the models shown in the previous chapter,the following main subsystems depicted in Figure 3.1 were identified: the Capture, theAnalysis and the Critique subsystem.
The overall structure of a usability evaluation (as described in Section 1.4.3) leads totwo dependencies between the subsystems: First, the analysis subsystem depends on theevents collected by the capture subsystem. And second, the critique subsystem dependson the results of the analysis subsystem.
47
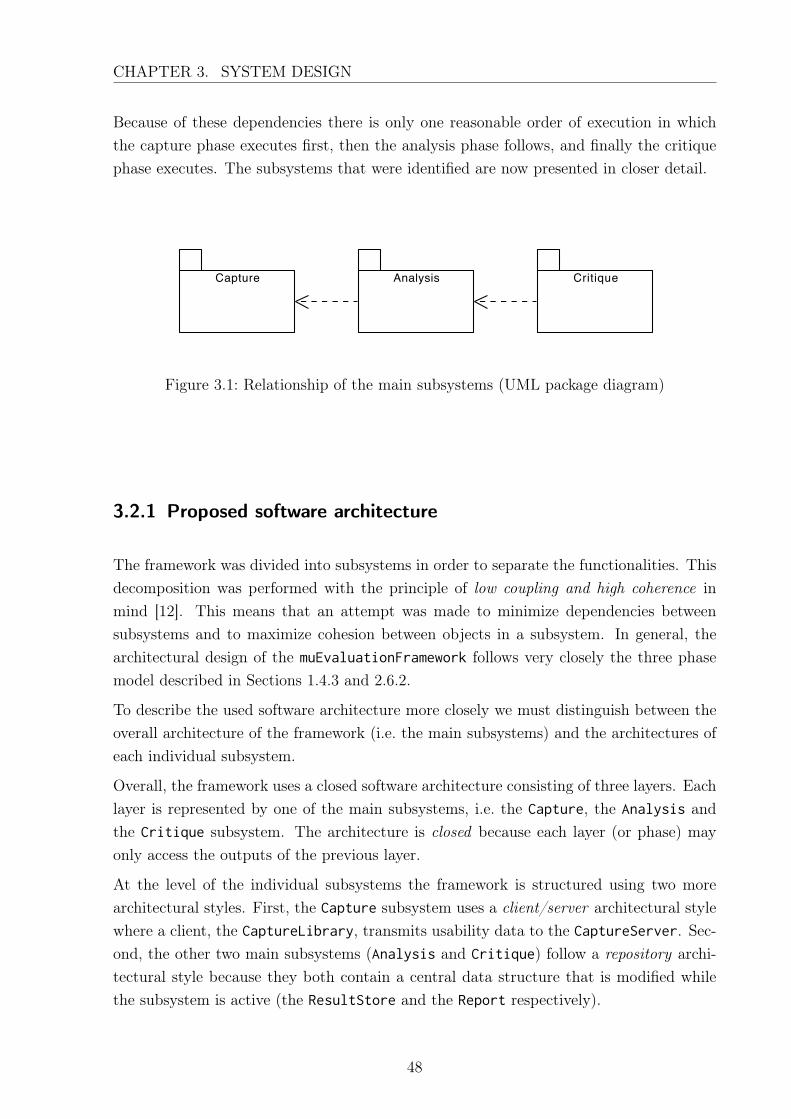
CHAPTER 3. SYSTEM DESIGN
Because of these dependencies there is only one reasonable order of execution in whichthe capture phase executes first, then the analysis phase follows, and finally the critiquephase executes. The subsystems that were identified are now presented in closer detail.
Capture Analysis Critique
Visual Paradigm for UML Standard Edition(TUM - Institut fuer Informatik - Lehrstuhl 1)
Figure 3.1: Relationship of the main subsystems (UML package diagram)
3.2.1 Proposed software architecture
The framework was divided into subsystems in order to separate the functionalities. Thisdecomposition was performed with the principle of low coupling and high coherence inmind [12]. This means that an attempt was made to minimize dependencies betweensubsystems and to maximize cohesion between objects in a subsystem. In general, thearchitectural design of the muEvaluationFramework follows very closely the three phasemodel described in Sections 1.4.3 and 2.6.2.
To describe the used software architecture more closely we must distinguish between theoverall architecture of the framework (i.e. the main subsystems) and the architectures ofeach individual subsystem.
Overall, the framework uses a closed software architecture consisting of three layers. Eachlayer is represented by one of the main subsystems, i.e. the Capture, the Analysis andthe Critique subsystem. The architecture is closed because each layer (or phase) mayonly access the outputs of the previous layer.
At the level of the individual subsystems the framework is structured using two morearchitectural styles. First, the Capture subsystem uses a client/server architectural stylewhere a client, the CaptureLibrary, transmits usability data to the CaptureServer. Sec-ond, the other two main subsystems (Analysis and Critique) follow a repository archi-tectural style because they both contain a central data structure that is modified whilethe subsystem is active (the ResultStore and the Report respectively).
48
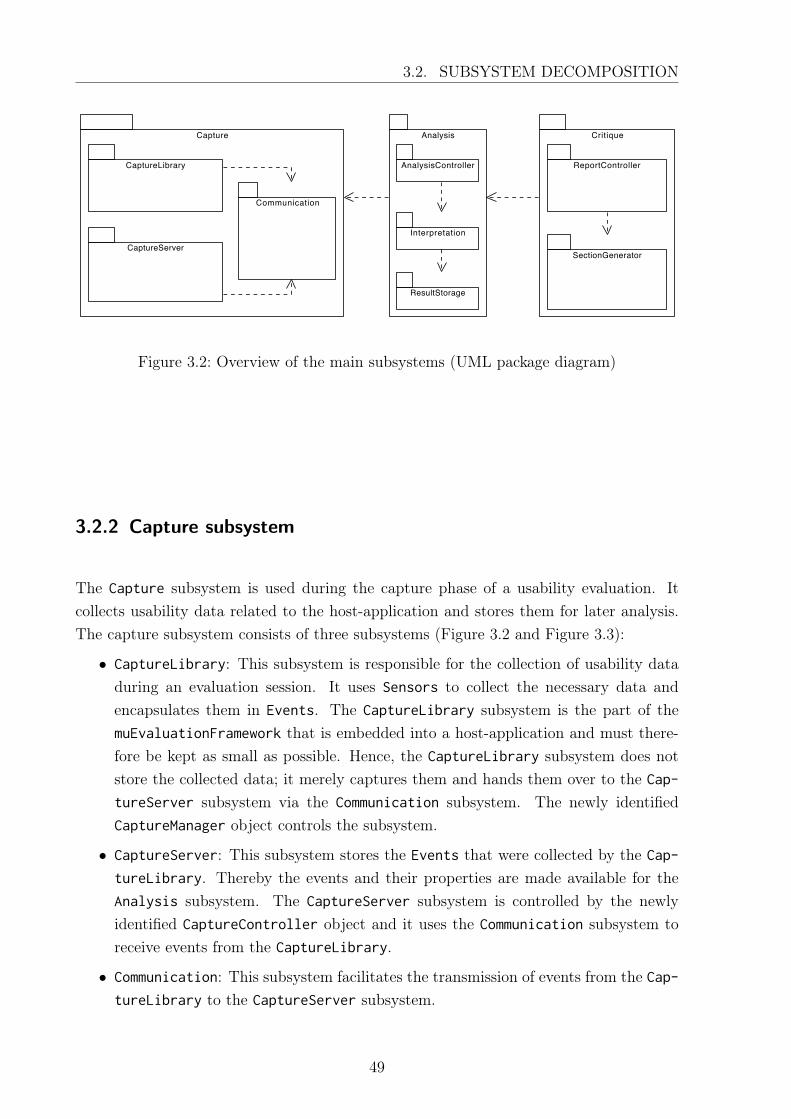
3.2. SUBSYSTEM DECOMPOSITION
Capture CritiqueAnalysis
ReportController
ResultStorage
AnalysisController
Interpretation
SectionGenerator
CaptureLibrary
CaptureServer
Communication
Visual Paradigm for UML Standard Edition(TUM - Institut fuer Informatik - Lehrstuhl 1)
Figure 3.2: Overview of the main subsystems (UML package diagram)
3.2.2 Capture subsystem
The Capture subsystem is used during the capture phase of a usability evaluation. Itcollects usability data related to the host-application and stores them for later analysis.The capture subsystem consists of three subsystems (Figure 3.2 and Figure 3.3):
• CaptureLibrary: This subsystem is responsible for the collection of usability dataduring an evaluation session. It uses Sensors to collect the necessary data andencapsulates them in Events. The CaptureLibrary subsystem is the part of themuEvaluationFramework that is embedded into a host-application and must there-fore be kept as small as possible. Hence, the CaptureLibrary subsystem does notstore the collected data; it merely captures them and hands them over to the Cap-
tureServer subsystem via the Communication subsystem. The newly identifiedCaptureManager object controls the subsystem.
• CaptureServer: This subsystem stores the Events that were collected by the Cap-
tureLibrary. Thereby the events and their properties are made available for theAnalysis subsystem. The CaptureServer subsystem is controlled by the newlyidentified CaptureController object and it uses the Communication subsystem toreceive events from the CaptureLibrary.
• Communication: This subsystem facilitates the transmission of events from the Cap-tureLibrary to the CaptureServer subsystem.
49
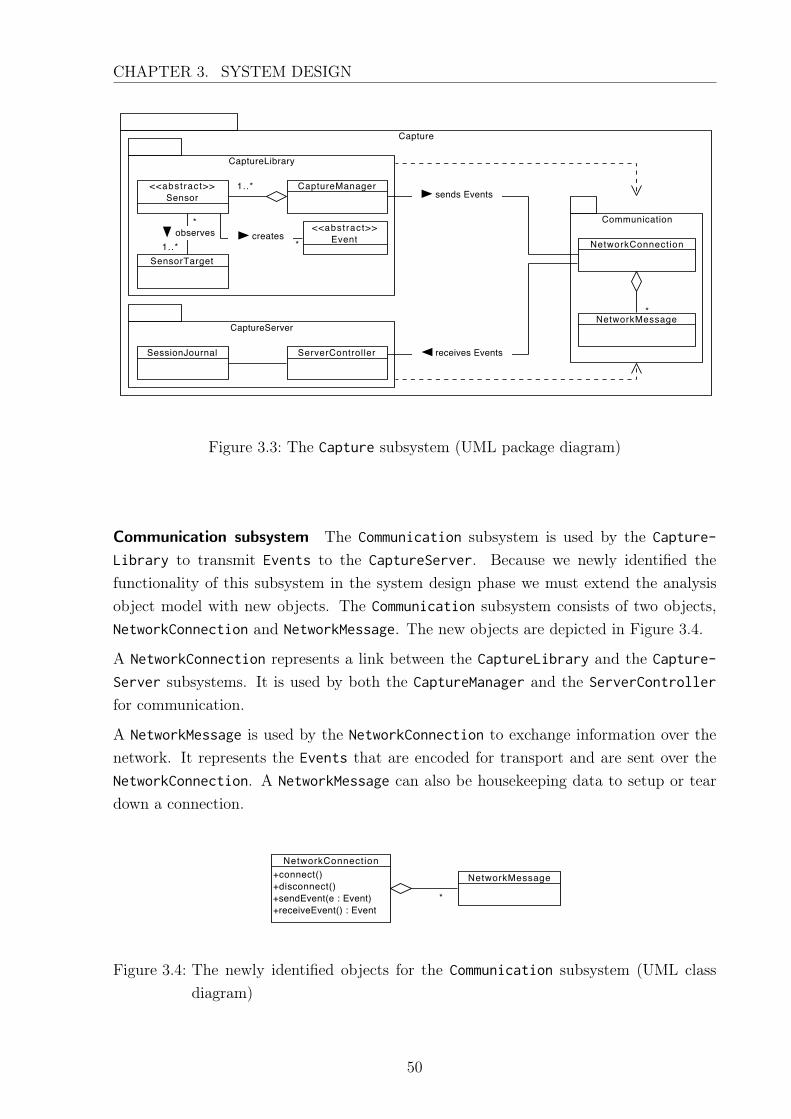
CHAPTER 3. SYSTEM DESIGN
Capture
CaptureLibrary
CaptureServer
Communication
<<abstract>>Sensor
SensorTarget
<<abstract>>Event
SessionJournal
NetworkConnection
NetworkMessage
CaptureManager
ServerController
1..*
1..*
*
*
*
receives Events
sends Events
observes creates
Visual Paradigm for UML Standard Edition(TUM - Institut fuer Informatik - Lehrstuhl 1)
Figure 3.3: The Capture subsystem (UML package diagram)
Communication subsystem The Communication subsystem is used by the Capture-
Library to transmit Events to the CaptureServer. Because we newly identified thefunctionality of this subsystem in the system design phase we must extend the analysisobject model with new objects. The Communication subsystem consists of two objects,NetworkConnection and NetworkMessage. The new objects are depicted in Figure 3.4.
A NetworkConnection represents a link between the CaptureLibrary and the Capture-
Server subsystems. It is used by both the CaptureManager and the ServerController
for communication.
A NetworkMessage is used by the NetworkConnection to exchange information over thenetwork. It represents the Events that are encoded for transport and are sent over theNetworkConnection. A NetworkMessage can also be housekeeping data to setup or teardown a connection.
+connect()+disconnect()+sendEvent(e : Event)+receiveEvent() : Event
NetworkConnection
NetworkMessage
*
Visual Paradigm for UML Standard Edition(TUM - Institut fuer Informatik - Lehrstuhl 1)
Figure 3.4: The newly identified objects for the Communication subsystem (UML classdiagram)
50
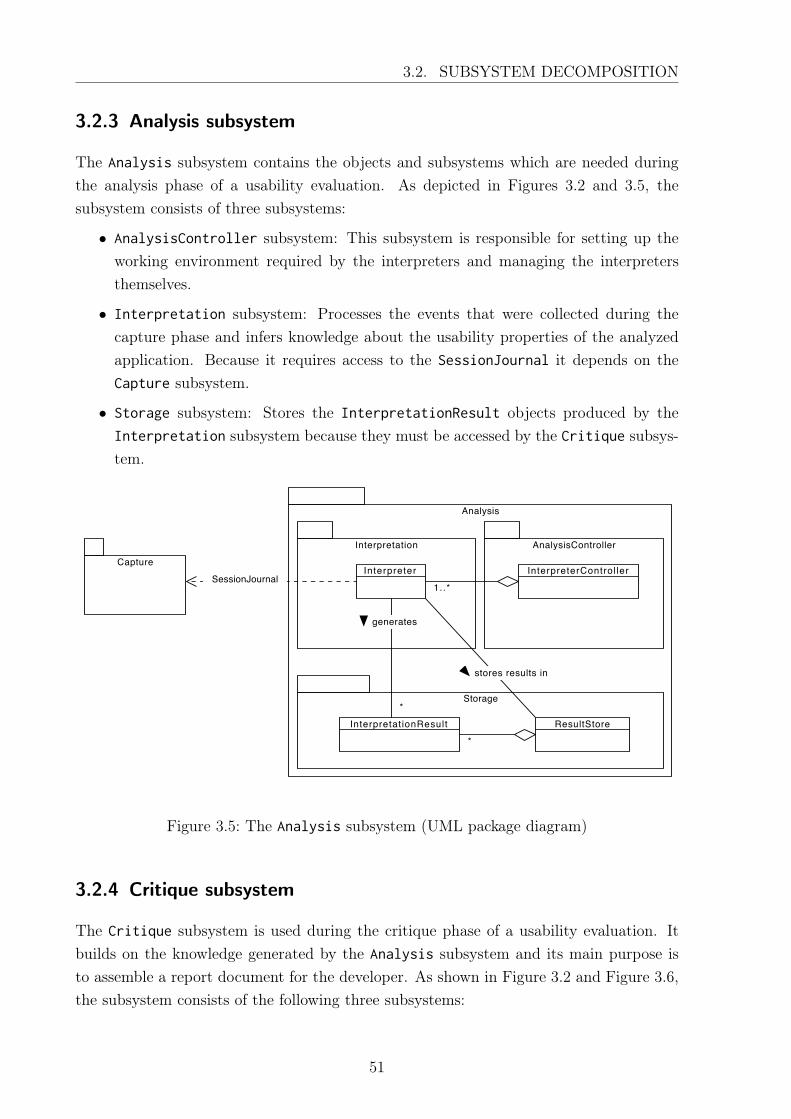
3.2. SUBSYSTEM DECOMPOSITION
3.2.3 Analysis subsystem
The Analysis subsystem contains the objects and subsystems which are needed duringthe analysis phase of a usability evaluation. As depicted in Figures 3.2 and 3.5, thesubsystem consists of three subsystems:
• AnalysisController subsystem: This subsystem is responsible for setting up theworking environment required by the interpreters and managing the interpretersthemselves.
• Interpretation subsystem: Processes the events that were collected during thecapture phase and infers knowledge about the usability properties of the analyzedapplication. Because it requires access to the SessionJournal it depends on theCapture subsystem.
• Storage subsystem: Stores the InterpretationResult objects produced by theInterpretation subsystem because they must be accessed by the Critique subsys-tem.
Analysis
Capture
AnalysisControllerInterpretation
Storage
InterpretationResult
Interpreter InterpreterControl ler
ResultStore
stores results in
1..*
*
*
generates
SessionJournal
Visual Paradigm for UML Standard Edition(TUM - Institut fuer Informatik - Lehrstuhl 1)
Figure 3.5: The Analysis subsystem (UML package diagram)
3.2.4 Critique subsystem
The Critique subsystem is used during the critique phase of a usability evaluation. Itbuilds on the knowledge generated by the Analysis subsystem and its main purpose isto assemble a report document for the developer. As shown in Figure 3.2 and Figure 3.6,the subsystem consists of the following three subsystems:
51
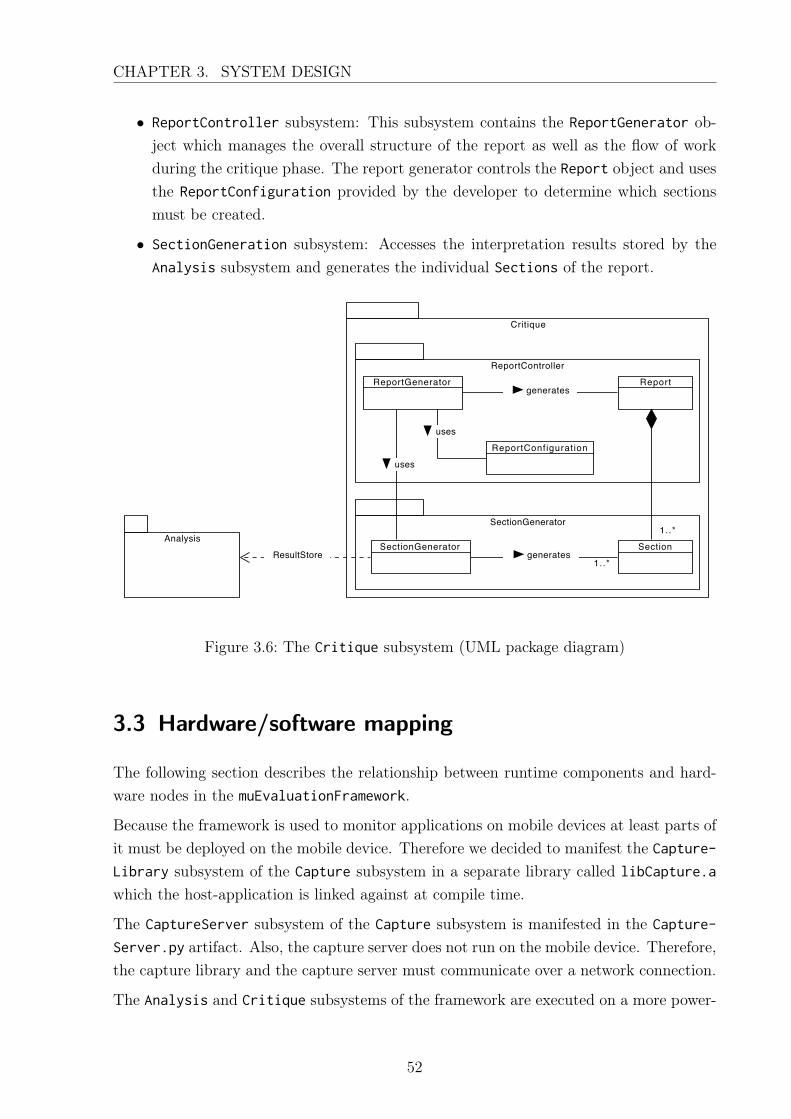
CHAPTER 3. SYSTEM DESIGN
• ReportController subsystem: This subsystem contains the ReportGenerator ob-ject which manages the overall structure of the report as well as the flow of workduring the critique phase. The report generator controls the Report object and usesthe ReportConfiguration provided by the developer to determine which sectionsmust be created.
• SectionGeneration subsystem: Accesses the interpretation results stored by theAnalysis subsystem and generates the individual Sections of the report.
Critique
Analysis
SectionGenerator
ReportController
ReportConfiguration
ReportGenerator Report
SectionSectionGenerator
1..*
1..*
uses
generates
ResultStore
uses
generates
Visual Paradigm for UML Standard Edition(TUM - Institut fuer Informatik - Lehrstuhl 1)
Figure 3.6: The Critique subsystem (UML package diagram)
3.3 Hardware/software mapping
The following section describes the relationship between runtime components and hard-ware nodes in the muEvaluationFramework.
Because the framework is used to monitor applications on mobile devices at least parts ofit must be deployed on the mobile device. Therefore we decided to manifest the Capture-
Library subsystem of the Capture subsystem in a separate library called libCapture.a
which the host-application is linked against at compile time.
The CaptureServer subsystem of the Capture subsystem is manifested in the Capture-
Server.py artifact. Also, the capture server does not run on the mobile device. Therefore,the capture library and the capture server must communicate over a network connection.
The Analysis and Critique subsystems of the framework are executed on a more power-
52
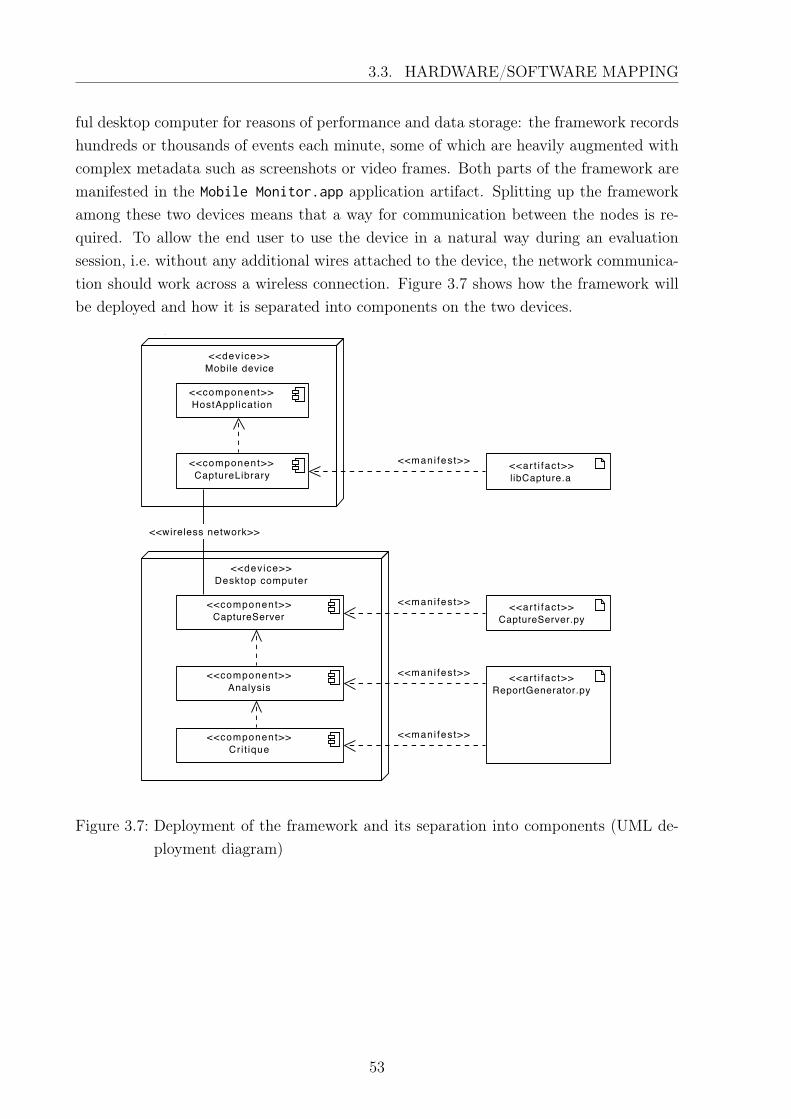
3.3. HARDWARE/SOFTWARE MAPPING
ful desktop computer for reasons of performance and data storage: the framework recordshundreds or thousands of events each minute, some of which are heavily augmented withcomplex metadata such as screenshots or video frames. Both parts of the framework aremanifested in the Mobile Monitor.app application artifact. Splitting up the frameworkamong these two devices means that a way for communication between the nodes is re-quired. To allow the end user to use the device in a natural way during an evaluationsession, i.e. without any additional wires attached to the device, the network communica-tion should work across a wireless connection. Figure 3.7 shows how the framework willbe deployed and how it is separated into components on the two devices.
<<device>>Mobile device
<<dev ice>>Desktop computer
<<component>>CaptureLibrary
<<component>>HostAppl icat ion
<<component>>Cri t ique
<<component>>Analysis
<<component>>CaptureServer
<<ar t i fac t>>CaptureServer.py
<<ar t i fac t>>libCapture.a
<<ar t i fac t>>ReportGenerator.py
<<mani fes t>>
<<wireless network>>
<<mani fes t>>
<<mani fes t>>
<<mani fes t>>
Visual Paradigm for UML Standard Edition(TUM - Institut fuer Informatik - Lehrstuhl 1)
Figure 3.7: Deployment of the framework and its separation into components (UML de-ployment diagram)
53
CHAPTER 3. SYSTEM DESIGN
3.4 Persistent data management
This section gives a summary of the persistent data objects used by the framework and de-scribes how persistent data are stored. There are four types of data in the muEvaluation-
Framework that are candidates for persistent storage. In the following we will give a shortoverview for each data type.
Events
Events are produced by the Capture subsystem during the capture phase of an Evaluation-
Session. Developers might want to create multiple Reports from a single sequence ofcaptured events to gain different insights. The framework must therefore store Events
persistently after the capture phase.
InterpretationResults
The InterpretationResult objects generated by the Analysis subsystem are requiredfor creating a Report. Because the critique phase is always performed directly after theanalysis phase, the InterpretationResults do not have to be stored persistently fromsession to session. Still, the framework must be able to handle many of them duringruntime.
Report configurations
A developer is likely to have several versions of a Report generated when analyzing theusability of a host-application. Each iteration of the Report is probably quite similarin the selected configuration options. It is also very likely that a developer who usesthe framework many times comes up with a personalized set of frequently used reportconfigurations. Therefore it seems sensible to store the ReportConfiguration, i.e. theorder of the included sections as well as each section’s configuration options, for reasonsof convenience.
Report presentations
A Report essentially bundles and all the information contained in the generated Interpre-
tationResults. Therefore the Report is the final and most important artifact producedby the framework during each EvaluationSession and must be stored persistently.
54
4 Object design
We divided the object model of the muEvaluationFramework into subsystem in the pre-vious chapter. In this section, we go through the individual subsystem to refine themodel where necessary and to add more detailed methods and attributes to each class.The object design presented here is structured according to the subsystem decompositionpresented in Section 3.2.
4.1 Interface documentation guidelines
The following coding conventions are used as guidelines:
• Code developed in the Objective-C language should follow the coding guidelinesprovided by Apple Inc. [2]
• Code developed in the Python language should follow the style guide provided bythe Python Software Foundation [30]
As a result of the coding guidelines, classnames for classes defined in the Objective-C language are prefixed with “MF” (for muEvaluationFramework). Prefixes like this arecustomary in Objective-C to avoid naming conflicts.
4.2 Subsystems
This section describes each of the three main subsystems of the framework in closer detail.Again, the description of the subsystems follows the overall capture, analysis, and critiquestructure of the framework. Therefore, we present the subsystems in the same order:
1. The Capture subsystem in Section 4.2.1
2. The Analysis subsystem in Section 4.2.2
3. The Critique subsystem in Section 4.2.3
55
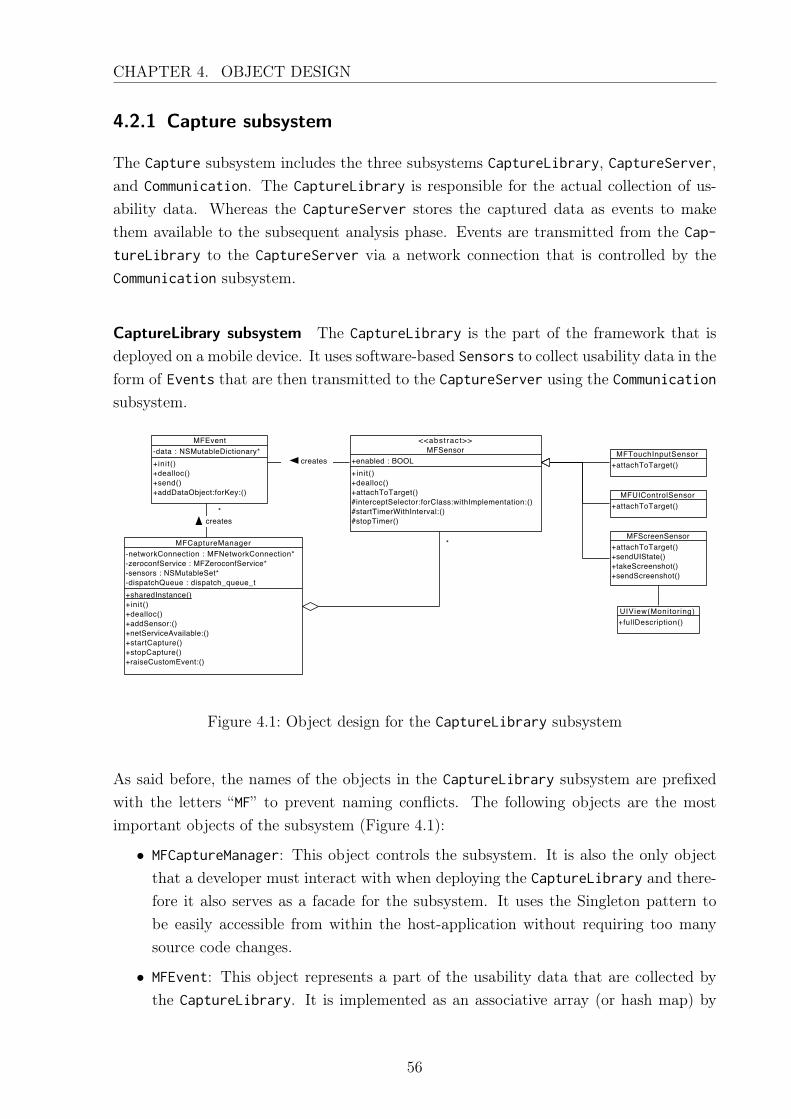
CHAPTER 4. OBJECT DESIGN
4.2.1 Capture subsystem
The Capture subsystem includes the three subsystems CaptureLibrary, CaptureServer,and Communication. The CaptureLibrary is responsible for the actual collection of us-ability data. Whereas the CaptureServer stores the captured data as events to makethem available to the subsequent analysis phase. Events are transmitted from the Cap-
tureLibrary to the CaptureServer via a network connection that is controlled by theCommunication subsystem.
CaptureLibrary subsystem The CaptureLibrary is the part of the framework that isdeployed on a mobile device. It uses software-based Sensors to collect usability data in theform of Events that are then transmitted to the CaptureServer using the Communicationsubsystem.
-data : NSMutableDictionary*+init()+dealloc()+send()+addDataObject:forKey:()
MFEvent
-networkConnection : MFNetworkConnection*-zeroconfService : MFZeroconfService*-sensors : NSMutableSet*-dispatchQueue : dispatch_queue_t+sharedInstance()+init()+dealloc()+addSensor:()+netServiceAvailable:()+startCapture()+stopCapture()+raiseCustomEvent:()
MFCaptureManager
+enabled : BOOL+init()+dealloc()+attachToTarget()#interceptSelector:forClass:withImplementation:()#startTimerWithInterval:()#stopTimer()
<<abstract>>MFSensor
+attachToTarget()MFTouchInputSensor
+attachToTarget()+sendUIState()+takeScreenshot()+sendScreenshot()
MFScreenSensor
+attachToTarget()MFUIControlSensor
+fullDescription()UIView(Monitoring)
*
*
creates
creates
Visual Paradigm for UML Standard Edition(TUM - Institut fuer Informatik - Lehrstuhl 1)
Figure 4.1: Object design for the CaptureLibrary subsystem
As said before, the names of the objects in the CaptureLibrary subsystem are prefixedwith the letters “MF” to prevent naming conflicts. The following objects are the mostimportant objects of the subsystem (Figure 4.1):
• MFCaptureManager: This object controls the subsystem. It is also the only objectthat a developer must interact with when deploying the CaptureLibrary and there-fore it also serves as a facade for the subsystem. It uses the Singleton pattern tobe easily accessible from within the host-application without requiring too manysource code changes.
• MFEvent: This object represents a part of the usability data that are collected bythe CaptureLibrary. It is implemented as an associative array (or hash map) by
56
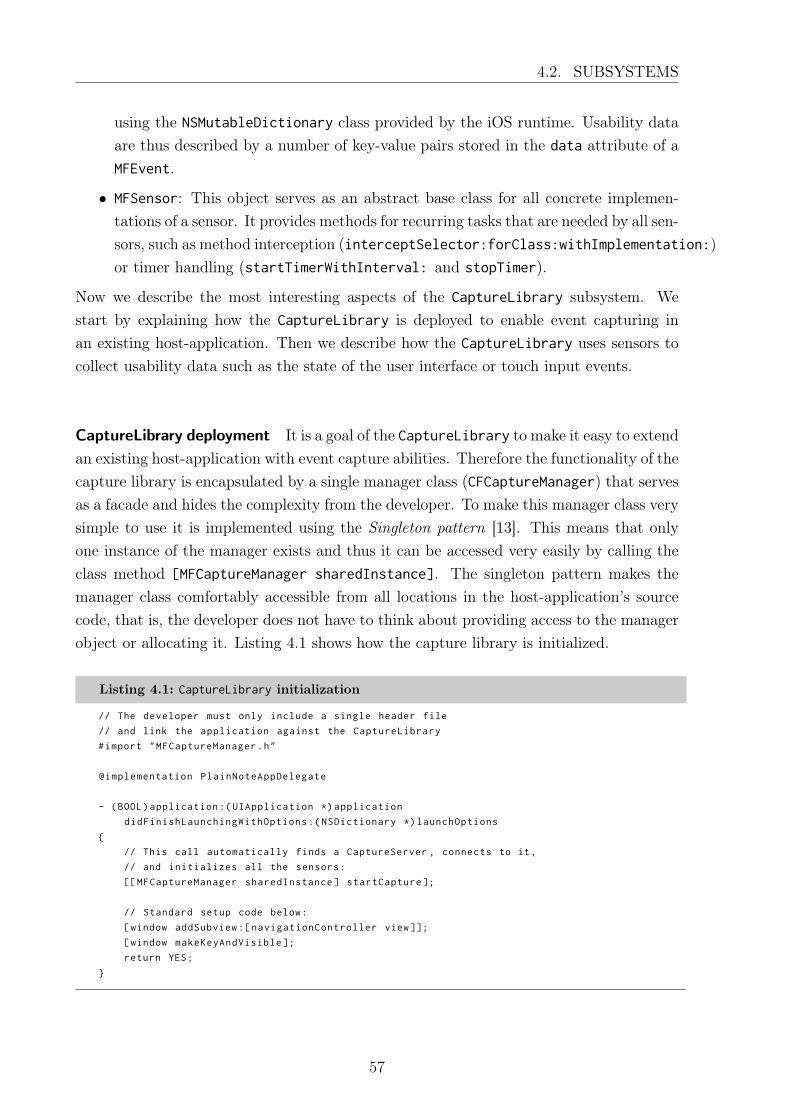
4.2. SUBSYSTEMS
using the NSMutableDictionary class provided by the iOS runtime. Usability dataare thus described by a number of key-value pairs stored in the data attribute of aMFEvent.
• MFSensor: This object serves as an abstract base class for all concrete implemen-tations of a sensor. It provides methods for recurring tasks that are needed by all sen-sors, such as method interception (interceptSelector:forClass:withImplementation:)or timer handling (startTimerWithInterval: and stopTimer).
Now we describe the most interesting aspects of the CaptureLibrary subsystem. Westart by explaining how the CaptureLibrary is deployed to enable event capturing inan existing host-application. Then we describe how the CaptureLibrary uses sensors tocollect usability data such as the state of the user interface or touch input events.
CaptureLibrary deployment It is a goal of the CaptureLibrary to make it easy to extendan existing host-application with event capture abilities. Therefore the functionality of thecapture library is encapsulated by a single manager class (CFCaptureManager) that servesas a facade and hides the complexity from the developer. To make this manager class verysimple to use it is implemented using the Singleton pattern [13]. This means that onlyone instance of the manager exists and thus it can be accessed very easily by calling theclass method [MFCaptureManager sharedInstance]. The singleton pattern makes themanager class comfortably accessible from all locations in the host-application’s sourcecode, that is, the developer does not have to think about providing access to the managerobject or allocating it. Listing 4.1 shows how the capture library is initialized.
Listing 4.1: CaptureLibrary initialization
// The developer must only include a single header file
// and link the application against the CaptureLibrary
#import "MFCaptureManager.h"
@implementation PlainNoteAppDelegate
- (BOOL)application :( UIApplication *) application
didFinishLaunchingWithOptions :( NSDictionary *) launchOptions
{
// This call automatically finds a CaptureServer , connects to it,
// and initializes all the sensors:
[[ MFCaptureManager sharedInstance] startCapture ];
// Standard setup code below:
[window addSubview :[ navigationController view ]];
[window makeKeyAndVisible ];
return YES;
}
57
CHAPTER 4. OBJECT DESIGN
Another way to improve the usability of the CaptureLibrary is the automatic setup of thenetwork connection between the CaptureLibrary and the CaptureServer. The connectionis established automatically and requires no setup by the developer. This is made possibleby a technology called Zero configuration networking1 (Zeroconf ). Zeroconf providessupport for automatic service discovery without the need for configuring IP addressesand ports by hand. The CaptureServer announces its service with a string identifier("_muEvaluationFramework-capture._tcp.") and the CaptureLibrary can search thenetwork for available servers and then automatically connect to one.
Determining the UI state To determine the state of an application’s user interface wemust find the root view of an application and then iterate through all of its sub-views,collecting data as we descend the view hierarchy. The root view of an iOS applicationis normally an instance of the UIWindow class. One approach is to create a subclass ofUIWindow that adds a custom method getUIState which returns a description of theuser interface’s structure. Unfortunately, we cannot subclass the UIWindow class becauseexisting code in the host-application will not automatically use the subclass. Thereforewe have to extend UIWindow directly. Luckily, Objective-C provides a way to do this witha language feature called Categories [13]. We use the Category pattern to add a method-(NSDictionary*)getUIState to every UIWindow instance in the host-application. Thismethod returns a NSDictionary object with the classname, dimensions and title of everyUI element in the view hierarchy. Listing 4.2 shows the console printout of an exampleview hierarchy.
Listing 4.2: Example view hierarchy printout
{
address = 97�57632;
className = UIWindow;
frame = {
height = 48�;
width = 32�;
x = �;
y = �;
};
subviews = (
{
address = 97114864;
className = UITransitionView;
frame = {
(...)
};
subviews = ( ... )
);
};
1Apple’s implementation of Zero configuration networking is called Bonjour. Additional informationabout Zeroconf and Bonjour can be found at www.zeroconf.org [14]
58
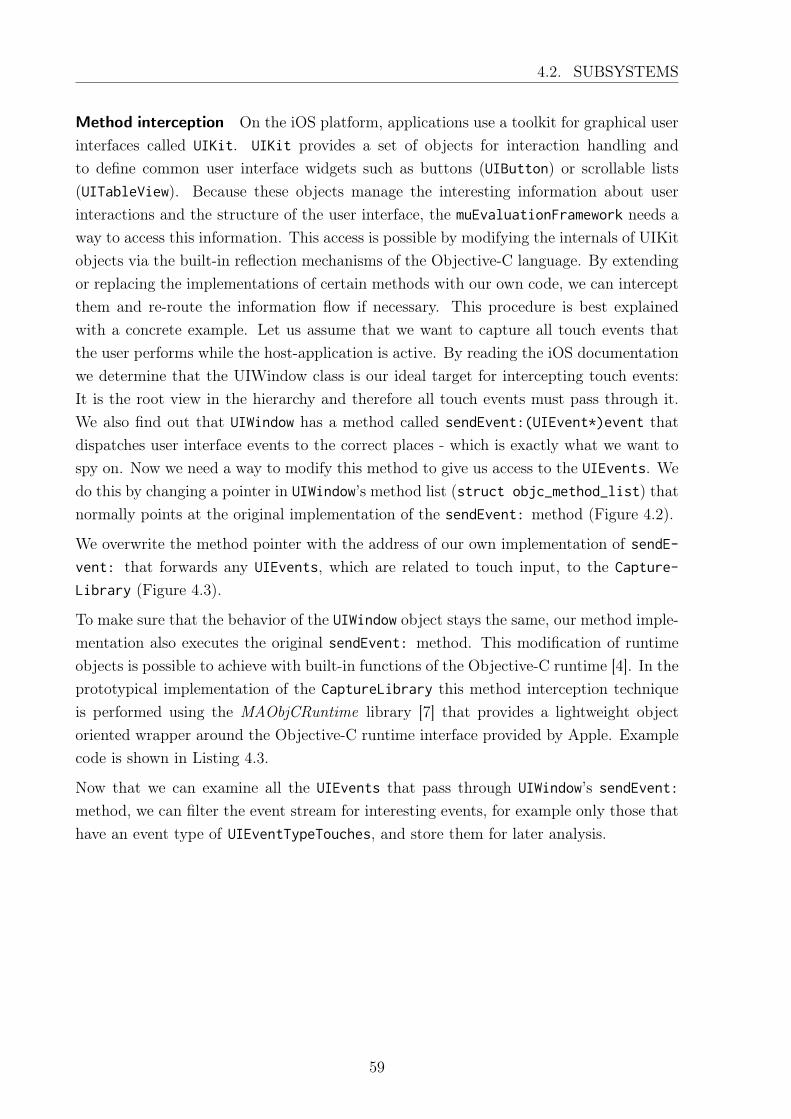
4.2. SUBSYSTEMS
Method interception On the iOS platform, applications use a toolkit for graphical userinterfaces called UIKit. UIKit provides a set of objects for interaction handling andto define common user interface widgets such as buttons (UIButton) or scrollable lists(UITableView). Because these objects manage the interesting information about userinteractions and the structure of the user interface, the muEvaluationFramework needs away to access this information. This access is possible by modifying the internals of UIKitobjects via the built-in reflection mechanisms of the Objective-C language. By extendingor replacing the implementations of certain methods with our own code, we can interceptthem and re-route the information flow if necessary. This procedure is best explainedwith a concrete example. Let us assume that we want to capture all touch events thatthe user performs while the host-application is active. By reading the iOS documentationwe determine that the UIWindow class is our ideal target for intercepting touch events:It is the root view in the hierarchy and therefore all touch events must pass through it.We also find out that UIWindow has a method called sendEvent:(UIEvent*)event thatdispatches user interface events to the correct places - which is exactly what we want tospy on. Now we need a way to modify this method to give us access to the UIEvents. Wedo this by changing a pointer in UIWindow’s method list (struct objc_method_list) thatnormally points at the original implementation of the sendEvent: method (Figure 4.2).
We overwrite the method pointer with the address of our own implementation of sendE-vent: that forwards any UIEvents, which are related to touch input, to the Capture-
Library (Figure 4.3).
To make sure that the behavior of the UIWindow object stays the same, our method imple-mentation also executes the original sendEvent: method. This modification of runtimeobjects is possible to achieve with built-in functions of the Objective-C runtime [4]. In theprototypical implementation of the CaptureLibrary this method interception techniqueis performed using the MAObjCRuntime library [7] that provides a lightweight objectoriented wrapper around the Objective-C runtime interface provided by Apple. Examplecode is shown in Listing 4.3.
Now that we can examine all the UIEvents that pass through UIWindow’s sendEvent:
method, we can filter the event stream for interesting events, for example only those thathave an event type of UIEventTypeTouches, and store them for later analysis.
59
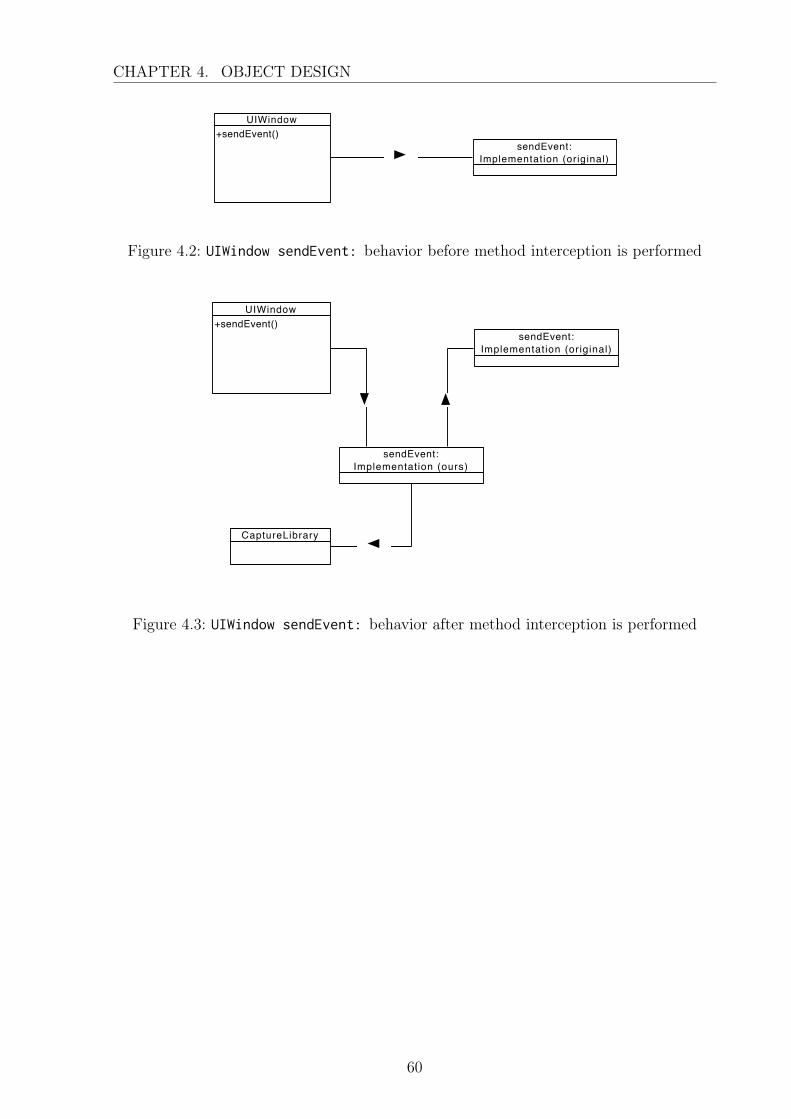
CHAPTER 4. OBJECT DESIGN
+sendEvent()UIWindow
sendEvent:Implementation (original)
Visual Paradigm for UML Standard Edition(TUM - Institut fuer Informatik - Lehrstuhl 1)
Figure 4.2: UIWindow sendEvent: behavior before method interception is performed
+sendEvent()UIWindow
sendEvent:Implementation (original)
sendEvent:Implementation (ours)
CaptureLibrary
Visual Paradigm for UML Standard Edition(TUM - Institut fuer Informatik - Lehrstuhl 1)
Figure 4.3: UIWindow sendEvent: behavior after method interception is performed
60
4.2. SUBSYSTEMS
Listing 4.3: Method interception example code
// A pointer to the original implementation of the sendEvent: method.
IMP gOriginalSendEventImp = NULL;
// Our own version of [UIWindow sendEvent :]
static void HijackedUIWindowSendEvent(id self , SEL _cmd , UIEvent *event) {
gOriginalSendEventImp(self , _cmd , event);
/* Check for interesting events here. */
}
// Overwrites the implementation of a method for a given class with a custom pointer
- (IMP)interceptSelector :(SEL)selector
forClass :(Class) aClass
withImplementation :(IMP) anImplementation
{
RTMethod *originalMethod = [aClass rt_methodForSelector:selector ];
IMP originalImp = [originalMethod implementation ];
[originalMethod setImplementation: anImplementation ];
NSLog(@"MFSensor - hijack: [%@ %@] rerouted from �x%x to �x%x",
aClass , NSStringFromSelector(selector), originalImp , anImplementation);
return originalImp;
}
// Enables the sensor by overwriting the sendEvent: method in
// the UIWindow object
- (void)attachToTarget {
gOriginalSendEventImp = [self hijackSelector:@selector(sendEvent :)
forClass :[ UIWindow class]
withImplementation :(IMP)HijackedUIWindowSendEvent ];
}
Network representation for Events Events are transmitted using a simple XML-basedprotocol that stores them as a set of keys and values and also allows nesting data topreserve a hierarchical structure (e.g. when transmitting UI states). Listing 4.4 shows theXML representation of an example Event.
Listing 4.4: A UserInputEvent represented as XML
<event >
<key>class </key>
<string >UserInputEvent </string >
<key>timestamp </key>
<date>2�11 -�2 -19 T22:43:�6Z </date>
<key>x</key>
<integer >155</integer >
<key>y</key>
<integer >267</integer >
</event >
61
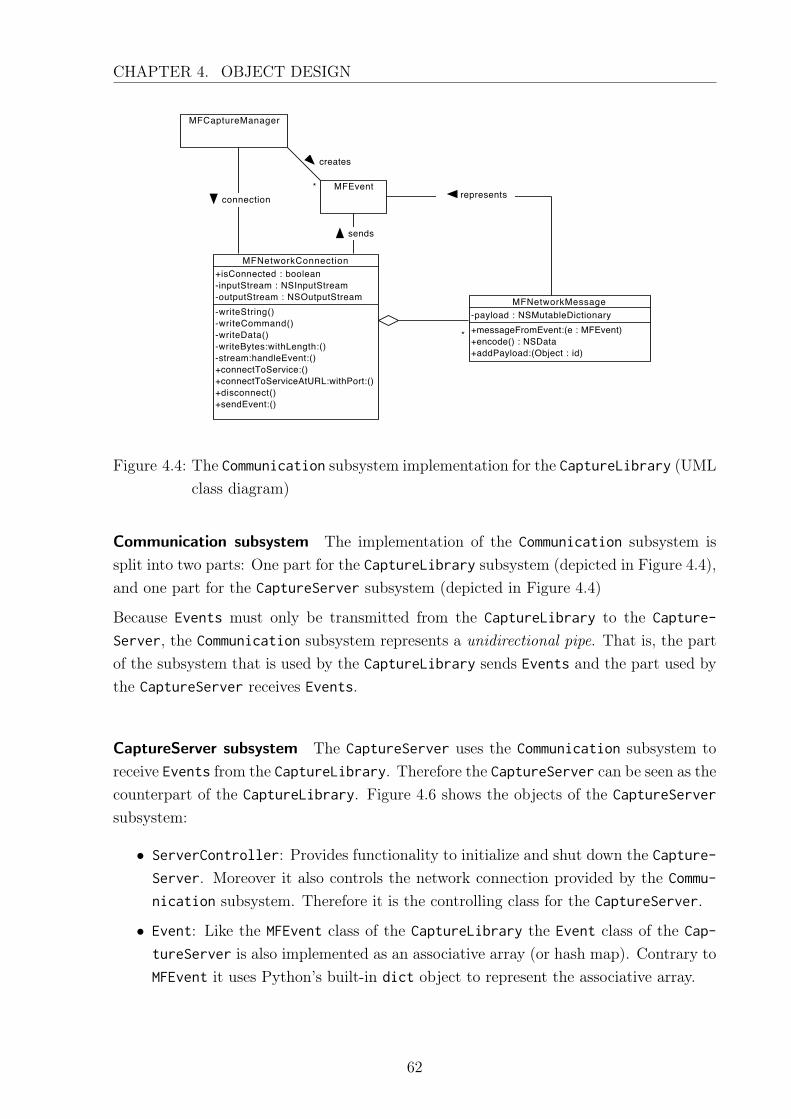
CHAPTER 4. OBJECT DESIGN
+isConnected : boolean-inputStream : NSInputStream-outputStream : NSOutputStream-writeString()-writeCommand()-writeData()-writeBytes:withLength:()-stream:handleEvent:()+connectToService:()+connectToServiceAtURL:withPort:()+disconnect()+sendEvent:()
MFNetworkConnection
MFCaptureManager
MFEvent
-payload : NSMutableDictionary+messageFromEvent:(e : MFEvent)+encode() : NSData+addPayload:(Object : id)
MFNetworkMessage
*
*represents
sends
creates
connection
Visual Paradigm for UML Standard Edition(TUM - Institut fuer Informatik - Lehrstuhl 1)
Figure 4.4: The Communication subsystem implementation for the CaptureLibrary (UMLclass diagram)
Communication subsystem The implementation of the Communication subsystem issplit into two parts: One part for the CaptureLibrary subsystem (depicted in Figure 4.4),and one part for the CaptureServer subsystem (depicted in Figure 4.4)
Because Events must only be transmitted from the CaptureLibrary to the Capture-
Server, the Communication subsystem represents a unidirectional pipe. That is, the partof the subsystem that is used by the CaptureLibrary sends Events and the part used bythe CaptureServer receives Events.
CaptureServer subsystem The CaptureServer uses the Communication subsystem toreceive Events from the CaptureLibrary. Therefore the CaptureServer can be seen as thecounterpart of the CaptureLibrary. Figure 4.6 shows the objects of the CaptureServer
subsystem:
• ServerController: Provides functionality to initialize and shut down the Capture-
Server. Moreover it also controls the network connection provided by the Commu-
nication subsystem. Therefore it is the controlling class for the CaptureServer.
• Event: Like the MFEvent class of the CaptureLibrary the Event class of the Cap-
tureServer is also implemented as an associative array (or hash map). Contrary toMFEvent it uses Python’s built-in dict object to represent the associative array.
62
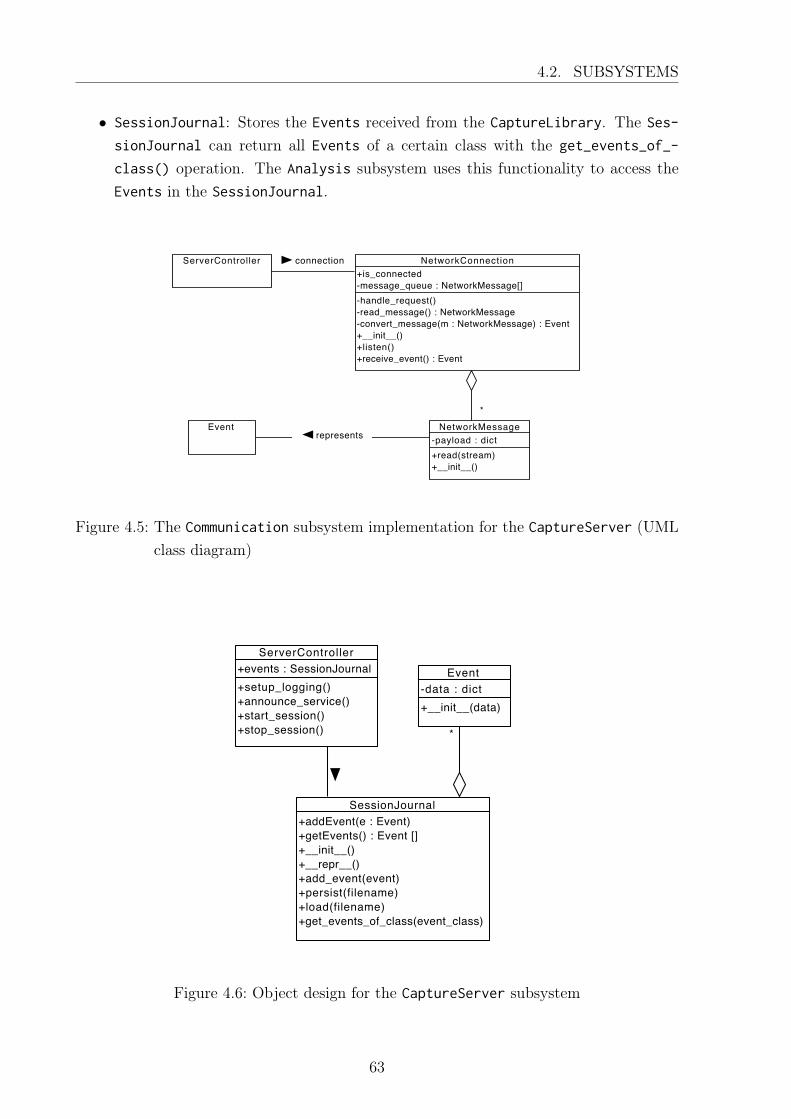
4.2. SUBSYSTEMS
• SessionJournal: Stores the Events received from the CaptureLibrary. The Ses-
sionJournal can return all Events of a certain class with the get_events_of_-
class() operation. The Analysis subsystem uses this functionality to access theEvents in the SessionJournal.
+is_connected-message_queue : NetworkMessage[]-handle_request()-read_message() : NetworkMessage-convert_message(m : NetworkMessage) : Event+__init__()+listen()+receive_event() : Event
NetworkConnectionServerController
Event-payload : dict+read(stream)+__init__()
NetworkMessage
*
represents
connectionVisual Paradigm for UML Standard Edition(TUM - Institut fuer Informatik - Lehrstuhl 1)
Figure 4.5: The Communication subsystem implementation for the CaptureServer (UMLclass diagram)
+events : SessionJournal+setup_logging()+announce_service()+start_session()+stop_session()
ServerController
-data : dict+__init__(data)
Event
+addEvent(e : Event)+getEvents() : Event []+__init__()+__repr__()+add_event(event)+persist(filename)+load(filename)+get_events_of_class(event_class)
SessionJournal
*
Visual Paradigm for UML Standard Edition(TUM - Institut fuer Informatik - Lehrstuhl 1)
Figure 4.6: Object design for the CaptureServer subsystem
63
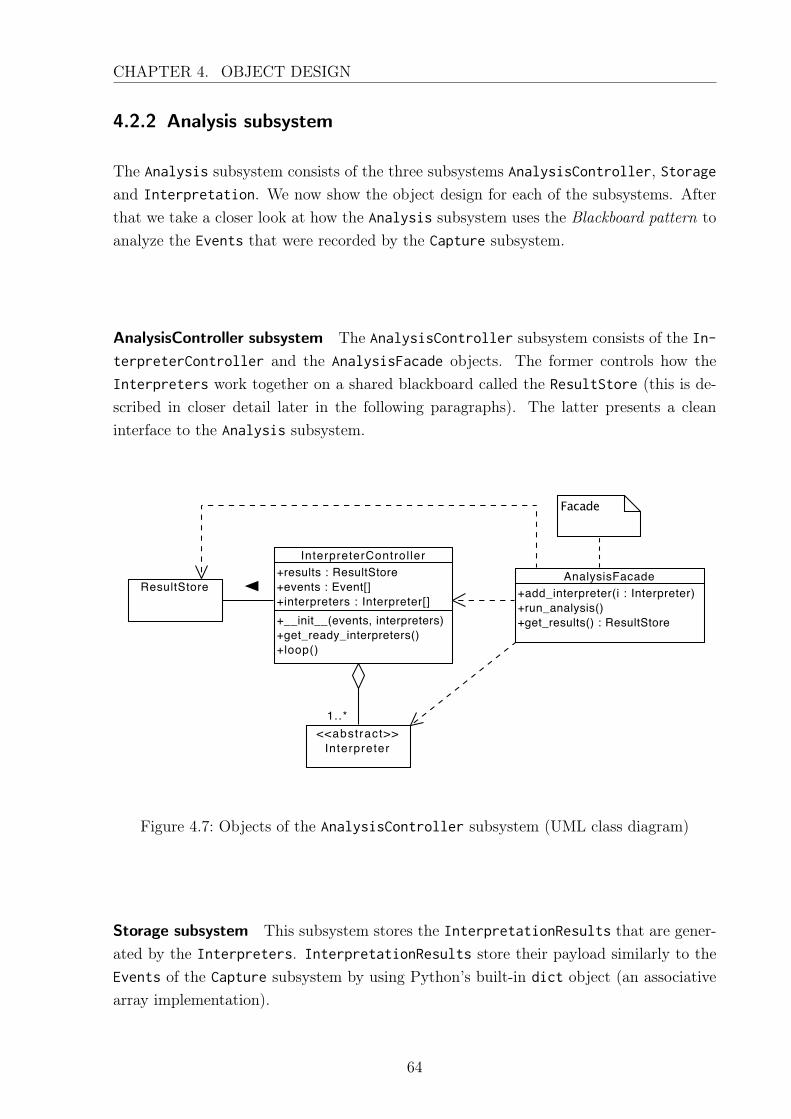
CHAPTER 4. OBJECT DESIGN
4.2.2 Analysis subsystem
The Analysis subsystem consists of the three subsystems AnalysisController, Storageand Interpretation. We now show the object design for each of the subsystems. Afterthat we take a closer look at how the Analysis subsystem uses the Blackboard pattern toanalyze the Events that were recorded by the Capture subsystem.
AnalysisController subsystem The AnalysisController subsystem consists of the In-
terpreterController and the AnalysisFacade objects. The former controls how theInterpreters work together on a shared blackboard called the ResultStore (this is de-scribed in closer detail later in the following paragraphs). The latter presents a cleaninterface to the Analysis subsystem.
+results : ResultStore+events : Event[]+interpreters : Interpreter[]+__init__(events, interpreters)+get_ready_interpreters()+loop()
InterpreterControl ler
+add_interpreter(i : Interpreter)+run_analysis()+get_results() : ResultStore
AnalysisFacade
<<abstract>>Interpreter
ResultStore
1..*
Visual Paradigm for UML Standard Edition(TUM - Institut fuer Informatik - Lehrstuhl 1)
Figure 4.7: Objects of the AnalysisController subsystem (UML class diagram)
Storage subsystem This subsystem stores the InterpretationResults that are gener-ated by the Interpreters. InterpretationResults store their payload similarly to theEvents of the Capture subsystem by using Python’s built-in dict object (an associativearray implementation).
64
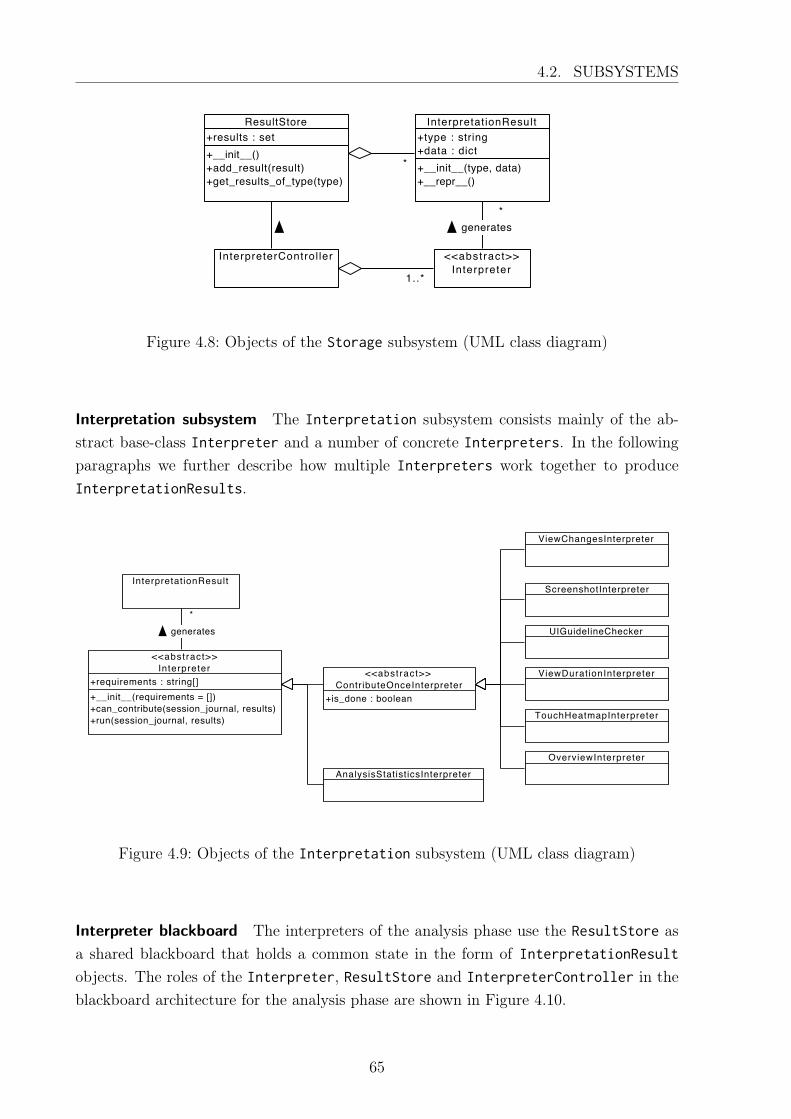
4.2. SUBSYSTEMS
+results : set+__init__()+add_result(result)+get_results_of_type(type)
ResultStore
InterpreterControl ler
+type : string+data : dict+__init__(type, data)+__repr__()
InterpretationResult
<<abstract>>Interpreter
1..*
*
*generates
Visual Paradigm for UML Standard Edition(TUM - Institut fuer Informatik - Lehrstuhl 1)
Figure 4.8: Objects of the Storage subsystem (UML class diagram)
Interpretation subsystem The Interpretation subsystem consists mainly of the ab-stract base-class Interpreter and a number of concrete Interpreters. In the followingparagraphs we further describe how multiple Interpreters work together to produceInterpretationResults.
InterpretationResult
+requirements : string[]+__init__(requirements = [])+can_contribute(session_journal, results)+run(session_journal, results)
<<abstract>>Interpreter
+is_done : boolean
<<abstract>>ContributeOnceInterpreter
OverviewInterpreterAnalysisStatisticsInterpreter
ViewChangesInterpreter
ScreenshotInterpreter
UIGuidelineChecker
ViewDurationInterpreter
TouchHeatmapInterpreter
*generates
Visual Paradigm for UML Standard Edition(TUM - Institut fuer Informatik - Lehrstuhl 1)
Figure 4.9: Objects of the Interpretation subsystem (UML class diagram)
Interpreter blackboard The interpreters of the analysis phase use the ResultStore asa shared blackboard that holds a common state in the form of InterpretationResult
objects. The roles of the Interpreter, ResultStore and InterpreterController in theblackboard architecture for the analysis phase are shown in Figure 4.10.
65
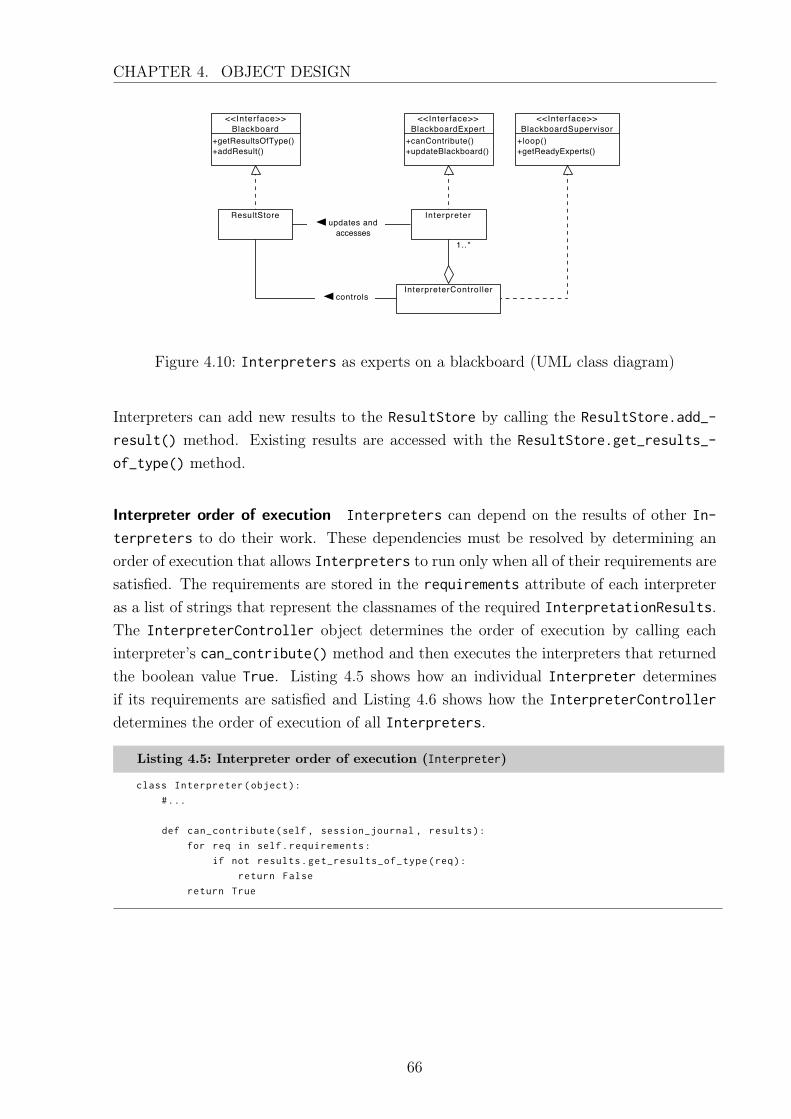
CHAPTER 4. OBJECT DESIGN
ResultStore
InterpreterControl ler
Interpreter
+getResultsOfType()+addResult()
<<Interface>>Blackboard
+canContribute()+updateBlackboard()
<<Interface>>BlackboardExpert
+loop()+getReadyExperts()
<<Interface>>BlackboardSupervisor
controls
updates andaccesses
1..*
Visual Paradigm for UML Standard Edition(TUM - Institut fuer Informatik - Lehrstuhl 1)
Figure 4.10: Interpreters as experts on a blackboard (UML class diagram)
Interpreters can add new results to the ResultStore by calling the ResultStore.add_-
result() method. Existing results are accessed with the ResultStore.get_results_-
of_type() method.
Interpreter order of execution Interpreters can depend on the results of other In-
terpreters to do their work. These dependencies must be resolved by determining anorder of execution that allows Interpreters to run only when all of their requirements aresatisfied. The requirements are stored in the requirements attribute of each interpreteras a list of strings that represent the classnames of the required InterpretationResults.The InterpreterController object determines the order of execution by calling eachinterpreter’s can_contribute() method and then executes the interpreters that returnedthe boolean value True. Listing 4.5 shows how an individual Interpreter determinesif its requirements are satisfied and Listing 4.6 shows how the InterpreterController
determines the order of execution of all Interpreters.
Listing 4.5: Interpreter order of execution (Interpreter)
class Interpreter(object):
#...
def can_contribute(self , session_journal , results):
for req in self.requirements:
if not results.get_results_of_type(req):
return False
return True
66
4.2. SUBSYSTEMS
Listing 4.6: Interpreter order of execution (InterpreterController)
class InterpreterController(object):
#...
def get_ready_interpreters(self):
result = []
for interp in self.interpreters:
if interp.can_contribute(self.events , self.results):
result.append(interp)
return result
def loop(self):
while True:
ready_interpreters = self.get_ready_interpreters ()
if ready_interpreters == []:
break # end the analysis phase
for interp in ready_interpreters:
interp.run(self.events , self.results)
We found that it is often required that an Interpreter only executes once during theanalysis phase. A ViewChangesInterpreter, for example, only aggregates all of the viewchange events in the SessionJournal and does not depend on other Interpreters’ re-sults. Whereas an AnalysisStatisticsInterpreter must run multiple times to updatethe statistics during the analysis phase. Because we found that Interpreters are onlyexecuted once in many cases, we added the ContributeOnceInterpreter subclass thatmakes it simple to implement such a behavior.
4.2.3 Critique subsystem
The Critique subsystem creates a HTML document that summarizes the insights fromthe analysis phase. This HTML document is called a Report. During the object designsome modifications were made to the subsystem. Now, the individual Sections are notproduced by a SectionGenerator object but instead exist as subclasses of the abstractclass Section. Therefore, the content of a section and the programming logic that createsthe content are both represented by the specializations of the class Section. Further-more, the ReportGenerator was changed to represent a facade for the whole subsystem(ReportGeneratorFacade). We believe that these changes simplify the Critique subsys-tem, allow for more code reuse and thus make it easier to extend the system with newsection types.
67
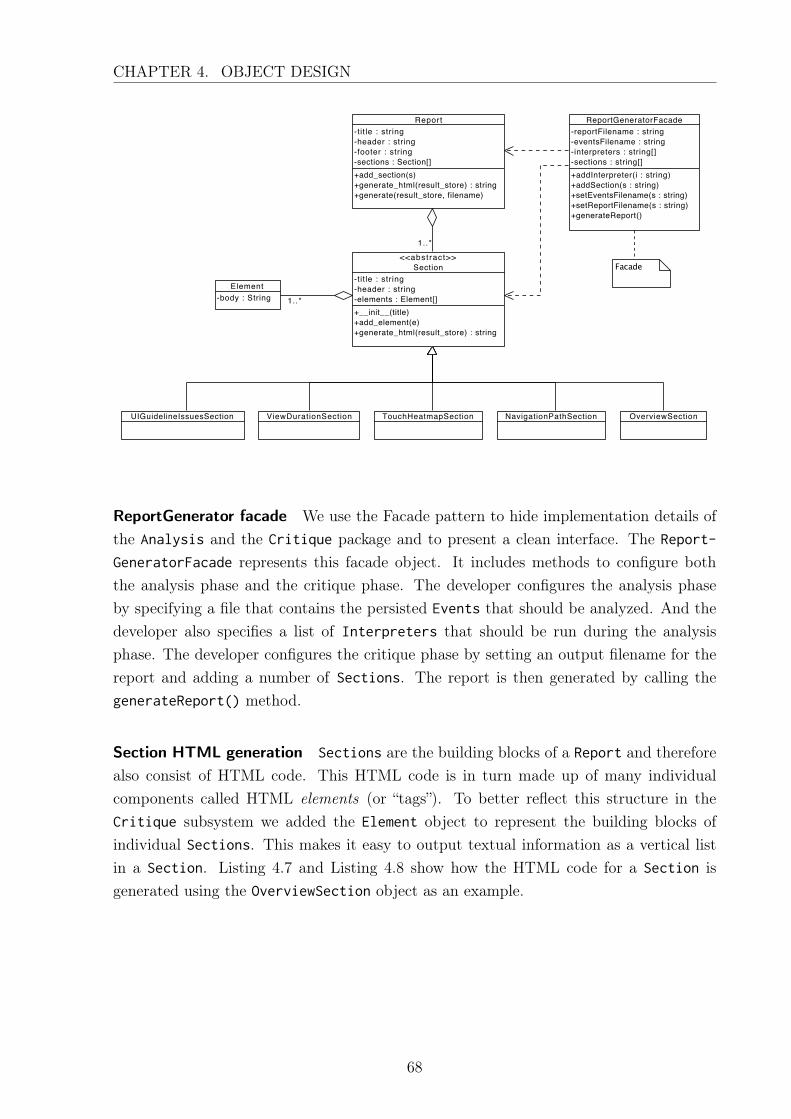
CHAPTER 4. OBJECT DESIGN
-body : StringElement
-tit le : string-header : string-elements : Element[]+__init__(title)+add_element(e)+generate_html(result_store) : string
<<abstract>>Section
OverviewSectionNavigationPathSectionTouchHeatmapSectionViewDurationSectionUIGuidelineIssuesSection
-tit le : string-header : string-footer : string-sections : Section[]+add_section(s)+generate_html(result_store) : string+generate(result_store, filename)
Report-reportFilename : string-eventsFilename : string-interpreters : string[]-sections : string[]+addInterpreter(i : string)+addSection(s : string)+setEventsFilename(s : string)+setReportFilename(s : string)+generateReport()
ReportGeneratorFacade
1..*
1..*
Visual Paradigm for UML Standard Edition(TUM - Institut fuer Informatik - Lehrstuhl 1)
ReportGenerator facade We use the Facade pattern to hide implementation details ofthe Analysis and the Critique package and to present a clean interface. The Report-
GeneratorFacade represents this facade object. It includes methods to configure boththe analysis phase and the critique phase. The developer configures the analysis phaseby specifying a file that contains the persisted Events that should be analyzed. And thedeveloper also specifies a list of Interpreters that should be run during the analysisphase. The developer configures the critique phase by setting an output filename for thereport and adding a number of Sections. The report is then generated by calling thegenerateReport() method.
Section HTML generation Sections are the building blocks of a Report and thereforealso consist of HTML code. This HTML code is in turn made up of many individualcomponents called HTML elements (or “tags”). To better reflect this structure in theCritique subsystem we added the Element object to represent the building blocks ofindividual Sections. This makes it easy to output textual information as a vertical listin a Section. Listing 4.7 and Listing 4.8 show how the HTML code for a Section isgenerated using the OverviewSection object as an example.
68
4.2. SUBSYSTEMS
Listing 4.7: Section HTML generation (Section)
class Section(object):
# ...
def generate_html(self , result_store):
s = self.header
if self.elements:
s += ’<ul type=" square">’
for e in self.elements:
s += ’<li >%s</li >’ % e.body
s += " </ul>"
return s
Listing 4.8: Section HTML generation (OverviewSection)
class OverviewSection(Section):
def __init__(self):
super(OverviewSection , self).__init__("Overview")
def generate_html(self , result_store):
overviews = result_store.get_results_of_type(’OverviewResult ’)
if overviews:
data = overviews [�]. data
self.add_element(Element("Session started at %s" % data[’sessionStart ’]))
self.add_element(Element("Session ended at %s" % data[’sessionEnd ’]))
self.add_element(Element("%d events were recorded" % data[’numEvents ’]))
return super(OverviewSection , self).generate_html(result_store)
69

CHAPTER 4. OBJECT DESIGN
70
5 Prototypical implementation
In this chapter we present the prototype of the muEvaluationFramework. We show howthe prototype handles the capture, analysis and critique phases.
5.1 Overview
We implemented a prototype during the writing of the thesis to fulfill several goals. Wewanted to improve the design of the framework in an iterative process. To do so, weexplored how different approaches work and what kinds of usability data can be gatheredon the Apple iOS platform. At the beginning of the thesis it was not clear how the collecteddata could be analyzed and presented to the developer. We also used the prototype toexplore this area.
The prototypical implementation was tested with two open source iOS applications: Word-press for iOS, a companion tool for the popular PHP-based content management systemWordpress ; and PlainNote, a minimalist note-taking application. Wordpress for iOS wasmore difficult to work with because it requires a steady internet connection to connect to aWordpress account. During development of the prototype this requirement was sometimesdifficult to fulfill and therefore we switched the host-application and worked with Plain-Note instead. This offered the benefit of testing the prototype with an entirely differentapplication and also ensured that all setup steps were verified once more.
5.2 Capture support
The prototype provides support for capturing usability data inside an host-application,to transmit these data over a wireless network connection and to store them into a filefor later analysis.
The CaptureLibrary is implemented in the Objective-C language because this is a re-quirement to interface with host-applications on the iOS platform. The CaptureServer
is implemented in the Python language.
71
CHAPTER 5. PROTOTYPICAL IMPLEMENTATION
Network support The prototype of the CaptureServer announces its service via Zero-conf and for this we used the pybonjour library [29]. The CaptureLibrary automaticallyfinds and connects to the CaptureServer as soon as it is available. Not requiring anyconfiguration, such as entering IP addresses and port numbers, proved very to be usefulduring the development of the prototype because the system “just works” in almost everynetwork setup. The network connection uses standard sockets for TCP/IP-based datatransmission. The protocol is very simple and stateless, and Events are transmitted asplaintext XML-strings. In the CaptureLibrary, the transmission of events is performed inbackground threads using Apple’s Grand Central Dispatch, a framework which implementsparallel execution of tasks using thread pools [3]. This ensures that data transmissiondoes not hinder the performance of the host-application too much. Indeed, we foundthat the subjective application performance was unchanged with the two applications wetested.
Implemented sensors The prototype contains three sensor types:
• MFTouchInputSensor: a sensor that attaches to the sendEvent: method of theUIWindow class via the method interception technique we described in Chapter 4and captures UIEvents of the type UIEventTypeTouches. This allows the prototypeto track all kinds of finger gestures: quick taps, drag movements and scrolling.
• MFUIControlSensor: this sensor attaches to the UIControl class, a base class formost user interface elements on iOS. By intercepting the sendAction:to:forEvent:method the prototype can capture press events for all subclasses of UIControl, suchas UIButton or UISwitch.
• MFScreenSensor: this sensor is used to detect changes to what is displayed on themobile device’s screen. It attaches to UIWindow, UIViewController and UINaviga-
tionController to detect when UIViews are added or removed from the view stack.This sensor also takes a screenshot and a snapshot of the complete view hierarchy ofthe topmost UIWindow whenever the active view changes. Screenshots of a runningapplication are taken using the private framework UIGetScreenImage() functionor by iterating through the view hierarchy and rendering each view into a CGImage
(UIGetScreenImage is not available on the iOS simulator, for example). Screenshotsare compressed using the PNG format and then transmitted over the network. Tokeep the host-application responsive the compression is performed in a backgroundthread.
72
5.3. ANALYSIS SUPPORT
5.3 Analysis support
Implemented interpreters
• OverviewInterpreter: calculates when the evaluation session started (the times-tamp of the first Event), when it ended (the timestamp of the last Event). Addi-tionally, it shows the number of Events that were recorded.
• ScreenshotInterpreter: searches the event stream for screenshot images and col-lects them all in a ScreenshotResult list. Inside this list the screenshots are orderedby the time they were taken at. This ordering is the used by other Interpreters
to reference the screenshots, e.g. the screenshot with index 3 maps to image dataA. This ensures that no duplicate images are stored in the report.
• TouchHeatmapInterpreter: gathers UserInputEvents and maps them to screenshotimages, therefore the interpreter requires the results of the ScreenshotInterpreter.Each touch event is mapped to a screenshot image by comparing the timestamp ofthe event to the timestamp of each screenshot and then selecting the last screenshotthat was taken before the event happened. This ensures that all events are mappedto a screenshot and that touch events for different views do not all end up in thesame screenshot.
• ViewChangesInterpreter: iterates through all view change events, generates astring representation of the view stack for each change and maps them to screenshotindices. This interpreter requires the results of the OverviewInterpreter and theScreenshotInterpreter.
• ViewDurationInterpreter: gathers the timestamps of all view change events andgenerates a statistic that shows for how long each view was active. This interpreterrequires the results of the OverviewInterpreter and the ViewChangesInterpreter.
• UIGuidelineChecker: performs a depth-first search on the nodes of each UIState
event and checks if the elements in the view hierarchy have dimensions smaller than44 pixels. This heuristic is given in Apple’s iOS Human Interface Guidelines [6]and used as a proof-of-concept that the prototype can detect usability problems ina host-application.
73
CHAPTER 5. PROTOTYPICAL IMPLEMENTATION
5.4 Critique support
HTML reports The system generates reports in the form of a single HTML file thatreferences a number of screenshots that are stored as separate files in the PNG format.The report document uses Cascading Style Sheets (CSS) to provide a consistent layoutfor section headers. Reports are non-interactive in the prototype but individual Sectionscan include JavaScript code to provide such functionality.
Implemented section types The report generator of the prototype supports the follow-ing five section types:
• OverviewSection: provides general information about the session, that is the timewhen the session started or ended, and the number of events that were recorded.
• ViewDurationSection: displays a table that contains the time the user spent oneach view in the host-application. The table is sorted by time and absolute as wellas relative timings are given for each view.
• NavigationPathSection: shows how a user navigated through the views of a host-application. For each step, a timestamp is given and the state of the view stack isprinted out. Optionally, this section can show screenshots for each view change andalso indicate the kind of view change, i.e. whether the view is a regular view or amodal view.
• TouchHeatmapsSection: shows screenshots of the host-application and draws col-ored circles to indicate finger touches that were performed by the user. The visu-alization of the touches is done in the browser via the HTML5 <canvas> element.This lays the foundation for interactively changing the presentation of the touchevents and also allows the same set of screenshots to be used elsewhere.
• UIGuidelineIssuesSection: shows the detected violations against Apple’s iOS Hu-man Interface Guidelines [6]. Violations are shown as a textual list that is typesetin red font color.
74
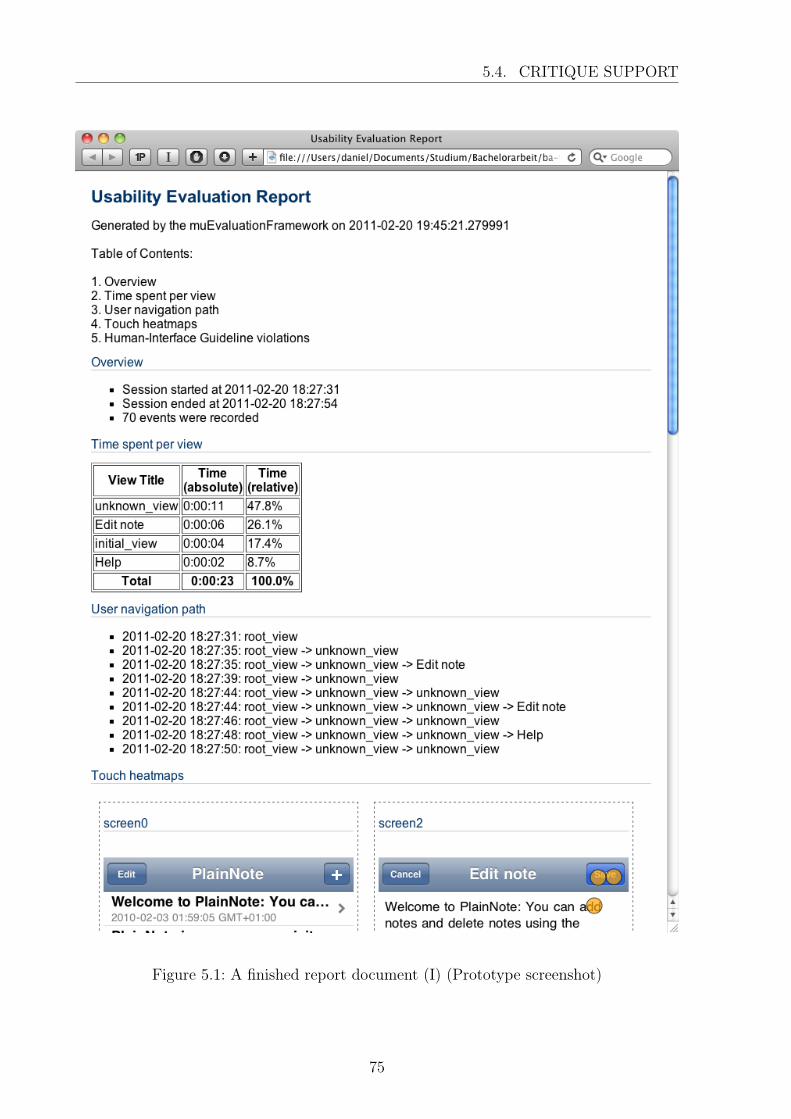
5.4. CRITIQUE SUPPORT
Figure 5.1: A finished report document (I) (Prototype screenshot)
75
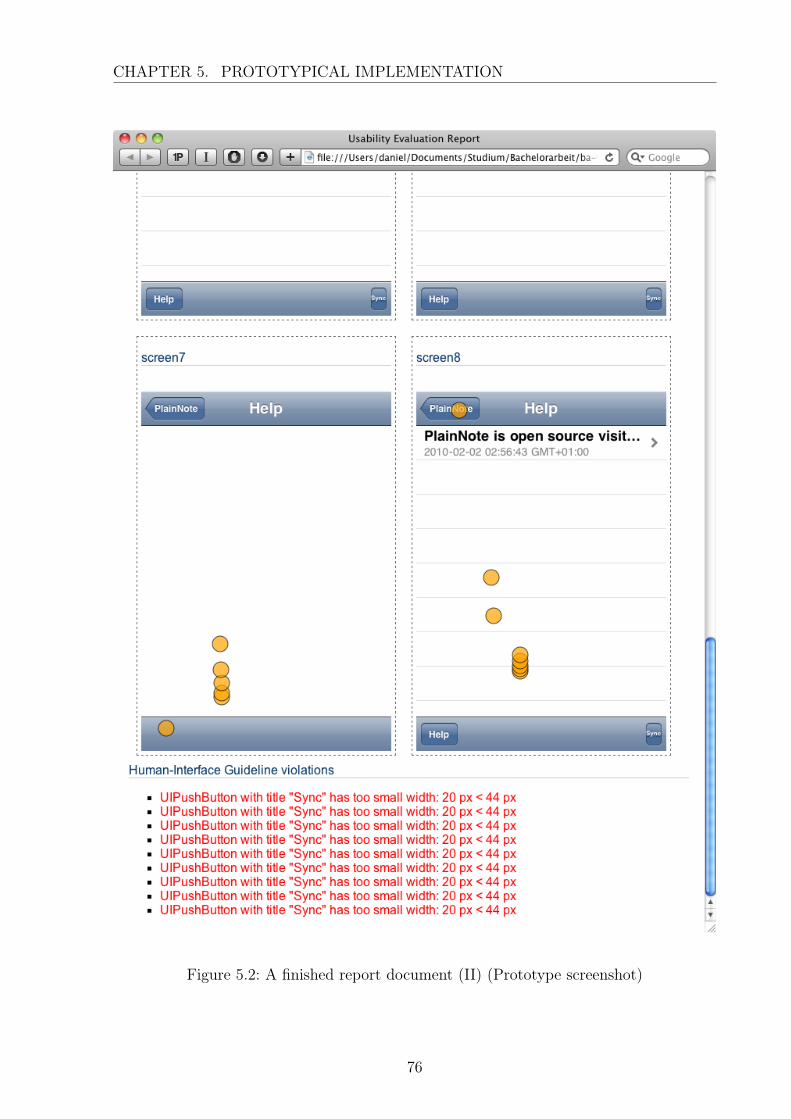
CHAPTER 5. PROTOTYPICAL IMPLEMENTATION
Figure 5.2: A finished report document (II) (Prototype screenshot)
76
6 Future work
During the development process we encountered several interesting issues for the futuredevelopment of the present approach and we summarize them in the following sections.
6.1 Evaluation of a real product
To further improve the framework’s support for automated usability evaluations it shouldbe used in a test case with a real product and real test users. Although we used theprototypical implementation of the framework with two applications that are available inthe Apple iOS AppStore1 (Wordpress for iOS and PlainNote), this would be a chance tofurther refine the framework and to test it in a real world scenario. Based on the feedbackof the developers we could add new sensors and section types to further enhance the useof the framework.
6.2 Web-based automated usability evaluation
The framework could be extended to include the abilities that were mentioned in thevisionary scenario. We could add a number of sensor and section types that enableadvanced functionality such as recording a video of the test user’s face or analyzing theuser’s speech for strong emotions. In additions to these improvements, the muEvaluation-Framework could be made available as a web service. This means that developers whowant to test a host-application would simply upload their application binary to a serverand then select a few options, such as the number of test users, the active sensors andsections, and tasks for the test users. The framework would now automatically distributethe evaluation to a suitable group of test users, then wait for them to finish the evaluations,and return the results (i.e. the finished reports) back to the developers.
1The iOS AppStore is an online service provided by Apple Inc. that allows users to purchase anddownload applications (“Apps” for iOS-based devices).
77
CHAPTER 6. FUTURE WORK
6.3 Google Android support
Next to the iOS platform, Google’s Android is another important platform for the smart-phone market. Because of the similarities in the usability concept of both platforms, itmakes much more sense to extend the muEvaluationFramework to the Android platformthan, for example, to Nokia’s Symbian. Android applications are mostly implementedin the Java language. This means that the CaptureLibrary subsystem of the frameworkwould have to be ported to the Java language and be enabled to work with the AndroidUI toolkit. Because Java provides very good support for reflection we are sure that thisis a viable option.
78
7 Conclusion
In this thesis we developed the muEvaluationFramework, an application-independent soft-ware for remote usability evaluation on mobile platforms. The framework supports au-tomation in the capture, analysis, and critique phases of an usability evaluation.
First, during the capture phase, the framework collects usability data such as user inputor application events while a test user interacts with the host-application. This datacollection is performed by an extensible set of software-based sensors. Second, duringthe analysis phase, interpreter algorithms analyze the usability data that were collectedin the capture phase. This analysis step is performed automatically. It summarizes theevaluation session and reveals usability issues in the analyzed application. Third, duringthe critique phase, a report is generated that contains multiple sections with the resultsof the analysis phase for the developer. Reports are generated in the HTML format andcan include interactive elements and embedded multimedia content.
We developed a prototypical implementation of the framework for the Apple iOS plat-form. This prototype was tested with two open-source applications, Wordpress for iOSand PlainNote that are available on the iOS AppStore. The prototypical implementa-tion shows how usability data can be collected on the iOS platform and how it can beautomatically analyzed. We therefore believe that the prototype demonstrates that thesoftware architecture for the framework is viable, and that it can be used as a basis forfuture research in the area of automated remote usability evaluation.
79

CHAPTER 7. CONCLUSION
80
Bibliography
[1] Andreasen, M., Nielsen, H., Schrøder, S., and Stage, J. What happenedto remote usability testing?: an empirical study of three methods. Proceedings of theSIGCHI conference on Human factors in computing systems (2007), 1405–1414. 7
[2] Apple Inc. Coding guidelines for Cocoa. http://developer.apple.com/library/mac/documentation/Cocoa/Conceptual/CodingGuidelines/CodingGuidelines.
pdf, May 2010. 55
[3] Apple Inc. Grand Central Dispatch (GCD) reference. http://developer.apple.
com/library/mac/documentation/Performance/Reference/GCD_libdispatch_
Ref/GCD_libdispatch_Ref.pdf, May 2010. 72
[4] Apple Inc. Objective-C runtime reference. http://developer.
apple.com/library/mac/documentation/Cocoa/Reference/ObjCRuntimeRef/
ObjCRuntimeRef.pdf, June 2010. 59
[5] Apple Inc. Apple iOS platform homepage. http://www.apple.com/ios, Feb. 2011.47
[6] Apple Inc. iOS human interface guidelines. http://developer.apple.
com/library/ios/documentation/UserExperience/Conceptual/MobileHIG/
MobileHIG.pdf, Jan. 2011. 19, 20, 21, 73, 74
[7] Ash, M. MAObjCRuntime library. https://github.com/mikeash/MAObjCRuntime,Sept. 2010. 59
[8] Au, F., Baker, S., Warren, I., and Dobbie, G. Automated usability testingframework. AUIC ’08: Proceedings of the ninth conference on Australasian userinterface 76 (Jan 2008). 3, 7
[9] Balagtas-Fernandez, F., and Hussmann, H. A methodology and frame-work to simplify usability analysis of mobile applications. ASE ’09: Proceedings ofthe 2009 IEEE/ACM International Conference on Automated Software Engineering(Nov 2009). 1, 10
[10] Balbo, S. Automatic evaluation of user interface usability: Dream or reality?Proceedings of the Queensland Computer-Human Interaction Symposium (1995). 7
81
Bibliography
[11] Bevan, N. Measuring usability as quality of use. Software Quality Journal 4, 2(1995), 115–130. 3
[12] Bruegge, B., and Dutoit, A. H. Object-Oriented Software Engineering: Con-quering Complex and Changing Systems. Prentice Hall, 2000. 48
[13] Buck, E. M., and Yacktman, D. A. Cocoa Design Patterns, 1st ed. Addison-Wesley Professional, 2009. 57, 58
[14] Cheshire, S. Zero configuration networking. http://www.zeroconf.org, Feb. 2011.58
[15] Duh, H., Tan, G., and Chen, V. Usability evaluation for mobile device: a compar-ison of laboratory and field tests. MobileHCI ’06: Proceedings of the 8th conferenceon Human-computer interaction with mobile devices and services (Sep 2006). 1
[16] Google Inc. Android platform homepage. http://www.android.com, Feb. 2011.47
[17] Google Inc. Developer’s guide - google analytics for mobile. http://code.google.com/mobile/analytics/docs, Feb. 2011. 11
[18] Hartson, H., Castillo, J., Kelso, J., and Neale, W. Remote evaluation:the network as an extension of the usability laboratory. CHI ’96: Proceedings of theSIGCHI conference on Human factors in computing systems: common ground (Apr1996). 6
[19] Hipp, D. R. SQLite homepage. http://www.sqlite.org, Feb. 2011. 12
[20] Holzinger, A. Usability engineering methods for software developers. Communi-cations of the ACM 48, 1 (Jan 2005). 3, 5
[21] Ivory, M., and Hearst, M. The state of the art in automating usability evaluationof user interfaces. Computing Surveys (CSUR 33, 4 (Dec 2001). 5, 7, 8
[22] Kaikkonen, A., Kallio, T., Kekäläinen, A., Kankainen, A., and Cankar,M. Usability testing of mobile applications: A comparison between laboratory andfield testing. Journal of Usability Studies 1, 1 (2005), 4–16. 1
[23] Kjeldskov, J., and Stage, J. New techniques for usability evaluation of mobilesystems. International Journal of Human-Computer Studies 60, 5-6 (2004), 599–620.1
[24] Nielsen, J. Usability engineering. Academic Press, Boston, 1993. 3, 5
[25] Nokia. Symbian blog | Symbian at nokia. http://symbian.nokia.com, Feb. 2011.47
[26] Object Management Group. UML superstructure specification, v.2.1.2. http:
//www.omg.org/spec/UML/2.1.2/Superstructure/PDF, Nov. 2007. 3
82
Bibliography
[27] Paternò, F., Russino, A., and Santoro, C. Remote evaluation of mobileapplications. TAMODIA 2007 (2007), 155 – 169. 2, 7, 9
[28] Shneiderman, B., and Plaisant, C. Designing the User Interface: Strategies forEffective Human-Computer Interaction, Fifth Edition. Pearson Higher Education,2009. 5
[29] Stawarz, C. The pybonjour library homepage. http://code.google.com/p/
pybonjour/, Feb. 2011. 72
[30] van Rossum, G., and Warsaw, B. Style guide for Python code. http://www.
python.org/dev/peps/pep-���8, Feb. 2011. 55
[31] Vasudeva, V. Software Architecture. Dorling Kindersley, 2009. 33
[32] Zhang, D., and Adipat, B. Challenges, methodologies, and issues in the usabilitytesting of mobile applications. International Journal of Human-Computer Interaction18, 3 (2005), 293–308. 3, 4
83