Embed Size (px)
Citation preview
Int J CARS (2013) 8:193–205DOI 10.1007/s11548-012-0767-5
ORIGINAL ARTICLE
Fast lung nodule detection in chest CT imagesusing cylindrical nodule-enhancement filter
Atsushi Teramoto · Hiroshi Fujita
Received: 4 February 2012 / Accepted: 24 May 2012 / Published online: 9 June 2012© CARS 2012
AbstractPurpose Existing computer-aided detection schemes forlung nodule detection require a large number of calculationsand tens of minutes per case; there is a large gap betweenimage acquisition time and nodule detection time. In thisstudy, we propose a fast detection scheme of lung nodule inchest CT images using cylindrical nodule-enhancement filterwith the aim of improving the workflow for diagnosis in CTexaminations.Methods Proposed detection scheme involves segmenta-tion of the lung region, preprocessing, nodule enhancement,further segmentation, and false-positive (FP) reduction. Asa nodule enhancement, our method employs a cylindricalshape filter to reduce the number of calculations. False pos-itives (FPs) in nodule candidates are reduced using supportvector machine and seven types of characteristic parameters.Results The detection performance and speed were evaluatedexperimentally using Lung Image Database Consortium pub-licly available image database. A 5-fold cross-validationresult demonstrates that our method correctly detects 80 %of nodules with 4.2 FPs per case, and detection speed ofproposed method is also 4–36 times faster than existingmethods.Conclusion Detection performance and speed indicate thatour method may be useful for fast detection of lung nodulesin CT images.
A. Teramoto (B)Faculty of Radiological Technology, School of Health Sciences,Fujita Health University, 1-98 Dengakugakubo, Kutsukake-cho,Toyoake-city, Aichi 470-1192, Japane-mail: [email protected]
H. FujitaDepartment of Intelligent Image Information,Graduate School of Medicine Gifu University,1-1 Yanagido, Gifu-city, Gifu 501-1194, Japan
Keywords Computer-aided detection (CAD) · Lung ·Nodule · Computed tomography (CT) · Image processing ·Fast detection
AbbreviationsCAD Computer-aided detectionCNEF Cylindrical nodule-enhancement filterC-SVC C-support vector classificationCT Computed tomographyFROC Free-response receiver operating characteristicGGO Ground glass opacityLIDC Lung image database consortiumMIP Maximum intensity projectionPET Positron emission tomographySVM Support vector machine
Introduction
Lung cancer is a serious public health problem in the UnitedStates, Europe, and many other countries, as it is a leadingcause of death, in terms of cancer, for men and women. Detec-tion and treatment at an early stage are required to effectivelyovercome this burden. X-ray computed tomography (CT) hasrecently been adopted as a mass-screening tool for lung can-cer diagnosis [1], enabling a rapid improvement in the abil-ity to detect tumors early. According to the results from theNational Lung Screening Trial [2], screening with low-doseCT scans cuts lung cancer deaths by 20 %. A greater num-ber of CT examinations are expected to be adopted for lungscreening in the future; however, CT scans generate a largenumber of images that must be read by the radiologist, andavoiding diagnostic reading errors is a pressing challenge.
Computer-aided detection (CAD) provides computer out-put as a “second opinion” to assist radiologists in diagnosing
123
194 Int J CARS (2013) 8:193–205
various diseases from medical images. Many CAD methodsfor lung nodule detection have been developed [3–12].
Yamamoto et al. [3] proposed an enhancement filter, theQuoit Filter, that has large ring and disk filters. The filterenhances the nodule by calculating the difference in the out-put of the ring and disk filter. They also proposed a three-dimensional (3D) extension. Lee et al. [4] used a templatematching technique to detect lung nodules in chest CT scans.A genetic algorithm was designed to determine the targetposition and to select a template image from the reference pat-terns. The four reference templates were established accord-ing to the gray-level values of 3D Gaussian distributions.Li et al. [7] proposed three selective enhancement filters fordots, lines, and planes, which can simultaneously enhanceobjects of a specific shape and suppress other objects. Theyblurred the CT image with a Gaussian kernel that matchedthe size of the nodule to be detected before calculating theeigenvalues of the Hessian matrix that were used for selec-tive enhancement. They used multiple scales of the Gaussiankernel to find a match with the nodule size.
Recent studies employ the publicly available testing data-base provided by the Lung Image Database Consortium(LIDC) to evaluate the detection performance of CADschemes [13–20]. Way and Sahiner et al. [13,14] proposed anodule detection scheme using a 3D active contour method.Opfer et al [15] proposed a CAD scheme based on dis-tance transformations for various thresholds and subsequentcrest line extraction. Golosio et al. [16] proposed the noduledetection method using multi-threshold surface triangulationapproach. Messay et al. [17] employed a local contrastenhancement filter that followed the nodule enhancementmethod used for the chest radiographs [21]. Riccardi et al.[18] developed CAD scheme using 3D radial transform,scale space technique, and Zernike MIP classification. Cam-arlinghi et al. [19] proposed combined nodule detection usingexisting algorithms. Tan et al. [20] introduced nodule- andvessel-enhancement filter in a nodule detection step, featureselection, and classification methodology. These schemeshave a sensitivity of 70–80 % with a false positive (FP) percase of less than 10. However, these methods require a largenumber of calculations and tens of minutes per case. On theother hand, current CT units have the capability of generatinglung volume images within 30 s per scan. There is a large gapbetween image acquisition time and nodule detection time.
In this study, a fast CAD scheme for lung nodule detectionis investigated with the aim of reducing the above gap, andimproving the workflow for diagnosis in CT examinations.
In this paper, we propose a fast CAD scheme for lungnodule detection in CT images. We employed a cylindri-cal shape filter as a fast enhancement method for lung nod-ules in 3 dimensions. FPs in nodule candidates are reducedusing support vector machine (SVM) together with sevencharacteristic shape parameters. In the experiments, the
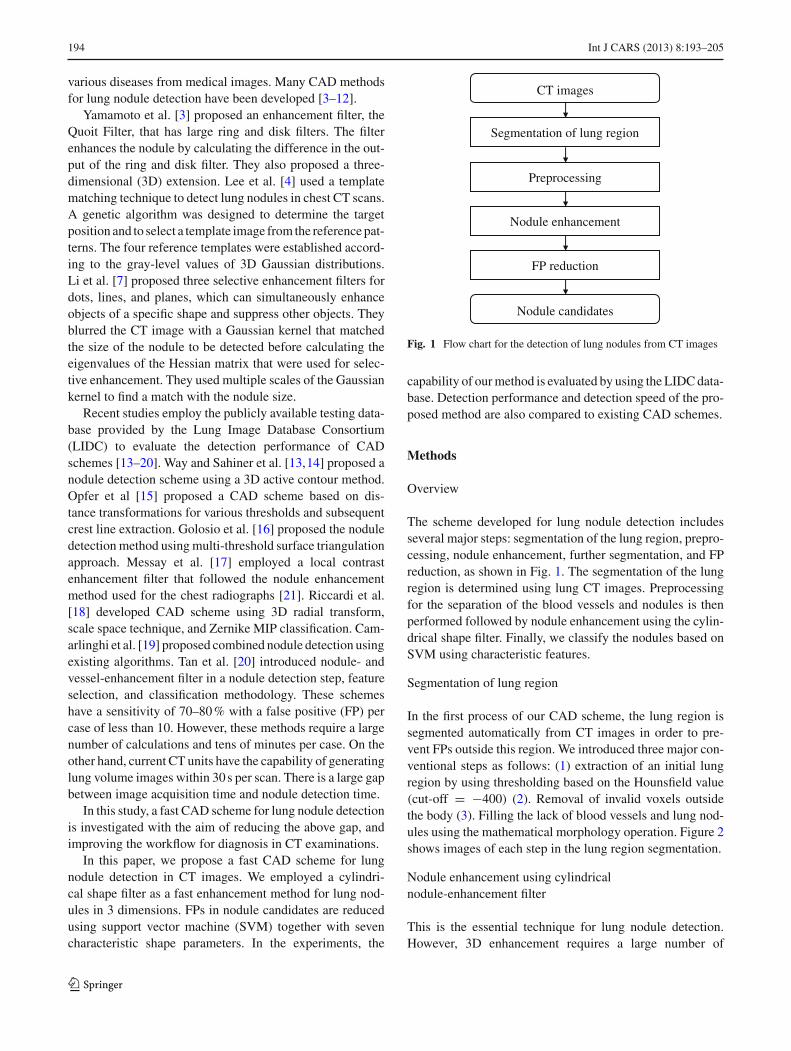
CT images
Segmentation of lung region
Preprocessing
Nodule enhancement
FP reduction
Nodule candidates
Fig. 1 Flow chart for the detection of lung nodules from CT images
capability of our method is evaluated by using the LIDC data-base. Detection performance and detection speed of the pro-posed method are also compared to existing CAD schemes.
Methods
Overview
The scheme developed for lung nodule detection includesseveral major steps: segmentation of the lung region, prepro-cessing, nodule enhancement, further segmentation, and FPreduction, as shown in Fig. 1. The segmentation of the lungregion is determined using lung CT images. Preprocessingfor the separation of the blood vessels and nodules is thenperformed followed by nodule enhancement using the cylin-drical shape filter. Finally, we classify the nodules based onSVM using characteristic features.
Segmentation of lung region
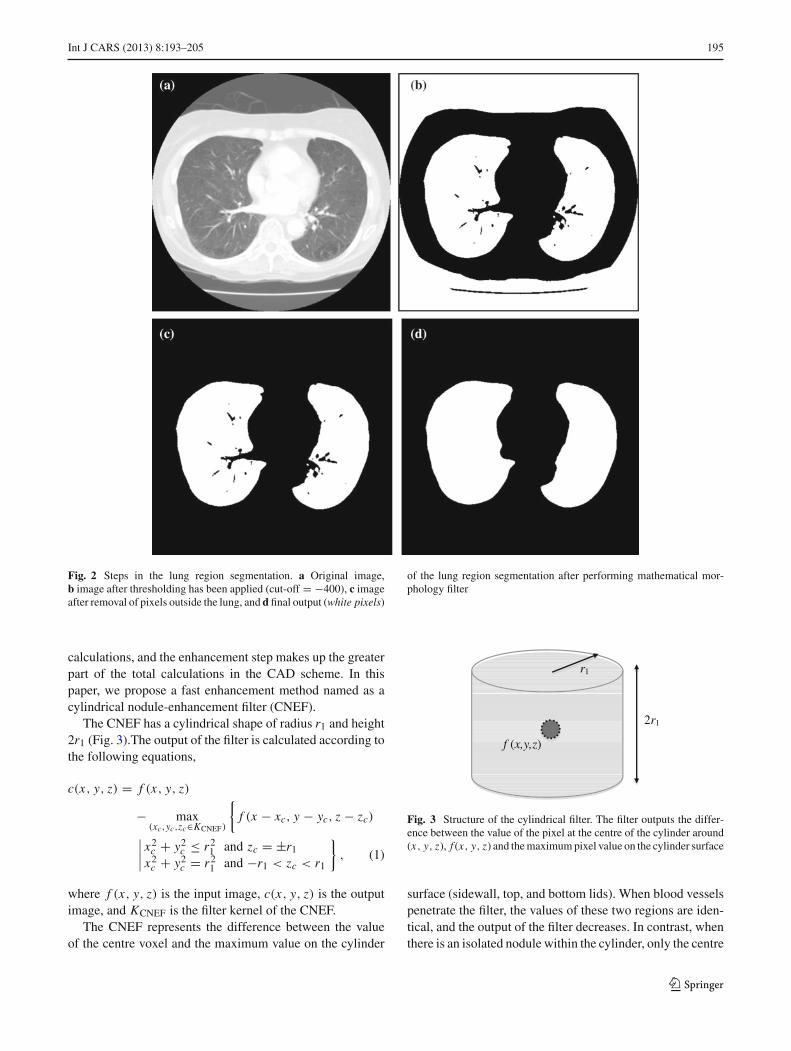
In the first process of our CAD scheme, the lung region issegmented automatically from CT images in order to pre-vent FPs outside this region. We introduced three major con-ventional steps as follows: (1) extraction of an initial lungregion by using thresholding based on the Hounsfield value(cut-off = !400) (2). Removal of invalid voxels outsidethe body (3). Filling the lack of blood vessels and lung nod-ules using the mathematical morphology operation. Figure 2shows images of each step in the lung region segmentation.
Nodule enhancement using cylindricalnodule-enhancement filter
This is the essential technique for lung nodule detection.However, 3D enhancement requires a large number of
123
Int J CARS (2013) 8:193–205 195
Fig. 2 Steps in the lung region segmentation. a Original image,b image after thresholding has been applied (cut-off = !400), c imageafter removal of pixels outside the lung, and d final output (white pixels)
of the lung region segmentation after performing mathematical mor-phology filter
calculations, and the enhancement step makes up the greaterpart of the total calculations in the CAD scheme. In thispaper, we propose a fast enhancement method named as acylindrical nodule-enhancement filter (CNEF).
The CNEF has a cylindrical shape of radius r1 and height2r1 (Fig. 3).The output of the filter is calculated according tothe following equations,
c(x, y, z) = f (x, y, z)
! max(xc,yc,zc"KCNEF)
!f (x ! xc, y ! yc, z ! zc)
""""x2
c + y2c # r2
1 and zc = ±r1x2
c + y2c = r2
1 and !r1 < zc < r1
#, (1)
where f (x, y, z) is the input image, c(x, y, z) is the outputimage, and KCNEF is the filter kernel of the CNEF.
The CNEF represents the difference between the valueof the centre voxel and the maximum value on the cylinder
2r1
f (x,y,z)
r1
Fig. 3 Structure of the cylindrical filter. The filter outputs the differ-ence between the value of the pixel at the centre of the cylinder around(x, y, z), f (x, y, z) and the maximum pixel value on the cylinder surface
surface (sidewall, top, and bottom lids). When blood vesselspenetrate the filter, the values of these two regions are iden-tical, and the output of the filter decreases. In contrast, whenthere is an isolated nodule within the cylinder, only the centre
123
196 Int J CARS (2013) 8:193–205
voxel has a high value, and the output of the filter increases.Thus, the CNEF enhances the nodule selectively based onthe object shape.
The cylinder surface of CNEF can be divided into a side-wall and two lids (top and bottom). Here, the maximum valueon the cylinder sidewall is equivalent to the maximum valueon the circle whose radius is r1 in a maximum intensity pro-jection (MIP) image of slab width 2r1. This means that the3D calculation for the cylinder sidewall is replaced by 2Dprocessing using a MIP image. It is note that only one ofMIP processing is required, while all voxels in one slice areprocessed. The outputs of two lids are equal to the outputof morphological filter [22] that output the maximum valuein a circle with radius r1 at z = ±r1. After the maximum
values of the cylinder sidewall and lids are calculated, thelargest one is taken as the final output of the cylinder. In thismanner, the CNEF uses only three 2D images, so significantreduction in the number of calculation is attained.
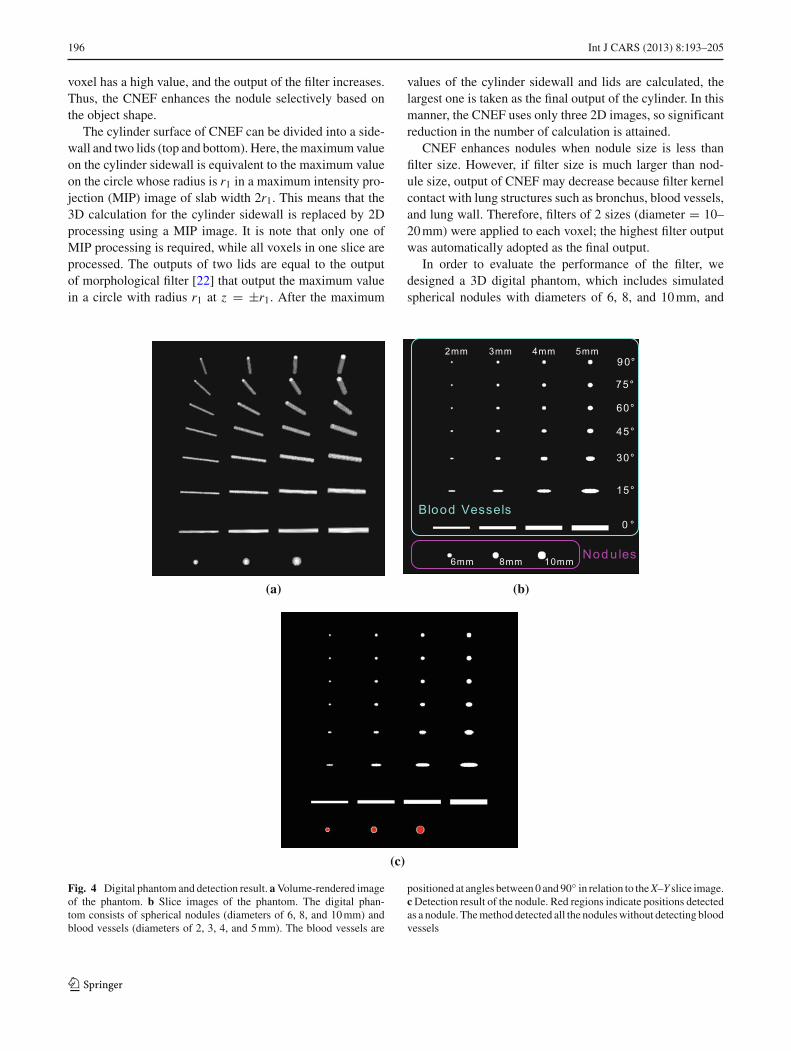
CNEF enhances nodules when nodule size is less thanfilter size. However, if filter size is much larger than nod-ule size, output of CNEF may decrease because filter kernelcontact with lung structures such as bronchus, blood vessels,and lung wall. Therefore, filters of 2 sizes (diameter = 10–20 mm) were applied to each voxel; the highest filter outputwas automatically adopted as the final output.
In order to evaluate the performance of the filter, wedesigned a 3D digital phantom, which includes simulatedspherical nodules with diameters of 6, 8, and 10 mm, and
(a) (b)
(c)
Fig. 4 Digital phantom and detection result. a Volume-rendered imageof the phantom. b Slice images of the phantom. The digital phan-tom consists of spherical nodules (diameters of 6, 8, and 10 mm) andblood vessels (diameters of 2, 3, 4, and 5 mm). The blood vessels are
positioned at angles between 0 and 90$ in relation to the X–Y slice image.c Detection result of the nodule. Red regions indicate positions detectedas a nodule. The method detected all the nodules without detecting bloodvessels
123
Int J CARS (2013) 8:193–205 197
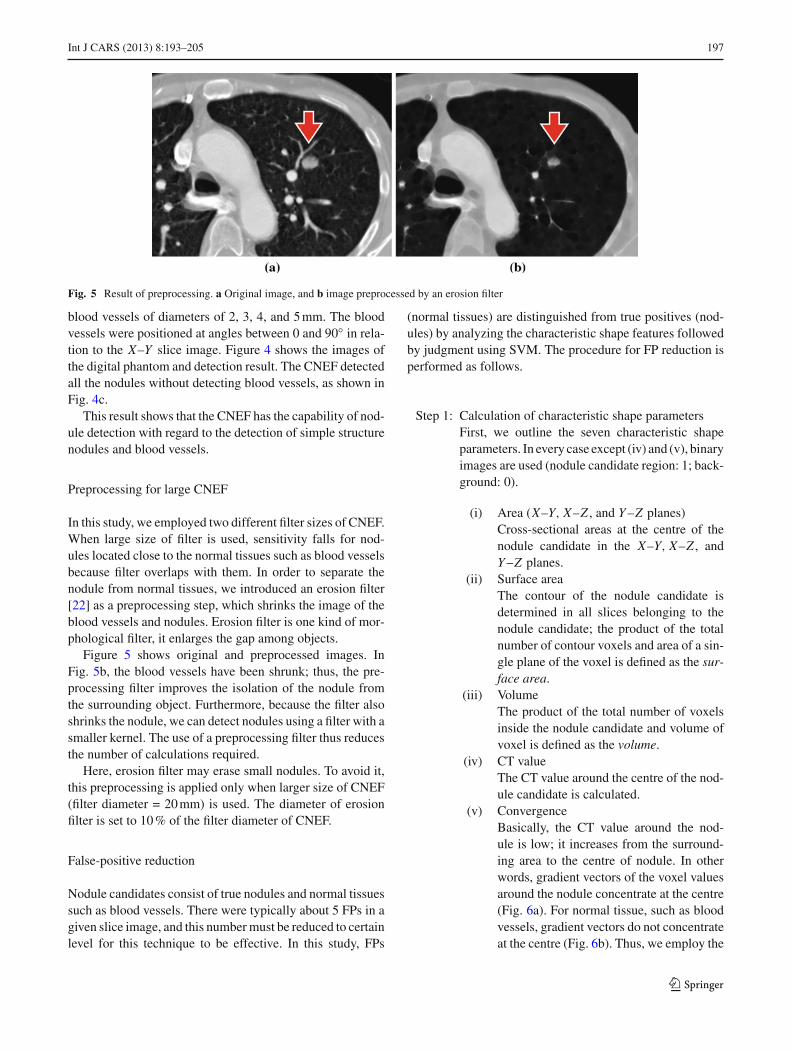
Fig. 5 Result of preprocessing. a Original image, and b image preprocessed by an erosion filter
blood vessels of diameters of 2, 3, 4, and 5 mm. The bloodvessels were positioned at angles between 0 and 90$ in rela-tion to the X–Y slice image. Figure 4 shows the images ofthe digital phantom and detection result. The CNEF detectedall the nodules without detecting blood vessels, as shown inFig. 4c.
This result shows that the CNEF has the capability of nod-ule detection with regard to the detection of simple structurenodules and blood vessels.
Preprocessing for large CNEF
In this study, we employed two different filter sizes of CNEF.When large size of filter is used, sensitivity falls for nod-ules located close to the normal tissues such as blood vesselsbecause filter overlaps with them. In order to separate thenodule from normal tissues, we introduced an erosion filter[22] as a preprocessing step, which shrinks the image of theblood vessels and nodules. Erosion filter is one kind of mor-phological filter, it enlarges the gap among objects.
Figure 5 shows original and preprocessed images. InFig. 5b, the blood vessels have been shrunk; thus, the pre-processing filter improves the isolation of the nodule fromthe surrounding object. Furthermore, because the filter alsoshrinks the nodule, we can detect nodules using a filter with asmaller kernel. The use of a preprocessing filter thus reducesthe number of calculations required.
Here, erosion filter may erase small nodules. To avoid it,this preprocessing is applied only when larger size of CNEF(filter diameter = 20 mm) is used. The diameter of erosionfilter is set to 10 % of the filter diameter of CNEF.
False-positive reduction
Nodule candidates consist of true nodules and normal tissuessuch as blood vessels. There were typically about 5 FPs in agiven slice image, and this number must be reduced to certainlevel for this technique to be effective. In this study, FPs
(normal tissues) are distinguished from true positives (nod-ules) by analyzing the characteristic shape features followedby judgment using SVM. The procedure for FP reduction isperformed as follows.
Step 1: Calculation of characteristic shape parametersFirst, we outline the seven characteristic shapeparameters. In every case except (iv) and (v), binaryimages are used (nodule candidate region: 1; back-ground: 0).
(i) Area (X–Y, X–Z , and Y –Z planes)Cross-sectional areas at the centre of thenodule candidate in the X–Y, X–Z , andY –Z planes.
(ii) Surface areaThe contour of the nodule candidate isdetermined in all slices belonging to thenodule candidate; the product of the totalnumber of contour voxels and area of a sin-gle plane of the voxel is defined as the sur-face area.
(iii) VolumeThe product of the total number of voxelsinside the nodule candidate and volume ofvoxel is defined as the volume.
(iv) CT valueThe CT value around the centre of the nod-ule candidate is calculated.
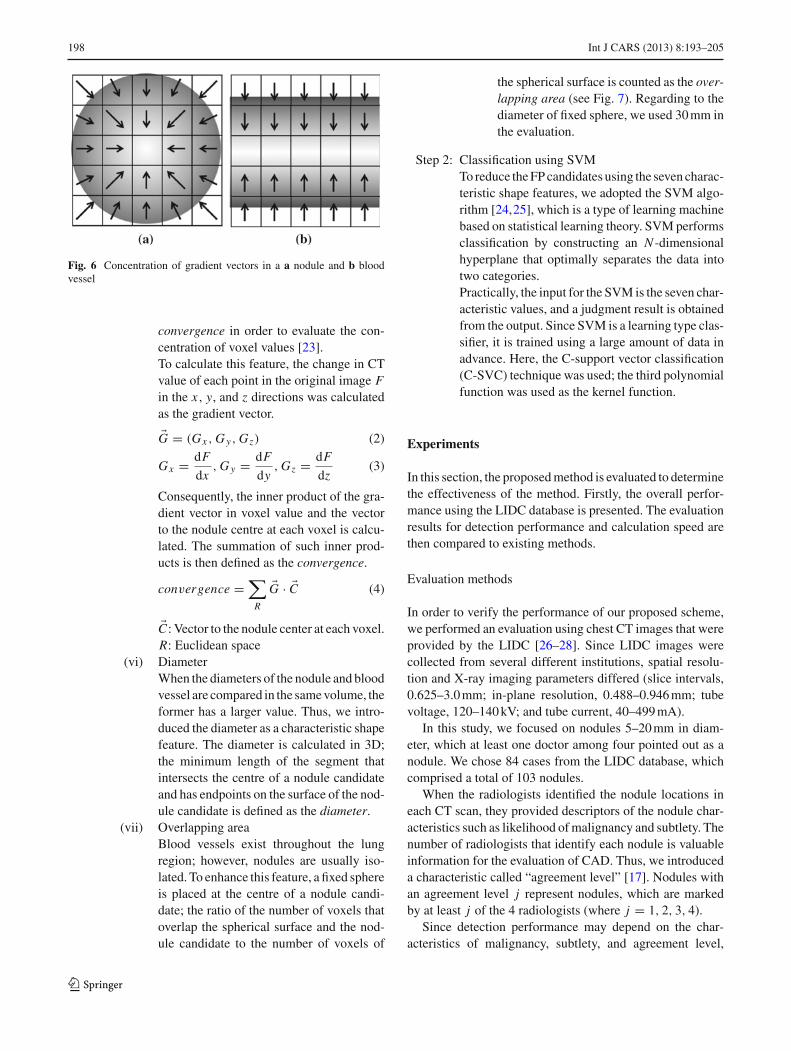
(v) ConvergenceBasically, the CT value around the nod-ule is low; it increases from the surround-ing area to the centre of nodule. In otherwords, gradient vectors of the voxel valuesaround the nodule concentrate at the centre(Fig. 6a). For normal tissue, such as bloodvessels, gradient vectors do not concentrateat the centre (Fig. 6b). Thus, we employ the
123
198 Int J CARS (2013) 8:193–205
Fig. 6 Concentration of gradient vectors in a a nodule and b bloodvessel
convergence in order to evaluate the con-centration of voxel values [23].To calculate this feature, the change in CTvalue of each point in the original image Fin the x, y, and z directions was calculatedas the gradient vector.
%G = (Gx , G y, Gz) (2)
Gx = dFdx
, G y = dFdy
, Gz = dFdz
(3)
Consequently, the inner product of the gra-dient vector in voxel value and the vectorto the nodule centre at each voxel is calcu-lated. The summation of such inner prod-ucts is then defined as the convergence.
convergence =$
R
%G · %C (4)
%C : Vector to the nodule center at each voxel.R: Euclidean space
(vi) DiameterWhen the diameters of the nodule and bloodvessel are compared in the same volume, theformer has a larger value. Thus, we intro-duced the diameter as a characteristic shapefeature. The diameter is calculated in 3D;the minimum length of the segment thatintersects the centre of a nodule candidateand has endpoints on the surface of the nod-ule candidate is defined as the diameter.
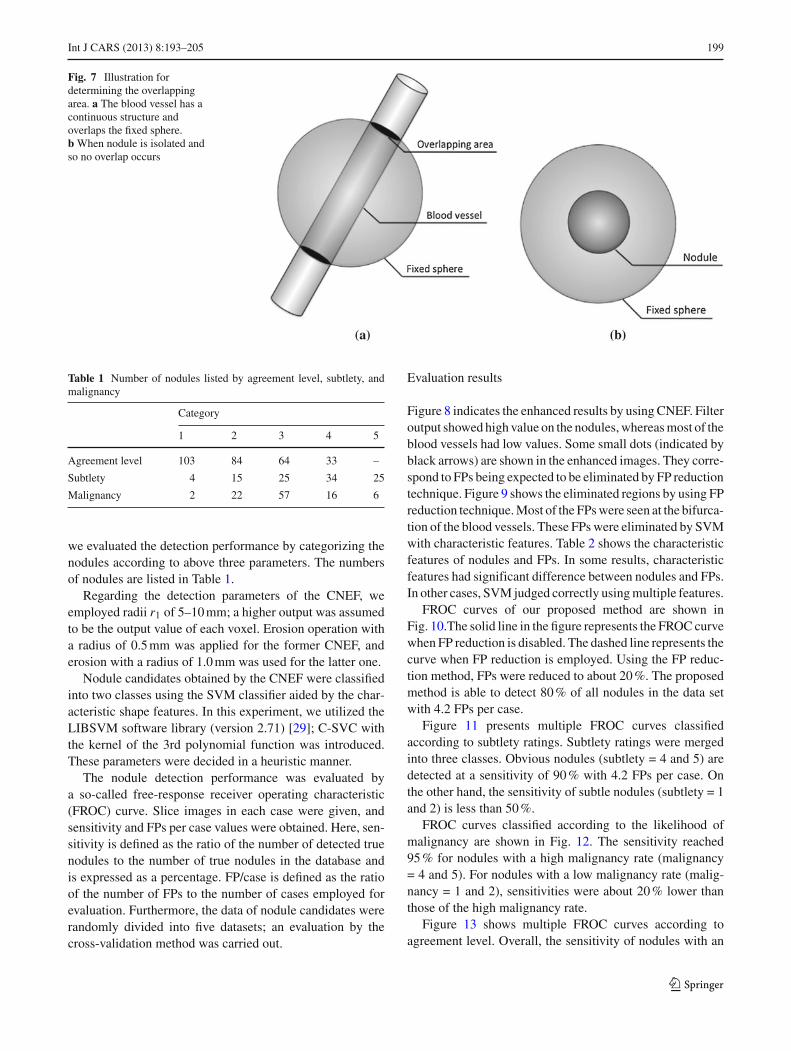
(vii) Overlapping areaBlood vessels exist throughout the lungregion; however, nodules are usually iso-lated. To enhance this feature, a fixed sphereis placed at the centre of a nodule candi-date; the ratio of the number of voxels thatoverlap the spherical surface and the nod-ule candidate to the number of voxels of
the spherical surface is counted as the over-lapping area (see Fig. 7). Regarding to thediameter of fixed sphere, we used 30 mm inthe evaluation.
Step 2: Classification using SVMTo reduce the FP candidates using the seven charac-teristic shape features, we adopted the SVM algo-rithm [24,25], which is a type of learning machinebased on statistical learning theory. SVM performsclassification by constructing an N -dimensionalhyperplane that optimally separates the data intotwo categories.Practically, the input for the SVM is the seven char-acteristic values, and a judgment result is obtainedfrom the output. Since SVM is a learning type clas-sifier, it is trained using a large amount of data inadvance. Here, the C-support vector classification(C-SVC) technique was used; the third polynomialfunction was used as the kernel function.
Experiments
In this section, the proposed method is evaluated to determinethe effectiveness of the method. Firstly, the overall perfor-mance using the LIDC database is presented. The evaluationresults for detection performance and calculation speed arethen compared to existing methods.
Evaluation methods
In order to verify the performance of our proposed scheme,we performed an evaluation using chest CT images that wereprovided by the LIDC [26–28]. Since LIDC images werecollected from several different institutions, spatial resolu-tion and X-ray imaging parameters differed (slice intervals,0.625–3.0 mm; in-plane resolution, 0.488–0.946 mm; tubevoltage, 120–140 kV; and tube current, 40–499 mA).
In this study, we focused on nodules 5–20 mm in diam-eter, which at least one doctor among four pointed out as anodule. We chose 84 cases from the LIDC database, whichcomprised a total of 103 nodules.
When the radiologists identified the nodule locations ineach CT scan, they provided descriptors of the nodule char-acteristics such as likelihood of malignancy and subtlety. Thenumber of radiologists that identify each nodule is valuableinformation for the evaluation of CAD. Thus, we introduceda characteristic called “agreement level” [17]. Nodules withan agreement level j represent nodules, which are markedby at least j of the 4 radiologists (where j = 1, 2, 3, 4).
Since detection performance may depend on the char-acteristics of malignancy, subtlety, and agreement level,
123
Int J CARS (2013) 8:193–205 199
Fig. 7 Illustration fordetermining the overlappingarea. a The blood vessel has acontinuous structure andoverlaps the fixed sphere.b When nodule is isolated andso no overlap occurs
Table 1 Number of nodules listed by agreement level, subtlety, andmalignancy
Category
1 2 3 4 5
Agreement level 103 84 64 33 –
Subtlety 4 15 25 34 25
Malignancy 2 22 57 16 6
we evaluated the detection performance by categorizing thenodules according to above three parameters. The numbersof nodules are listed in Table 1.
Regarding the detection parameters of the CNEF, weemployed radii r1 of 5–10 mm; a higher output was assumedto be the output value of each voxel. Erosion operation witha radius of 0.5 mm was applied for the former CNEF, anderosion with a radius of 1.0 mm was used for the latter one.
Nodule candidates obtained by the CNEF were classifiedinto two classes using the SVM classifier aided by the char-acteristic shape features. In this experiment, we utilized theLIBSVM software library (version 2.71) [29]; C-SVC withthe kernel of the 3rd polynomial function was introduced.These parameters were decided in a heuristic manner.
The nodule detection performance was evaluated bya so-called free-response receiver operating characteristic(FROC) curve. Slice images in each case were given, andsensitivity and FPs per case values were obtained. Here, sen-sitivity is defined as the ratio of the number of detected truenodules to the number of true nodules in the database andis expressed as a percentage. FP/case is defined as the ratioof the number of FPs to the number of cases employed forevaluation. Furthermore, the data of nodule candidates wererandomly divided into five datasets; an evaluation by thecross-validation method was carried out.
Evaluation results
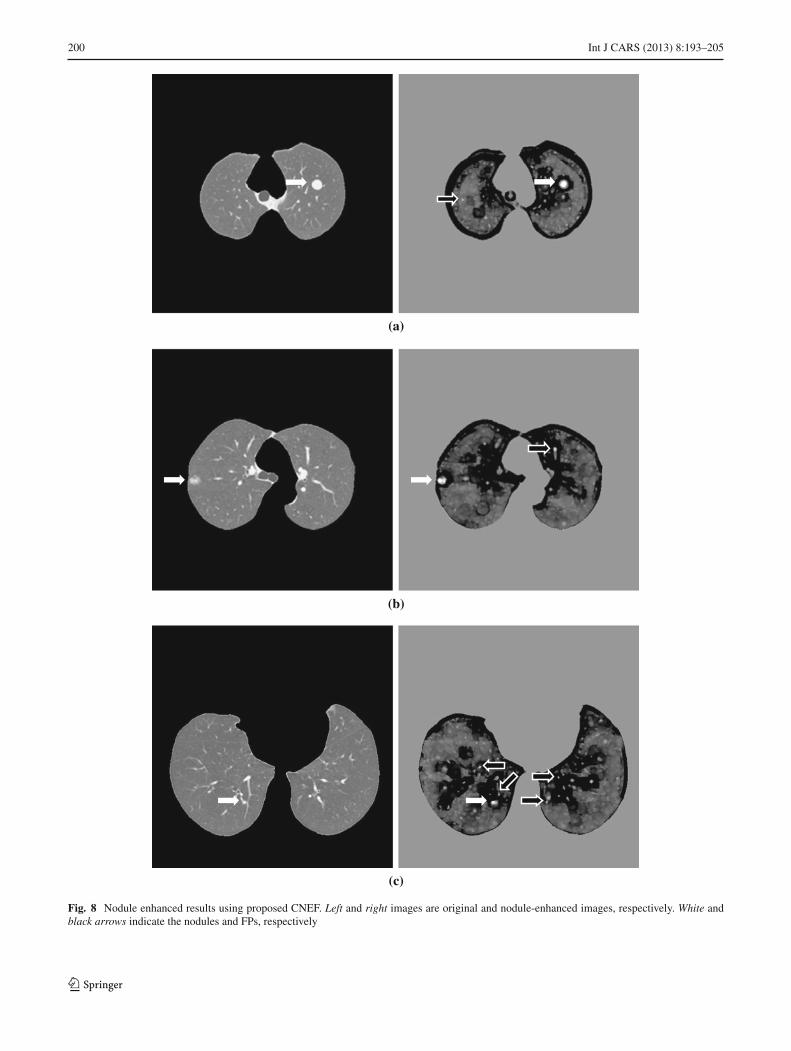
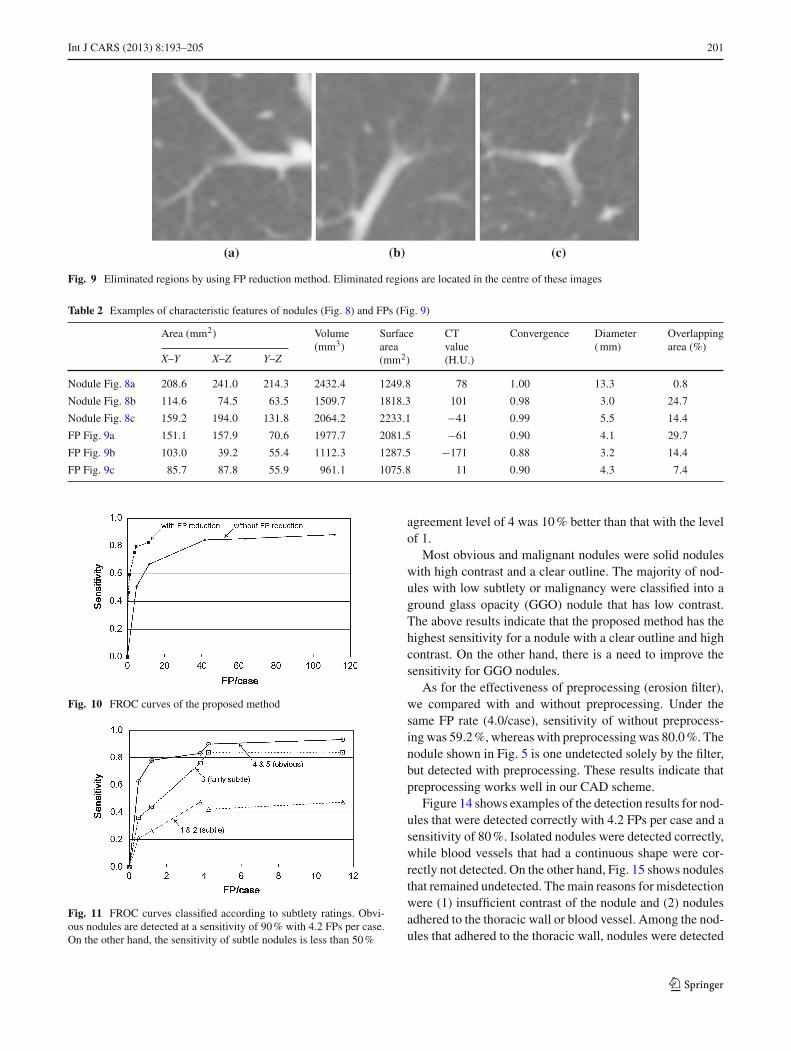
Figure 8 indicates the enhanced results by using CNEF. Filteroutput showed high value on the nodules, whereas most of theblood vessels had low values. Some small dots (indicated byblack arrows) are shown in the enhanced images. They corre-spond to FPs being expected to be eliminated by FP reductiontechnique. Figure 9 shows the eliminated regions by using FPreduction technique. Most of the FPs were seen at the bifurca-tion of the blood vessels. These FPs were eliminated by SVMwith characteristic features. Table 2 shows the characteristicfeatures of nodules and FPs. In some results, characteristicfeatures had significant difference between nodules and FPs.In other cases, SVM judged correctly using multiple features.
FROC curves of our proposed method are shown inFig. 10.The solid line in the figure represents the FROC curvewhen FP reduction is disabled. The dashed line represents thecurve when FP reduction is employed. Using the FP reduc-tion method, FPs were reduced to about 20 %. The proposedmethod is able to detect 80 % of all nodules in the data setwith 4.2 FPs per case.
Figure 11 presents multiple FROC curves classifiedaccording to subtlety ratings. Subtlety ratings were mergedinto three classes. Obvious nodules (subtlety = 4 and 5) aredetected at a sensitivity of 90 % with 4.2 FPs per case. Onthe other hand, the sensitivity of subtle nodules (subtlety = 1and 2) is less than 50 %.
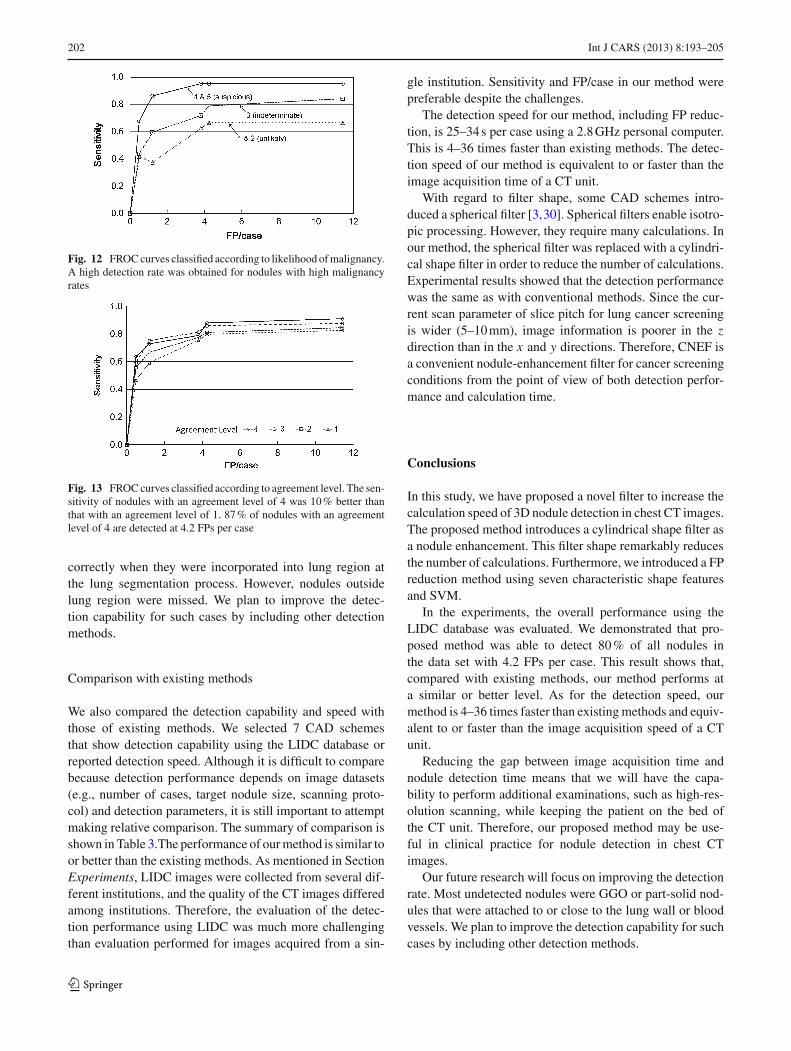
FROC curves classified according to the likelihood ofmalignancy are shown in Fig. 12. The sensitivity reached95 % for nodules with a high malignancy rate (malignancy= 4 and 5). For nodules with a low malignancy rate (malig-nancy = 1 and 2), sensitivities were about 20 % lower thanthose of the high malignancy rate.
Figure 13 shows multiple FROC curves according toagreement level. Overall, the sensitivity of nodules with an
123
200 Int J CARS (2013) 8:193–205
(a)
(b)
(c)
Fig. 8 Nodule enhanced results using proposed CNEF. Left and right images are original and nodule-enhanced images, respectively. White andblack arrows indicate the nodules and FPs, respectively
123
Int J CARS (2013) 8:193–205 201
Fig. 9 Eliminated regions by using FP reduction method. Eliminated regions are located in the centre of these images
Table 2 Examples of characteristic features of nodules (Fig. 8) and FPs (Fig. 9)
Area (mm2) Volume(mm3)
Surfacearea(mm2)
CTvalue(H.U.)
Convergence Diameter( mm)
Overlappingarea (%)
X–Y X–Z Y–Z
Nodule Fig. 8a 208.6 241.0 214.3 2432.4 1249.8 78 1.00 13.3 0.8
Nodule Fig. 8b 114.6 74.5 63.5 1509.7 1818.3 101 0.98 3.0 24.7
Nodule Fig. 8c 159.2 194.0 131.8 2064.2 2233.1 !41 0.99 5.5 14.4
FP Fig. 9a 151.1 157.9 70.6 1977.7 2081.5 !61 0.90 4.1 29.7
FP Fig. 9b 103.0 39.2 55.4 1112.3 1287.5 !171 0.88 3.2 14.4
FP Fig. 9c 85.7 87.8 55.9 961.1 1075.8 11 0.90 4.3 7.4
Fig. 10 FROC curves of the proposed method
Fig. 11 FROC curves classified according to subtlety ratings. Obvi-ous nodules are detected at a sensitivity of 90 % with 4.2 FPs per case.On the other hand, the sensitivity of subtle nodules is less than 50 %
agreement level of 4 was 10 % better than that with the levelof 1.
Most obvious and malignant nodules were solid noduleswith high contrast and a clear outline. The majority of nod-ules with low subtlety or malignancy were classified into aground glass opacity (GGO) nodule that has low contrast.The above results indicate that the proposed method has thehighest sensitivity for a nodule with a clear outline and highcontrast. On the other hand, there is a need to improve thesensitivity for GGO nodules.
As for the effectiveness of preprocessing (erosion filter),we compared with and without preprocessing. Under thesame FP rate (4.0/case), sensitivity of without preprocess-ing was 59.2 %, whereas with preprocessing was 80.0 %. Thenodule shown in Fig. 5 is one undetected solely by the filter,but detected with preprocessing. These results indicate thatpreprocessing works well in our CAD scheme.
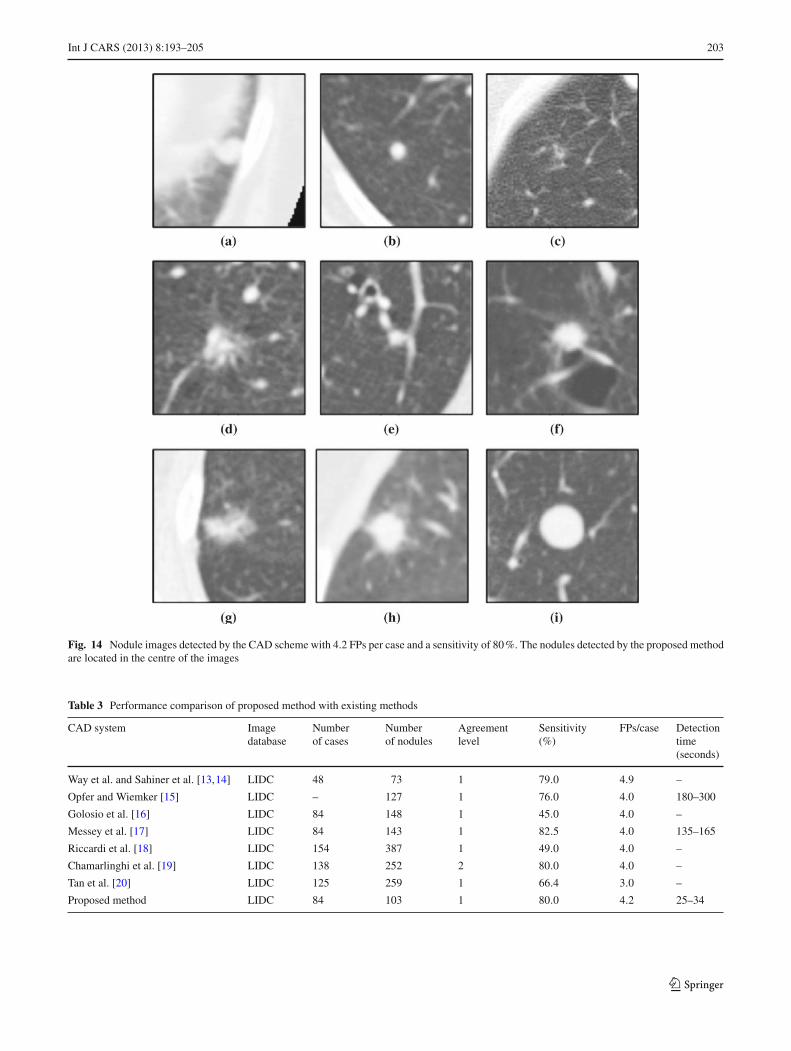
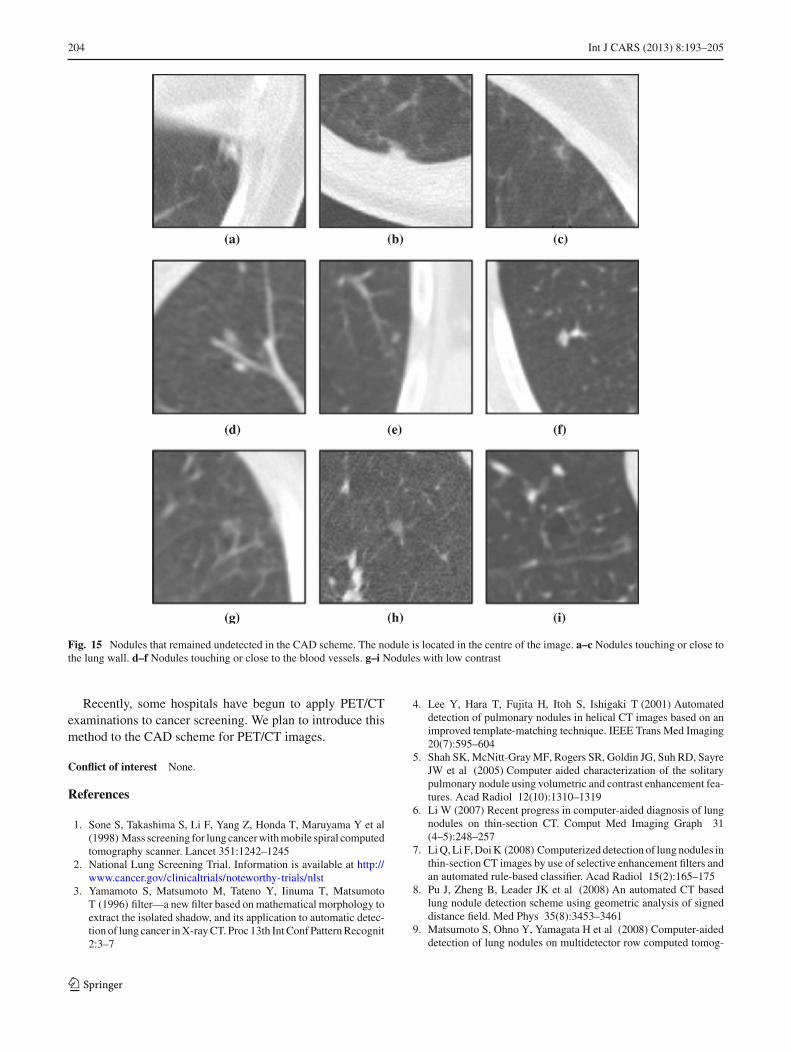
Figure 14 shows examples of the detection results for nod-ules that were detected correctly with 4.2 FPs per case and asensitivity of 80 %. Isolated nodules were detected correctly,while blood vessels that had a continuous shape were cor-rectly not detected. On the other hand, Fig. 15 shows nodulesthat remained undetected. The main reasons for misdetectionwere (1) insufficient contrast of the nodule and (2) nodulesadhered to the thoracic wall or blood vessel. Among the nod-ules that adhered to the thoracic wall, nodules were detected
123
202 Int J CARS (2013) 8:193–205
Fig. 12 FROC curves classified according to likelihood of malignancy.A high detection rate was obtained for nodules with high malignancyrates
Fig. 13 FROC curves classified according to agreement level. The sen-sitivity of nodules with an agreement level of 4 was 10 % better thanthat with an agreement level of 1. 87 % of nodules with an agreementlevel of 4 are detected at 4.2 FPs per case
correctly when they were incorporated into lung region atthe lung segmentation process. However, nodules outsidelung region were missed. We plan to improve the detec-tion capability for such cases by including other detectionmethods.
Comparison with existing methods
We also compared the detection capability and speed withthose of existing methods. We selected 7 CAD schemesthat show detection capability using the LIDC database orreported detection speed. Although it is difficult to comparebecause detection performance depends on image datasets(e.g., number of cases, target nodule size, scanning proto-col) and detection parameters, it is still important to attemptmaking relative comparison. The summary of comparison isshown in Table 3.The performance of our method is similar toor better than the existing methods. As mentioned in SectionExperiments, LIDC images were collected from several dif-ferent institutions, and the quality of the CT images differedamong institutions. Therefore, the evaluation of the detec-tion performance using LIDC was much more challengingthan evaluation performed for images acquired from a sin-
gle institution. Sensitivity and FP/case in our method werepreferable despite the challenges.
The detection speed for our method, including FP reduc-tion, is 25–34 s per case using a 2.8 GHz personal computer.This is 4–36 times faster than existing methods. The detec-tion speed of our method is equivalent to or faster than theimage acquisition time of a CT unit.
With regard to filter shape, some CAD schemes intro-duced a spherical filter [3,30]. Spherical filters enable isotro-pic processing. However, they require many calculations. Inour method, the spherical filter was replaced with a cylindri-cal shape filter in order to reduce the number of calculations.Experimental results showed that the detection performancewas the same as with conventional methods. Since the cur-rent scan parameter of slice pitch for lung cancer screeningis wider (5–10 mm), image information is poorer in the zdirection than in the x and y directions. Therefore, CNEF isa convenient nodule-enhancement filter for cancer screeningconditions from the point of view of both detection perfor-mance and calculation time.
Conclusions
In this study, we have proposed a novel filter to increase thecalculation speed of 3D nodule detection in chest CT images.The proposed method introduces a cylindrical shape filter asa nodule enhancement. This filter shape remarkably reducesthe number of calculations. Furthermore, we introduced a FPreduction method using seven characteristic shape featuresand SVM.
In the experiments, the overall performance using theLIDC database was evaluated. We demonstrated that pro-posed method was able to detect 80 % of all nodules inthe data set with 4.2 FPs per case. This result shows that,compared with existing methods, our method performs ata similar or better level. As for the detection speed, ourmethod is 4–36 times faster than existing methods and equiv-alent to or faster than the image acquisition speed of a CTunit.
Reducing the gap between image acquisition time andnodule detection time means that we will have the capa-bility to perform additional examinations, such as high-res-olution scanning, while keeping the patient on the bed ofthe CT unit. Therefore, our proposed method may be use-ful in clinical practice for nodule detection in chest CTimages.
Our future research will focus on improving the detectionrate. Most undetected nodules were GGO or part-solid nod-ules that were attached to or close to the lung wall or bloodvessels. We plan to improve the detection capability for suchcases by including other detection methods.
123
Int J CARS (2013) 8:193–205 203
Fig. 14 Nodule images detected by the CAD scheme with 4.2 FPs per case and a sensitivity of 80 %. The nodules detected by the proposed methodare located in the centre of the images
Table 3 Performance comparison of proposed method with existing methods
CAD system Imagedatabase
Numberof cases
Numberof nodules
Agreementlevel
Sensitivity(%)
FPs/case Detectiontime(seconds)
Way et al. and Sahiner et al. [13,14] LIDC 48 73 1 79.0 4.9 –
Opfer and Wiemker [15] LIDC – 127 1 76.0 4.0 180–300
Golosio et al. [16] LIDC 84 148 1 45.0 4.0 –
Messey et al. [17] LIDC 84 143 1 82.5 4.0 135–165
Riccardi et al. [18] LIDC 154 387 1 49.0 4.0 –
Chamarlinghi et al. [19] LIDC 138 252 2 80.0 4.0 –
Tan et al. [20] LIDC 125 259 1 66.4 3.0 –
Proposed method LIDC 84 103 1 80.0 4.2 25–34
123
204 Int J CARS (2013) 8:193–205
Fig. 15 Nodules that remained undetected in the CAD scheme. The nodule is located in the centre of the image. a–c Nodules touching or close tothe lung wall. d–f Nodules touching or close to the blood vessels. g–i Nodules with low contrast
Recently, some hospitals have begun to apply PET/CTexaminations to cancer screening. We plan to introduce thismethod to the CAD scheme for PET/CT images.
Conflict of interest None.
References
1. Sone S, Takashima S, Li F, Yang Z, Honda T, Maruyama Y et al(1998) Mass screening for lung cancer with mobile spiral computedtomography scanner. Lancet 351:1242–1245
2. National Lung Screening Trial. Information is available at http://www.cancer.gov/clinicaltrials/noteworthy-trials/nlst
3. Yamamoto S, Matsumoto M, Tateno Y, Iinuma T, MatsumotoT (1996) filter—a new filter based on mathematical morphology toextract the isolated shadow, and its application to automatic detec-tion of lung cancer in X-ray CT. Proc 13th Int Conf Pattern Recognit2:3–7
4. Lee Y, Hara T, Fujita H, Itoh S, Ishigaki T (2001) Automateddetection of pulmonary nodules in helical CT images based on animproved template-matching technique. IEEE Trans Med Imaging20(7):595–604
5. Shah SK, McNitt-Gray MF, Rogers SR, Goldin JG, Suh RD, SayreJW et al (2005) Computer aided characterization of the solitarypulmonary nodule using volumetric and contrast enhancement fea-tures. Acad Radiol 12(10):1310–1319
6. Li W (2007) Recent progress in computer-aided diagnosis of lungnodules on thin-section CT. Comput Med Imaging Graph 31(4–5):248–257
7. Li Q, Li F, Doi K (2008) Computerized detection of lung nodules inthin-section CT images by use of selective enhancement filters andan automated rule-based classifier. Acad Radiol 15(2):165–175
8. Pu J, Zheng B, Leader JK et al (2008) An automated CT basedlung nodule detection scheme using geometric analysis of signeddistance field. Med Phys 35(8):3453–3461
9. Matsumoto S, Ohno Y, Yamagata H et al (2008) Computer-aideddetection of lung nodules on multidetector row computed tomog-
123
Int J CARS (2013) 8:193–205 205
raphy using three-dimensional analysis of nodule candidates andtheir surroundings. Radiat Med 26(9):9–562
10. Suzuki K (2009) Asupervised ‘lesion-enhancement’ filter by useof a massive-training artificial neural network (MTANN) in com-puter-aided diagnosis (CAD). Phys Med Biol 54(18):S31–45
11. Murphy K, van Ginneken B, Schilham AM et al (2009) A large-scale evaluation of automatic pulmonary nodule detection in chestCT using local image features and k-nearest-neighbour classifica-tion. Med Image Anal 13(5):757–770
12. Sousa JR, Silva AC, de Paiva AC et al (2010) Methodology forautomatic detection of lung nodules in computerized tomographyimages. Comput Methods Programs Biomed 98(1):1–14
13. Way TW, Hadjiiski LM, Sahiner B, Chan HP, Cascade PN,Kazerooni EA et al (2006) Computer-aided diagnosis of pul-monary nodules on CT scans: segmentation and classification using3D active contours. Med Phys 33:2323–2337
14. Sahiner B, Hadjiiski LM, Chan HP, Shi J, Cascade PN, KazerooniEA et al (2007) Effect of CAD on radiologists’ detection of lungnodules on thoracic CT scans: observer performance study. ProcSPIE Med Imaging 6515(65151D):1–7
15. Opfer R, Wiemker R (2007) Performance analysis for computer-aided lung nodule detection on LIDC data. Proc SPIE Med Imaging6515(65151C):1–9
16. Golosio B, Masala GL, Piccioli A, Oliva P, Carpinelli M (2009)A novel multithreshold method for nodule detection in lung CT.Med Phys 36(8):3607–3618
17. Messay T, Hardie R, Rogers S (2010) A new computationally effi-cient CAD system for pulmonary nodule detection in CT imagery.Med Image Anal 14(3):390–406
18. Riccardi A, Petkov TS, Ferri G, Masotti M, Campanin-i R (2011) Computer-aided detection of lung nodules via 3D fastradial transform, scale space representation, and Zernike MIP clas-sification. Med Phys 38(4):1962–1971
19. Camarlinghi N, Gori I, Retico A, Bellotti R et al (2011) Combi-nation of computer-aided detection algorithms for automatic lungnodule identification. Int J CARS 7(3):455–464
20. Tan M, Deklerck R, Jansen B et al (2011) A novel computer-aided lung nodule detection system for CT images. Med Phys38(10):5630–5645
21. Hardie RC, Rogers SK, Wilson T, Rogers A (2008) Performanceanalysis of a new computer aided detection system for identifyinglung nodules on chest radiographs. Med Image Anal 12(3):240–258
22. Charles RG, Edward RD (1988) Morphological methods in imageand signal processing. Prentice Hall, New Jersey
23. Kobatake H, Hashimoto S (1999) Convergence index filter forvector fields. IEEETrans Image Proc 8(8):1029–1038
24. Cristianini N, Shawe-Taylor J (2000) An introduction to supportvector machines and other kernel-based learning methods. Cam-bridge University Press, Cambridge
25. Burges CJC (1998) Tutorial on support vector machines for patternrecognition. Data Min Knowl Disc 2(2):121–167
26. LIDC lung nodule image database. National cancer imagingarchive at https://imaging.nci.nih.gov/ncia/
27. Armato SG III, Roberts RY, McNitt-Gray MF, Meyer CR, ReevesAP, McLennan G et al (2007) The lung image database consor-tium (LIDC): ensuring the integrity of expert-defined. Acad Radiol14:1455–1463
28. McNitt-Gray MF, Armato SG III, Meyer CR, Reeves AP, McLen-nan G, Pais RC et al (2007) The lung image database consortium(LIDC) data collection process for nodule detection and annotation.Acad Radiol 14:1464–1474
29. Chang CC, Lin CJ. LIBSVM: a library for support vector machines.Software available at http://www.csie.ntu.edu.tw/cjlin/libsvm/
30. Dehmeshki J, Ye X, Lin X, Valdivieso M, Amin H (2007) Auto-mated detection of lung nodules in CT images using shape-basedgeneric algorithm. Comput Med Imaging Graph 31(6):408–417
123