Embed Size (px)
Citation preview
�������� �� � ��� � � � ��� � � � ������� � ����
�������
������������������� !"#
���������� �������� ��� ����
����� ��� ��
����������� �� ����������� ������ ��!
������ � ����� �������� ������������ ���
��� ������ �� �������� � ���� ��
���� ���� ������ ��
������ "�� ������ �� ��!
#�� $��������% # ������ �$
��& !��� '����� &��������� �� "�������� ��
(����� ��������� ���)�� �� #���������
(������� (����� �� ������ (������� ���������� �%
*��������� �� ����� *�� ����� ��
����������� �� ������� *��������� (������
� +����� *�!�� *����, ������ �� ����� ������ �&
������� ���������� ���� �� -������������
��������.���� �� ������� �� /��� ��������
�� "�� �� �����0���1 2���/"�34456%
������ �� �������������� ��
���������� ���� � � ������������ �� � ��������#�� (��������� �������� ��
DR. HOMI BHABHA CENTENARY YEAR
2 I I S S U E N O . 3 0 1 I F E B R U A R Y 2 0 0 9
MOBILE-BASED TELE-ECG FOR RURAL
HEALTH CARE
Vineet Sinha, Sandeep Bharade, T.S. Ananthakrishnan, G.D. Jindal,P.K. Mukhopadhyay, R.K.Patil, G.P.Srivastava and A.D. Kamble
Electronics Division
and
Bhagyashree SarodeSenior Research Fellow. BRNS Project
and
P.N. JangaleMedical Division
and
Alaka D. DeshpandeMedicine Department, Grant Medical College & J.J. Hospital, Mumbai
Telemedicine enables a physician or specialist at one
site to deliver health care, diagnose patients, give
intra-operative assistance, provide therapy or consult
with another physician or paramedical personnel at a
remote site. Though, there is no substitute for
face-to-face consultation between a clinician and a
patient, there are medical cases that can be managed
more efficiently, by adopting telemedicine. The
concept of Telemedicine was introduced more than
30 years ago through the use of telephone, facsimile
machine and slow-scan images. In this approach, the
biomedical signal from the patient is transmitted using
landlines such as Public Switched Telephony Network
(PSTN) or the Integrated Services Digital Network
(ISDN). However, these telemedicine applications are
limited to communication between fixed locations
equipped with conventional handsets. Therefore, there
is a trend to develop wireless telemedicine built around
satellite communication1,2 . It requires expensive
equipment, dedicated links and skilled manpower.
Similarly wireless Local Area Networks (LANs) and short-
range Radio Frequency (RF) transceivers, as used in
hospitals, can’t be used for timely ambulatory
applications. To allow worldwide communication,
therefore, mobile cellular network like Global System
for Mobile (GSM) or better Third Generation network
(3G) is needed3.
Through this, a patient from rural area can be provided
with a regular routine check via a mobile phone,
without commuting to a hospital. Similarly routine
inspections and monitoring can be carried out, while
the patient is at home, traveling or at work. This also
decreases the load on resources of the hospital, which
can now cater to more number of demanding patients.
Vast area with varied topography, more than a billion
population, high population per physician (around
2000) and majority of the population (more than 70%)
living in isolated villages, support and justify the need
for Telemedicine in our country. Though Telemedicine
benefits all branches of medicine and surgery,
cardiology needs special attention due to its higher
incidence rate as well as the risk associated with heart
diseases. Many a times, delay in transporting the
patient from a village to a nearest city may prove fatal.
In view of the above and the fact that mobile phones
are becoming more and more affordable, the
Electronics Division has developed a hand-held battery-
operated Tele-ECG with mobile connectivity to an
expert. The details of this development follow.
3 I I S S U E N O . 3 0 1 I F E B R U A R Y 2 0 0 9
What is ECG
Electrocardiography (ECG) is the graphical record of
electrical potentials generated by the heart muscle.
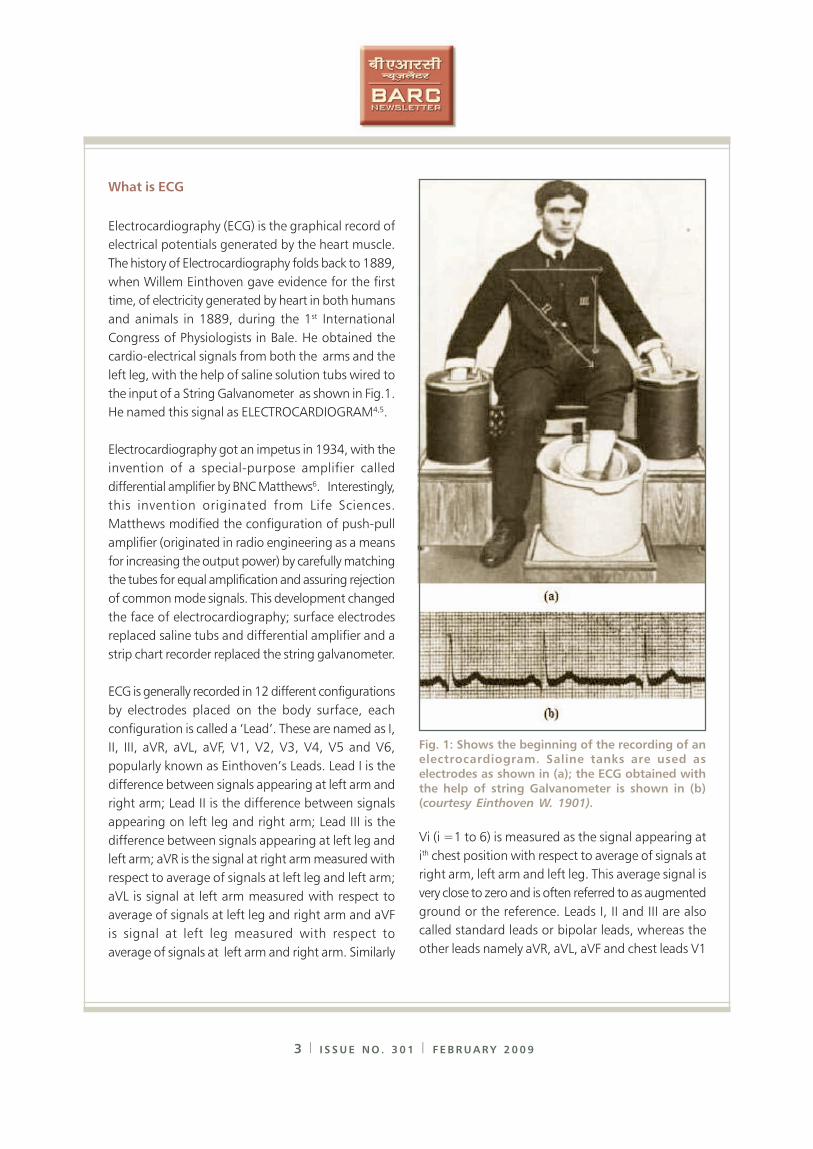
The history of Electrocardiography folds back to 1889,
when Willem Einthoven gave evidence for the first
time, of electricity generated by heart in both humans
and animals in 1889, during the 1st International
Congress of Physiologists in Bale. He obtained the
cardio-electrical signals from both the arms and the
left leg, with the help of saline solution tubs wired to
the input of a String Galvanometer as shown in Fig.1.
He named this signal as ELECTROCARDIOGRAM4,5.
Electrocardiography got an impetus in 1934, with the
invention of a special-purpose amplifier called
differential amplifier by BNC Matthews6. Interestingly,
this invention originated from Life Sciences.
Matthews modified the configuration of push-pull
amplifier (originated in radio engineering as a means
for increasing the output power) by carefully matching
the tubes for equal amplification and assuring rejection
of common mode signals. This development changed
the face of electrocardiography; surface electrodes
replaced saline tubs and differential amplifier and a
strip chart recorder replaced the string galvanometer.
ECG is generally recorded in 12 different configurations
by electrodes placed on the body surface, each
configuration is called a ‘Lead’. These are named as I,
II, III, aVR, aVL, aVF, V1, V2, V3, V4, V5 and V6,
popularly known as Einthoven’s Leads. Lead I is the
difference between signals appearing at left arm and
right arm; Lead II is the difference between signals
appearing on left leg and right arm; Lead III is the
difference between signals appearing at left leg and
left arm; aVR is the signal at right arm measured with
respect to average of signals at left leg and left arm;
aVL is signal at left arm measured with respect to
average of signals at left leg and right arm and aVF
is signal at left leg measured with respect to
average of signals at left arm and right arm. Similarly
Vi (i =1 to 6) is measured as the signal appearing at
ith chest position with respect to average of signals at
right arm, left arm and left leg. This average signal is
very close to zero and is often referred to as augmented
ground or the reference. Leads I, II and III are also
called standard leads or bipolar leads, whereas the
other leads namely aVR, aVL, aVF and chest leads V1
Fig. 1: Shows the beginning of the recording of anelectrocardiogram. Saline tanks are used as
electrodes as shown in (a); the ECG obtained with
the help of string Galvanometer is shown in (b)(courtesy Einthoven W. 1901).
DR. HOMI BHABHA CENTENARY YEAR
4 I I S S U E N O . 3 0 1 I F E B R U A R Y 2 0 0 9
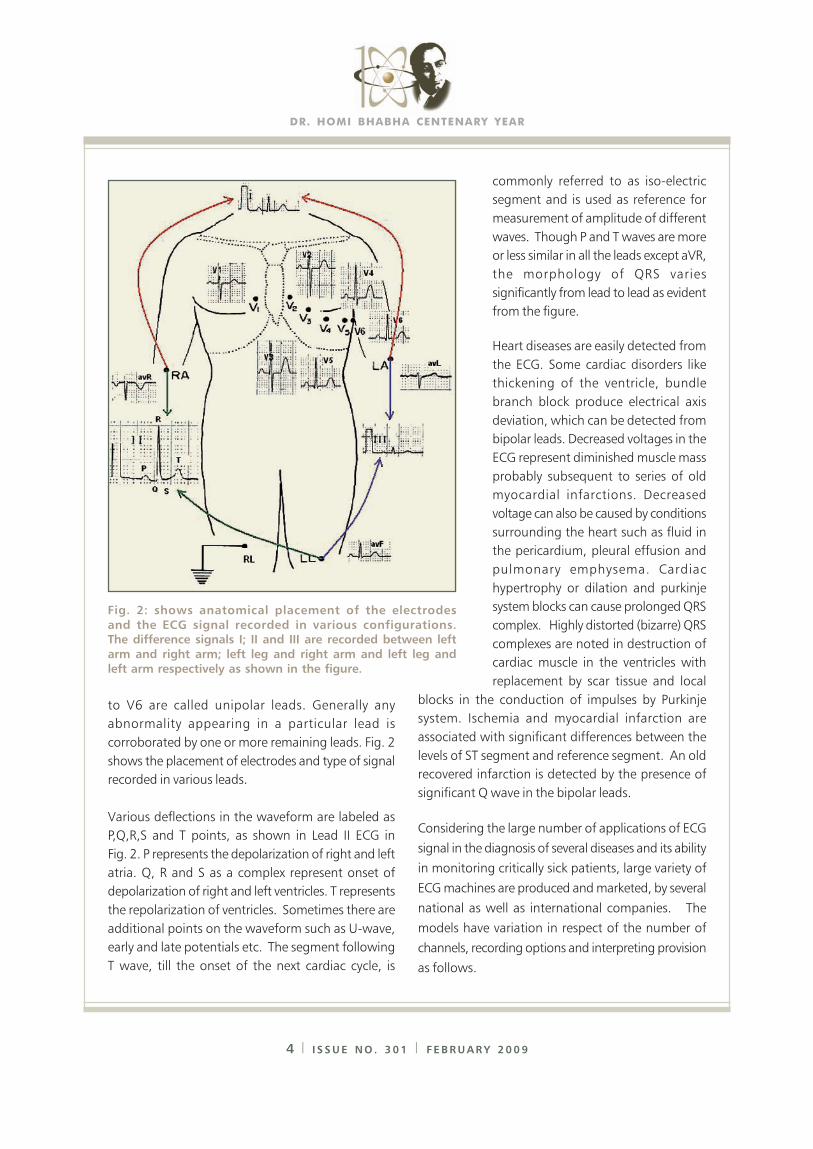
to V6 are called unipolar leads. Generally any
abnormality appearing in a particular lead is
corroborated by one or more remaining leads. Fig. 2
shows the placement of electrodes and type of signal
recorded in various leads.
Various deflections in the waveform are labeled as
P,Q,R,S and T points, as shown in Lead II ECG in
Fig. 2. P represents the depolarization of right and left
atria. Q, R and S as a complex represent onset of
depolarization of right and left ventricles. T represents
the repolarization of ventricles. Sometimes there are
additional points on the waveform such as U-wave,
early and late potentials etc. The segment following
T wave, till the onset of the next cardiac cycle, is
commonly referred to as iso-electric
segment and is used as reference for
measurement of amplitude of different
waves. Though P and T waves are more
or less similar in all the leads except aVR,
the morphology of QRS varies
significantly from lead to lead as evident
from the figure.
Heart diseases are easily detected from
the ECG. Some cardiac disorders like
thickening of the ventricle, bundle
branch block produce electrical axis
deviation, which can be detected from
bipolar leads. Decreased voltages in the
ECG represent diminished muscle mass
probably subsequent to series of old
myocardial infarctions. Decreased
voltage can also be caused by conditions
surrounding the heart such as fluid in
the pericardium, pleural effusion and
pulmonary emphysema. Cardiac
hypertrophy or dilation and purkinje
system blocks can cause prolonged QRS
complex. Highly distorted (bizarre) QRS
complexes are noted in destruction of
cardiac muscle in the ventricles with
replacement by scar tissue and local
blocks in the conduction of impulses by Purkinje
system. Ischemia and myocardial infarction are
associated with significant differences between the
levels of ST segment and reference segment. An old
recovered infarction is detected by the presence of
significant Q wave in the bipolar leads.
Considering the large number of applications of ECG
signal in the diagnosis of several diseases and its ability
in monitoring critically sick patients, large variety of
ECG machines are produced and marketed, by several
national as well as international companies. The
models have variation in respect of the number of
channels, recording options and interpreting provision
as follows.
Fig. 2: shows anatomical placement of the electrodes
and the ECG signal recorded in various configurations.The difference signals I; II and III are recorded between left
arm and right arm; left leg and right arm and left leg and
left arm respectively as shown in the figure.
5 I I S S U E N O . 3 0 1 I F E B R U A R Y 2 0 0 9
Diagnostic ECG
These are ECG machines having 1, 3 or 12 channels
of input amplifiers for recording ECG. Twelve-channel
machine records all the 12 leads simultaneously,
whereas one-channel machine records all the 12 leads
one by one and three-channel machine records
12 leads in 4 steps of three leads each. All these
models have recording devices including thermal
array recorder or an inkjet printer assisted by a
micro-controller. Interpretation of ECG is normally
available with imported machines, which is presently
not available in indigenous ones.
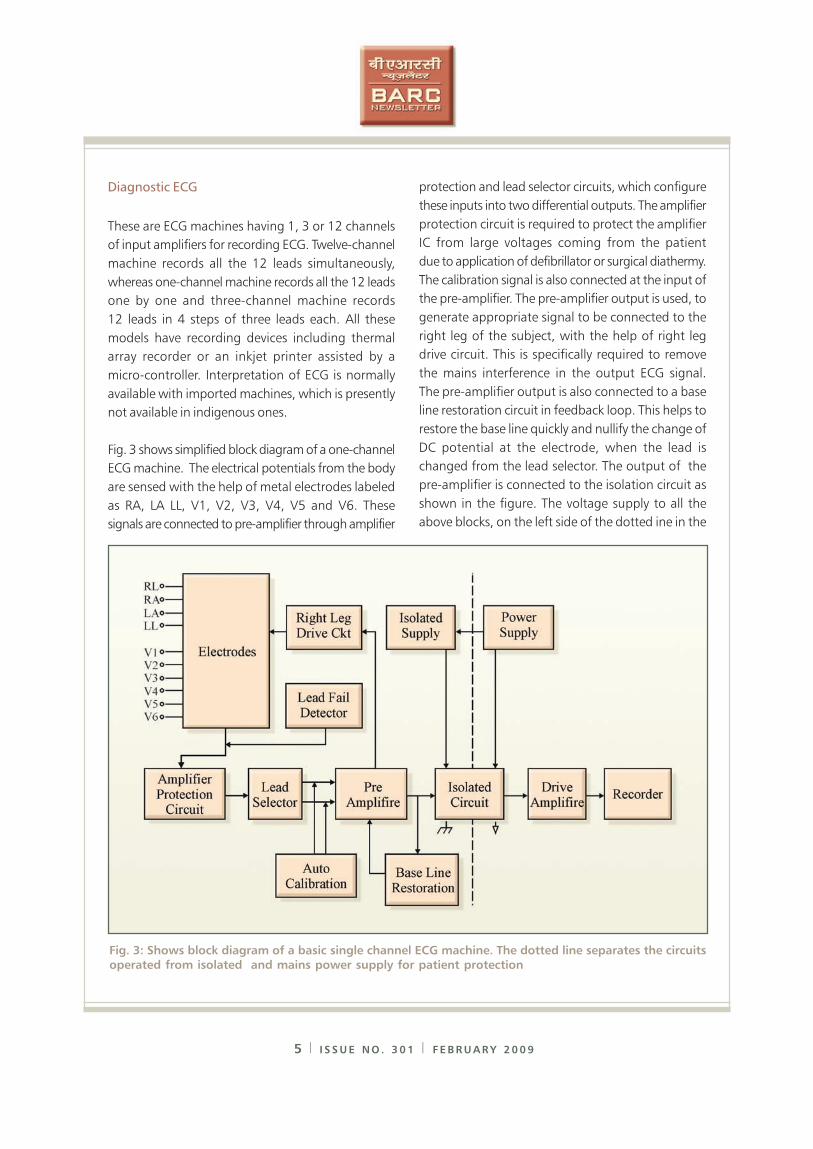
Fig. 3 shows simplified block diagram of a one-channel
ECG machine. The electrical potentials from the body
are sensed with the help of metal electrodes labeled
as RA, LA LL, V1, V2, V3, V4, V5 and V6. These
signals are connected to pre-amplifier through amplifier
protection and lead selector circuits, which configure
these inputs into two differential outputs. The amplifier
protection circuit is required to protect the amplifier
IC from large voltages coming from the patient
due to application of defibrillator or surgical diathermy.
The calibration signal is also connected at the input of
the pre-amplifier. The pre-amplifier output is used, to
generate appropriate signal to be connected to the
right leg of the subject, with the help of right leg
drive circuit. This is specifically required to remove
the mains interference in the output ECG signal.
The pre-amplifier output is also connected to a base
line restoration circuit in feedback loop. This helps to
restore the base line quickly and nullify the change of
DC potential at the electrode, when the lead is
changed from the lead selector. The output of the
pre-amplifier is connected to the isolation circuit as
shown in the figure. The voltage supply to all the
above blocks, on the left side of the dotted ine in the
Fig. 3: Shows block diagram of a basic single channel ECG machine. The dotted line separates the circuitsoperated from isolated and mains power supply for patient protection
DR. HOMI BHABHA CENTENARY YEAR
6 I I S S U E N O . 3 0 1 I F E B R U A R Y 2 0 0 9
figure, is powered from isolated power supply, which
has no electrical continuity with the earthing of mains
power supply. This insulation between the commons
of these two power supplies gives full protection to
the patient against any accidental electrical hazard and
keeps the leakage current less than 50 uA, well below
the limits provided by international safety standards
(IEC 60601-1-1:2000).
The isolation circuit is powered from isolated power
supply as well as conventional power supply to input
and output segments in this block respectively. These
segments have no electrical connection between them.
The input signal is transferred to the output section
either through high insulation transformer or optically.
The output signal from isolation circuit is amplified
further by the drive amplifier and finally connected to
a recorder. These blocks are powered by the
conventional power supply.
A micro-controller and a printer replace the recorder
in the latest version equipment, as the use of personal
computers and printers has become common. Also
the computing power within micro-controller is
made use of, in producing the machine-generated
interpretation on the electrocardiogram.
More recent systems have 3 channels of pre-amplifiers
and following circuits. In this case, the lead selector
selects leads in four steps. In Step 1, Leads I, II and III
are amplified. In Step 2, Leads aVR, aVL and aVF are
amplified. Similarly V1, V2 & V3 and V4, V5 and V6
are amplified in steps 3 & 4 respectively. A compact
print out of all the leads is made available on A4 size
paper. The latest trend in electro-cardiography, is to
record all the 12 leads simultaneously. In this case,
the Lead selector circuit is replaced by simple Wilson’s
network. Additional 11-channels of pre-amplifier and
following circuit are incorporated. The outputs of
12 drive amplifiers are fed to ADC inputs of the
micro-controller, which acquires and prints the ECG
signal from all the 12 leads simultaneously.
ECG Monitors
For monitoring applications, some of the stringent
specifications of ECG amplifiers are relaxed. For
instance, the lower 3 dB point can be relaxed to
0.5 Hz in place of 0.05 Hz and the upper 3 dB to
70 Hz in place of 200 Hz. This range is considered
adequate for monitoring the status of the patient
during surgery and in Intensive Care Units. In this
application, the ECG is continuously acquired from
the subject in one or more leads and displayed in real
time on the CRT Monitor. Alarm facility is provided
for undue deviation in the heart rate or change in the
status of arrhythmia. Also a 24-hour display is provided
to the clinician, who can see on the patient’s status,
at a glance.
Ambulatory ECG (Holter ECG)
This application has different requirements than the
diagnostic ECG or ECG monitor. In the first place, it
has to be battery-operated and ultra-miniaturized as
it is to be carried by the patient on his body for 24
hours, while he is performing his daily routine. The
unit is supposed to acquire ECG signal from five leads
(I, II, III, V2 & V5) and store them in memory. There
is also a provision to highlight part of ECG, as and
when the patient feels discomfort. At the end of 24
hours, the patient reports to his doctor, who downloads
all the data onto his workstation for further analysis.
This kind of recording has two main advantages:
1) Detection of angina pain in Ischemic Heart Disease
(IHD) patients, which is normally missed in resting
ECG and
2) Documentation of the type and severity of
arrhythmias in patients with coronary artery disease,
who have already suffered myocardial infarction in
the past7,8.
Tele-ECG
The concept of Tele-ECG was introduced more than
7 I I S S U E N O . 3 0 1 I F E B R U A R Y 2 0 0 9
30 years ago, through the use of telephone lines.
However, this application is limited to communication
between fixed locations equipped with conventional
handsets. The latest trend is to develop wireless
telemedicine built around satellite communication1,2,
which requires expensive equipment, dedicated links
and skilled manpower. Similarly wireless Local Area
Networks (LANs) and short-range Radio Frequency (RF)
transceivers, as used in hospitals, can’t be utilized
for rural applications. Therefore, for worldwide
communication and rural health care, mobile cellular
network like Global System for Mobile or better a Third
Generation network is needed3.
Mobile-Based Tele-ECG Developed at BARC
Tele-ECG system developed at the Electronics Division,
BARC, comprises a hand-held ECG (HECG) unit which
is connected via bluetooth to a mobile. The HECG
acquires and processes the ECG signal of the patient
in all the 12 leads in serial order and transmits the
same with the help of a mobile tele-processor. At
the operator’s end, we have the cellular phone (GPRS
activated) or a laptop / desktop. The acquisition unit
can be activated, operated and controlled by either of
them. All the functions, like changing of lead, viewing
of acquired signal, storing of data, transmission of
data, saving of a person’s file, etc., can be performed
from the mobile / laptop at the operator’s end. Every
patient’s data file is stored as a bit map file (bmp/png)
in the HECG unit as well as on the mobile /
laptop. There is provision for generating automatic
unconfirmed report of the patient on the mobile /
laptop. If necessary, the operator can send the ECG
file of the patient to an expert through GPRS network
and seek his opinion for further management.
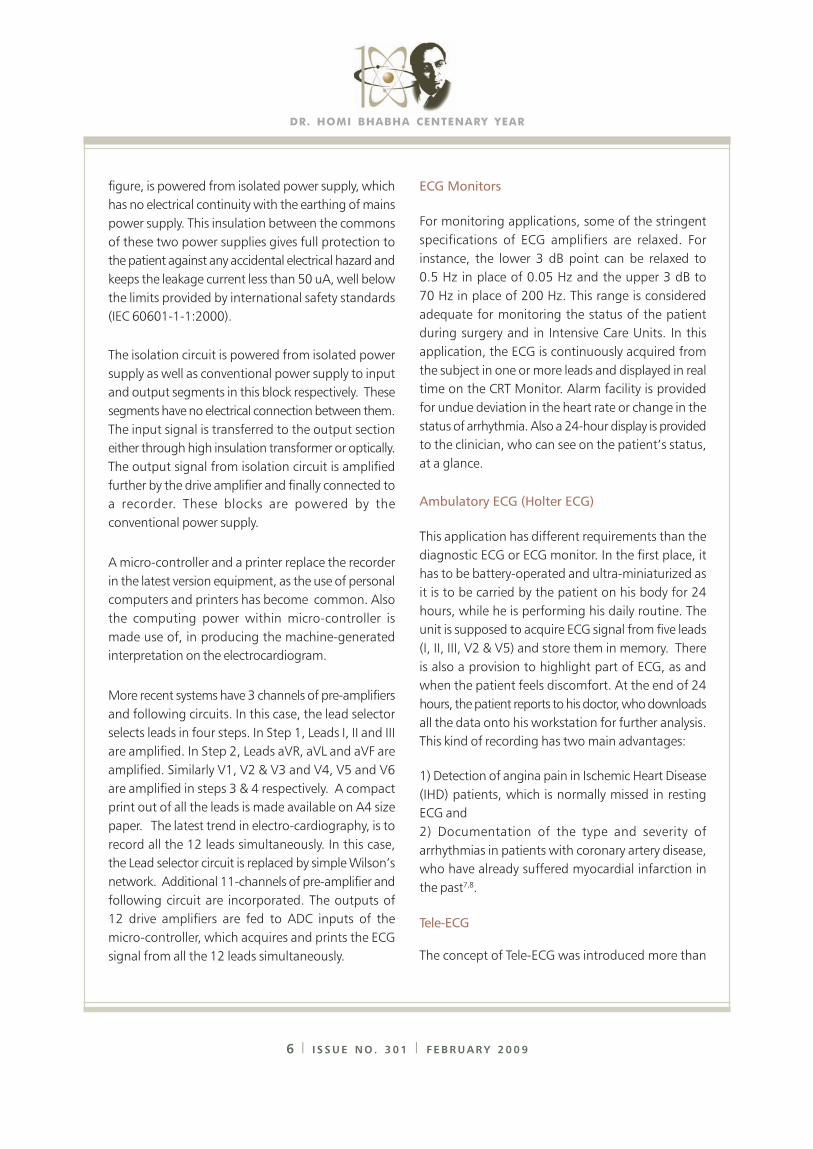
Fig. 4 shows the details of the HECG unit. The ECG
signal from the patient is sensed with the help of surface
electrodes labeled as RA, LA, LL, V1, V2, V3, V4, V5
and V6. The right leg is connected to the reference of
HECG unit. These signals are connected to input
protection circuits and buffers. This is particularly
required to protect the sensitive amplifier from the
transients coming from the ambience. The buffered
signals are passed through a Wilson’s network for
deriving differential signals for various leads, which
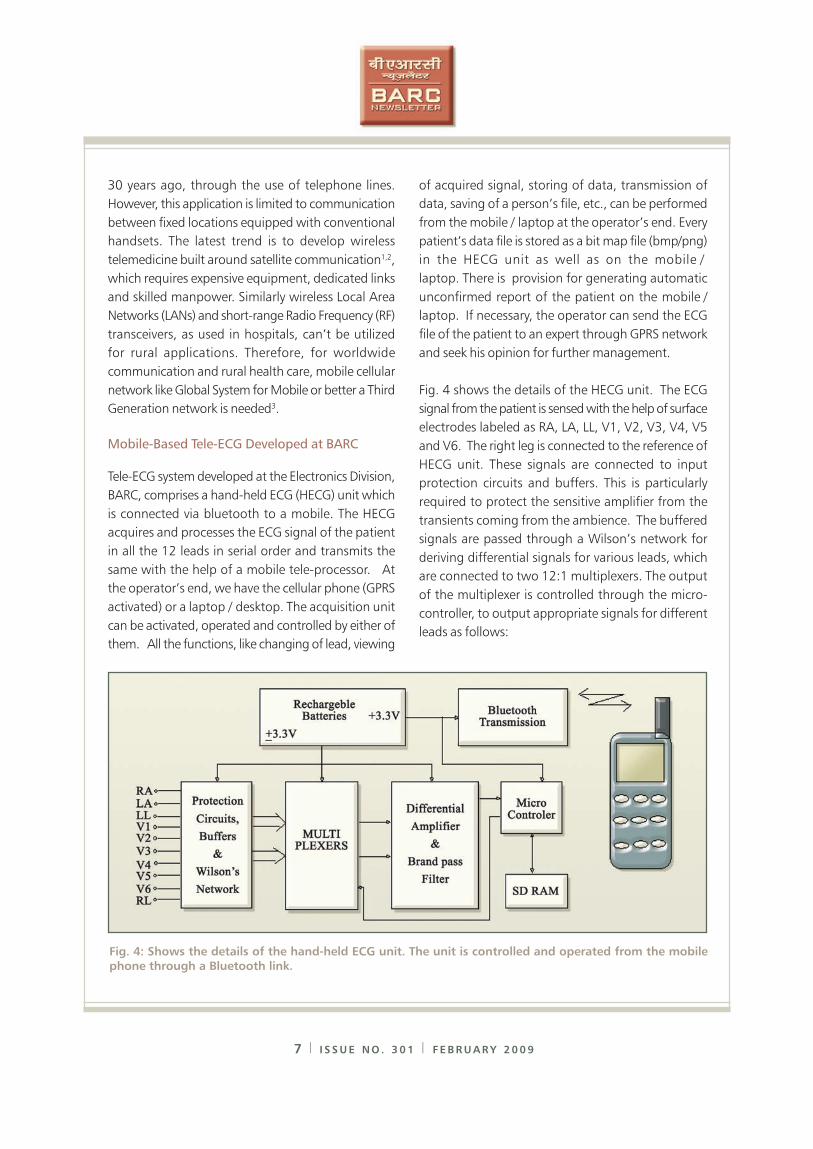
are connected to two 12:1 multiplexers. The output
of the multiplexer is controlled through the micro-
controller, to output appropriate signals for different
leads as follows:
Fig. 4: Shows the details of the hand-held ECG unit. The unit is controlled and operated from the mobilephone through a Bluetooth link.
DR. HOMI BHABHA CENTENARY YEAR
8 I I S S U E N O . 3 0 1 I F E B R U A R Y 2 0 0 9
The outputs from the multiplexers are fed as input to
a differential amplifier followed with a band-pass filter.
The gain is fixed as 1000 for first 6 leads and 500 for
the later ones. The output of the filter is connected to
ADC input of the micro-controller (based on ARM 7
micro-processor). Micro-controller also sends an output
signal to multiplexers for selecting a particular lead.
An SD-card is also interfaced to micro-controller for
providing large storage capacity to the HECG unit.
Also a blue tooth controller is interfaced to the micro-
controller for transceiving the data, commands etc.
from the cellular phone. The final specifications of the
Bio-unit are as follows and meet the safety standards
as prescribed by IEC 60601-1-1:2000.
Input Impedance : > 10 Mega Ohms
Gain : 1000/500 (selectable)
Frequency Response : 0.05 Hz to 150 Hz (3dB)
Common Mode : > 80dB
Rejection Ratio
Patient Isolation : > 10 Mega ohms
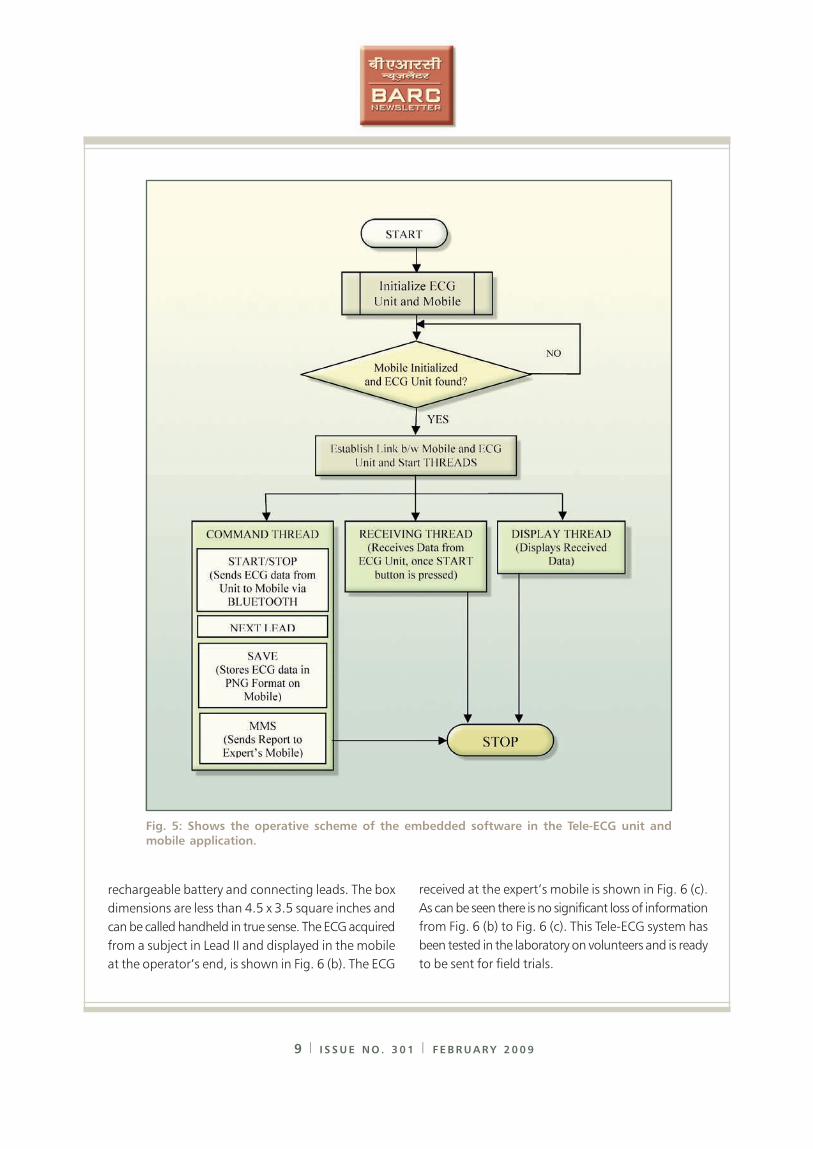
Fig. 5 shows the flowchart of the embedded software,
which is developed in ‘C’. The system, on start,
initializes the peripherals. The main application is an
indefinite loop, which is entered into, after initialization
of the timer. The timer handler is invoked every 2.5
millisecond. The handler also reads ADC data and
transfers it via the bluetooth port. Also, it looks for
commands via the bluetooth port, which may come
from a mobile phone or laptop / desktop. The
commands will correspond to change of lead
(next lead) or start / stop. This will be executed as part
of the handler. The initial data is acquired in Calibration
mode. This signal also indicates the battery charge
level and has been used to flag off battery low
condition.
The application software on the mobile, first detects
the Bluetooth device (Bio-unit) using the Service
Discovery Protocol (SDP). Once the device is detected,
the application prompts for the subject’s name and
starts receiving the CAL signal. This is developed using
Java (J2ME). The commands are issued using the key
pad ‘1’ for change of lead (lead number is increased
by one by the embedded system software and switches
back to calibration mode when lead 12 is being
acquired). The data received is saved in a buffer (1000
samples per lead, acquired for two and a half seconds).
The application software in the mobile gives the facility
for converting data into a PNG file and transfer the
same via MMS (Multimedia Message Service) to any
mobile of choice or it can also be emailed.
An application, which will lead to a diagnosis of the
ECG data received, is under development.
The application uses an algorithm developed by IIT
Roorkee for detection of QRS complex. The information
derived from the QRS complex will be used, to provide
a machine-generated unconfirmed diagnosis. At
present, this facility is being developed as a desktop /
laptop based application.
Fig. 6 (a) shows the photograph of the Bio-unit,
developed at BARC, with printed circuit board,
9 I I S S U E N O . 3 0 1 I F E B R U A R Y 2 0 0 9
Fig. 5: Shows the operative scheme of the embedded software in the Tele-ECG unit and
mobile application.
rechargeable battery and connecting leads. The box
dimensions are less than 4.5 x 3.5 square inches and
can be called handheld in true sense. The ECG acquired
from a subject in Lead II and displayed in the mobile
at the operator’s end, is shown in Fig. 6 (b). The ECG
received at the expert’s mobile is shown in Fig. 6 (c).
As can be seen there is no significant loss of information
from Fig. 6 (b) to Fig. 6 (c). This Tele-ECG system has
been tested in the laboratory on volunteers and is ready
to be sent for field trials.

DR. HOMI BHABHA CENTENARY YEAR
10 I I S S U E N O . 3 0 1 I F E B R U A R Y 2 0 0 9
Fig. 6 (a): Photograph of the Tele ECG unit developed at the Electronics Division BARC.
The controlling mobile is shown on the side.
Fig. 6 (b): Shows the mobile at the expert’s end. No significant loss is seen in the receivedECG waveform
The Tele-ECG system, reported here, is of considerable
importance for developing countries, where more than
70% of the population inhabits rural areas and has
meager access to medical facilities. This large section
can now be provided state-of-the-art medical care with
such Tele-systems.
Acknowledgements
The authors are thankful to Dr. S. Banerjee, Director,
BARC, for inspiring us to undertake this development
work and to Dr. V. Karira, Head, Medical Division,
BARC for providing useful suggestions during this
development. The authors also acknowledge the help
provided by Ms. Gouri V. Sawant during testing of the
unit and data acquisition.
References
1. Hwang S, Lee J, Kim H and Myoungho L
(2000): Development of a web based picture
archiving and communication system using
satellite data communication, J. Telemed.
Telecare, Vol. 6, pp 91-96.
2. Boyd SYN, Bulgrin JR, Woods R, Morris T, Rubal
BJ and Bauch TD (2000): Remote
echocardiography via INMASAT satellite
telephone, J. Telemed. Telecare, Vol. 6,
pp. 305-307.
3. Rasid MFA and Woodword B (2005): Bluetooth
telemedicine processor for multi-channel
biomedical signal transmission via mobile
cellular networks, IEEE Trans. on Inf. Tech. in
Biomedicine, Vol. 9, pp. 35-43.
4. Einthoven W (1901): Un nouveau
galvanometer, Arch. Neerl. Sc. Ex. Nat., Vol.
6, pp. 625-633.
5. Kuhfeld AW (1993): A heart to chart
conversation, IEEE Engg., in Med. & Biol.
Magazine, Vol. 12, pp. 109-110.
6. Matthews BHC (1934): A special purpose
amplifier, Journal of Physiology, Vol. 93,
pp. 25-27.
7. Webster JG (1978): An intelligent monitor for
ambulatory ECGs, Biomed. Sci. Instrumn., Vol.
14, pp. 55-60.
8. Muller W C (1978): Arrhythmia detection
software for an ambulatory ECG Monitor,
Biomed. Sci. Instrumn., Vol. 14, pp. 81-85.
11 I I S S U E N O . 3 0 1 I F E B R U A R Y 2 0 0 9
DEVELOPMENT OF ELECTROLYTE CATHODE
GLOW DISCHARGE ATOMIC EMISSION
SPECTROSCOPY FOR THE ANALYSIS OF
ELEMENTS AT TRACE AND
ULTRA TRACE LEVELS
CCCM, Hyderabad
An analytical technique - Electrolyte cathode glow
discharge Atomic emission spectrometer – has been
developed, for the sensitive determination of elemental
constitutents, especially metals in a sample solution
with good sensitivities of a few parts per billion and
standardized for routine measurements. Studies are
going on to understand the mechanistic processes
involved in the emission, matrix effects on the analyte
emission etc., to further improve the sensitivities of
determinations. The technique particularly lends itself
to analysis of radioactive samples when the cell is
placed inside a glove box and the emitted radiation is
transmitted to the spectrometer using an optical cable.
Efforts are being made to suitably modify this
technique.
ELectrolyte CAthode Discharge (ELCAD)
The Electrolyte cathode glow discharge or Glow
Discharge Electrolysis (GDE).is a unique
electrochemical technique, in which the sample
solution is made to act as the cathode. Discharge is
initiated between the metal anode and the liquid
cathode by applying high voltage. ELectrolyte-as-
CAthode glow Discharge Atomic Emission
Spectrometry ELCAD-AES has become a viable
analytical technique for on-line monitoring of the
concentration of metals in solution, though no
commercial instrument is available to date.
Gubkin (1) first demonstrated the possibility of the
electrolysis of aqueous solution of metallic salts, using
glow discharge in 1887 and since then, efforts have
been made to develop (2) and mechanistic (3,4) studies
of (GDE). The development and fundamental
characteristics of ELCAD were investigated by a
number of workers (5,6). Cserfalvi and Mezei (5)
developed the ELCAD-AES for continuous analysis of
water. Acidified milk has also been analysed using
this technique (7).
In our current study we have obtained a detection
limit of about 15 ppb for mercury by liquid aspiration
which is very superior to the detection limit of about
500 – 750 ppb normally obtainable by Inductively
Coupled plasma Atomic Emission Spectrometry
(ICP-AES). Similar detection limits are obtained for other
elements too. Thus ELCAD-AES appears to be a
promising low-cost technique for multi-element
analysis.
Instrumental
A DC power supply capable of 0-1000V, 120 mA
was used in constant voltage mode. A peristaltic pump
was used to pump the sample solution at a constant
flow rate ranging from 0.25 to 3.0 ml / min. The
discharge spectrum was recorded using a spectrometer
which consisted of a 1.0 m Czerny – Turner grating
(3600 lines / mm) monochromator. The control of the
monochromator and data acquisition were performed
with the MSDOS-based software of Jobin-Yvon
(JY-38, Jobin-Yvon, France).
DR. HOMI BHABHA CENTENARY YEAR
12 I I S S U E N O . 3 0 1 I F E B R U A R Y 2 0 0 9
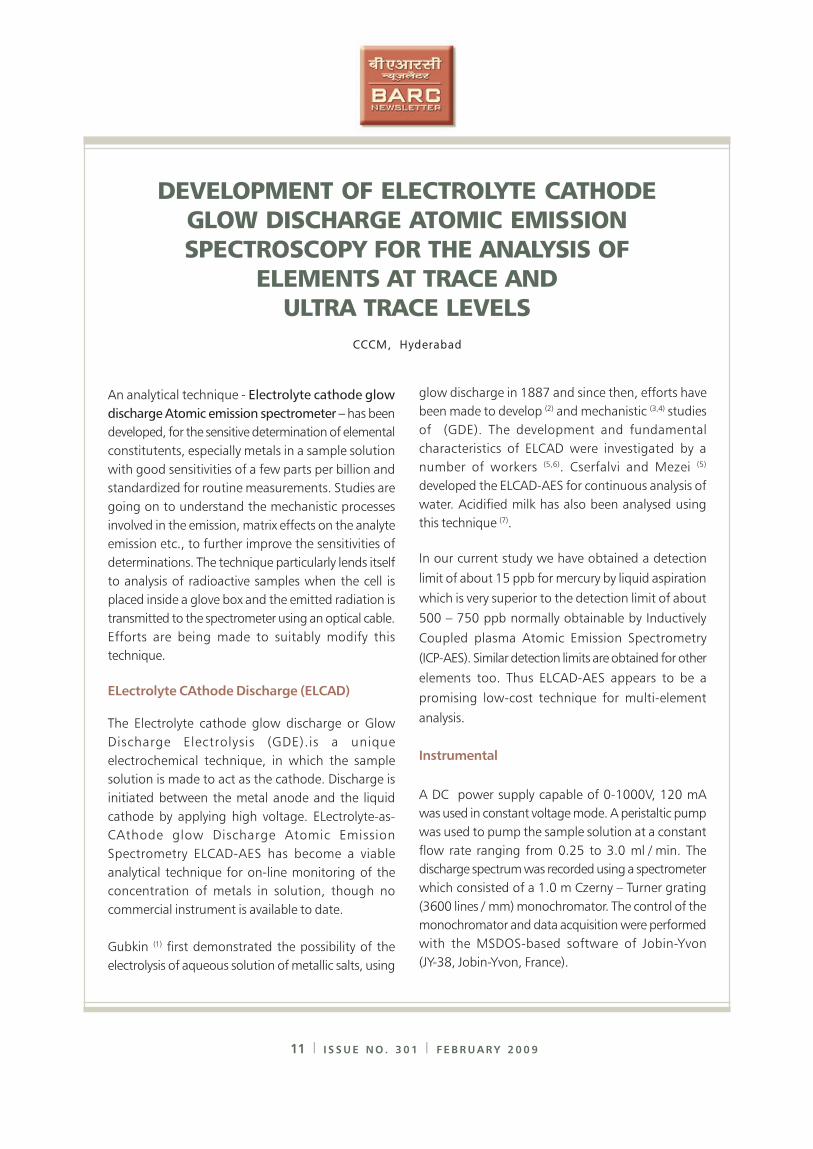
ELCAD cell
The ELCAD cell consists of two parts, a
tungsten pin anode maintained at a potential
of between 700 – 1000 V, while the sample
solution pumped through a glass capillary
acts as the cathode, which was maintained
at ground potential. The body of the cell
anode and the housing for the glass capillary
were constructed with polytetraflouro
ethylene (PTFE).
A micrometer- based arrangement has been
fabricated, to precisely move the pin anode
and vary the inter-electrode distance. A
platform was fabricated using 3 micrometers
to mount the discharge cell so that emission
from the discharge plasma could be moved
in x, y and z directions and positioned
accurately onto the slit of the emission
spectrometer. A metal ring is placed about 2
mm below the top of the glass capillary and is
connected to the ground of the power supply. The
solution overflows continuously forming a contact
between the sample solution and the metal ring. The
over-flowing sample is collected in the PTFE
reservoir from which it is continuously
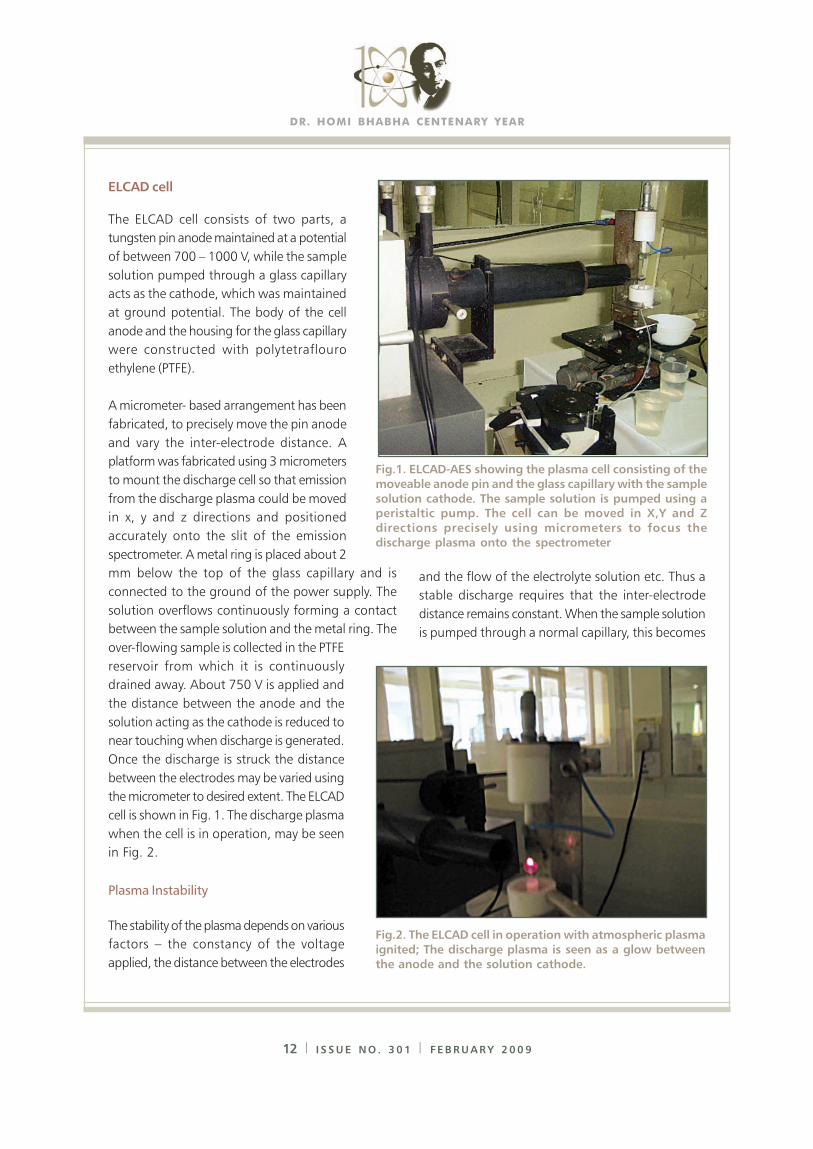
drained away. About 750 V is applied and
the distance between the anode and the
solution acting as the cathode is reduced to
near touching when discharge is generated.
Once the discharge is struck the distance
between the electrodes may be varied using
the micrometer to desired extent. The ELCAD
cell is shown in Fig. 1. The discharge plasma
when the cell is in operation, may be seen
in Fig. 2.
Plasma Instability
The stability of the plasma depends on various
factors – the constancy of the voltage
applied, the distance between the electrodes
and the flow of the electrolyte solution etc. Thus a
stable discharge requires that the inter-electrode
distance remains constant. When the sample solution
is pumped through a normal capillary, this becomes
Fig.2. The ELCAD cell in operation with atmospheric plasma
ignited; The discharge plasma is seen as a glow between
the anode and the solution cathode.
Fig.1. ELCAD-AES showing the plasma cell consisting of the
moveable anode pin and the glass capillary with the sample
solution cathode. The sample solution is pumped using aperistaltic pump. The cell can be moved in X,Y and Z
directions precisely using micrometers to focus the
discharge plasma onto the spectrometer
13 I I S S U E N O . 3 0 1 I F E B R U A R Y 2 0 0 9
possible only when the flow rate is maintained at a
fairly high value, 5 to 10 ml / min as is usually seen.
However, higher flow rates lead to not only more
sample consumption but increased hydrogen
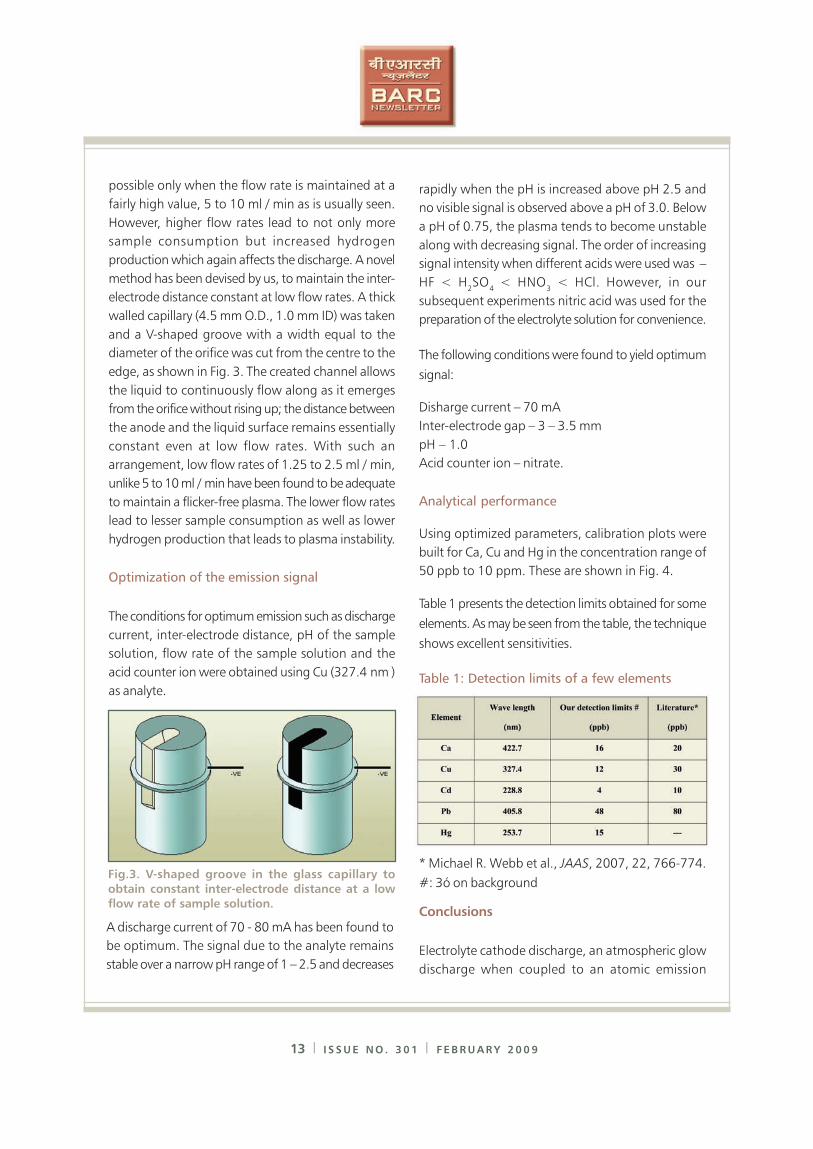
production which again affects the discharge. A novel
method has been devised by us, to maintain the inter-
electrode distance constant at low flow rates. A thick
walled capillary (4.5 mm O.D., 1.0 mm ID) was taken
and a V-shaped groove with a width equal to the
diameter of the orifice was cut from the centre to the
edge, as shown in Fig. 3. The created channel allows
the liquid to continuously flow along as it emerges
from the orifice without rising up; the distance between
the anode and the liquid surface remains essentially
constant even at low flow rates. With such an
arrangement, low flow rates of 1.25 to 2.5 ml / min,
unlike 5 to 10 ml / min have been found to be adequate
to maintain a flicker-free plasma. The lower flow rates
lead to lesser sample consumption as well as lower
hydrogen production that leads to plasma instability.
Optimization of the emission signal
The conditions for optimum emission such as discharge
current, inter-electrode distance, pH of the sample
solution, flow rate of the sample solution and the
acid counter ion were obtained using Cu (327.4 nm )
as analyte.
rapidly when the pH is increased above pH 2.5 and
no visible signal is observed above a pH of 3.0. Below
a pH of 0.75, the plasma tends to become unstable
along with decreasing signal. The order of increasing
signal intensity when different acids were used was –
HF < H2SO
4 < HNO
3 < HCl. However, in our
subsequent experiments nitric acid was used for the
preparation of the electrolyte solution for convenience.
The following conditions were found to yield optimum
signal:
Disharge current – 70 mA
Inter-electrode gap – 3 – 3.5 mm
pH – 1.0
Acid counter ion – nitrate.
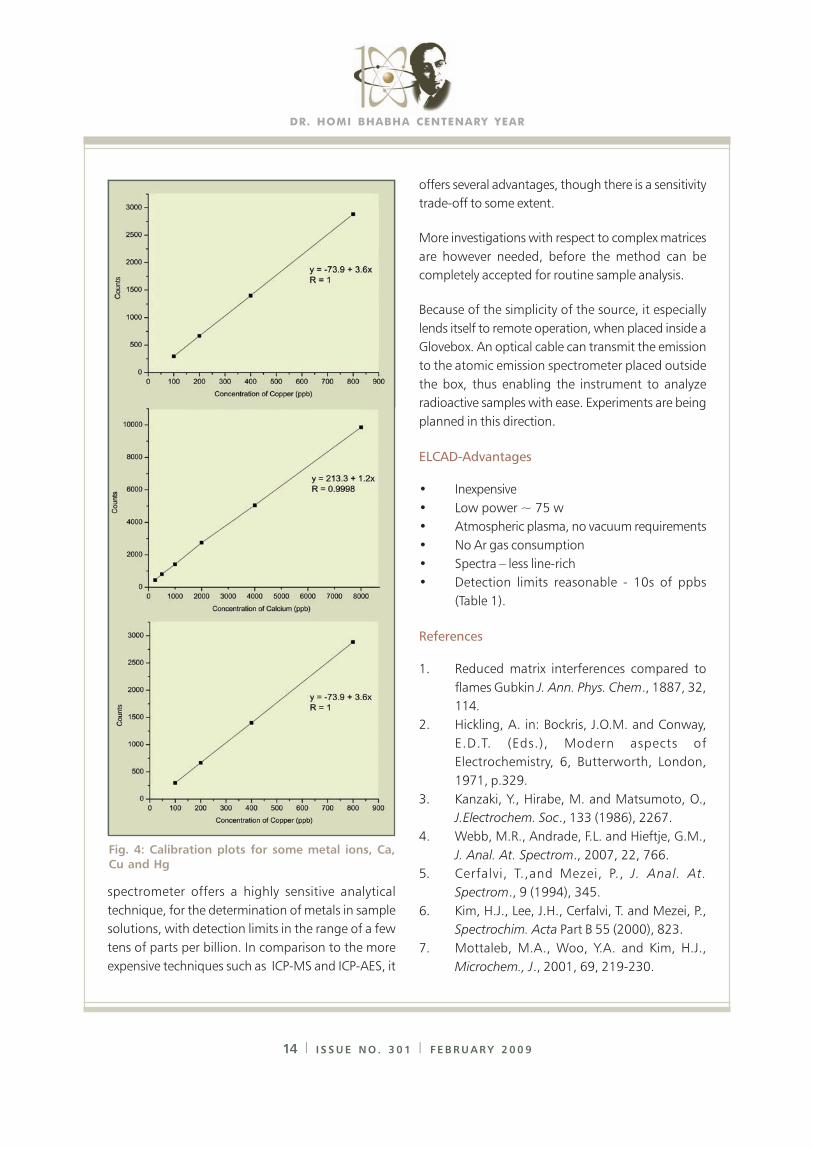
Analytical performance
Using optimized parameters, calibration plots were
built for Ca, Cu and Hg in the concentration range of
50 ppb to 10 ppm. These are shown in Fig. 4.
Table 1 presents the detection limits obtained for some
elements. As may be seen from the table, the technique
shows excellent sensitivities.
Table 1: Detection limits of a few elements
Fig.3. V-shaped groove in the glass capillary to
obtain constant inter-electrode distance at a low
flow rate of sample solution.
A discharge current of 70 - 80 mA has been found to
be optimum. The signal due to the analyte remains
stable over a narrow pH range of 1 – 2.5 and decreases
* Michael R. Webb et al., JAAS, 2007, 22, 766-774.
#: 3ó on background
Conclusions
Electrolyte cathode discharge, an atmospheric glow
discharge when coupled to an atomic emission
DR. HOMI BHABHA CENTENARY YEAR
14 I I S S U E N O . 3 0 1 I F E B R U A R Y 2 0 0 9
spectrometer offers a highly sensitive analytical
technique, for the determination of metals in sample
solutions, with detection limits in the range of a few
tens of parts per billion. In comparison to the more
expensive techniques such as ICP-MS and ICP-AES, it
offers several advantages, though there is a sensitivity
trade-off to some extent.
More investigations with respect to complex matrices
are however needed, before the method can be
completely accepted for routine sample analysis.
Because of the simplicity of the source, it especially
lends itself to remote operation, when placed inside a
Glovebox. An optical cable can transmit the emission
to the atomic emission spectrometer placed outside
the box, thus enabling the instrument to analyze
radioactive samples with ease. Experiments are being
planned in this direction.
ELCAD-Advantages
• Inexpensive
• Low power ~ 75 w
• Atmospheric plasma, no vacuum requirements
• No Ar gas consumption
• Spectra – less line-rich
• Detection limits reasonable - 10s of ppbs
(Table 1).
References
1. Reduced matrix interferences compared to
flames Gubkin J. Ann. Phys. Chem., 1887, 32,
114.
2. Hickling, A. in: Bockris, J.O.M. and Conway,
E.D.T. (Eds.), Modern aspects of
Electrochemistry, 6, Butterworth, London,
1971, p.329.
3. Kanzaki, Y., Hirabe, M. and Matsumoto, O.,
J.Electrochem. Soc., 133 (1986), 2267.
4. Webb, M.R., Andrade, F.L. and Hieftje, G.M.,
J. Anal. At. Spectrom., 2007, 22, 766.
5. Cerfalvi, T.,and Mezei, P., J. Anal. At.
Spectrom., 9 (1994), 345.
6. Kim, H.J., Lee, J.H., Cerfalvi, T. and Mezei, P.,
Spectrochim. Acta Part B 55 (2000), 823.
7. Mottaleb, M.A., Woo, Y.A. and Kim, H.J.,
Microchem., J., 2001, 69, 219-230.
Fig. 4: Calibration plots for some metal ions, Ca,
Cu and Hg

15 I I S S U E N O . 3 0 1 I F E B R U A R Y 2 0 0 9
REMOTE INAUGURATION OF
NEW BARC FACILITIES: A REPORT
Computer Division, BARC
Six new facilities of BARC were inaugurated remotely
by the Honorable Prime Minister of India on Founder’s
Day. The central electronic control of the inauguration
function was located in the Central Complex
Auditorium of BARC, where Chairman AEC, Director
BARC and many other dignitaries and scientists of
BARC were present.
The Director BARC initiated the inauguration event
Central Control Station at BARC
from the CC Auditorium. The live audio-video web
cast of this event was done at all other places in BARC
and at outstation DAE and BARC units, at about 15
locations in the country.
The Computer Division BARC, designed and deployed
the complex multimedia communication
system,consisting of multi-site Video Conferencing
(VC) system, live video web casting system and
DR. HOMI BHABHA CENTENARY YEAR
16 I I S S U E N O . 3 0 1 I F E B R U A R Y 2 0 0 9
FORTHCOMING SYMPOSIUM
National Symposium on Frontiers in
Photobiology (FIP-2009)
BARC in association with the Indian Photobiology
Society, has organized a national symposium
from Aug. 24-26, 2009, at the Multipurpose
Hall, BARC Training School at Anushaktinagar,
Mumbai. The scientific programme of the
symposium includes oral as well as poster
presentations and also invited talks, Papers on
the folloing topics are invited from authors:
Photosynthesis; light and dark reaction
Molecular Biology of Photosynthesis
Bioluminescence, Photomorphogenesis, Visual
processing, Circadian rhythms
Photophysics and Photochemistry related to
Biomolecules, Biosenors and lonophores
Artificial Photosynthesis and Bio-inspired
Chemistry
Environmental Photobiology and photorepair
Photodynamic Effects and Photodynamic therapy
in Cancer
Biophotonics and Single Molecule Spectroscopy
Nanoparticles and Quantum Dots in Photobiology
An abstract of about 300 words along with the
registration form is to be sent to the convener.
Important Dates
Registration &
submission of abstracts - 31st May, 2009
Intimation of acceptance - 30th June, 2009
For further details one may contact
Dr. Jayashree Sainis
Convener, FIP-2009
Molecular Biology Division
Bhabha Atomic Research Centre
Trombay, Mumbai 400 085
Tel:022-25595079
Fax: 022-25519163
Email: [email protected]
associated audio-video peripherals. Schematic of the
multisite set up is shown in the diagram.
The function began with a welcome to the Honorable
Prime Minister followed by distribution of the Life Time
Achievement Awards by the Honorable Prime Minister.
The inauguration of remote plants was carried out by
unveiling of an electronic (soft) curtain. A-V system
at PMO consisted of a VC unit and a Tablet PC with
touch screen control, which was used by PM to unveil
the electronic curtain. The VC unit enabled the audio-
video interactions among dignitaries present in CC,
BARC, Mumbai, remote site staff and PM from New
Delhi. The six remote sites were Hot Cell Facility and
Critical Facility at BARC, Mumbai, New Training School,
Anushaktinagar, Mumbai, Electron Beam Centre, Navi
Mumbai, NDDP, Kalpakkam and Barge Mounted
Desalination Plant, Kalpakkam.
Each site inauguration involved, a brief introduction
of a site by Director BARC, an Audio-Video clip play
back from CC and the transfer of control to remote
site for live interaction. The remote site facility officials
then welcomed the PM and requested him to
inaugurate the facility. This was followed by unveiling
of the electronic curtain by the Honorable PM, by
clicking on a button on the Tablet PC. Suitable different
versions of audio-video signals were provided at New
Delhi, Mumbai and other remote sites, for effective
natural interactions.
This set-up enabled us to successfully carry out the
remote inauguration from PMO, New Delhi and to
web cast live, the entire event throughout the country.
17 I I S S U E N O . 3 0 1 I F E B R U A R Y 2 0 0 9
MoU WITH JADAVPUR UNIVERSITY ON
INITIATION OF STRESS CORROSION CRACKING OF
AUSTENITIC STAINLESS STEELS
IN REACTOR SIMULATED CONDITIONS
Under the XIth plan (Corrosion aspects of nuclear
structural materials, XI – N- R & D – 01.09), an MoU
with Jadavpur University was signed. This MoU entitled
“Scientific Collaboration to jointly build a recirculation
loop test facility and study the crack initiation and its
precursor phenomenon leading to stress corrosion
cracking in austenitic stainless steels in simulated
nuclear reactor environment” was signed between the
Materials Science Division, BARC and Jadavpur
University, Kolkata. Dr. A. K. Suri, Director, Materials
Group, BARC and Mr. Sanjay Gopal Sarkar, Registrar,
Jadavpur University signed the MoU on October 15,
2008 at BARC. The scope of the MoU
includes (a) setting up and running, continuously
a recirculation loop
facility with an
autoclave suitable for
working in the following
environment: working
temp. 280 - 320ºC,
working pressure: 8 – 12
MPa, environment –
high purity water
(Sp. conductivity –
0.055 μS /cm as inlet
water) with controlled
levels of dissolved oxygen,
(b) stress corrosion
crack initiation studies
in reactor simulated
environment using Crevice
Bent Beam (CBB)
specimens from selected
austenitic stainless steel
grades from among SS304L / SS304LN / SS316L /
SS316LN, with varying degree of cold / warm working
or sensitization and establishing the preferred location
of crack initiation, crack morphology and
characterization of the stress corrosion cracking
susceptibility by measuring the crack depth and
(c) establishing precursor events to stress corrosion
crack initiation using SEM and AFM examination of
tested specimen. The MoU duration is of four years
and a student from Jadavpur University will work on
this topic, for doctoral degree. The SCC growth rate
measurements are already being done at the test
facility, by the Materials Science Division, BARC.
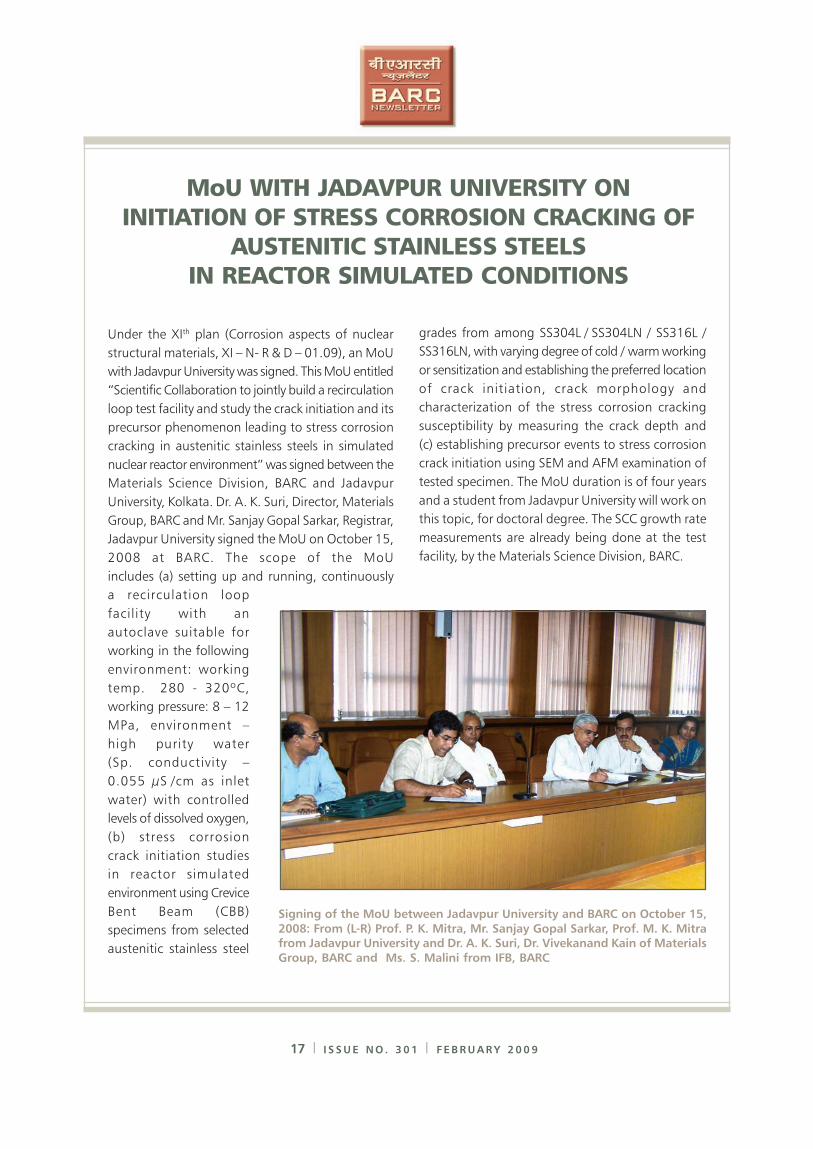
Signing of the MoU between Jadavpur University and BARC on October 15,
2008: From (L-R) Prof. P. K. Mitra, Mr. Sanjay Gopal Sarkar, Prof. M. K. Mitrafrom Jadavpur University and Dr. A. K. Suri, Dr. Vivekanand Kain of Materials
Group, BARC and Ms. S. Malini from IFB, BARC
DR. HOMI BHABHA CENTENARY YEAR
18 I I S S U E N O . 3 0 1 I F E B R U A R Y 2 0 0 9
PREVENTION OF EVENT PROGRAMMES AND
DEVELOPMENT OF RADIATION PROTECTION
STANDARDS AT NUCLEAR POWER
PLANTS: REPORT OF A THEME MEETING
The Health Physics Division, BARC Mumbai, the Indian
Association for Radiation Protection, Karnataka
Chapter, Kaiga and Nuclear Training Centre, Kaiga,
Generating Station 1-4, Kaiga had organized a theme
meeting to prevent event programmes and to discuss
the developments, in the recommendations of the
International Commission on Radiological Protection,
during December 4-5, 2008 at the Kaiga Generating
Station.
The theme meeting was organized to share the
operating experience and prevent event programmes
in the field of radiation protection in nuclear power
stations. The strategies adopted for control of
occupational exposures were presented by operation
and maintenance persons. This included deliberations
on the applications of Just-
In-Time Briefs, Assessment of
events (Low Level Events,
Significant Events etc.),
Operating experience sharing
and measures adopted to
prevent the recurrence of
events in Indian nuclear
power plants.
Mr. Sunil Gadgil, Senior
Mechanical Engineer, Kaiga
Generating Station 1&2
shared his operating
experience related to prevent
event programmes at KGS for
enhancement of industrial
safety through sharing of
operating experiences.
Mr. D.Subba Rao, Senior Engineer from Kaiga
Generating Station 3 & 4 discussed the safety aspects
and innovations in the radiation protection programmes
of Annular Gas Monitoring System leak arresting and
O-10 Channel repair.
Mr. Sudhir Kumar, Senior Engineer from fuel handling
section of KGS 1 & 2 explained the strategies adopted,
to control exposures in fuel handling section. He
discussed the prevent event programmes in fuel
handling section which helped in achieving ALARA
exposures for the fuel handling persons. Mr. S.K. Pal,
Senior Health Physicist and Mr. Alok Kumar, Senior
Engineer from mechanical maintenance section,
explained various measures adopted for minimizing
collective doses at TAPS 3 & 4. Mr. V.K. Sehgal, ALARA
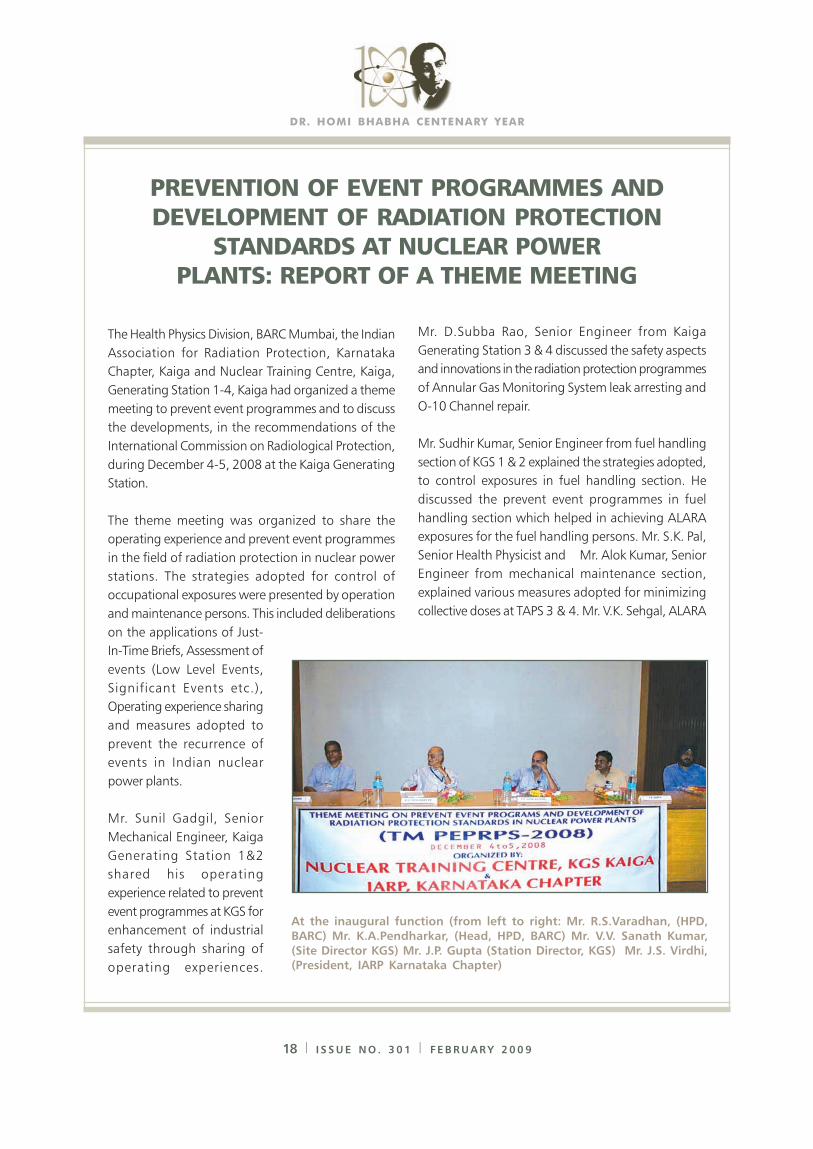
At the inaugural function (from left to right: Mr. R.S.Varadhan, (HPD,
BARC) Mr. K.A.Pendharkar, (Head, HPD, BARC) Mr. V.V. Sanath Kumar,
(Site Director KGS) Mr. J.P. Gupta (Station Director, KGS) Mr. J.S. Virdhi,(President, IARP Karnataka Chapter)
19 I I S S U E N O . 3 0 1 I F E B R U A R Y 2 0 0 9
coordinator, from Narora Atomic Power Station
explained Collective dose reduction strategies during
En Mass Coolant Channel Replacement campaigns at
NAPS.
Usefulness of the Information System on Occupational
Exposures (ISOE) to assess the trends of occupational
exposures in various power stations around the world
and the techniques adopted to control and bring down
the collective doses in the power stations, were
discussed during the theme meeting. This systematic
information sharing through regular workshops and
symposia was useful to all the power stations in the
world to adopt innovations in the field, to improve
techniques to carry out maintenance activities in the
shortest time with lowest collective doses among 400
nuclear power stations. The information sharing system
was useful to the Indian nuclear power plants too, by
way of implementing strategies for effective control
of collective doses per reactor.
The developments in the field of radiation protection
through the recommendations of the International
Commission on Radiological Protection, covering
various aspects of radiation protection, were discussed
by radiation protection professionals from different
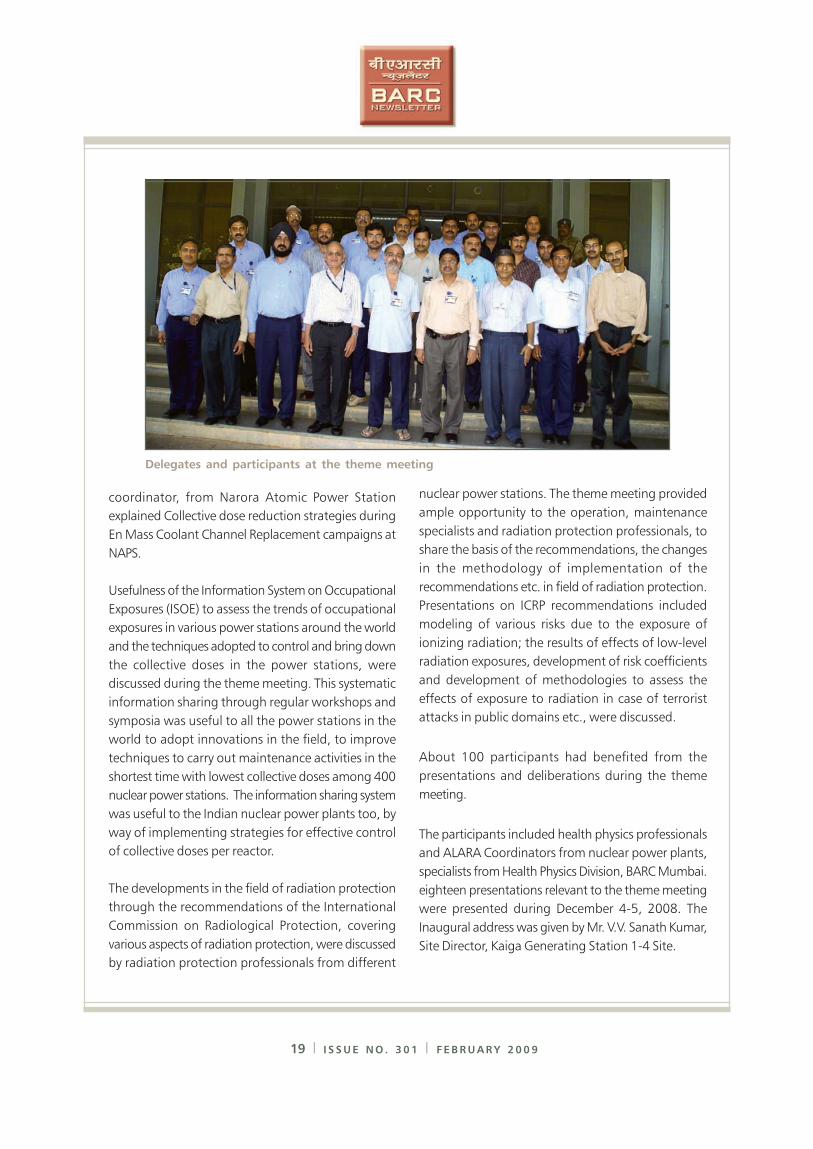
Delegates and participants at the theme meeting
nuclear power stations. The theme meeting provided
ample opportunity to the operation, maintenance
specialists and radiation protection professionals, to
share the basis of the recommendations, the changes
in the methodology of implementation of the
recommendations etc. in field of radiation protection.
Presentations on ICRP recommendations included
modeling of various risks due to the exposure of
ionizing radiation; the results of effects of low-level
radiation exposures, development of risk coefficients
and development of methodologies to assess the
effects of exposure to radiation in case of terrorist
attacks in public domains etc., were discussed.
About 100 participants had benefited from the
presentations and deliberations during the theme
meeting.
The participants included health physics professionals
and ALARA Coordinators from nuclear power plants,
specialists from Health Physics Division, BARC Mumbai.
eighteen presentations relevant to the theme meeting
were presented during December 4-5, 2008. The
Inaugural address was given by Mr. V.V. Sanath Kumar,
Site Director, Kaiga Generating Station 1-4 Site.
DR. HOMI BHABHA CENTENARY YEAR
20 I I S S U E N O . 3 0 1 I F E B R U A R Y 2 0 0 9
THEMATIC DISCUSSION MEET ON
“COMPOSITIONAL CHARACTERIZATION OF
MATERIALS BY X-RAY EMISSION AND ION
BEAM TECHNIQUES” (CCMXIB-2008):
REPORT AND RECOMMENDATIONS
The Thematic Discussion Meet on “Compositional
Characterization of Materials by X-ray Emission and
Ion Beam Techniques”(CCMXIB-2008) was held on
26th September, 2008, at C- Block Auditorium,
Modular Labs, BARC and was organized by Dr. T.
Mukherjee, Dr. A. K. Tyagi and Dr. (Ms). D. Joseph.
Introductory remarks were given by Director, BARC.
He appreciated the efforts for this kind of meeting
and recommended that similar meetings be held more
frequently. In particular, he mentioned the use of
Synchrotron machine for EXAFS studies. He
recommended that techniques based on X-ray
absorption also need to be included in future discussion
meets. He also emphasized on indigenous development
of instruments.
There were two sessions -a pre lunch session chaired
by Dr. J. P. Mittal, former Director, Chemistry Group
and a post lunch session chaired by Dr. S. K. Sarkar,
Head, Radiation and Photo Chemistry Division. The
first speaker was Dr. D. K. Avasthi from IUAC, Delhi
who delivered a talk on ERDA for materials
characterization. Dr.V. S. Raju, from CCCM, Hyderabad
spoke on Ion beams vs x-rays as probes. He discussed
the merits of ion beams and x-ray techniques, with a
little insight into their theory and problem solving in a
wide range of research applications. Dr. Lokesh Tribedi,
TIFR, briefed on Heavy ion-atom collision in Solids.
He explained that characteristic x-ray emission in
collisions of highly charged ions with matter can be
used, to probe the various atomic collision mechanisms
citing examples of results obtained from the BARC-
TIFR Pelletron based experiments in TIFR. Dr. B. S. Tomar
from RChD, BARC and Dr. Daisy Joseph, from NPD,
BARC summarized the FOTIA-based experiments such
as RBS and PIXE respectively. Dr. Tomar gave a brief
description of the RBS, ERDA and NRA techniques,
followed by results carried out at Folded Tandem Ion
accelerator (FOTIA) and 14UD Pelletron accelerator at
TIFR. Dr. Daisy showed some exciting applications of
PIXE from FOTIA in Materials Sciences, Geology and
Forensic Sciences. Dr. K. Bhanumurthy from MSD,
BARC gave an idea of Micro-chemical analysis by
EPMA, Dr. K. V. G. Kutty, IGCAR spoke on WDXRF for
SS characterization. Dr. N. L. Misra, from FCD, BARC
spoke on TRXRF on Nuclear Materials and
Dr. V. Natarajan, RChD, briefed on the use of EDXRF
technique for the determination of uranium in mixed
oxides of Th and U. Dr. S. N. Jha, RRCAT, Indore
explained Synchrotron-induced XRF and informed that
a dedicated XRF beam line was being setup at
Indus-2 SRS facility, by the Indus Synchrotron Utilization
Division, RRCAT and invited collaborative proposals
for future projects, in order to use Synchrotron more
efficiently. The Director, Chemistry Group gave
Concluding remarks. A decision was taken to have
similar meets on a larger scale in the future, on all
aspects of X-rays such as emission, absorption and
diffraction.
��������� �� � � � � � � � � � � � � � � � � � � � � � � �
��������������� ��������������� ������������������������ ���
�������������� ������������������������������������� �������������� ��� ������ ����� ��!��� �����"#�� ���$������ ����� ������� %��"&�����'$����(����(�����#���)�������%�)*��*��� ��"%��#�$� ���$��������� ���+� ����, � � � � - - . � � / � � � � � � � 0 1 � � , � � � � � � � � � " � �2�1���,,3)� ��/��� 456� ����� ,���������7���� ������8%�����01��,���������"��9�2�1�����,3�9�����(�:44;6�%��������%%����������8����������8���"�������3�<����������=����>
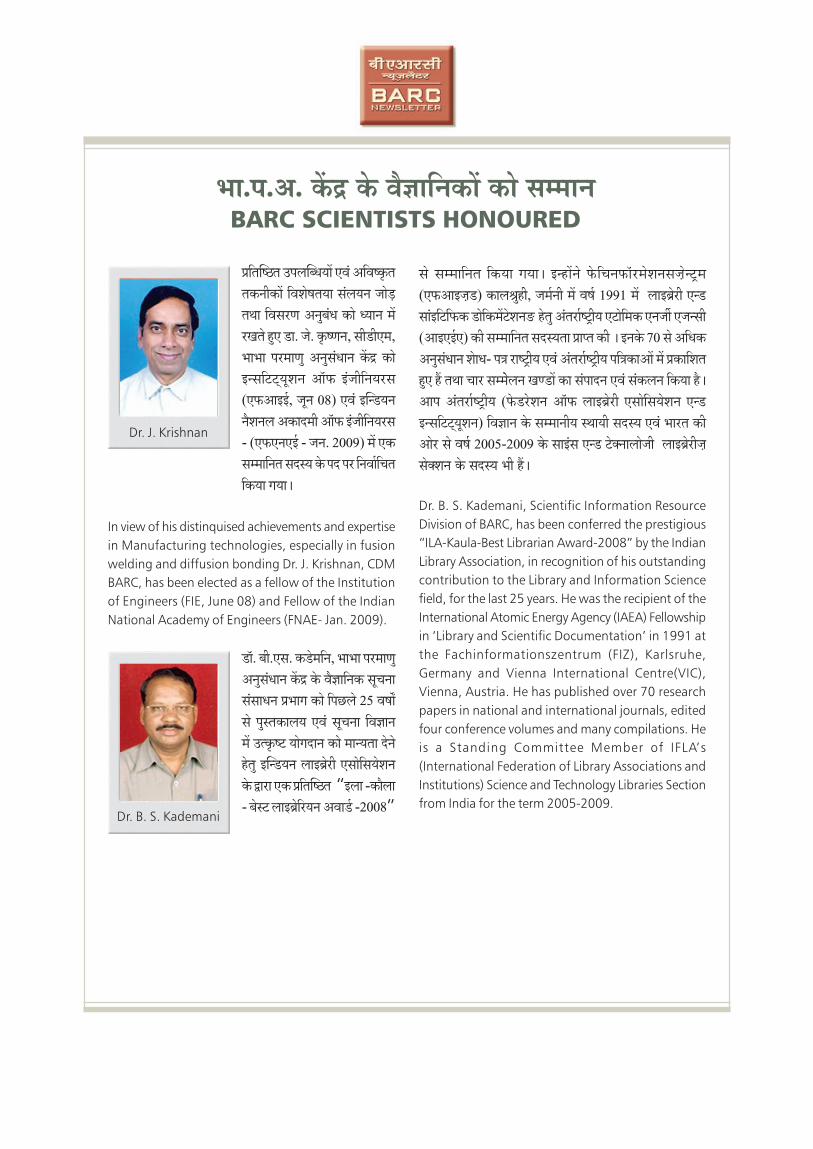
������������� ���������� ���������������� ����������
����������������������������������������������
��� ������ � �������� ����������� ���������!��
"#$!����������������� ��������������������������
�%���������&'�%�������()*��� �'������������ ���
+�������#�� �����%���������&'+#%,������-((.*�
��0(����(���(�����%����)�*��*�����"%��#�$���$������������+�������7?����������/<������������������*��=����������@A ���:B������C���� ��$������ ���� ����� ��/<����� ���?����%���������-�����=�8���������%���������8����'���$� ,�������� ��,��D�"�� �������������������E�"������������������/, ���9���7 ��9�����-� ��,��D��"����������3�9:4450
������� �������
� � � � � � % % � � � � � � � � � � � � � � � = � � � � > � , � ' � � � � � � 1 � � � < � � � 1 � � 0 " % � � � � � � � � � � F � � - G % �2�1���,��F�6� ��� �H�$'�)� ��%�3���� %��� ����3� I;;I� %��� � ��,��D�"�� �������,�-�1����������%��-�����J��'���$�����"�3�-G�����-���%���������K��������2��,�,3�6�������%%����������8�������������������>�,������L4��������������$���������������9���M��"��-G�������������"�3�-G�������M��������%��������������'$��'N���!���<��"���%%��� ����&�#��������������8������������� �����������'7>� � � � � � � � � " � 3 � - G � � � � 2 1 � � � " � � � � � � � � 0 1 � � � � , � � D � " � � � � � � � � � � � � � � � � � � � � � ,����--.��/����6� ���?����� ���� ��%%�������� �!������ ��8���� ����� *��"��� ������"� ���� ����3� :44B9:44;� ���� ���,���� ���� -�O��� ������� � ��,��D�"���F���O����� ���� ��8���� *��� 'N>
����"��1�� � �������1������������������$������
���������"#$!����������������� ���������������
/�2#, ����,"����2���������#��� ,-(()0���������� ���
2�������#���������������������������������� ���
�����������������2��������� ����������1������
��� �������������-3��������4������������������������
�������������#�����%������#������&�#%#*�'��������
���52��������� �1��������������������6����7..7���
���� '������������8������� &'�9*�� ���������
:������� �� � ;������ ������������� !�����&;�!*�
;�������#��������4�������������� �����<(���������
�������������������� ��������������=��������� ���
��������������������� ������������������4�
��� �� 1��� ���� !�������� ������� � �'2#6�
&�������������'� ��������2�������#������������
�����������*�1��������� �>��������2���������1�����
����� ��������������-((3,-((.�����"��1�� � �����