Embed Size (px)
Citation preview
Filter Hose User Guide v 1.1.0
P a g e 1 | 13
Contents
FEATURE ···························································································································································································· 2
NOTES ······························································································································································································· 2
COMPATIBILITY AND KNOWN ISSUES ················································································································································ 4
NAVIGATION ····················································································································································································· 5
UNDERSTAND FILTER HOSE USER INTERFACE ··················································································································································· 5 THE FIVE-STEP CONTROL PANEL ···································································································································································· 6 MOUSE NAVIGATION ON EACH GRAPH ··························································································································································· 9 EXPORTING FIR VALUES ··············································································································································································· 9
IMPORT MEASUREMENT FILE ·························································································································································· 10
EASERA .ETX FILES ··················································································································································································· 10 ARTA .TXT FILES ······················································································································································································ 11 SMAART 7 .TXT FILE ·················································································································································································· 13
EXPORT TO MINIDSP ······································································································································································· 15
P a g e 2 | 13
Feature Easy and quick to create FIR filter based on measurement.
Create non-symmetric FIR, linear-phase FIR and minimum-phase FIR.
Multi-Zone Time Windows (MZTW) to clean input impulse response (IR).
Compatible with EASERA, ARTA and Smaart measurement data.
Five filter target presets: flat magnitude only (linear or minimum phase), flat phase only, flat magnitude & flat
phase, and flat magnitude & minimum phase.
Export filter coefficient in *.csv and MiniDSP text file.
Numerical data format converter.
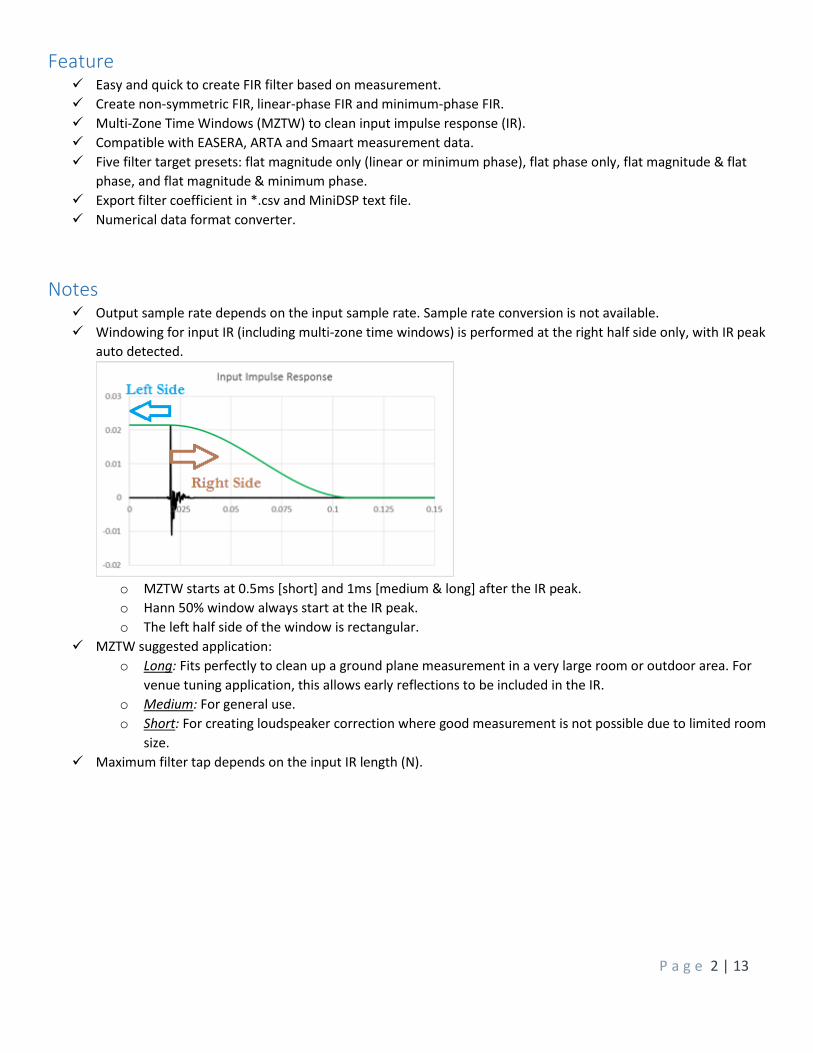
Notes Output sample rate depends on the input sample rate. Sample rate conversion is not available.
Windowing for input IR (including multi-zone time windows) is performed at the right half side only, with IR peak
auto detected.
o MZTW starts at 0.5ms [short] and 1ms [medium & long] after the IR peak.
o Hann 50% window always start at the IR peak.
o The left half side of the window is rectangular.
MZTW suggested application:
o Long: Fits perfectly to clean up a ground plane measurement in a very large room or outdoor area. For
venue tuning application, this allows early reflections to be included in the IR.
o Medium: For general use.
o Short: For creating loudspeaker correction where good measurement is not possible due to limited room
size.
Maximum filter tap depends on the input IR length (N).
P a g e 3 | 13
Notes cont’d
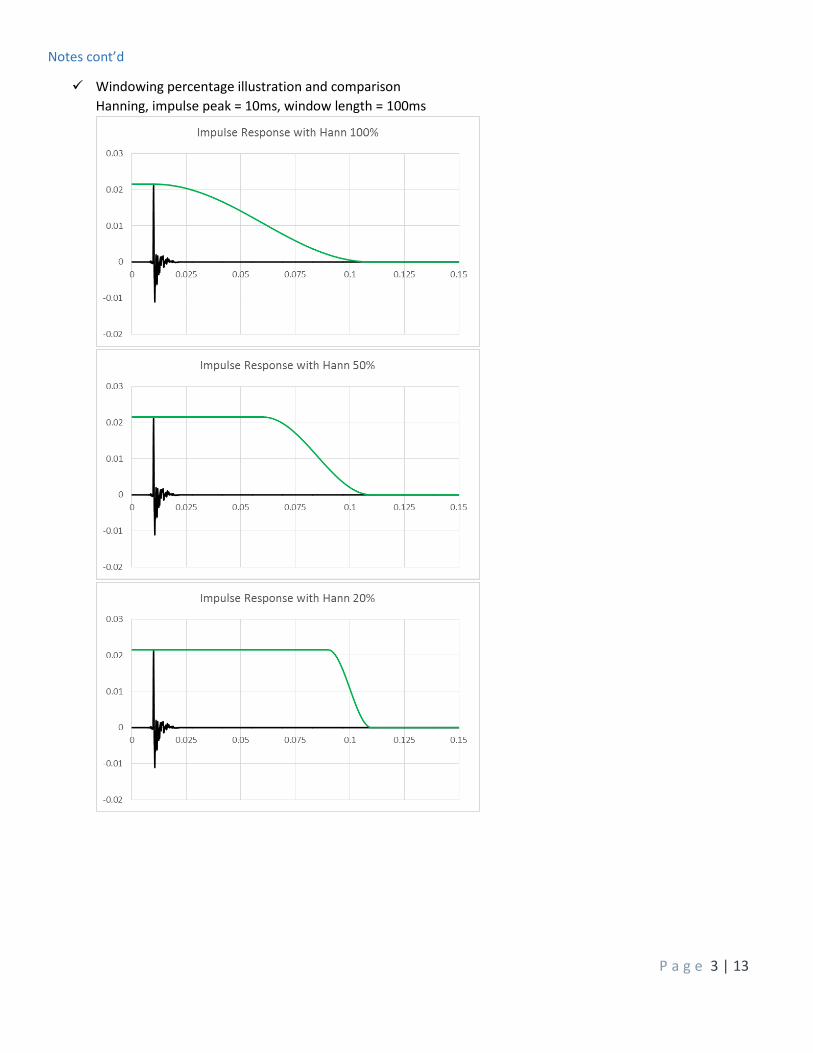
Windowing percentage illustration and comparison
Hanning, impulse peak = 10ms, window length = 100ms

P a g e 4 | 13
Compatibility and Known Issues
Windows XP, vista, 7 and 8
Region and Language of the Operating System: English (USA)
Requires Framework 4.0 Client
Recommended display resolution: 1280 x 768 or higher
P a g e 5 | 13
Navigation
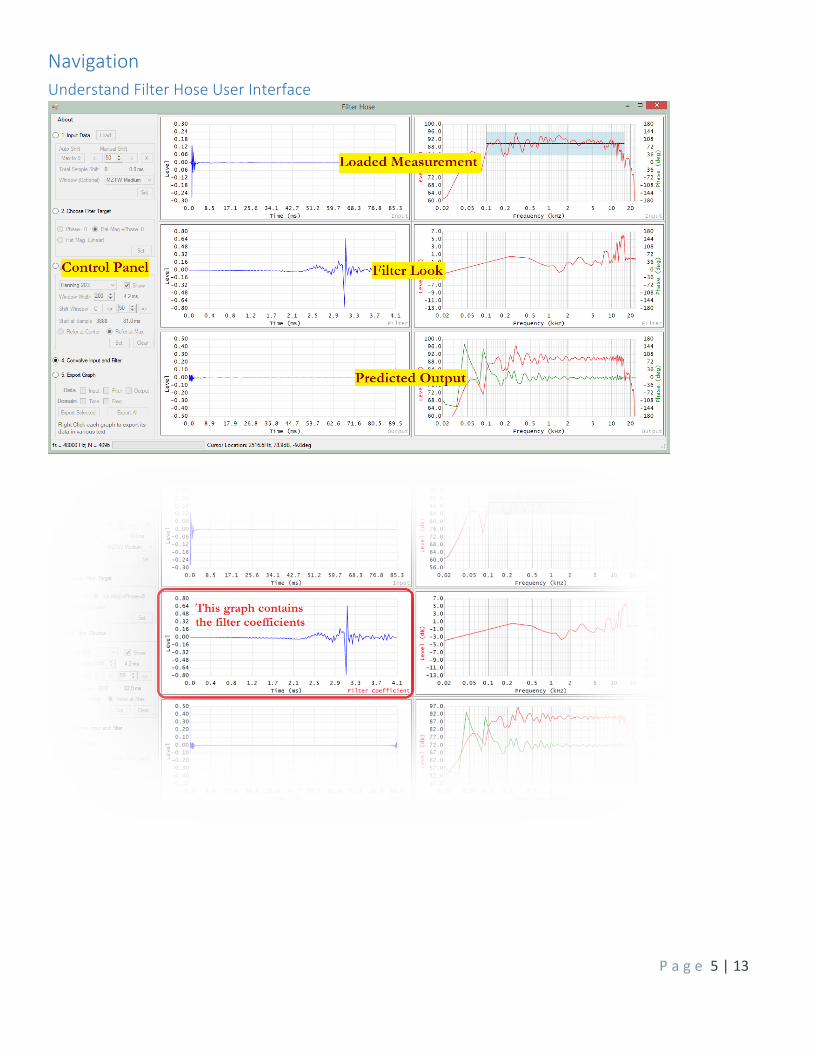
Understand Filter Hose User Interface
P a g e 6 | 13
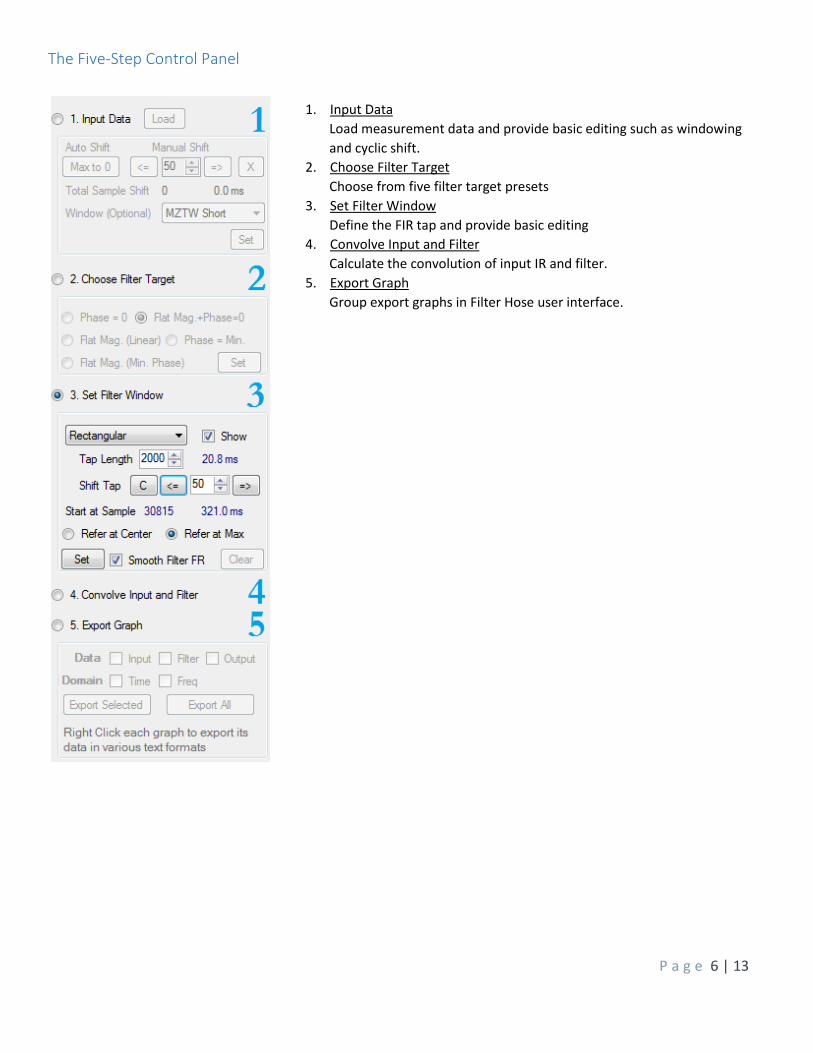
The Five-Step Control Panel
1. Input Data
Load measurement data and provide basic editing such as windowing
and cyclic shift.
2. Choose Filter Target
Choose from five filter target presets
3. Set Filter Window
Define the FIR tap and provide basic editing
4. Convolve Input and Filter
Calculate the convolution of input IR and filter.
5. Export Graph
Group export graphs in Filter Hose user interface.
P a g e 7 | 13
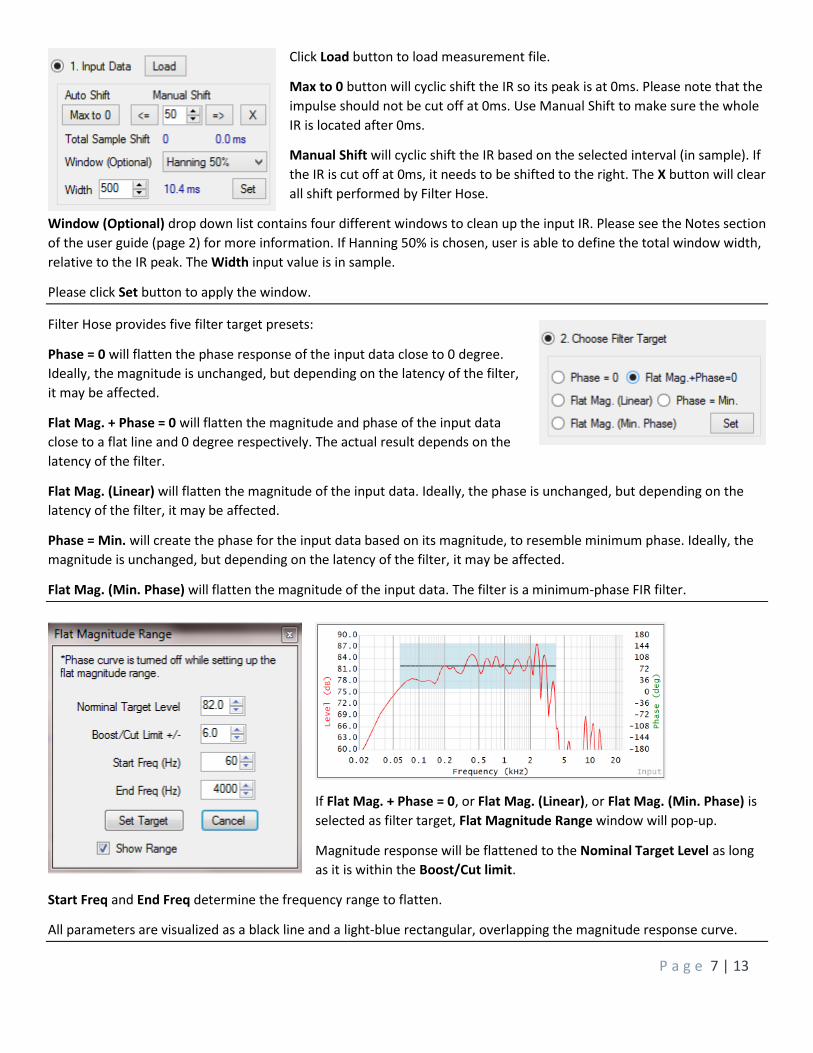
Click Load button to load measurement file.
Max to 0 button will cyclic shift the IR so its peak is at 0ms. Please note that the
impulse should not be cut off at 0ms. Use Manual Shift to make sure the whole
IR is located after 0ms.
Manual Shift will cyclic shift the IR based on the selected interval (in sample). If
the IR is cut off at 0ms, it needs to be shifted to the right. The X button will clear
all shift performed by Filter Hose.
Window (Optional) drop down list contains four different windows to clean up the input IR. Please see the Notes section
of the user guide (page 2) for more information. If Hanning 50% is chosen, user is able to define the total window width,
relative to the IR peak. The Width input value is in sample.
Please click Set button to apply the window.
Filter Hose provides five filter target presets:
Phase = 0 will flatten the phase response of the input data close to 0 degree.
Ideally, the magnitude is unchanged, but depending on the latency of the filter,
it may be affected.
Flat Mag. + Phase = 0 will flatten the magnitude and phase of the input data
close to a flat line and 0 degree respectively. The actual result depends on the
latency of the filter.
Flat Mag. (Linear) will flatten the magnitude of the input data. Ideally, the phase is unchanged, but depending on the
latency of the filter, it may be affected.
Phase = Min. will create the phase for the input data based on its magnitude, to resemble minimum phase. Ideally, the
magnitude is unchanged, but depending on the latency of the filter, it may be affected.
Flat Mag. (Min. Phase) will flatten the magnitude of the input data. The filter is a minimum-phase FIR filter.
If Flat Mag. + Phase = 0, or Flat Mag. (Linear), or Flat Mag. (Min. Phase) is
selected as filter target, Flat Magnitude Range window will pop-up.
Magnitude response will be flattened to the Nominal Target Level as long
as it is within the Boost/Cut limit.
Start Freq and End Freq determine the frequency range to flatten.
All parameters are visualized as a black line and a light-blue rectangular, overlapping the magnitude response curve.
P a g e 8 | 13
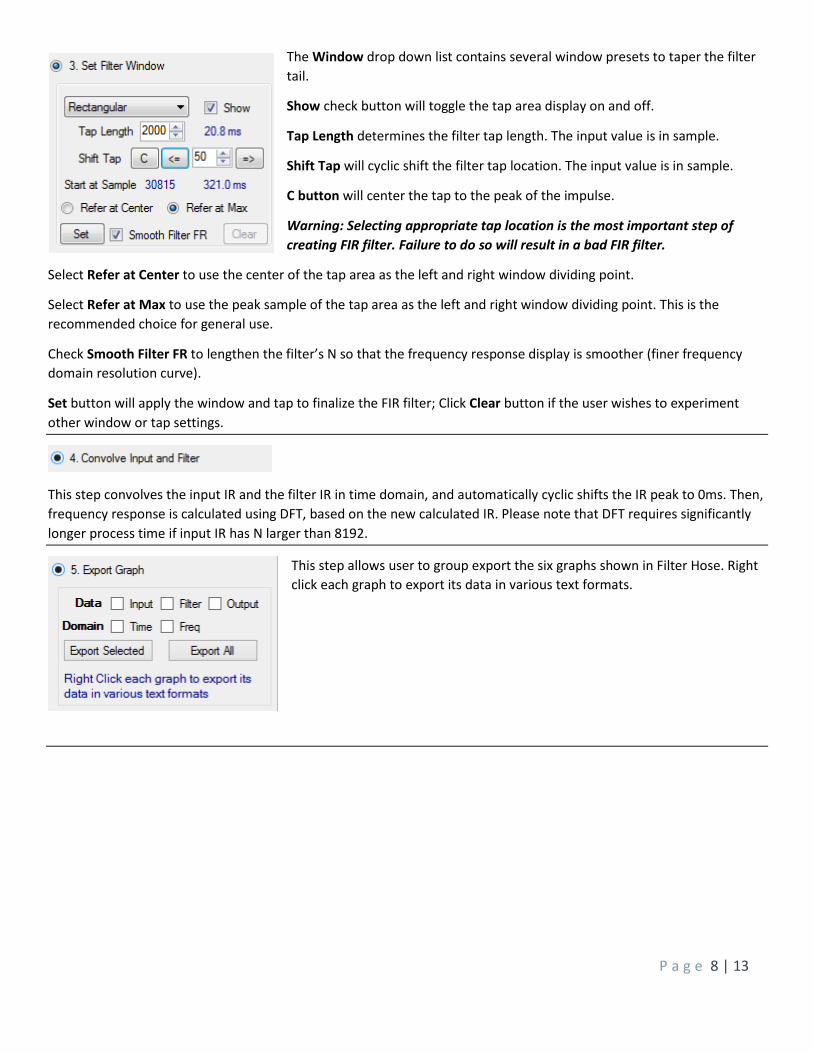
The Window drop down list contains several window presets to taper the filter
tail.
Show check button will toggle the tap area display on and off.
Tap Length determines the filter tap length. The input value is in sample.
Shift Tap will cyclic shift the filter tap location. The input value is in sample.
C button will center the tap to the peak of the impulse.
Warning: Selecting appropriate tap location is the most important step of
creating FIR filter. Failure to do so will result in a bad FIR filter.
Select Refer at Center to use the center of the tap area as the left and right window dividing point.
Select Refer at Max to use the peak sample of the tap area as the left and right window dividing point. This is the
recommended choice for general use.
Check Smooth Filter FR to lengthen the filter’s N so that the frequency response display is smoother (finer frequency
domain resolution curve).
Set button will apply the window and tap to finalize the FIR filter; Click Clear button if the user wishes to experiment
other window or tap settings.
This step convolves the input IR and the filter IR in time domain, and automatically cyclic shifts the IR peak to 0ms. Then,
frequency response is calculated using DFT, based on the new calculated IR. Please note that DFT requires significantly
longer process time if input IR has N larger than 8192.
This step allows user to group export the six graphs shown in Filter Hose. Right
click each graph to export its data in various text formats.
P a g e 9 | 13
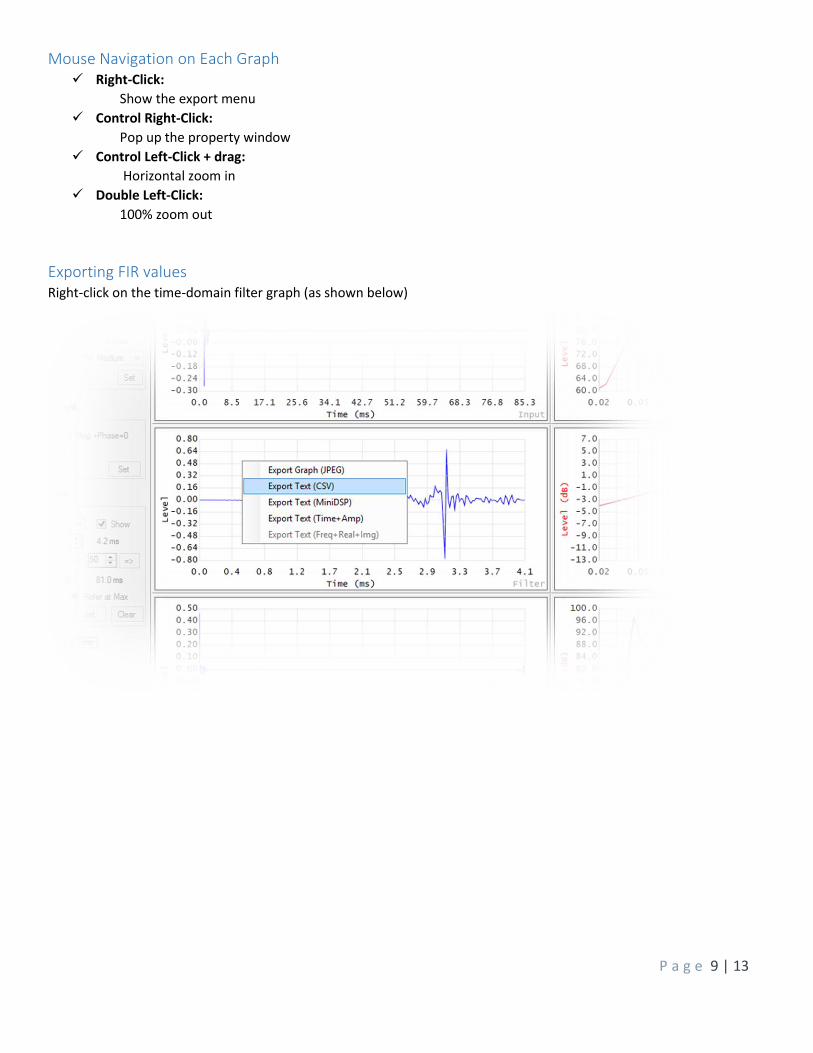
Mouse Navigation on Each Graph Right-Click:
Show the export menu
Control Right-Click:
Pop up the property window
Control Left-Click + drag:
Horizontal zoom in
Double Left-Click:
100% zoom out
Exporting FIR values Right-click on the time-domain filter graph (as shown below)
P a g e 10 | 13
Import Measurement File
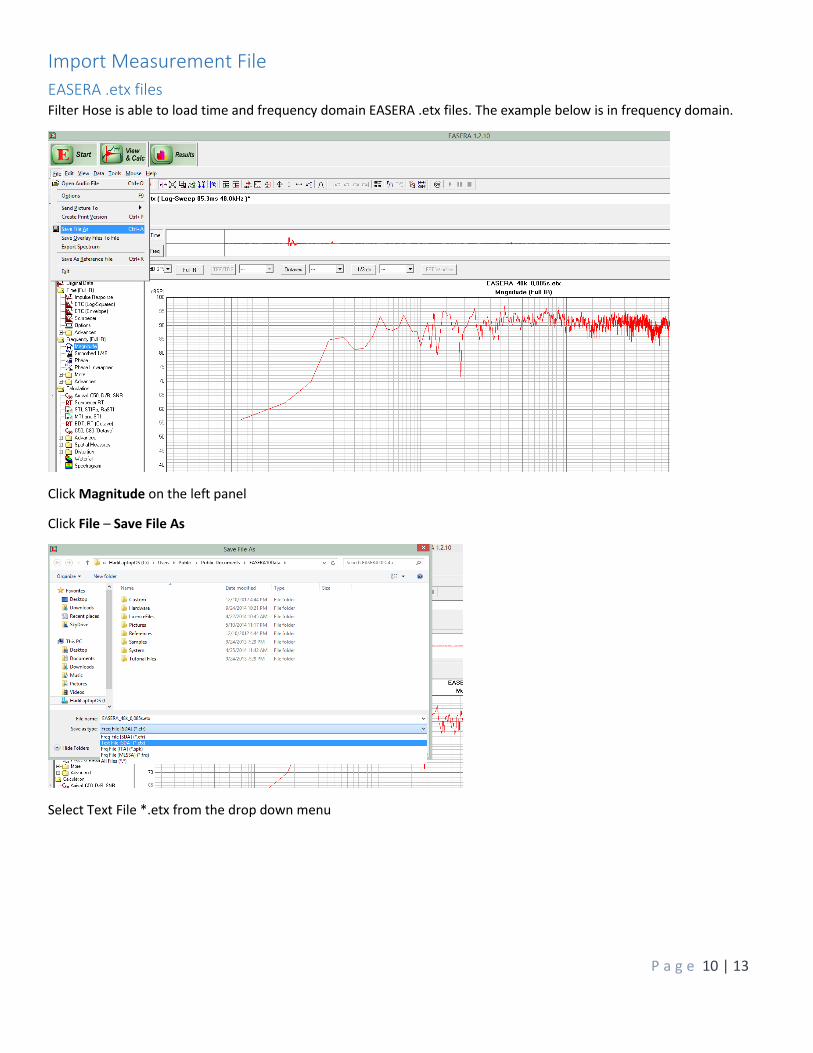
EASERA .etx files Filter Hose is able to load time and frequency domain EASERA .etx files. The example below is in frequency domain.
Click Magnitude on the left panel
Click File – Save File As
Select Text File *.etx from the drop down menu
P a g e 11 | 13
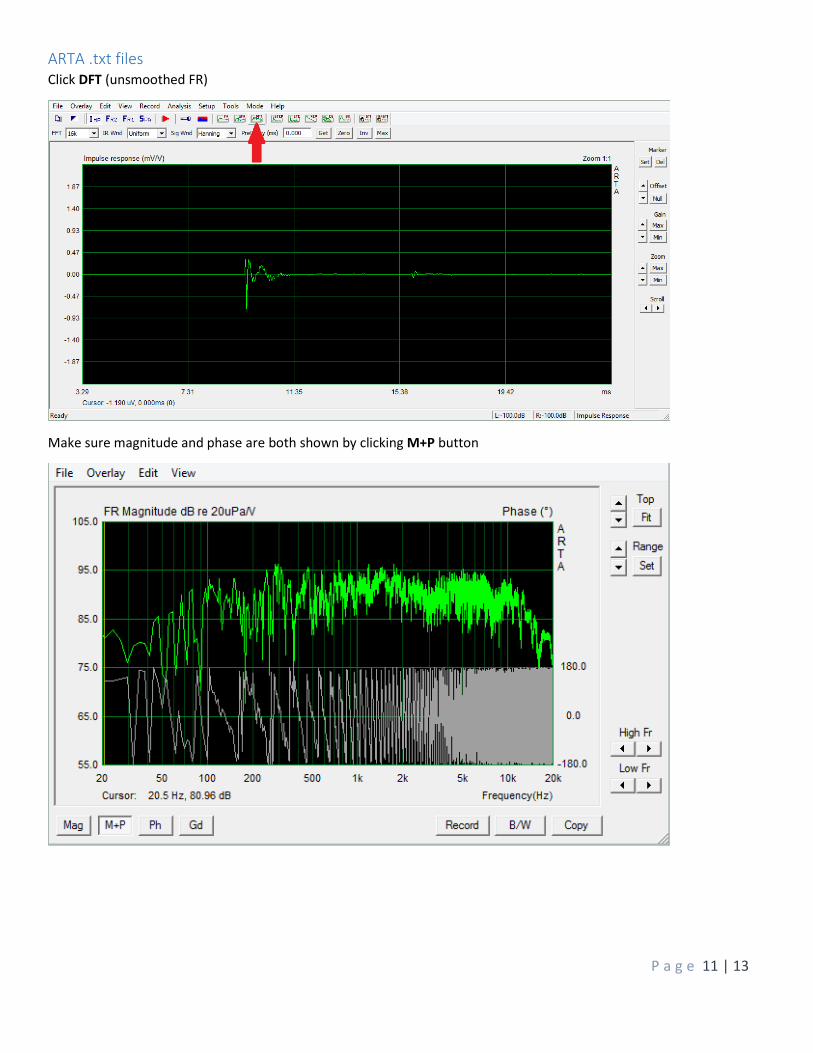
ARTA .txt files Click DFT (unsmoothed FR)
Make sure magnitude and phase are both shown by clicking M+P button
P a g e 12 | 13
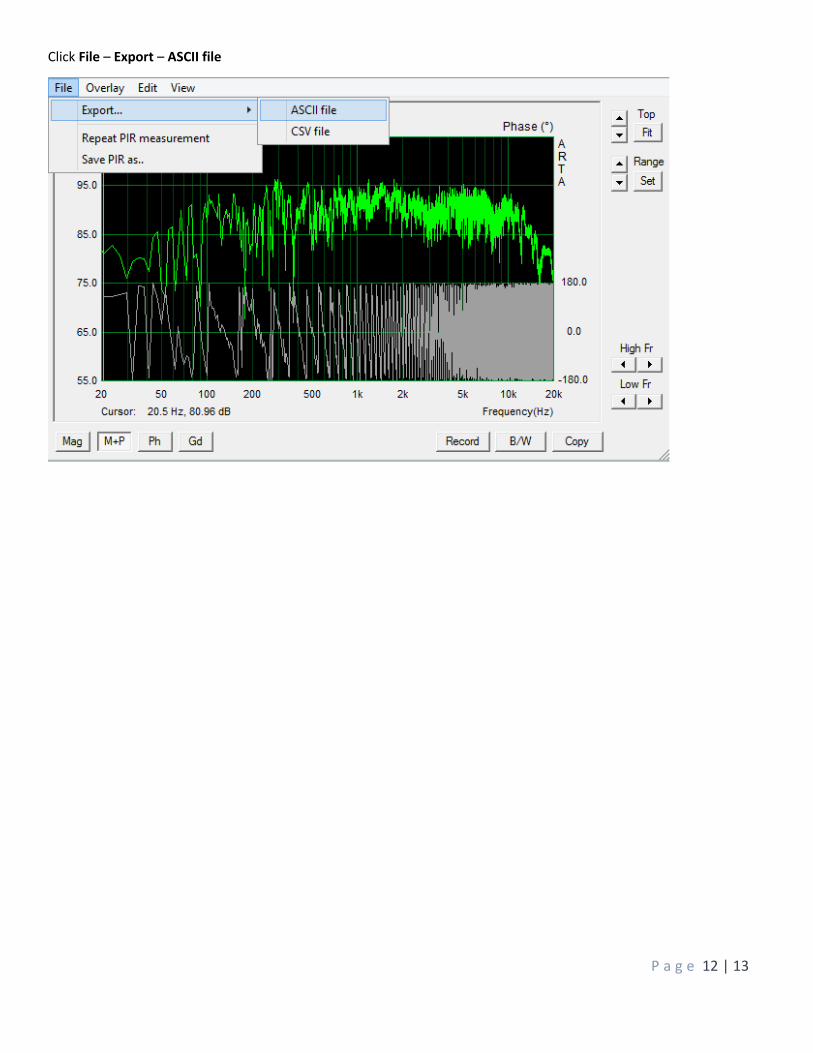
Click File – Export – ASCII file
P a g e 13 | 13
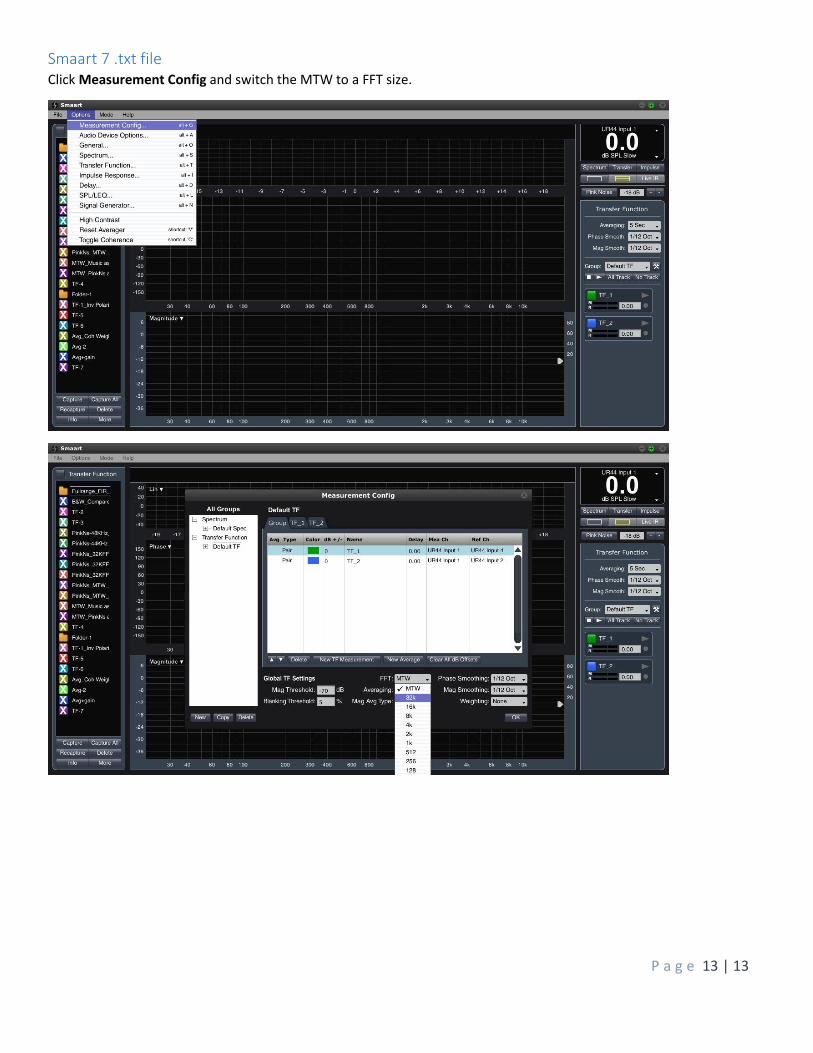
Smaart 7 .txt file Click Measurement Config and switch the MTW to a FFT size.
P a g e 14 | 13
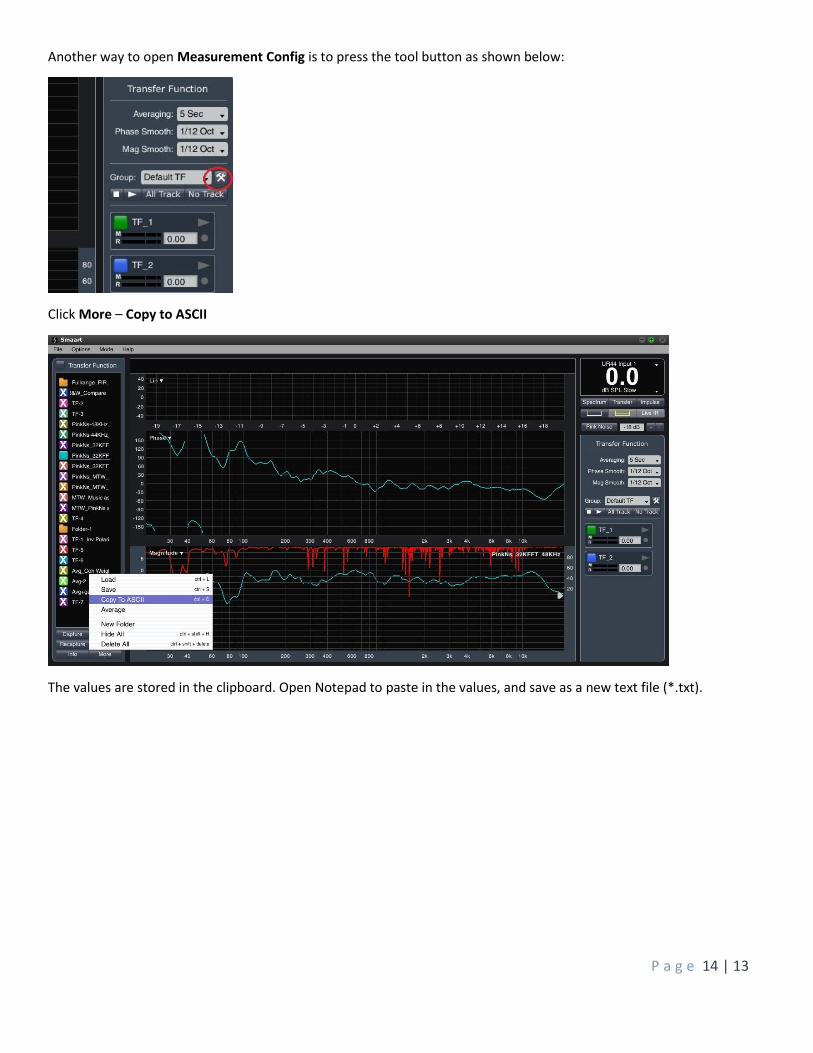
Another way to open Measurement Config is to press the tool button as shown below:
Click More – Copy to ASCII
The values are stored in the clipboard. Open Notepad to paste in the values, and save as a new text file (*.txt).
P a g e 15 | 13
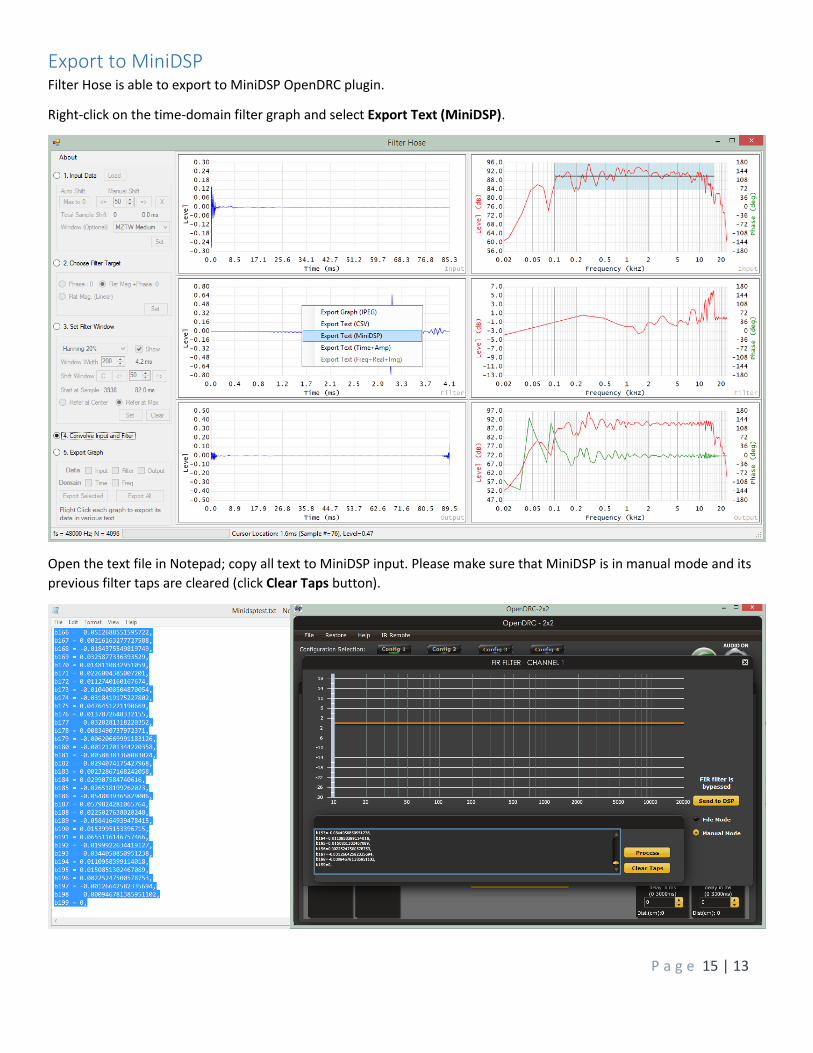
Export to MiniDSP Filter Hose is able to export to MiniDSP OpenDRC plugin.
Right-click on the time-domain filter graph and select Export Text (MiniDSP).
Open the text file in Notepad; copy all text to MiniDSP input. Please make sure that MiniDSP is in manual mode and its
previous filter taps are cleared (click Clear Taps button).
P a g e 16 | 13
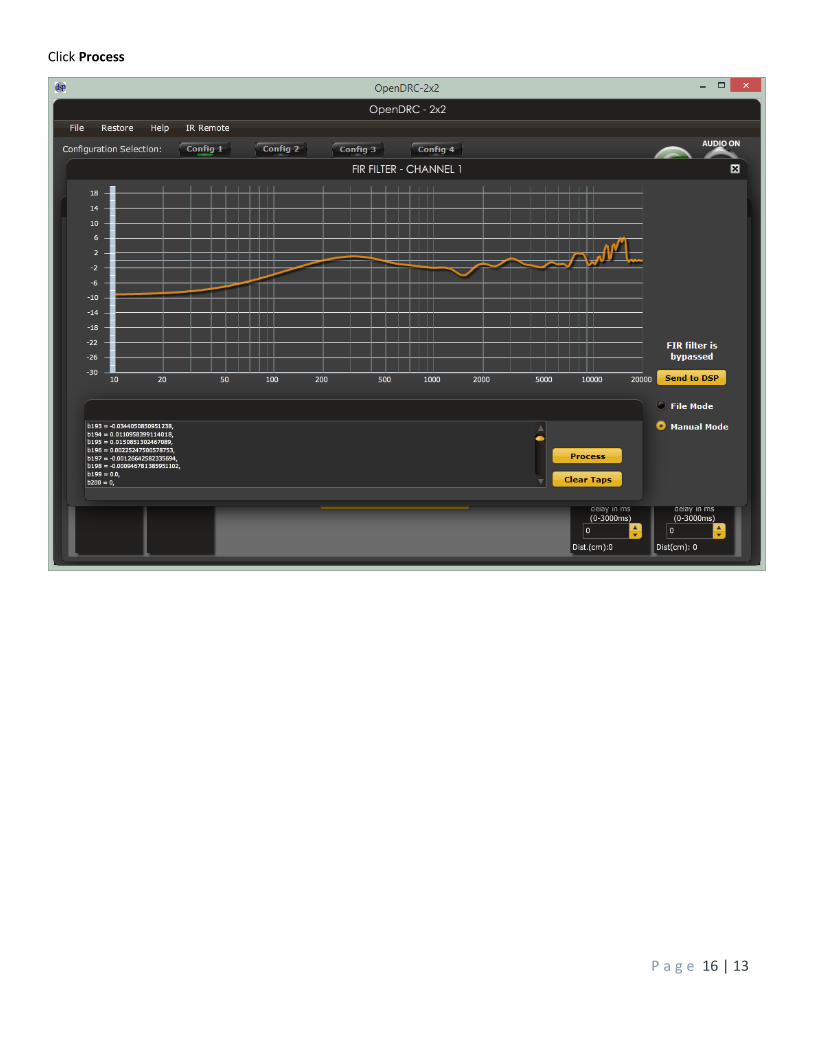
Click Process