Embed Size (px)
Citation preview

Department of Census & Statistics Sri Lanka
SURVEY OF CONSTRUCTION INDUSTRIES
Final Report


SURVEY OF CONSTRUCTION INDUSTRIES
Final Report
2013
Department of Census & Statistics Sri Lanka

ISBN 978-955-577-939-5
Published in 2015
Survey of Construction Industries - 2013
i
PREFACE
The first Survey of Construction Industries (SCI) was conducted in 1993 by the Department of Census and
Statistics (DCS) to fulfill the data requirement of construction sector and it was carried out with the
assistance of Institute for Construction Training and Development ICTAD. The SCI was annually
conducted since 1993.
Considering the factors such as duration of construction activities and work done during the year, it was
decided to carry out the survey once in two years. Therefore, since 2009 the DCS has been conducting
this survey once in two years to meet the data requirement in this sector meaningfully.
Reference year for this survey was 2012. A sample of ICTAD registered constructors was taken for the
survey. User comments on this survey are greatly appreciated.
Dr. A.J. Satharasinghe,
Director General of Census & Statistics.
Department of Census & Statistics.
No.306/71,
Polduwa Road,
Battaramulla.
06/05/2015.

Survey of Construction Industries - 2013
ii
Survey of Construction Industries - 2013
iii
ACKNOWLEDGEMENT
The planning, collection and processing of data were done by the staff of Industry, Construction, Trade
and Services Division under the overall guidance Mrs. U. Maheshwaran, Deputy Director and she was
assisted by Mrs. B.G. Kumari Premalatha Senior statistician.
The computer assisted data processing using the software package SQL server was done by Mr. R.M.P.
Dharmapriya, ICTA and the statistical tables were obtained using SPSS by B.G. Kumari Premalatha, Senior
Statistician and Ms. W.S.D. Jayasundara, Statistician. The computation and data processing were done by
Mrs. Dammika Karunanayake, Statistical officer, Ms. W.T.K.T.P. Kularathne, Statistical Assistant, Mr. P.A.
Priyantha, Development Officer.
This publication was organized and prepared by Mrs. B.G. Kumari Premaltha, Senior Statistician while
Mr. Priyadarshana Dharmawardena, Senior Statistician contributed by overall editing of the report.
Data collection was done by the District Statistical Officers / Statistical Assistants under the supervision
of District Statisticians / Deputy Directors. Follow up Data collection was carried out by the staff of
Industry, Construction, Trade and Services Division under the supervising of Senior Statisticians,
Statisticians of the Division.
The Co-operation extended by the respondents are also very much appreciated.

Survey of Construction Industries - 2013
iv
Survey of Construction Industries - 2013
v
Content
Page No.
Preface ……………………………………………………………………………………………………………… i
Acknowledgement ……………………………………………………………………………………………. iii
List of Tables …………………………………………………………………………………………………….. vii
List of Figures ……………………………………………………………………………………………………. ix
1. Introduction 1
1.1 Background 1
1.2 Scope and coverage 1
2. Methodology 2
2.1 Frame 2
2.2 Concept and definitions 2
3. Survey Results 3
4. Statistical Appendix 9

Survey of Construction Industries - 2013
vi

Survey of Construction Industries - 2013
vii
List of Tables Table 3.1: Distribution of value of contracts by sector – 2012
Table 3.2: Distribution of value of work done by sector – 2012
Table 3.3: Distribution of value of work done by type of construction - 2012 (All Sectors)
Table 3.4: Distribution of value of contracts by type of building - 2012 (All Sectors)
Table 3.5: Distribution of value of work done by type of building - 2012 (All Sectors)
Table 3.6: Distribution of raw materials consumed by type of construction -2012 (All Sectors)
Table 3.7: Distribution of some selected indicators of all construction activities and building
constructions - 2012
Table 3.8: Distribution of value of sub-contracts by type of construction - 2012 (all sectors)
Table 3.9: Share of sub contracts for the total work done by construction type 2012 (All Sectors) Table 4.1: Some selected indicators of construction activities classified by type of construction activity –
2012 (all sectors)
Table 4.2: Some selected indicators of construction activities classified by type of construction activity –
2012 (private sector)
Table 4.3: Some selected indicators of construction activities classified by type of construction activity –
2012 (public sector)
Table 4. 4: Raw materials consumed classified by type of construction activity – 2012 (all sectors)
Table 4.5: Raw materials consumed classified by type of construction activity – 2012 (private sector)
Table 4.6: Raw materials consumed classified by type of construction activity – 2012 (public sector)
Table 4.7: Average no. of employees and salaries classified by type of construction activity – 2012 (all
sectors)
Table 4.8: Average no. of employees and salaries classified by type of construction activity – 2012
(private sector)
Table 4.9: Average no. of employees and salaries classified by type of construction activity – 2012 (public
sector)
Table 4.10: Some selected indicators of construction activities classified by value of work done size class
– 2012 (all sectors)
Table 4.11: Some selected indicators of construction activities classified by value of work done size class
– 2012 (private sector)
Table 4.12: Some selected indicators of construction activities classified by value of work done size class
– 2012 (public sector)
Table 4.13: Materials used classified by value of work done size class – 2012 (all sectors)
Table 4.14: Value of contract for new building by floor area of the building – 2012 (all sectors)

Survey of Construction Industries - 2013
viii

Survey of Construction Industries - 2013
ix
List of Figures Figure 3.1: Distribution of value of contracts by sector – 2012
Figure 3.2: Distribution of value of work done by sector – 2012
Figure 3.3: Distribution of value of work done by type of construction - 2012 (All Sectors)
Figure 3.4: Distribution of value of contracts by type of building - 2012 (All Sectors)
Figure 3.5: Distribution of value of work done by type of building - 2012 (All Sectors)
Figure 3.6: Distribution of raw materials consumed by type of construction -2012 (All Sectors)
Figure 3.7: Distribution of some selected indicators of all construction activities and building
constructions - 2012
Figure 3.8: Distribution of value of sub-contracts by type of construction - 2012 (all sectors)
Figure 3.9: Share of sub contracts for the total work done by construction type 2012 (All Sectors)

Survey of Construction Industries - 2013
x
Survey of Construction Industries - 2013
- 1 -
1. INTRODUCTION
1.1 BACKGROUND
Survey of Construction Industries (SCI) was
conducted by the Department of Census and
Statistics (DCS) in 1993 for the first time in Sri
Lanka with the view of furnishing information on
input, output and their trends to the Institute for
Construction Training and Development (ICTAD).
DCS continues to conduct the survey once in two
years to cater the data requirements in the
construction sector in Sri Lanka.
1.2 SCOPE AND COVERAGE
All construction activities undertaken by the
private, government and semi-government
contractors who were registered with ICTAD,
were covered.
The updated registry (in 2012) which was used for
this survey consists of establishments which
undertake more government contracts.
Information were collected relating to the
following types of the construction industry.
i. Building construction
ii. Highway construction
iii. Bridge construction
iv. Water supply & drainage
v. Irrigation & land drainage
vi. Dredging & Reclamation
vii. Other constructions
All construction activities, except building
construction, mentioned above are categorized
under Civil Engineering activities.
The following types of construction activities were
not covered by this survey.
The construction activities carried out
other than by the ICTAD registered
contractors such as construction of
houses in the rural sector and urban
sector
Large scale construction activities carried
out by foreign contractors
But, if there are sub-contracts given by foreign
contractors to ICTAD registered companies, those
values were considered for the survey.
Construction industry: Sector of
national economy engaged in
preparation of land and
construction, alteration, and
repair of buildings, structures,
and other real property.
www.businessdictionary.com

Survey of Construction Industries - 2013
- 2 -
2. METHODOLOGY
SCI was aimed to cover 1474 units in all provinces
during the reference year 2012. The department
introduced a very simple questionnaire for the
survey from the year 2000 considering the
difficulties of obtaining information of
construction activities.
Areas covered under the questionnaire were
Value of contract
Value of work done
Value of raw material used
Salaries
Other services
Value of subcontract
Field officers of the department were sent to the
establishments directly to collect the information
from contractors. For the non-responding
contractors, field officers had to visit quite a
number of times to get the questionnaire
completed.
The collection of accurate data from contractors
is very tedious and time consuming. In some cases
officers had to visit them several times in order to
get a good response.
2.1 FRAME List of contractors registered with the ICTAD and
among those who were engaged in construction
activities in the year 2012 have been used as the
frame for this survey.
2.2 CONCEPT AND DEFINITIONS Reference Period: Data relating to construction
activities carried out during the calendar
year 2012 or financial year 2012 April to
2013 March.
Employment: This refers to the average number
of persons engaged in construction
activity during the reference period,
including skilled labourers, unskilled
labourers, technical, professional and
other paid workers.
Salaries & Wages: Amount paid as salaries, wages
or subcontract on work done during the
period.
Output: Value of work done during the year 2012.
Input: Expenditure on goods (raw materials),
other services and subcontract
INPUT = Value of goods
+ Value of
other services
+ Value of
sub-contract
Value Added: Value added is the increment
addition to the value of raw materials and
other expenditure that is contributed by
the contractor. It is computed as follows.
VALUE ADDED = Output - Input

Survey of Construction Industries - 2013
- 3 -
3. SURVEY RESULTS
According to the Survey of Construction
Industries, in 2012
Total estimated value of work done by all
type of construction activities in Sri Lanka
was Rs. 113,430 million.
The highest contribution to this value has
been made by the building construction
sector which accounted for 51 % of the
total value of work done.
The major share of the value of work
done from building construction sector
which is Rs. 57,960 million was from both
the private and the public sector.
The high way construction was the
second highest contributor to the value of
work done, amounting to 27% of the total
value.
Table 3.1: Distribution of value of contracts by sector – 2012
Sector Value of Contracts
(Rs. Mn) %
Private 14,389 5.8
Public 232,441 94.2
Total 246,830 100.0
Figure 3.1: Distribution of value of contracts by sector – 2012
Table 3.2: Distribution of value of work done by sector – 2012
Sector Value of work
done (Rs. Mn)
%
Private 10,617 9.4
Public 102,812 90.6
Total 113,430 100.0
Figure 3.2: Distribution of value of work done by sector – 2012
Considering the figures 3.1 and 3.2, with respect
to value of contract and value of work done,
more than 90 percent of constructions belong to
public sector in 2012.
Private5.8%
Public94.2%
0
40,000
80,000
120,000
Private Public Total
10,617
102,812113,430
Rs.
Mn

Survey of Construction Industries - 2013
- 4 -
Value of contracts is the total value of activity
(project). This includes work done or to be
done in the future to complete the project.
Table 3.3: Distribution of value of work done by type of construction - 2012 (All Sectors)
Type of Construction Value of work
done (Rs. Mn)
%
Building 57,960 51.1
Highway 30,381 26.8
Bridge 10,429 9.2
Water supply & Drainage
1,058 0.9
Irrigation & Land Drainage
6,697 5.9
Dredging & Reclamation
1 0.0
Other 6,904 6.1
Total 113,430 100.0
Figure 3.3: Distribution of value of work done by type of construction - 2012 (All Sectors)
Figure 3.3 shows that highest value of work done
during 2012 was recorded from building
constructions. Highways and bridge construction
have become second and third places with
respect to value of work done.
Table 3.4: Distribution of value of contracts by type of building - 2012 (All Sectors)
Type of Building Value of contracts
(Rs. Mn) %
Market Complex 66,797 45.4
Office Building 27,260 18.5
Hospital Building 15,906 10.8
Repair & Maintenance
6,217 4.2
School Building 5,649 3.8
Collective living quarters
3,091 2.1
Housing Units 1,826 1.2
Factories 1,685 1.1
Other Building 18,780 12.8
Total 147,210 100.0
Figure 3.4: Distribution of value of contracts by type of building - 2012 (All Sectors)
According to the figure 3.5, highest value of
contracts under building construction was
reported from projects on market complexes in
2012.
57,960
30,381
10,429
1,058
6,697
1
6,904
Building
Highway
Bridge
Water supply &Drainage
Irrigation & LandDrainage
Dredging &Reclamation
Other
Housing Units 1%
Collective living
quarters2.1% Office
Building18.5%
Market Complex
45.4%
Factories1.1%
School Building
3.8%
Hospital Building10.8%
Other Building12.8%
Repair & Maintenance
4.2%
Survey of Construction Industries - 2013
- 5 -
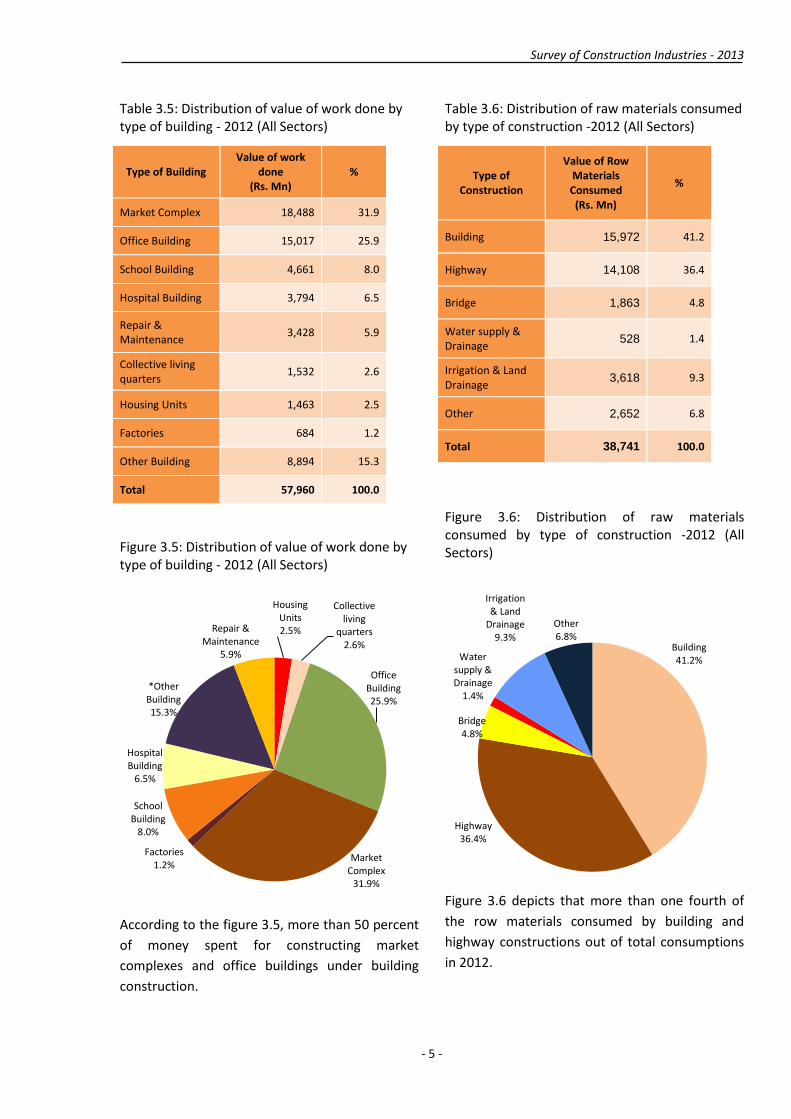
Table 3.5: Distribution of value of work done by type of building - 2012 (All Sectors)
Type of Building Value of work
done (Rs. Mn)
%
Market Complex 18,488 31.9
Office Building 15,017 25.9
School Building 4,661 8.0
Hospital Building 3,794 6.5
Repair & Maintenance
3,428 5.9
Collective living quarters
1,532 2.6
Housing Units 1,463 2.5
Factories 684 1.2
Other Building 8,894 15.3
Total 57,960 100.0
Figure 3.5: Distribution of value of work done by type of building - 2012 (All Sectors)
According to the figure 3.5, more than 50 percent
of money spent for constructing market
complexes and office buildings under building
construction.
Table 3.6: Distribution of raw materials consumed by type of construction -2012 (All Sectors)
Type of Construction
Value of Row Materials Consumed (Rs. Mn)
%
Building 15,972 41.2
Highway 14,108 36.4
Bridge 1,863 4.8
Water supply & Drainage
528 1.4
Irrigation & Land Drainage
3,618 9.3
Other 2,652 6.8
Total 38,741 100.0
Figure 3.6: Distribution of raw materials consumed by type of construction -2012 (All Sectors)
Figure 3.6 depicts that more than one fourth of
the row materials consumed by building and
highway constructions out of total consumptions
in 2012.
Housing Units2.5%
Collective living
quarters2.6%
Office Building25.9%
Market Complex
31.9%
Factories1.2%
School Building
8.0%
Hospital Building
6.5%
*Other Building15.3%
Repair & Maintenance
5.9%Building41.2%
Highway36.4%
Bridge4.8%
Water supply & Drainage
1.4%
Irrigation & Land
Drainage9.3%
Other6.8%
Survey of Construction Industries - 2013
- 6 -
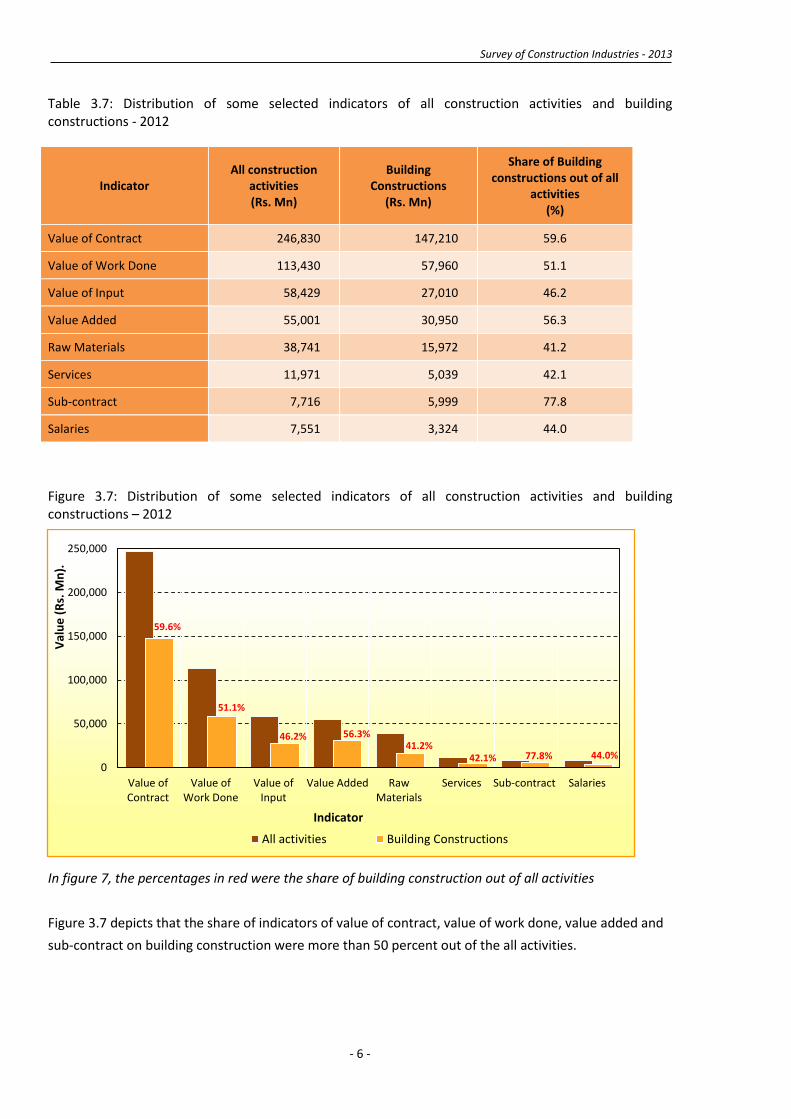
Table 3.7: Distribution of some selected indicators of all construction activities and building constructions - 2012
Indicator All construction
activities (Rs. Mn)
Building Constructions
(Rs. Mn)
Share of Building constructions out of all
activities (%)
Value of Contract 246,830 147,210 59.6
Value of Work Done 113,430 57,960 51.1
Value of Input 58,429 27,010 46.2
Value Added 55,001 30,950 56.3
Raw Materials 38,741 15,972 41.2
Services 11,971 5,039 42.1
Sub-contract 7,716 5,999 77.8
Salaries 7,551 3,324 44.0
Figure 3.7: Distribution of some selected indicators of all construction activities and building constructions – 2012
In figure 7, the percentages in red were the share of building construction out of all activities
Figure 3.7 depicts that the share of indicators of value of contract, value of work done, value added and
sub-contract on building construction were more than 50 percent out of the all activities.
59.6%
51.1%
46.2% 56.3%41.2%
42.1% 77.8% 44.0%0
50,000
100,000
150,000
200,000
250,000
Value ofContract
Value ofWork Done
Value ofInput
Value Added RawMaterials
Services Sub-contract Salaries
Val
ue
(R
s. M
n).
Indicator
All activities Building Constructions

Survey of Construction Industries - 2013
- 7 -
Table 3.8: Distribution of value of sub-contracts by type of construction - 2012 (all sectors)
Type of Construction Value of sub-
contract (Rs. Mn)
%
Building 5,999 77.8
Highway 501 6.5
Bridge 725 9.4
Water supply & Drainage 74 1.0
Irrigation & Land Drainage 186 2.4
Other 229 3.0
Total 7,716 100.0
Figure 3.8: Distribution of value of sub-contracts by type of construction - 2012 (all sectors)
Figure 3.8 shows that out of all the construction type, building construction is the largest type with
respect to the values of sub-contracts. (77.8%) The lowest share was reported from the construction on
water supply & Drainage.
Building77.8%
Highway6.5%
Bridge9.4%
Water supply & Drainage
1.0%
Irrigation & Land Drainage
2.4%Other3.0%
Survey of Construction Industries - 2013
- 8 -
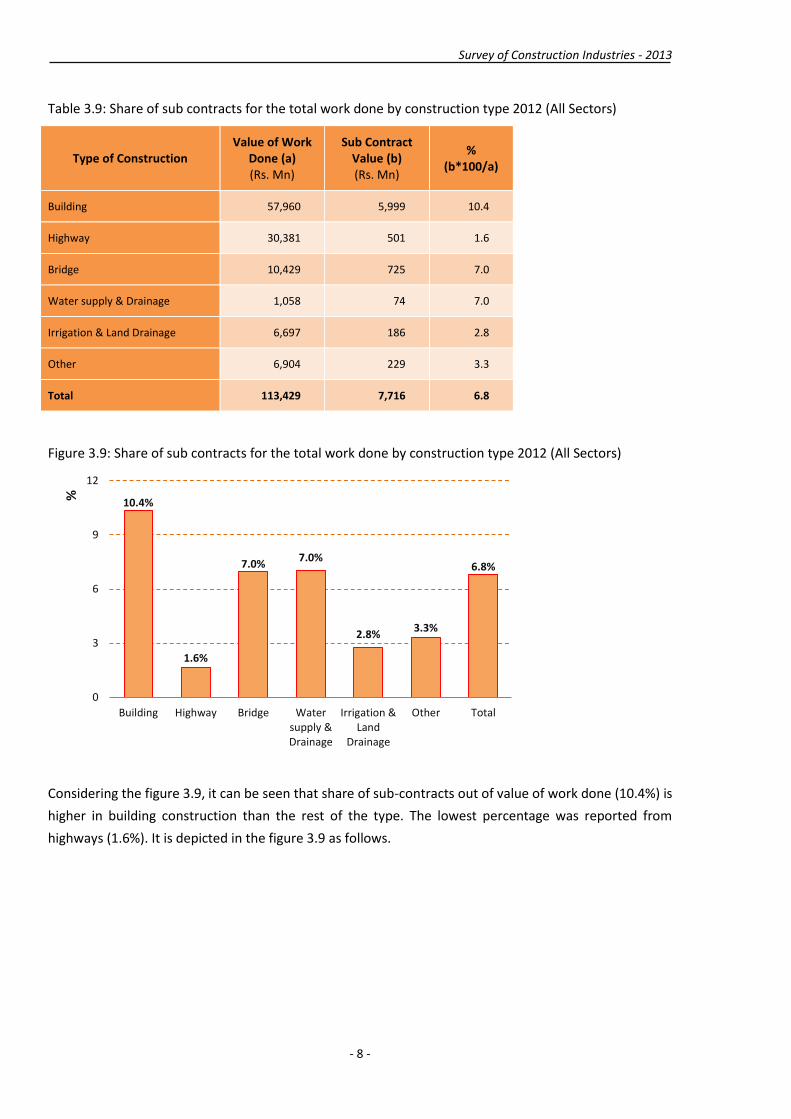
Table 3.9: Share of sub contracts for the total work done by construction type 2012 (All Sectors)
Type of Construction Value of Work
Done (a) (Rs. Mn)
Sub Contract Value (b) (Rs. Mn)
% (b*100/a)
Building 57,960 5,999 10.4
Highway 30,381 501 1.6
Bridge 10,429 725 7.0
Water supply & Drainage 1,058 74 7.0
Irrigation & Land Drainage 6,697 186 2.8
Other 6,904 229 3.3
Total 113,429 7,716 6.8
Figure 3.9: Share of sub contracts for the total work done by construction type 2012 (All Sectors)
Considering the figure 3.9, it can be seen that share of sub-contracts out of value of work done (10.4%) is
higher in building construction than the rest of the type. The lowest percentage was reported from
highways (1.6%). It is depicted in the figure 3.9 as follows.
10.4%
1.6%
7.0%7.0%
2.8%3.3%
6.8%
0
3
6
9
12
Building Highway Bridge Watersupply &Drainage
Irrigation &Land
Drainage
Other Total
%
Survey of Construction Industries - 2013
- 9 -
4. STATISTICAL APPENDIX
Survey of Construction Industries - 2013
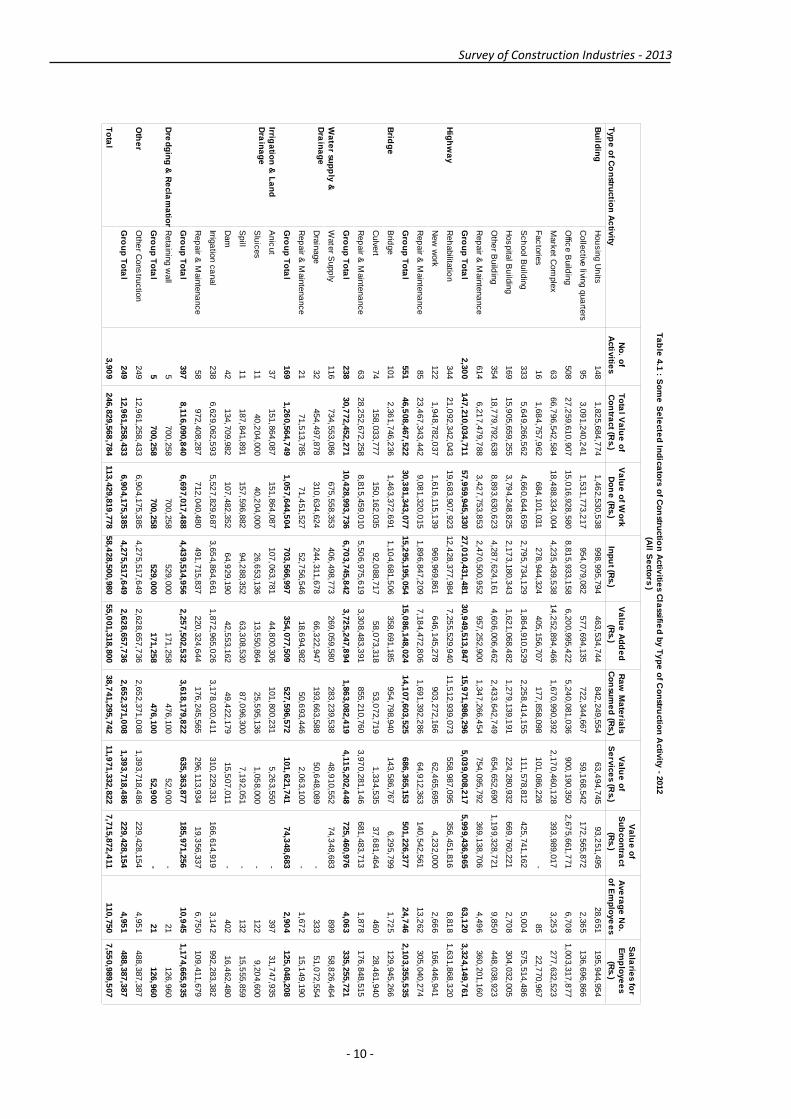
- 10 -
Ta
ble
4.1
: So
me
Se
lecte
d In
dic
ato
rs of C
on
structio
n A
ctiv
ities C
lassifie
d b
y T
yp
e o
f Co
nstru
ctio
n A
ctiv
ity - 2
012
(All S
ecto
rs )
148
1,8
25,6
84,7
74
1,4
62,5
30,5
38
998,9
95,7
94
463,5
34,7
44
842,2
49,5
54
63,4
94,7
45
93,2
51,4
95
28,6
51
195,9
44,9
54
95
3,0
91,2
40,2
41
1,5
31,7
73,2
17
954,0
79,0
82
577,6
94,1
35
722,3
44,6
67
59,1
68,5
42
172,5
65,8
72
2,3
65
136,6
96,8
66
508
27,2
59,6
10,9
07
15,0
16,9
28,5
80
8,8
15,9
33,1
58
6,2
00,9
95,4
22
5,2
40,0
81,0
36
900,1
90,3
50
2,6
75,6
61,7
71
6,7
08
1,0
03,3
17,8
77
63
66,7
96,5
42,5
84
18,4
88,3
34,0
04
4,2
35,4
39,5
38
14,2
52,8
94,4
66
1,6
70,9
90,3
92
2,1
70,4
60,1
28
393,9
89,0
17
3,2
53
277,6
32,5
23
16
1,6
84,7
57,9
62
684,1
01,0
31
278,9
44,3
24
405,1
56,7
07
177,8
58,0
98
101,0
86,2
26
-85
22,7
70,9
67
333
5,6
49,2
66,5
62
4,6
60,6
44,6
59
2,7
95,7
34,1
29
1,8
64,9
10,5
29
2,2
58,4
14,1
55
111,5
78,8
12
425,7
41,1
62
5,0
04
575,5
14,4
86
169
15,9
05,6
59,2
55
3,7
94,2
48,8
25
2,1
73,1
80,3
43
1,6
21,0
68,4
82
1,2
79,1
39,1
91
224,2
80,9
32
669,7
60,2
21
2,7
08
304,0
32,0
05
354
18,7
79,7
92,6
38
8,8
93,6
30,6
23
4,2
87,6
24,1
61
4,6
06,0
06,4
62
2,4
33,6
42,7
49
654,6
52,6
90
1,1
99,3
28,7
21
9,8
50
448,0
38,9
23
614
6,2
17,4
79,7
88
3,4
27,7
53,8
53
2,4
70,5
00,9
52
957,2
52,9
00
1,3
47,2
66,4
54
754,0
95,7
92
369,1
38,7
06
4,4
96
360,2
01,1
60
2,3
00
147,2
10,0
34
,711
57,9
59,9
45,3
30
27,0
10,4
31,4
81
30,9
49,5
13,8
47
15,9
71,9
86,2
96
5,0
39,0
08,2
17
5,9
99,4
36,9
65
63,1
20
3,3
24,1
49,7
61
344
21,0
92,3
42,0
43
19,6
83,9
07,9
23
12,4
28,3
77,9
84
7,2
55,5
29,9
40
11,5
12,9
39,0
73
558,9
87,0
95
356,4
51,8
16
8,8
18
1,6
31,8
68,3
20
122
1,9
48,7
82,0
37
1,6
16,1
15,1
39
969,9
69,8
61
646,1
45,2
78
903,2
72,1
66
62,4
65,6
95
4,2
32,0
00
2,6
66
166,4
46,9
41
85
23,4
67,3
43,4
42
9,0
81,3
20,0
15
1,8
96,8
47,2
09
7,1
84,4
72,8
06
1,6
91,3
92,2
86
64,9
12,3
63
140,5
42,5
61
13,2
62
305,0
40,2
74
551
46,5
08,4
67,5
22
30,3
81,3
43,0
77
15,2
95,1
95,0
54
15,0
86,1
48,0
24
14,1
07,6
03,5
25
686,3
65,1
53
501,2
26,3
77
24,7
46
2,1
03,3
55,5
35
101
2,3
61,7
46,2
36
1,4
63,3
72,6
91
1,1
04,6
81,5
06
358,6
91,1
85
954,7
98,9
40
143,5
86,7
67
6,2
95,7
99
1,7
25
129,9
45,2
66
74
158,0
33,7
77
150,1
62,0
35
92,0
88,7
17
58,0
73,3
18
53,0
72,7
19
1,3
34,5
35
37,6
81,4
64
460
28,4
61,9
40
63
28,2
52,6
72,2
58
8,8
15,4
59,0
10
5,5
06,9
75,6
19
3,3
08,4
83,3
91
855,2
10,7
60
3,9
70,2
81,1
46
681,4
83,7
13
1,8
78
176,8
48,5
15
238
30,7
72,4
52,2
71
10,4
28,9
93,7
36
6,7
03,7
45,8
42
3,7
25,2
47,8
94
1,8
63,0
82,4
19
4,1
15,2
02,4
48
725,4
60,9
76
4,0
63
335,2
55,7
21
116
734,5
53,0
86
675,5
58,3
53
406,4
98,7
73
269,0
59,5
80
283,2
39,5
38
48,9
10,5
52
74,3
48,6
83
899
58,8
26,4
64
32
454,4
97,8
78
310,6
34,6
24
244,3
11,6
78
66,3
22,9
47
193,6
63,5
88
50,6
48,0
89
-333
51,0
72,5
54
21
71,5
13,7
85
71,4
51,5
27
52,7
56,5
46
18,6
94,9
82
50,6
93,4
46
2,0
63,1
00
-1,6
72
15,1
49,1
90
169
1,2
60,5
64,7
49
1,0
57,6
44,5
04
703,5
66,9
97
354,0
77,5
09
527,5
96,5
72
101,6
21,7
41
74,3
48,6
83
2,9
04
125,0
48,2
08
37
151,8
64,0
87
151,8
64,0
87
107,0
63,7
81
44,8
00,3
06
101,8
00,2
31
5,2
63,5
50
-397
31,7
47,9
35
11
40,2
04,0
00
40,2
04,0
00
26,6
53,1
36
13,5
50,8
64
25,5
95,1
36
1,0
58,0
00
-122
9,2
04,6
00
11
187,8
41,8
91
157,5
96,8
82
94,2
88,3
52
63,3
08,5
30
87,0
96,3
00
7,1
92,0
51
-132
15,5
55,8
59
42
134,7
09,9
82
107,4
82,3
52
64,9
29,1
90
42,5
53,1
62
49,4
22,1
79
15,5
07,0
11
-402
16,4
62,4
80
238
6,6
29,0
62,5
93
5,5
27,8
29,6
87
3,6
54,8
64,6
61
1,8
72,9
65,0
26
3,1
78,0
20,4
11
310,2
29,3
31
166,6
14,9
19
3,1
42
992,2
83,3
82
58
972,4
08,2
87
712,0
40,4
80
491,7
15,8
37
220,3
24,6
44
176,2
45,5
65
296,1
13,9
34
19,3
56,3
37
6,7
50
109,4
11,6
79
397
8,1
16,0
90,8
40
6,6
97,0
17,4
88
4,4
39,5
14,9
56
2,2
57,5
02,5
32
3,6
18,1
79,8
22
635,3
63,8
77
185,9
71,2
56
10,9
45
1,1
74,6
65,9
35
5700,2
58
700,2
58
529,0
00
171,2
58
476,1
00
52,9
00
-21
126,9
60
5700,2
58
700,2
58
529,0
00
171,2
58
476,1
00
52,9
00
-21
126,9
60
249
12,9
61,2
58,4
33
6,9
04,1
75,3
85
4,2
75,5
17,6
49
2,6
28,6
57,7
36
2,6
52,3
71,0
08
1,3
93,7
18,4
86
229,4
28,1
54
4,9
51
488,3
87,3
87
249
12,9
61,2
58,4
33
6,9
04,1
75,3
85
4,2
75,5
17,6
49
2,6
28,6
57,7
36
2,6
52,3
71,0
08
1,3
93,7
18,4
86
229,4
28,1
54
4,9
51
488,3
87,3
87
3,9
09
246,8
29,5
68
,784
113,4
29,8
19
,778
58,4
28,5
00,9
80
55,0
01,3
18,8
00
38,7
41,2
95,7
42
11,9
71,3
32,8
22
7,7
15,8
72,4
11
110,7
50
7,5
50,9
89,5
07
Hou
sin
g U
nits
Colle
ctive
living q
ua
rters
Offic
e B
uild
ing
Mark
et C
om
ple
x
Fac
torie
s
Sch
ool B
uild
ing
Hos
pita
l Bu
ildin
g
Oth
er B
uild
ing
Rep
air &
Main
tena
nce
Gro
up
To
tal
Bu
ildin
g
Reh
abilita
tion
New
work
Rep
air &
Main
tena
nce
Gro
up
To
tal
Hig
hw
ay
Brid
ge
Culve
rt
Rep
air &
Main
tena
nce
Gro
up
To
tal
Brid
ge
Wate
r Supp
ly
Dra
inage
Rep
air &
Main
tena
nce
Gro
up
To
tal
Wa
ter su
pp
ly &
Dra
ina
ge
Anic
ut
Slu
ices
Spill
Dam
Irriga
tion c
anal
Rep
air &
Main
tena
nce
Gro
up
To
tal
Irriga
tion
& L
an
d
Dra
ina
ge
Reta
inin
g w
all
Gro
up
To
tal
Dre
dg
ing
& R
ecla
ma
tion
Oth
er C
ons
tructio
n
Gro
up
To
tal
Oth
er
To
tal
Typ
e o
f Co
nstru
ctio
n A
ctiv
ity
No
. of
Activ
ities
To
tal V
alu
e o
f
Co
ntra
ct (R
s.)
Va
lue
of W
ork
Do
ne
(Rs.)
Inp
ut (R
s.)
Va
lue
Ad
de
d
(Rs.)
Ra
w M
ate
rials
Co
nsu
me
d (R
s.)
Va
lue
of
Se
rvic
es (R
s.)
Va
lue
of
Su
bco
ntra
ct
(Rs.)
Ave
rag
e N
o.
of E
mp
loye
es
Sa
larie
s for
Em
plo
ye
es
(Rs.)
Survey of Construction Industries - 2013
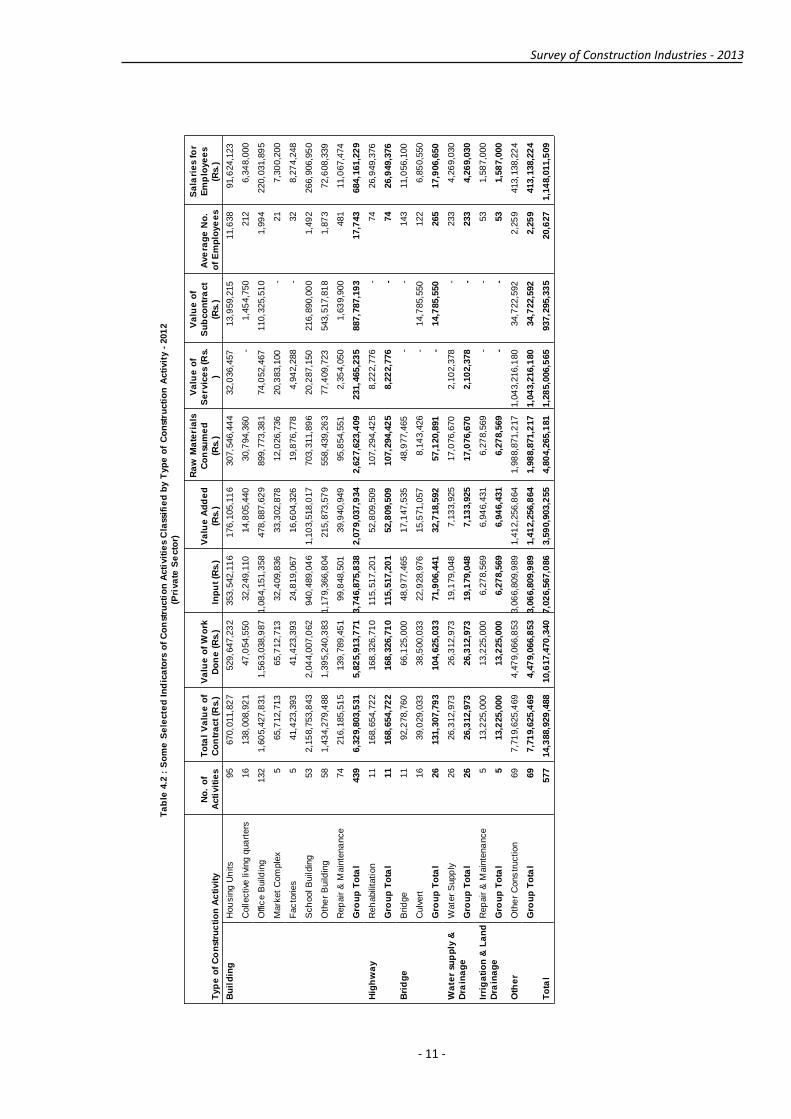
- 11 -
Ta
ble
4.2
: S
om
e S
ele
cte
d I
nd
ica
tors
of
Co
nst
ructi
on
Acti
vit
ies
Cla
ssif
ied
by T
yp
e o
f C
on
stru
cti
on
Acti
vit
y -
201
2
(Pri
va
te S
ecto
r)
95
670,0
11,8
27
529,6
47,2
32
353,5
42,1
16
176,1
05,1
16
307,5
46,4
44
32,0
36,4
57
13,9
59,2
15
11,6
38
91,6
24,1
23
16
138,0
08,9
21
47,0
54,5
50
32,2
49,1
10
14,8
05,4
40
30,7
94,3
60
-1,4
54,7
50
212
6,3
48,0
00
132
1,6
05,4
27,8
31
1,5
63,0
38,9
87
1,0
84,1
51,3
58
478,8
87,6
29
899,7
73,3
81
74,0
52,4
67
110,3
25,5
10
1,9
94
220,0
31,8
95
565,7
12,7
13
65,7
12,7
13
32,4
09,8
36
33,3
02,8
78
12,0
26,7
36
20,3
83,1
00
-21
7,3
00,2
00
541,4
23,3
93
41,4
23,3
93
24,8
19,0
67
16,6
04,3
26
19,8
76,7
78
4,9
42,2
88
-32
8,2
74,2
48
53
2,1
58,7
53,8
43
2,0
44,0
07,0
62
940,4
89,0
46
1,1
03,5
18,0
17
703,3
11,8
96
20,2
87,1
50
216,8
90,0
00
1,4
92
266,9
06,9
50
58
1,4
34,2
79,4
88
1,3
95,2
40,3
83
1,1
79,3
66,8
04
215,8
73,5
79
558,4
39,2
63
77,4
09,7
23
543,5
17,8
18
1,8
73
72,6
08,3
39
74
216,1
85,5
15
139,7
89,4
51
99,8
48,5
01
39,9
40,9
49
95,8
54,5
51
2,3
54,0
50
1,6
39,9
00
481
11,0
67,4
74
439
6,3
29,8
03,5
31
5,8
25,9
13,7
71
3,7
46,8
75,8
38
2,0
79,0
37,9
34
2,6
27,6
23,4
09
231,4
65,2
35
887,7
87,1
93
17,7
43
684,1
61,2
29
11
168,6
54,7
22
168,3
26,7
10
115,5
17,2
01
52,8
09,5
09
107,2
94,4
25
8,2
22,7
76
-74
26,9
49,3
76
11
168,6
54,7
22
168,3
26,7
10
115,5
17,2
01
52,8
09,5
09
107,2
94,4
25
8,2
22,7
76
-74
26,9
49,3
76
11
92,2
78,7
60
66,1
25,0
00
48,9
77,4
65
17,1
47,5
35
48,9
77,4
65
--
143
11,0
56,1
00
16
39,0
29,0
33
38,5
00,0
33
22,9
28,9
76
15,5
71,0
57
8,1
43,4
26
-14,7
85,5
50
122
6,8
50,5
50
26
131,3
07,7
93
104,6
25,0
33
71,9
06,4
41
32,7
18,5
92
57,1
20,8
91
-14,7
85,5
50
265
17,9
06,6
50
26
26,3
12,9
73
26,3
12,9
73
19,1
79,0
48
7,1
33,9
25
17,0
76,6
70
2,1
02,3
78
-233
4,2
69,0
30
26
26,3
12,9
73
26,3
12,9
73
19,1
79,0
48
7,1
33,9
25
17,0
76,6
70
2,1
02,3
78
-233
4,2
69,0
30
513,2
25,0
00
13,2
25,0
00
6,2
78,5
69
6,9
46,4
31
6,2
78,5
69
--
53
1,5
87,0
00
513,2
25,0
00
13,2
25,0
00
6,2
78,5
69
6,9
46,4
31
6,2
78,5
69
--
53
1,5
87,0
00
69
7,7
19,6
25,4
69
4,4
79,0
66,8
53
3,0
66,8
09,9
89
1,4
12,2
56,8
64
1,9
88,8
71,2
17
1,0
43,2
16,1
80
34,7
22,5
92
2,2
59
413,1
38,2
24
69
7,7
19,6
25,4
69
4,4
79,0
66,8
53
3,0
66,8
09,9
89
1,4
12,2
56,8
64
1,9
88,8
71,2
17
1,0
43,2
16,1
80
34,7
22,5
92
2,2
59
413,1
38,2
24
577
14,3
88,9
29
,488
10,6
17,4
70
,340
7,0
26,5
67,0
86
3,5
90,9
03,2
55
4,8
04,2
65,1
81
1,2
85,0
06,5
65
937,2
95,3
35
20,6
27
1,1
48,0
11,5
09
Hou
sin
g U
nits
Collective
liv
ing q
ua
rters
Offi
ce B
uild
ing
Mark
et
Com
ple
x
Fac
tories
Sch
ool B
uildin
g
Oth
er
Build
ing
Rep
air &
Main
tena
nce
Gro
up
To
tal
Bu
ild
ing
Reh
abili
tati
on
Gro
up
To
tal
Hig
hw
ay
Brid
ge
Culv
ert
Gro
up
To
tal
Bri
dg
e
Wate
r S
upp
ly
Gro
up
To
tal
Wa
ter
sup
ply
&
Dra
ina
ge
Rep
air &
Main
tena
nce
Gro
up
To
tal
Irri
ga
tio
n &
La
nd
Dra
ina
ge
Oth
er
Cons
truction
Gro
up
To
tal
Oth
er
To
tal
Typ
e o
f C
on
stru
cti
on
Ac
tivit
y
No
. o
f
Acti
vit
ies
To
tal
Va
lue
of
Co
ntr
act
(Rs.
)
Va
lue
of
Wo
rk
Do
ne
(R
s.)
Inp
ut
(Rs.
)
Va
lue
Ad
de
d
(Rs.
)
Ra
w M
ate
ria
ls
Co
nsu
me
d
(Rs.
)
Va
lue
of
Se
rvic
es
(Rs.
)
Va
lue
of
Su
bco
ntr
act
(Rs.
)
Ave
rag
e N
o.
of
Em
plo
ye
es
Sa
lari
es
for
Em
plo
ye
es
(Rs.
)

Survey of Construction Industries - 2013
- 12 -
Ta
ble
4.3
: So
me
Se
lecte
d In
dic
ato
rs of C
on
structio
n A
ctiv
ities C
lassifie
d b
y T
yp
e o
f Co
nstru
ctio
n A
ctiv
ity - 2
012
(Pu
blic
Se
cto
r)
53
1,1
55,6
72,9
47
932,8
83,3
07
645,4
53,6
78
287,4
29,6
29
534,7
03,1
10
31,4
58,2
88
79,2
92,2
80
17,0
13
104,3
20,8
32
79
2,9
53,2
31,3
19
1,4
84,7
18,6
67
921,8
29,9
72
562,8
88,6
95
691,5
50,3
07
59,1
68,5
42
171,1
11,1
22
2,1
53
130,3
48,8
66
376
25,6
54,1
83
,075
13,4
53,8
89
,593
7,7
31,7
81,8
00
5,7
22,1
07,7
93
4,3
40,3
07,6
56
826,1
37,8
83
2,5
65,3
36,2
61
4,7
13
783,2
85,9
82
58
66,7
30,8
29
,870
18,4
22,6
21
,291
4,2
03,0
29,7
02
14,2
19,5
91
,588
1,6
58,9
63,6
57
2,1
50,0
77,0
28
393,9
89,0
17
3,2
32
270,3
32,3
23
11
1,6
43,3
34,5
70
642,6
77,6
38
254,1
25,2
57
388,5
52,3
81
157,9
81,3
20
96,1
43,9
38
-53
14,4
96,7
19
280
3,4
90,5
12,7
19
2,6
16,6
37,5
96
1,8
55,2
45,0
84
761,3
92,5
13
1,5
55,1
02,2
59
91,2
91,6
62
208,8
51,1
62
3,5
13
308,6
07,5
36
169
15,9
05,6
59
,255
3,7
94,2
48,8
25
2,1
73,1
80,3
43
1,6
21,0
68,4
82
1,2
79,1
39,1
91
224,2
80,9
32
669,7
60,2
21
2,7
08
304,0
32,0
05
296
17,3
45,5
13
,149
7,4
98,3
90,2
40
3,1
08,2
57,3
57
4,3
90,1
32,8
83
1,8
75,2
03,4
87
577,2
42,9
67
655,8
10,9
04
7,9
77
375,4
30,5
84
540
6,0
01,2
94,2
73
3,2
87,9
64,4
02
2,3
70,6
52,4
51
917,3
11,9
51
1,2
51,4
11,9
03
751,7
41,7
42
367,4
98,8
06
4,0
15
349,1
33,6
86
1,8
62
140,8
80,2
31,1
77
52,1
34,0
31
,559
23,2
63,5
55
,644
28,8
70,4
75
,915
13,3
44,3
62
,890
4,8
07,5
42,9
82
5,1
11,6
49,7
73
45,3
77
2,6
39,9
88,5
33
333
20,9
23,6
87
,321
19,5
15,5
81
,213
12,3
12,8
60
,783
7,2
02,7
20,4
30
11,4
05,6
44
,648
550,7
64,3
19
356,4
51,8
16
8,7
44
1,6
04,9
18,9
44
122
1,9
48,7
82,0
37
1,6
16,1
15,1
39
969,9
69,8
61
646,1
45,2
78
903,2
72,1
66
62,4
65,6
95
4,2
32,0
00
2,6
66
166,4
46,9
41
85
23,4
67,3
43
,442
9,0
81,3
20,0
15
1,8
96,8
47,2
09
7,1
84,4
72,8
06
1,6
91,3
92,2
86
64,9
12,3
63
140,5
42,5
61
13,2
62
305,0
40,2
74
540
46,3
39,8
12
,800
30,2
13,0
16
,367
15,1
79,6
77
,853
15,0
33,3
38
,514
14,0
00,3
09
,100
678,1
42,3
77
501,2
26,3
77
24,6
72
2,0
76,4
06,1
59
90
2,2
69,4
67,4
76
1,3
97,2
47,6
91
1,0
55,7
04,0
41
341,5
43,6
50
905,8
21,4
75
143,5
86,7
67
6,2
95,7
99
1,5
82
118,8
89,1
66
58
119,0
04,7
45
111,6
62,0
02
69,1
59,7
41
42,5
02,2
62
44,9
29,2
93
1,3
34,5
35
22,8
95,9
14
339
21,6
11,3
90
63
28,2
52,6
72
,258
8,8
15,4
59,0
10
5,5
06,9
75,6
19
3,3
08,4
83,3
91
855,2
10,7
60
3,9
70,2
81,1
46
681,4
83,7
13
1,8
78
176,8
48,5
15
211
30,6
41,1
44
,479
10,3
24,3
68
,703
6,6
31,8
39,4
01
3,6
92,5
29,3
03
1,8
05,9
61,5
28
4,1
15,2
02,4
48
710,6
75,4
26
3,7
99
317,3
49,0
71
90
708,2
40,1
13
649,2
45,3
80
387,3
19,7
24
261,9
25,6
55
266,1
62,8
67
46,8
08,1
74
74,3
48,6
83
667
54,5
57,4
34
32
454,4
97,8
78
310,6
34,6
24
244,3
11,6
78
66,3
22,9
47
193,6
63,5
88
50,6
48,0
89
-333
51,0
72,5
53
21
71,5
13,7
85
71,4
51,5
27
52,7
56,5
46
18,6
94,9
82
50,6
93,4
46
2,0
63,1
00
-1,6
72
15,1
49,1
90
143
1,2
34,2
51,7
76
1,0
31,3
31,5
31
684,3
87,9
48
346,9
43,5
84
510,5
19,9
01
99,5
19,3
63
74,3
48,6
83
2,6
72
120,7
79,1
77
37
151,8
64,0
87
151,8
64,0
87
107,0
63,7
81
44,8
00,3
06
101,8
00,2
31
5,2
63,5
50
-397
31,7
47,9
35
11
40,2
04,0
00
40,2
04,0
00
26,6
53,1
36
13,5
50,8
64
25,5
95,1
36
1,0
58,0
00
-122
9,2
04,6
00
11
187,8
41,8
91
157,5
96,8
82
94,2
88,3
52
63,3
08,5
30
87,0
96,3
00
7,1
92,0
51
-132
15,5
55,8
59
42
134,7
09,9
82
107,4
82,3
52
64,9
29,1
90
42,5
53,1
62
49,4
22,1
79
15,5
07,0
11
-402
16,4
62,4
80
238
6,6
29,0
62,5
93
5,5
27,8
29,6
87
3,6
54,8
64,6
61
1,8
72,9
65,0
26
3,1
78,0
20,4
11
310,2
29,3
31
166,6
14,9
19
3,1
42
992,2
83,3
82
53
959,1
83,2
87
698,8
15,4
80
485,4
37,2
68
213,3
78,2
12
169,9
66,9
96
296,1
13,9
34
19,3
56,3
37
6,6
97
107,8
24,6
79
392
8,1
02,8
65,8
40
6,6
83,7
92,4
88
4,4
33,2
36,3
88
2,2
50,5
56,1
00
3,6
11,9
01,2
53
635,3
63,8
77
185,9
71,2
56
10,8
92
1,1
73,0
78,9
35
5700,2
58
700,2
58
529,0
00
171,2
58
476,1
00
52,9
00
-21
126,9
60
5700,2
58
700,2
58
529,0
00
171,2
58
476,1
00
52,9
00
-21
126,9
60
180
5,2
41,6
32,9
64
2,4
25,1
08,5
32
1,2
08,7
07,6
60
1,2
16,4
00,8
72
663,4
99,7
91
350,5
02,3
07
194,7
05,5
62
2,6
93
75,2
49,1
63
180
5,2
41,6
32,9
64
2,4
25,1
08,5
32
1,2
08,7
07,6
60
1,2
16,4
00,8
72
663,4
99,7
91
350,5
02,3
07
194,7
05,5
62
2,6
93
75,2
49,1
63
3,3
33
232,4
40,6
39,2
93
102,8
12,3
49,4
38
51,4
01,9
33
,894
51,4
10,4
15
,546
33,9
37,0
30
,564
10,6
86,3
26
,254
6,7
78,5
77,0
78
90,1
26
6,4
02,9
77,9
98
Hou
sin
g U
nits
Colle
ctive
living q
ua
rters
Offic
e B
uild
ing
Mark
et C
om
ple
x
Fac
torie
s
Sch
ool B
uild
ing
Hos
pita
l Bu
ildin
g
Oth
er B
uild
ing
Rep
air &
Main
tena
nce
Gro
up
To
tal
Bu
ildin
g
Reh
abilita
tion
New
work
Rep
air &
Main
tena
nce
Gro
up
To
tal
Hig
hw
ay
Brid
ge
Culve
rt
Rep
air &
Main
tena
nce
Gro
up
To
tal
Brid
ge
Wate
r Supp
ly
Dra
inage
Rep
air &
Main
tena
nce
Gro
up
To
tal
Wa
ter su
pp
ly &
Dra
ina
ge
Anic
ut
Slu
ices
Spill
Dam
Irriga
tion c
anal
Rep
air &
Main
tena
nce
Gro
up
To
tal
Irriga
tion
& L
an
d
Dra
ina
ge
Reta
inin
g w
all
Gro
up
To
tal
Dre
dg
ing
& R
ecla
ma
tion
Oth
er C
ons
tructio
n
Gro
up
To
tal
Oth
er
To
tal
Typ
e o
f Co
nstru
ctio
n A
ctiv
ity
No
. of
Activ
ities
To
tal V
alu
e o
f
Co
ntra
ct (R
s.)
Va
lue
of W
ork
Do
ne
(Rs.)
Inp
ut (R
s.)
Va
lue
Ad
de
d
(Rs.)
Ra
w M
ate
rials
Co
nsu
me
d (R
s.)
Va
lue
of
Se
rvic
es (R
s.)
Va
lue
of
Su
bco
ntra
ct
(Rs.)
Ave
rag
e N
o.
of E
mp
loye
es
Sa
larie
s for
Em
plo
ye
es
(Rs.)

Survey of Construction Industries - 2013
- 13 -
Ta
ble
4.4
: R
aw
Ma
teri
als
Co
nsu
me
d C
lass
ifie
d b
y T
yp
e o
f C
on
str
ucti
on
Acti
vit
y -
201
2
(All
Se
cto
rs)
166,4
66,2
02
74,0
16,3
10
72,6
02,8
58
73,7
79,8
59
110,0
13,3
85
167,0
26,7
94
50,4
99,1
18
127,8
45,0
27
842,2
49,5
54
96,6
23,3
11
37,5
18,3
11
45,8
09,6
25
60,4
57,6
08
69,0
55,7
58
169,5
10,5
71
45,3
17,8
87
198,0
51,5
95
722,3
44,6
67
849,8
03,8
30
450,8
41,4
38
262,0
36,6
69
330,1
90,6
78
308,0
45,0
54
879,2
00,8
41
283,4
16,4
51
1,8
76,5
46,0
76
5,2
40,0
81,0
36
168,6
62,5
53
176,7
02,8
65
119,9
27,2
78
62,3
20,0
42
39,1
10,8
05
238,7
35,3
45
84,1
63,2
44
781,3
68,2
61
1,6
70,9
90,3
92
11,8
44,6
21
22,0
09,9
15
23,3
45,7
10
12,8
96,0
57
4,3
70,1
75
49,7
01,4
37
9,5
96,4
30
44,0
93,7
54
177,8
58,0
98
525,6
76,5
47
227,8
57,4
04
188,1
79,3
34
183,6
13,1
40
218,0
55,3
49
397,4
28,7
81
164,5
37,3
36
353,0
66,2
64
2,2
58,4
14,1
55
158,9
74,0
42
83,7
63,4
35
35,4
45,9
06
57,0
25,1
18
59,1
68,8
82
184,9
81,4
11
65,5
87,8
07
634,1
92,5
89
1,2
79,1
39,1
92
446,3
25,2
62
251,5
66,3
50
135,1
35,8
88
182,2
25,3
20
159,4
54,4
10
412,2
13,5
58
153,7
90,7
17
692,9
31,2
46
2,4
33,6
42,7
49
154,1
01,3
10
93,9
38,2
49
79,1
96,5
00
123,0
36,9
48
172,2
16,4
85
135,8
58,5
36
112,6
08,4
13
476,3
10,0
14
1,3
47,2
66,4
55
2,5
78,4
77,6
78
1,4
18,2
14,2
77
961,6
79,7
68
1,0
85,5
44,7
70
1,1
39,4
90,3
03
2,6
34,6
57,2
74
969,5
17,4
02
5,1
84,4
04,8
26
15,9
71,9
86
,298
1,8
88,0
24,2
07
1,9
12,1
24,2
09
3,8
17,5
03,2
30
358,9
49,1
52
284,8
94,5
42
961,2
31,1
41
99,4
76,6
14
2,1
90,7
35,9
77
11,5
12,9
39
,073
182,9
87,8
76
112,3
59,6
00
283,5
95,0
11
85,6
19,7
08
30,2
67,7
08
103,4
62,7
83
663,3
66
104,3
16,1
13
903,2
72,1
66
191,7
58,6
44
85,2
10,4
73
152,7
18,6
85
7,0
54,4
64
11,0
96,3
15
61,6
43,5
78
872,8
50
1,1
81,0
37,2
77
1,6
91,3
92,2
86
2,2
62,7
70,7
27
2,1
09,6
94,2
82
4,2
53,8
16,9
26
451,6
23,3
24
326,2
58,5
65
1,1
26,3
37,5
02
101,0
12,8
30
3,4
76,0
89,3
67
14,1
07,6
03
,525
311,4
36,4
88
122,2
52,2
49
144,9
67,7
58
-21,4
32,0
86
142,9
38,8
26
-211,7
71,5
34
954,7
98,9
40
17,3
72,3
92
7,1
98,8
97
11,5
39,3
04
327,9
80
1,9
40,8
16
9,3
91,3
48
-5,3
01,9
82
53,0
72,7
19
55,6
43,3
96
19,8
30,9
52
44,6
24,3
78
-12,6
89,1
65
40,7
41,1
56
-681,6
81,7
13
855,2
10,7
60
384,4
52,2
76
149,2
82,0
98
201,1
31,4
40
327,9
80
36,0
62,0
67
193,0
71,3
30
-898,7
55,2
29
1,8
63,0
82,4
19
48,8
66,6
87
22,7
91,4
62
24,2
61,4
69
6,8
16,9
11
10,3
15,4
21
55,8
76,1
12
2,9
69,1
39
111,3
42,3
36
283,2
39,5
38
53,8
25,2
53
35,4
87,6
58
36,1
91,1
91
1,5
52,7
10
10,2
77,7
61
45,7
14,6
30
1,7
13,9
60
8,9
00,4
25
193,6
63,5
88
12,0
46,6
95
9,0
03,8
07
7,2
47,7
23
566,7
18
5,1
97,5
31
14,2
80,5
03
1,6
42,5
45
707,9
24
50,6
93,4
46
114,7
38,6
35
67,2
82,9
27
67,7
00,3
83
8,9
36,3
39
25,7
90,7
13
115,8
71,2
45
6,3
25,6
44
120,9
50,6
85
527,5
96,5
72
21,5
89,7
60
16,0
37,4
81
13,3
28,5
78
12,2
41,0
60
5,5
96,5
03
6,9
40,3
74
-26,0
66,4
75
101,8
00,2
31
6,2
68,5
23
4,1
79,0
15
11,6
11,5
08
-1,4
46,5
82
2,0
89,5
08
--
25,5
95,1
36
32,2
39,7
20
19,4
13,9
19
13,4
49,5
71
935,6
53
5,7
36,5
66
12,8
25,8
01
-2,4
95,0
71
87,0
96,3
00
15,8
83,6
11
8,5
40,9
32
5,9
98,2
99
2,4
33,4
00
3,5
12,7
24
7,8
47,8
53
-5,2
05,3
60
49,4
22,1
79
853,1
61,2
50
477,4
36,7
99
676,4
87,7
76
5,5
98,7
46
50,1
83,3
47
227,5
86,3
54
1,1
74,3
80
886,3
91,7
60
3,1
78,0
20,4
11
36,7
30,5
65
18,5
75,6
45
16,9
03,4
39
-11,5
99,2
51
38,5
62,9
84
-53,8
73,6
83
176,2
45,5
65
965,8
73,4
29
544,1
83,7
91
737,7
79,1
71
21,2
08,8
59
78,0
74,9
73
295,8
52,8
74
1,1
74,3
80
974,0
32,3
49
3,6
18,1
79,8
22
--
--
-264,5
00
-211,6
00
476,1
00
--
--
-264,5
00
-211,6
00
476,1
00
122,4
85,1
22
65,3
08,3
01
77,3
47,2
60
40,4
80,8
79
45,4
90,3
33
182,6
67,9
12
10,9
32,3
06
2,1
07,6
58,8
96
2,6
52,3
71,0
08
122,4
85,1
22
65,3
08,3
01
77,3
47,2
60
40,4
80,8
79
45,4
90,3
33
182,6
67,9
12
10,9
32,3
06
2,1
07,6
58,8
96
2,6
52,3
71,0
08
6,4
28,7
97,8
67
4,3
53,9
65,6
76
6,2
99,4
54,9
48
1,6
08,1
22,1
51
1,6
51,1
66,9
54
4,5
48,7
22,6
37
1,0
88,9
62,5
64
12,7
62,1
02
,952
38,7
41,2
95
,744
Hou
sin
g U
nits
Collective
liv
ing q
ua
rters
Offi
ce B
uild
ing
Mark
et
Com
ple
x
Fac
tories
Sch
ool B
uildin
g
Hos
pital B
uild
ing
Oth
er
Build
ing
Rep
air &
Main
tena
nce
Gro
up
To
tal
Buildin
g
Reh
abili
tati
on
New
work
Rep
air &
Main
tena
nce
Gro
up
To
tal
Hig
hw
ay
Brid
ge
Culv
ert
Rep
air &
Main
tena
nce
Gro
up
To
tal
Brid
ge
Wate
r S
upp
ly
Dra
inage
Rep
air &
Main
tena
nce
Gro
up
To
tal
Wate
r supp
ly &
Dra
inage
Anic
ut
Slu
ices
Spill
Dam
Irriga
tion c
anal
Rep
air &
Main
tena
nce
Gro
up
To
tal
Irriga
tion &
Land
Dra
inage
Reta
inin
g w
all
Gro
up
To
tal
Dre
dgin
g &
Recla
mation
Oth
er
Cons
truction
Gro
up
To
tal
Oth
er
To
tal
Typ
e o
f C
on
stru
cti
on
Ac
tivit
yC
em
en
tS
an
dR
ub
le &
Me
tal
Bri
cks
Tim
be
rIr
on
& S
tee
l
Ro
ofi
ng
Ma
teri
al
Oth
er
Ra
w M
ate
ria
ls U
se
d (
Rs.)
To
tal

Survey of Construction Industries - 2013
- 14 -
Ta
ble
4.5
: Ra
w M
ate
rials C
on
sum
ed
Cla
ssified
by
Typ
e o
f Co
nstru
ctio
n A
ctiv
ity - 2
012
(Priv
ate
Se
cto
r)
66,5
28,8
02
31,2
15,5
92
24,1
18,3
16
23,4
26,7
44
49,3
11,2
69
42,2
42,8
98
18,3
21,5
66
52,3
81,2
57
307
,546,4
44
6,1
85,2
80
2,8
95,5
34
3,0
31,5
93
1,7
31,7
34
6,7
81,1
45
4,1
75,0
80
2,2
90,9
93
3,7
03,0
00
30,7
94,3
60
159
,651,1
47
86,8
86,8
38
73,4
80,6
13
63,9
60,9
88
75,5
36,9
26
141
,474,6
86
49,7
67,4
42
249
,014,7
42
899
,773,3
81
3,0
17,9
98
2,0
00,1
97
590
,189
992
,933
949
,661
3,7
82,9
64
0692
,794
12,0
26,7
36
4,4
96,5
00
3,0
32,3
87
1,0
28,7
73
1,1
52,0
56
138
,175
5,8
40,8
74
3,0
11,3
33
1,1
76,6
81
19,8
76,7
78
230
,794,2
89
90,0
57,3
46
70,7
82,0
67
40,5
55,2
45
47,8
69,8
45
57,7
49,6
60
42,8
49,5
03
122
,653,9
40
703
,311,8
96
87,0
24,5
15
37,6
52,7
60
10,8
34,5
97
26,1
45,8
99
21,8
25,4
34
170
,127,2
94
49,6
39,7
31
155
,189,0
32
558
,439,2
63
4,7
61,1
06
2,2
03,8
14
3,0
11,0
68
62,9
47,2
86
3,4
67,0
66
6,9
58,9
95
3,1
68,7
10
9,3
36,5
06
95,8
54,5
51
562
,459,6
37
255
,944,4
68
186
,877,2
16
220
,912,8
85
205
,879,5
21
432
,352,4
51
169
,049,2
78
594
,147,9
52
2,6
27,6
23,4
09
11,2
98,9
11
18,8
16,5
30
41,6
82,0
26
-623
,162
4,9
85,2
96
-29,8
88,5
00
107
,294,4
25
11,2
98,9
11
18,8
16,5
30
41,6
82,0
26
-623
,162
4,9
85,2
96
-29,8
88,5
00
107
,294,4
25
505
,962
205
,120
314
,517
-27,3
49
47,9
24,5
17
--
48,9
77,4
65
3,0
13,0
68
1,2
21,5
14
1,8
72,9
88
-162
,869
1,8
72,9
88
--
8,1
43,4
26
3,5
19,0
30
1,4
26,6
34
2,1
87,5
05
-190
,218
49,7
97,5
05
--
57,1
20,8
91
4,5
25,0
77
3,3
44,1
90
2,6
71,1
70
110
,159
-5,4
03,6
56
-1,0
22,4
19
17,0
76,6
70
4,5
25,0
77
3,3
44,1
90
2,6
71,1
70
110
,159
-5,4
03,6
56
-1,0
22,4
19
17,0
76,6
70
1,6
74,2
85
2,1
76,5
71
837
,143
-753
,428
837
,143
--
6,2
78,5
69
1,6
74,2
85
2,1
76,5
71
837
,143
-753
,428
837
,143
--
6,2
78,5
69
45,7
99,7
83
11,0
52,4
98
22,3
50,5
99
1,4
08,0
92
1,2
30,6
81
102
,875,0
37
1,4
80,1
10
1,8
02,6
74,4
16
1,9
88,8
71,2
17
45,7
99,7
83
11,0
52,4
98
22,3
50,5
99
1,4
08,0
92
1,2
30,6
81
102
,875,0
37
1,4
80,1
10
1,8
02,6
74,4
16
1,9
88,8
71,2
17
629
,276,7
23
292
,760,8
92
256
,605,6
59
222
,431,1
36
208
,677,0
10
596
,251,0
88
170
,529,3
88
2,4
27,7
33,2
87
4,8
04,2
65,1
81
Hou
sin
g U
nits
Colle
ctive
living q
uarte
rs
Offic
e B
uild
ing
Mark
et C
om
ple
x
Fac
torie
s
Sch
ool B
uild
ing
Oth
er B
uild
ing
Rep
air &
Main
tena
nce
Gro
up
To
tal
Bu
ildin
g
Reh
abilita
tion
Gro
up
To
tal
Hig
hw
ay
Brid
ge
Culve
rt
Gro
up
To
tal
Brid
ge
Wate
r Supp
ly
Gro
up
To
tal
Wa
ter su
pp
ly &
Dra
ina
ge
Rep
air &
Main
tena
nce
Gro
up
To
tal
Irriga
tion
& L
an
d
Dra
ina
ge
Oth
er C
ons
tructio
n
Gro
up
To
tal
Oth
er
To
tal
Typ
e o
f Co
nstru
ctio
n A
ctiv
ityC
em
en
tS
an
dR
ub
le &
Me
tal
Bric
ks
Tim
be
rIro
n &
Ste
el
Ro
ofin
g
Ma
teria
lO
the
r
Ra
w M
ate
rials U
se
d (R
s.)
To
tal

Survey of Construction Industries - 2013
- 15 -
Ta
ble
4.6
: R
aw
Ma
teri
als
Co
nsu
me
d C
lass
ifie
d b
y T
yp
e o
f C
on
stru
cti
on
Acti
vit
y -
201
2
(Pu
bli
c S
ecto
r)
99,9
37,4
00
42,8
00,7
19
48,4
84,5
42
50,3
53,1
15
60,7
02,1
16
124,7
83,8
96
32,1
77,5
52
75,4
63,7
70
534,7
03,1
10
90,4
38,0
31
34,6
22,7
77
42,7
78,0
32
58,7
25,8
74
62,2
74,6
13
165,3
35,4
92
43,0
26,8
94
194,3
48,5
95
691,5
50,3
07
690,1
52,6
83
363,9
54,6
00
188,5
56,0
56
266,2
29,6
90
232,5
08,1
29
737,7
26,1
55
233,6
49,0
09
1,6
27,5
31,3
34
4,3
40,3
07,6
56
165,6
44,5
55
174,7
02,6
68
119,3
37,0
89
61,3
27,1
09
38,1
61,1
44
234,9
52,3
81
84,1
63,2
44
780,6
75,4
67
1,6
58,9
63,6
57
7,3
48,1
21
18,9
77,5
28
22,3
16,9
37
11,7
44,0
01
4,2
32,0
00
43,8
60,5
63
6,5
85,0
98
42,9
17,0
73
157,9
81,3
20
294,8
82,2
58
137,8
00,0
57
117,3
97,2
67
143,0
57,8
95
170,1
85,5
04
339,6
79,1
20
121,6
87,8
34
230,4
12,3
24
1,5
55,1
02,2
59
158,9
74,0
42
83,7
63,4
35
35,4
45,9
06
57,0
25,1
18
59,1
68,8
82
184,9
81,4
11
65,5
87,8
07
634,1
92,5
89
1,2
79,1
39,1
91
359,3
00,7
46
213,9
13,5
90
124,3
01,2
91
156,0
79,4
21
137,6
28,9
75
242,0
86,2
64
104,1
50,9
86
537,7
42,2
14
1,8
75,2
03,4
87
149,3
40,2
04
91,7
34,4
35
76,1
85,4
32
60,0
89,6
62
168,7
49,4
19
128,8
99,5
41
109,4
39,7
03
466,9
73,5
07
1,2
51,4
11,9
03
2,0
16,0
18,0
40
1,1
62,2
69,8
09
774,8
02,5
52
864,6
31,8
85
933,6
10,7
82
2,2
02,3
04,8
23
800,4
68,1
27
4,5
90,2
56,8
73
13,3
44,3
62
,890
1,8
76,7
25,2
96
1,8
93,3
07,6
79
3,7
75,8
21,2
04
358,9
49,1
52
284,2
71,3
80
956,2
45,8
45
99,4
76,6
14
2,1
60,8
47,4
77
11,4
05,6
44
,648
182,9
87,8
76
112,3
59,6
00
283,5
95,0
11
85,6
19,7
08
30,2
67,7
08
103,4
62,7
83
663,3
66
104,3
16,1
13
903,2
72,1
66
191,7
58,6
44
85,2
10,4
73
152,7
18,6
85
7,0
54,4
64
11,0
96,3
15
61,6
43,5
78
872,8
50
1,1
81,0
37,2
77
1,6
91,3
92,2
86
2,2
51,4
71,8
16
2,0
90,8
77,7
52
4,2
12,1
34,9
00
451,6
23,3
24
325,6
35,4
03
1,1
21,3
52,2
06
101,0
12,8
30
3,4
46,2
00,8
67
14,0
00,3
09
,100
310,9
30,5
26
122,0
47,1
29
144,6
53,2
41
-21,4
04,7
37
95,0
14,3
09
-211,7
71,5
34
905,8
21,4
75
14,3
59,3
24
5,9
77,3
83
9,6
66,3
16
327,9
80
1,7
77,9
48
7,5
18,3
60
-5,3
01,9
82
44,9
29,2
93
55,6
43,3
96
19,8
30,9
52
44,6
24,3
78
-12,6
89,1
65
40,7
41,1
56
-681,6
81,7
13
855,2
10,7
60
380,9
33,2
46
147,8
55,4
64
198,9
43,9
35
327,9
80
35,8
71,8
50
143,2
73,8
25
-898,7
55,2
29
1,8
05,9
61,5
28
44,3
41,6
11
19,4
47,2
73
21,5
90,2
99
6,7
06,7
52
10,3
15,4
21
50,4
72,4
56
2,9
69,1
39
110,3
19,9
17
266,1
62,8
67
53,8
25,2
53
35,4
87,6
58
36,1
91,1
91
1,5
52,7
10
10,2
77,7
61
45,7
14,6
30
1,7
13,9
60
8,9
00,4
25
193,6
63,5
88
12,0
46,6
95
9,0
03,8
07
7,2
47,7
23
566,7
18
5,1
97,5
31
14,2
80,5
03
1,6
42,5
45
707,9
24
50,6
93,4
46
110,2
13,5
59
63,9
38,7
38
65,0
29,2
13
8,8
26,1
80
25,7
90,7
13
110,4
67,5
89
6,3
25,6
44
119,9
28,2
66
510,5
19,9
01
21,5
89,7
60
16,0
37,4
81
13,3
28,5
78
12,2
41,0
60
5,5
96,5
03
6,9
40,3
74
-26,0
66,4
75
101,8
00,2
31
6,2
68,5
23
4,1
79,0
15
11,6
11,5
08
-1,4
46,5
82
2,0
89,5
08
--
25,5
95,1
36
32,2
39,7
20
19,4
13,9
19
13,4
49,5
71
935,6
53
5,7
36,5
66
12,8
25,8
01
-2,4
95,0
71
87,0
96,3
00
15,8
83,6
11
8,5
40,9
32
5,9
98,2
99
2,4
33,4
00
3,5
12,7
24
7,8
47,8
53
-5,2
05,3
60
49,4
22,1
79
853,1
61,2
50
477,4
36,7
99
676,4
87,7
76
5,5
98,7
46
50,1
83,3
47
227,5
86,3
54
1,1
74,3
80
886,3
91,7
60
3,1
78,0
20,4
11
35,0
56,2
80
16,3
99,0
74
16,0
66,2
96
-10,8
45,8
23
37,7
25,8
41
-53,8
73,6
83
169,9
66,9
96
964,1
99,1
44
542,0
07,2
20
736,9
42,0
28
21,2
08,8
59
77,3
21,5
45
295,0
15,7
31
1,1
74,3
80
974,0
32,3
49
3,6
11,9
01,2
53
--
--
-264,5
00
-211,6
00
476,1
00
--
--
-264,5
00
-211,6
00
476,1
00
76,6
85,3
39
54,2
55,8
03
54,9
96,6
60
39,0
72,7
86
44,2
59,6
52
79,7
92,8
75
9,4
52,1
96
304,9
84,4
79
663,4
99,7
91
76,6
85,3
39
54,2
55,8
03
54,9
96,6
60
39,0
72,7
86
44,2
59,6
52
79,7
92,8
75
9,4
52,1
96
304,9
84,4
79
663,4
99,7
91
5,7
99,5
21,1
44
4,0
61,2
04,7
87
6,0
42,8
49,2
88
1,3
85,6
91,0
14
1,4
42,4
89,9
45
3,9
52,4
71,5
49
918,4
33,1
77
10,3
34,3
69
,663
33,9
37,0
30
,563
Hou
sin
g U
nits
Collective
liv
ing q
ua
rters
Offi
ce B
uild
ing
Mark
et
Com
ple
x
Fac
tories
Sch
ool B
uildin
g
Hos
pital B
uild
ing
Oth
er
Build
ing
Rep
air &
Main
tena
nce
Gro
up
To
tal
Bu
ild
ing
Reh
abili
tati
on
New
work
Rep
air &
Main
tena
nce
Gro
up
To
tal
Hig
hw
ay
Brid
ge
Culv
ert
Rep
air &
Main
tena
nce
Gro
up
To
tal
Bri
dg
e
Wate
r S
upp
ly
Dra
inage
Rep
air &
Main
tena
nce
Gro
up
To
tal
Wa
ter
sup
ply
&
Dra
ina
ge
Anic
ut
Slu
ices
Spill
Dam
Irriga
tion c
anal
Rep
air &
Main
tena
nce
Gro
up
To
tal
Irri
ga
tio
n &
La
nd
Dra
ina
ge
Reta
inin
g w
all
Gro
up
To
tal
Dre
dg
ing
& R
ecla
ma
tio
n
Oth
er
Cons
truction
Gro
up
To
tal
Oth
er
To
tal
Type
of C
on
str
uctio
n A
ctivi
tyC
em
ent
San
dR
ub
le &
Me
tal
Bric
ks
Tim
ber
Iron &
Ste
el
Roo
fing
Mate
rial
Oth
er
Ra
w M
ate
ria
ls U
se
d (
Rs.
)
Tota
l

Survey of Construction Industries - 2013
- 16 -
Table 4.7 : Average No. of Employees and Sa laries Classified by Type of Construction Activity - 2012
(All Sectors)
28,487 177,635,329 164 18,309,625
2,148 119,869,457 217 16,827,409
6,306 976,345,306 402 26,972,570
3,185 243,563,092 69 34,069,430
85 22,770,967 - -
4,777 533,619,562 227 41,894,924
2,481 225,975,843 227 78,056,163
8,533 430,874,425 1,317 17,164,498
4,396 352,070,417 101 8,130,743
60,398 3,082,724,398 2,724 241,425,362
7,782 1,488,819,298 1,037 143,049,022
2,582 160,014,301 85 6,432,640
13,188 302,130,774 74 2,909,500
23,552 1,950,964,373 1,196 152,391,162
1,598 123,266,641 127 6,678,625
450 28,358,785 11 103,155
979 90,929,337 899 85,919,178
3,027 242,554,763 1,037 92,700,958
841 58,153,311 58 673,153
333 51,072,554 - -
1,672 15,149,190 - -
2,846 124,375,055 58 673,153
397 31,747,935 - -
122 9,204,600 - -
106 11,270,959 26 4,284,900
391 16,293,200 11 169,280
2,973 937,809,925 169 54,473,458
6,687 89,912,739 63 19,498,940
10,676 1,096,239,358 269 78,426,578
21 126,960 - -
21 126,960 - -
4,761 488,212,793 190 174,594
4,761 488,212,793 190 174,594
105,281 6,985,197,700 5,474 565,791,807
Housing Units
Collective living quarters
Office Building
Market Complex
Factories
School Building
Hospital Building
Other Building
Repair & Maintenance
Group Tota l
Building
Rehabilitation
New work
Repair & Maintenance
Group Tota l
Highway
Bridge
Culvert
Repair & Maintenance
Group Tota l
Bridge
Water Supply
Drainage
Repair & Maintenance
Group Tota l
Water supply &
Dra inage
Anicut
Sluices
Spil l
Dam
Irrigation canal
Repair & Maintenance
Group Tota l
Irrigation & Land
Dra inage
Retaining wall
Group Tota l
Dredging & Reclamation
Other Construction
Group Tota l
Other
Tota l
Type of Construction Activity
Male
Employees
(No.)
Sala ries for
Male
Employees
Female
Employees
(No.)
Sala ries for
Female
Employees
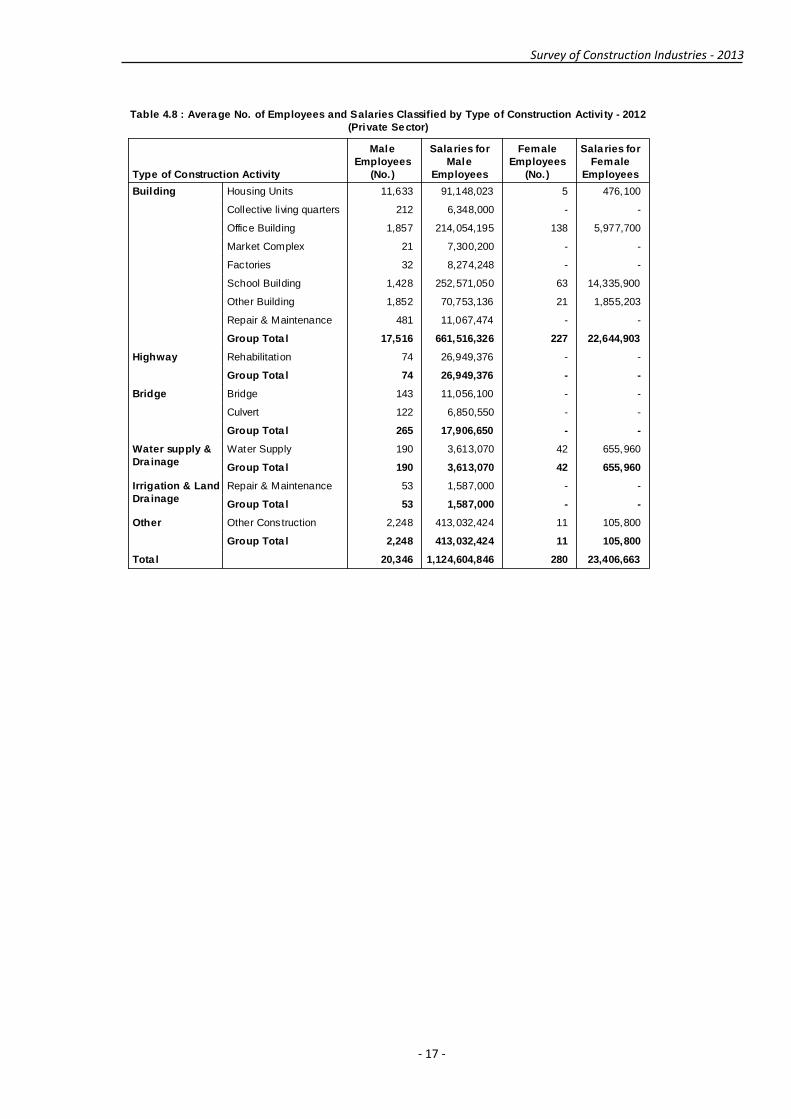
Survey of Construction Industries - 2013
- 17 -
Table 4.8 : Average No. of Employees and Salaries Classified by Type of Construction Activi ty - 2012
(Private Sector)
11,633 91,148,023 5 476,100
212 6,348,000 - -
1,857 214,054,195 138 5,977,700
21 7,300,200 - -
32 8,274,248 - -
1,428 252,571,050 63 14,335,900
1,852 70,753,136 21 1,855,203
481 11,067,474 - -
17,516 661,516,326 227 22,644,903
74 26,949,376 - -
74 26,949,376 - -
143 11,056,100 - -
122 6,850,550 - -
265 17,906,650 - -
190 3,613,070 42 655,960
190 3,613,070 42 655,960
53 1,587,000 - -
53 1,587,000 - -
2,248 413,032,424 11 105,800
2,248 413,032,424 11 105,800
20,346 1,124,604,846 280 23,406,663
Housing Units
Collective living quarters
Office Building
Market Complex
Factories
School Building
Other Building
Repair & Maintenance
Group Tota l
Building
Rehabilitation
Group Tota l
Highway
Bridge
Culvert
Group Tota l
Bridge
Water Supply
Group Tota l
Water supply &
Dra inage
Repair & Maintenance
Group Tota l
Irrigation & Land
Dra inage
Other Construction
Group Tota l
Other
Tota l
Type of Construction Activity
Male
Employees
(No.)
Sala ries for
Male
Employees
Female
Employees
(No.)
Sala ries for
Female
Employees

Survey of Construction Industries - 2013
- 18 -
Table 4.9 : Average No. of Employees and Sa laries Classified by Type of Construction Activity - 2012
(Public Se ctor)
16,854 86,487,306 159 17,833,525
1,936 113,521,457 217 16,827,409
4,449 762,291,111 265 20,994,870
3,163 236,262,892 69 34,069,430
53 14,496,719 - -
3,349 281,048,512 164 27,559,024
2,481 225,975,843 227 78,056,163
6,681 360,121,288 1,296 15,309,295
3,915 341,002,943 101 8,130,743
42,881 2,421,208,072 2,498 218,780,459
7,708 1,461,869,922 1,037 143,049,022
2,582 160,014,301 85 6,432,640
13,188 302,130,774 74 2,909,500
23,477 1,924,014,997 1,196 152,391,162
1,455 112,210,541 127 6,678,625
328 21,508,235 11 103,155
979 90,929,337 899 85,919,178
2,761 224,648,113 1,037 92,700,958
651 54,540,241 16 17,193
333 51,072,554 - -
1,672 15,149,190 - -
2,656 120,761,985 16 17,193
397 31,747,935 - -
122 9,204,600 - -
106 11,270,959 26 4,284,900
391 16,293,200 11 169,280
2,973 937,809,925 169 54,473,458
6,634 88,325,739 63 19,498,940
10,622 1,094,652,358 269 78,426,578
21 126,960 - -
21 126,960 - -
2,513 75,180,369 180 68,794
2,513 75,180,369 180 68,794
84,931 5,860,592,853 5,196 542,385,144
Housing Units
Collective living quarters
Office Building
Market Complex
Factories
School Building
Hospital Building
Other Building
Repair & Maintenance
Group Tota l
Building
Rehabilitation
New work
Repair & Maintenance
Group Tota l
Highway
Bridge
Culvert
Repair & Maintenance
Group Tota l
Bridge
Water Supply
Drainage
Repair & Maintenance
Group Tota l
Water supply &
Dra inage
Anicut
Sluices
Spil l
Dam
Irrigation canal
Repair & Maintenance
Group Tota l
Irrigation & Land
Dra inage
Retaining wall
Group Tota l
Dredging & Reclamation
Other Construction
Group Tota l
Other
Tota l
Type of Construction Activity
Male
Employees
(No.)
Sala ries for
Male
Employees
Female
Employees
(No.)
Sala ries for
Female
Employees

Survey of Construction Industries - 2013
- 19 -
Ta
ble
4.1
1:
So
me
Se
lec
ted
In
dic
ato
rs o
f C
on
stru
cti
on
Acti
vit
ies
Cla
ssif
ied
by V
alu
e o
f W
ork
Do
ne
Siz
e C
lass
- 2
012
(Pri
va
te S
ecto
r)
48
5,3
89,0
87
4,8
60,0
87
2,9
21,0
48
1,9
39,0
39
2,2
49,2
18
89,9
30
581,9
00
159
703,5
70
16
5,5
55,0
29
5,5
55,0
29
3,2
33,4
60
2,3
21,5
69
1,7
78,7
10
01,4
54,7
50
95
1,3
54,2
40
53
47,7
80,1
74
35,0
31,2
74
22,5
40,7
38
12,4
90,5
36
18,6
92,6
59
3,8
48,0
78
0450
8,2
77,5
28
339
1,8
01,2
75,4
33
1,4
23,9
05,2
11
961,3
57,7
15
462,5
47,4
96
858,8
98,7
94
67,5
24,1
42
34,9
34,7
79
15,3
41
233,0
80,3
31
79
4,3
19,6
44,0
11
2,3
20,3
11,0
78
1,5
61,3
02,5
71
759,0
08,5
07
1,1
79,1
30,2
88
248,4
06,3
76
133,7
65,9
08
2,1
00
375,2
79,4
56
42
8,2
09,2
85,7
54
6,8
27,8
07,6
60
4,4
75,2
11,5
54
2,3
52,5
96,1
07
2,7
43,5
15,5
11
965,1
38,0
44
766,5
57,9
98
2,4
81
529,3
16,3
84
577
14,3
88,9
29
,489
10,6
17,4
70
,340
7,0
26,5
67,0
85
3,5
90,9
03,2
55
4,8
04,2
65,1
80
1,2
85,0
06,5
70
937,2
95,3
35
20,6
26
1,1
48,0
11,5
08
less
th
an
250,0
00
250,0
00 -
499,9
99
500,0
00 -
999,9
99
1,0
00,0
00 -
14,9
99
,999
15,0
00,0
00
- 4
9,9
99,9
99
50,0
00,0
00
& a
bo
ve
To
tal
Va
lue
of
Wo
rk D
on
e S
ize
Cla
ss
(Rs.
)
No
. o
f
Acti
vit
ies
To
tal
Va
lue
of
Co
ntr
act
(Rs.
)
Va
lue
of
Wo
rk
Do
ne
(R
s.)
Inp
ut
(Rs.
)
Va
lue
Ad
de
d
(Rs.
)
Ra
w M
ate
ria
ls
Co
nsu
me
d
(Rs.
)
Va
lue
of
Se
rvic
es
(Rs.
)
Va
lue
of
Su
bco
ntr
act
(Rs.
)
Ave
rag
e N
o.
of
Em
plo
ye
es
Sa
lari
es
for
Em
plo
ye
es
(Rs.
)
Ta
ble
4.1
0 :
So
me
Se
lecte
d I
nd
ica
tors
of
Co
nst
ruc
tio
n A
cti
vit
ies C
lass
ifie
d b
y V
alu
e o
f W
ork
Do
ne
Siz
e C
lass
- 2
012
(All
Se
cto
rs)
175
1,5
76,9
70,6
89
19,6
81,3
03
13,5
39,5
42
6,1
41,7
61
9,9
61,5
56
907
,288
2,6
70,6
98
460
2,7
38,1
04
169
2,2
22,2
96,5
88
61,1
84,2
35
38,7
20,7
95
22,4
63,4
40
27,8
54,5
98
3,8
18,6
87
7,0
47,5
10
1,2
17
11,8
46,5
58
291
4,5
89,9
32,9
32
197
,781,2
93
127
,709,0
30
67,3
60,1
70
98,5
12,6
38
22,6
93,2
59
6,5
03,1
33
2,9
89
39,6
71,7
43
2,3
06
16,0
18,7
07
,529
10,7
76,0
50
,098
7,0
96,2
89,7
60
3,5
62,7
82,9
38
6,0
77,5
88,2
20
523
,735,9
46
494
,965,5
93
60,2
85
1,7
86,9
50,0
37
582
30,9
89,3
49
,222
15,7
39,4
14
,027
10,1
71,9
23
,435
5,1
02,5
11,2
95
7,9
34,3
41,3
19
1,4
43,9
32,7
01
793
,649,4
16
18,0
02
2,5
20,3
89,0
81
386
191
,432,3
11,8
22
86,6
35,7
08
,821
40,9
80,3
18
,415
42,2
96,6
92
,635
24,5
93,0
37
,411
9,9
76,2
44,9
41
6,4
11,0
36,0
63
27,7
99
3,1
89,3
93,9
83
3,9
09
246
,829,5
68,7
82
113
,429,8
19,7
77
58,4
28,5
00
,977
51,0
57,9
52
,240
38,7
41,2
95
,742
11,9
71,3
32
,822
7,7
15,8
72,4
13
110
,751
7,5
50,9
89,5
06
less
th
an
250,0
00
250
,000 -
499,9
99
500
,000 -
999,9
99
1,0
00,0
00 -
14,9
99
,999
15,0
00,0
00
- 4
9,9
99,9
99
50,0
00,0
00
& a
bo
ve
To
tal
Va
lue
of
Wo
rk D
on
e S
ize
Cla
ss
(Rs.
)
No
. o
f
Acti
vit
ies
To
tal
Va
lue
of
Co
ntr
act
(Rs.
)
Va
lue
of
Wo
rk
Do
ne
(R
s.)
Inp
ut
(Rs.
)
Va
lue
Ad
de
d
(Rs.
)
Ra
w M
ate
ria
ls
Co
nsu
me
d (
Rs.
)
Va
lue
of
Se
rvic
es
(Rs.
)
Va
lue
of
Su
bco
ntr
act
(Rs.
)
Ave
rag
e N
o.
of
Em
plo
ye
es
Sa
lari
es
for
Em
plo
ye
es
(Rs.
)

Survey of Construction Industries - 2013
- 20 -
Ta
ble
4.1
2 : S
om
e S
ele
cte
d In
dic
ato
rs o
f Co
nstru
ctio
n A
ctiv
ities C
lassifie
d b
y V
ale
of W
ork
Do
ne
Siz
e C
lass - 2
01
2
(Pu
blic
Se
cto
r)
127
1,5
71,5
81,6
02
14,8
21,2
16
10,6
18,4
94
4,2
02,7
22
7,7
12,3
38
817,3
58
2,0
88,7
98
302
2,0
34,5
34
153
2,2
16,7
41,5
59
55,6
29,2
06
35,4
87,3
35
20,1
41,8
71
26,0
75,8
89
3,8
18,6
87
5,5
92,7
60
1,1
21
10,4
92,3
18
238
4,5
42,1
52,7
58
162,7
50,0
19
105,1
68,2
92
54,8
69,6
34
79,8
19,9
78
18,8
45,1
81
6,5
03,1
33
2,5
39
31,3
94,2
16
1,9
68
14,2
17,4
32,0
95
9,3
52,1
44,8
88
6,1
34,9
32,0
45
3,1
00,2
35,4
42
5,2
18,6
89,4
26
456,2
11,8
05
460,0
30,8
14
44,9
44
1,5
53,8
69,7
06
503
26,6
69,7
05,2
11
13,4
19,1
02,9
48
8,6
10,6
20,8
64
4,3
43,5
02,7
88
6,7
55,2
11,0
31
1,1
95,5
26,3
25
659,8
83,5
08
15,9
02
2,1
45,1
09,6
26
344
183,2
23,0
26
,068
79,8
07,9
01,1
61
36,5
05,1
06,8
62
39,9
44,0
96,5
28
21,8
49,5
21,9
00
9,0
11,1
06,8
97
5,6
44,4
78,0
65
25,3
18
2,6
60,0
77,5
98
3,3
33
232,4
40,6
39
,293
102,8
12,3
49
,437
51,4
01,9
33,8
92
47,4
67,0
48,9
85
33,9
37,0
30,5
62
10,6
86,3
26,2
53
6,7
78,5
77,0
78
90,1
26
6,4
02,9
77,9
98
less
tha
n 2
50,0
00
250,0
00 - 4
99,9
99
500,0
00 - 9
99,9
99
1,0
00,0
00 - 1
4,9
99
,999
15,0
00,0
00 - 4
9,9
99,9
99
50,0
00,0
00 &
ab
ov
e
To
tal
Va
lue
of W
ork
Do
ne
Siz
e C
lass
(Rs.)
No
. of
Activ
ities
To
tal V
alu
e o
f
Co
ntra
ct (R
s.)
Va
lue
of W
ork
Do
ne
(Rs.)
Inp
ut (R
s.)
Va
lue
Ad
de
d
(Rs.)
Ra
w M
ate
rials
Co
nsu
me
d (R
s.
)
Va
lue
of
Se
rvic
es (R
s.)
Va
lue
of
Su
bco
ntra
ct
(Rs.)
Ave
rag
e N
o.
of E
mp
loye
es
Sa
larie
s for
Em
plo
ye
es
(Rs.)
Ta
ble
4.1
3 : M
ate
rials
Use
d C
lassifie
d b
y V
alu
e o
f Wo
rk D
on
e S
ize
Cla
ss - 2
01
2
(All S
ecto
rs)
175
1,8
48,9
50
755,7
98
761,8
08
1,1
81,6
22
376,3
57
1,7
27,6
93
463,0
60
2,8
46,2
69
9,9
61,5
56
169
3,6
22,7
61
2,6
25,0
41
2,4
11,2
24
4,1
64,9
39
2,6
99,3
65
3,8
09,2
81
1,0
84,4
50
7,4
37,5
36
27,8
54,5
98
291
17,8
93,9
12
10,7
01,0
30
13,3
23,9
44
4,3
17,5
39
9,7
24,0
78
13,3
69,1
93
8,1
26,1
44
21,0
56,7
98
98,5
12,6
38
2,3
06
1,2
49,9
93,4
03
655,6
74,2
49
674,5
73,9
67
449,6
26,2
11
579,6
53,0
86
942,6
06,8
26
363,1
26,9
86
1,1
62,3
33,4
92
6,0
77,5
88,2
20
582
1,4
23,6
14,9
44
808,4
53,4
12
1,0
87,7
64,9
42
443,5
38,9
32
448,0
28,8
88
1,2
35,7
32,1
89
298,2
70,5
15
2,1
88,9
37,4
96
7,9
34,3
41,3
19
386
3,7
31,8
23,8
94
2,8
75,7
56,1
47
4,5
20,6
19,0
64
705,2
92,9
06
610,6
85,1
80
2,3
51,4
77,4
53
417,8
91,4
11
9,3
79,4
91,3
57
24,5
93,0
37
,411
3,9
09
6,4
28,7
97,8
65
4,3
53,9
65,6
76
6,2
99,4
54,9
49
1,6
08,1
22,1
49
1,6
51,1
66,9
54
4,5
48,7
22,6
35
1,0
88,9
62,5
65
12,7
62,1
02
,948
38,7
41,2
95
,742
less
than 2
50,0
00
250,0
00 - 4
99,9
99
500,0
00 - 9
99,9
99
1,0
00,0
00 - 1
4,9
99
,999
15,0
00,0
00
- 49,9
99,9
99
50,0
00,0
00
& a
bove
Tota
l
Va
lue
of W
ork
Do
ne
Siz
e C
lass (R
s.)
No
. of
Activ
ities
Ce
me
nt
Sa
nd
Ru
ble
&
Me
tal
Bric
ks
Tim
be
rIro
n &
Ste
el
Ro
ofin
g
Ma
teria
lO
the
rT
ota
l
Ra
w M
ate
ria
ls U
se
d (R
s.)

Survey of Construction Industries - 2013
- 21 -
Table 14 : Value of Contract for New Building by Floor Area of the Building - 2012
(All Sectors)
1,085 21,335,130
4,086 10,357,885
7,100 41,609,613
14,315 60,350,000
566,476 1,189,148,969
593,062 1,322,801,597
less than 500
500 - 999
1000 - 1499
1500 - 1999
2000 & above
Tota l
Floor Area Size
Class (Sq. feet)
Floor Area of the
Building (Sq. feet)
Value of Contract for New
Building (Rs.)
Table 14: Value of Contracts for new Building by Floor Area of the Building – 2012 (All Sectors)

Survey of Construction Industries - 2013
- 22 -

Survey of Construction Industries - 2013
- 23 -
Printed by: Printing Division
Department of Census and Statistics


![Department of Census and Statistics - Sri Lanka The Development of Central Survey Catalogue – Department of Census and Statistics [DCS] SRI LANKA Presented](https://img.pdfslide.net/doc/110x75/56649e9d5503460f94b9ed39/department-of-census-and-statistics-sri-lanka-the-development-of-central.jpg)