Embed Size (px)
Citation preview
OPTIMAT BLADES
Final Report on Tube Testing
OB_TG2_R038 rev. 0
TG 2
Christoph Kensche, DLR Stuttgart

OB_TG2_R038 rev.0
OPTIMAT BLADES Page 2 of 23
Last saved 19.06.2006 14:11
Change record
Issue/revision date Pages Summary of changes 0 18-Jun-06 all New document

OB_TG2_R038 rev.0
OPTIMAT BLADES Page 3 of 23
Last saved 19.06.2006 14:11
Table of contents 1 Introduction ........................................................................................................ 4 2 Materials ............................................................................................................. 4 3 Laminating process ........................................................................................... 4 4 Geometry of specimens .................................................................................... 4 5 Test program ...................................................................................................... 9
5.1 Test program..............................................................................................................9 5.2 Test equipment ..........................................................................................................9 5.3 Testing conditions ....................................................................................................11 5.4 Testing procedures ..................................................................................................11
6 Results .............................................................................................................. 11 6.1 Torsion tests at DLR ................................................................................................11
6.1.1 Static tests ........................................................................................................11 6.1.2 Fatigue tests on tubes with steep overlap drop ................................................12 6.1.3 Fatigue tests on tubes with turned down steep overlap drop ...........................12 6.1.4 Fatigue tests on tubes with tapered overlap drop.............................................13 6.1.5 NDT-observations at DLR with thermo camera ................................................14
6.2 Torsion and tension / compression tests at the IFB/University Stuttgart .................15 6.2.1 Static tests with torsion and tension / compression ..........................................15 6.2.2 Fatigue tests with torsion and tension / compression .......................................18
6.3 Comparison of pure torsion and the combination of torsion with axial loading ........20 6.4 Measurements of glass fibre content and glass transition point ..............................22
7 Summary and Conclusions............................................................................. 23 8 References........................................................................................................ 23 9 Acknowledgement ........................................................................................... 23

OB_TG2_R038 rev.0
OPTIMAT BLADES Page 4 of 23
Last saved 19.06.2006 14:11
1 Introduction This report describes the static and fatigue tests on tubular specimens accomplished within Task Group 2 of the ‘OPTIMAT BLADES’ project at the laboratories of the DLR and (in sub-contract) of the IFB (Institut fuer Flugzeugbau) of the University of Stuttgart and illustrates its basic results. The tests have been performed during the Phase 1 of the 52-month project in two campaigns: pure torsion tests at the DLR and a combination of torsion and ten-sion/compression tests at the IFB. The pure torsion tests of the tubes with a ±45° lay-up shall give information on the fatigue behav-iour in the centre line of the shear webs of a rotor blade spar beam which also have a ±45° lay-up. The combined torsion and tension/compression tests on the tubes simulate the different loadings in the web fibres near the transition to the spar caps which occur due to the superposition of the strains in the spar caps resulting from bending of the transversely loaded spar beam and the strains in the webs due to shear loads.
2 Materials The reference material of the glass fibre reinforcement (Combi 1250) was supplied by LM Glasfiber A/S for the project. It is a biaxial material made of non-woven glass rovings from PPG. The build-up consists of two layers arranged in +45° and -45° direction and stitched together with a polyester yarn. For infusion of the reference material, the epoxy resin Prime 20 with slow hardener from SP Systems was used. Detailed information about the materials is given in [1].
3 Laminating process The glass mat was wrapped under an angle of 45° to the fibre direction two times around a steel mandrel with an overlap of ±10 mm. For the first specimens, the mat was cut perpen-dicular at the ends resulting in a steep overlap drop. Later, the specimens have got two ta-pered overlaps (inner and outer) of ±12-15 mm. The dry glass package was injected with the resin by the use of resin by vacuum assisted resin transfer moulding (VARTM) technique. After initial curing at room temperature the tubes were generally post-cured at 80°C for 4 hours. As an exemption, some specimens at the end of the project were post-cured differ-ently, see Table 2, specimens No.37-42. The thickness of the laminate in the non-overlap area was 1 mm. The tubes were generally named S02. For specific numbering see Tables 1 and 2 and the OPTIDAT-data base [2].
4 Geometry of specimens In general, one type of geometry was used for the tubular specimens. It is shown in Figure 1. The diameter of the tabs was adjusted by LM for the two different testing machines used at DLR and the IFB. At DLR only specimens with a tab-diameter of 32 mm were possible, at the IFB the minimum possible diameter of the tabs was 33 mm.

OB_TG2_R038 rev.0
OPTIMAT BLADES Page 5 of 23
Last saved 19.06.2006 14:11
±45°
100
170
28
32
±45°
100
170
28
32 / 33
35 35
Figure 1: Geometry of the tube specimens for OPTIMAT BLADES, tab diameters 32 and 33 mm according to possible gripping of test machines at DLR and IFB
During the tests some modifications were carried out for optimization of the shape of the overlap. The steep overlap drop mentioned before was fabricated at first. The total overlap was about 24 to 30 mm. Detailed drawings are shown in Figure 5. The yellow colour repre-sents the 45°-orientation of one single layer, the green colour the perpendicular orientation of the other single layer of the Combi 1250.
Figure 2: Tubular specimens with steep overlap drop, overlap about ±10 mm
Because in fatigue testing delaminations were found in the steep overlap which were referred to interlaminar stress concentrations at the meridian end of the drop first modifications were made by cautiously turning down the drop which, however, caused also injures in the outer fibres at the other drop formed by the inner end of the overlap. This resulted in early failure in some of the specimens what was not tolerable. Figure 3 shows the problem in detail. The lines which are marked in red represent the areas of injured fibres.
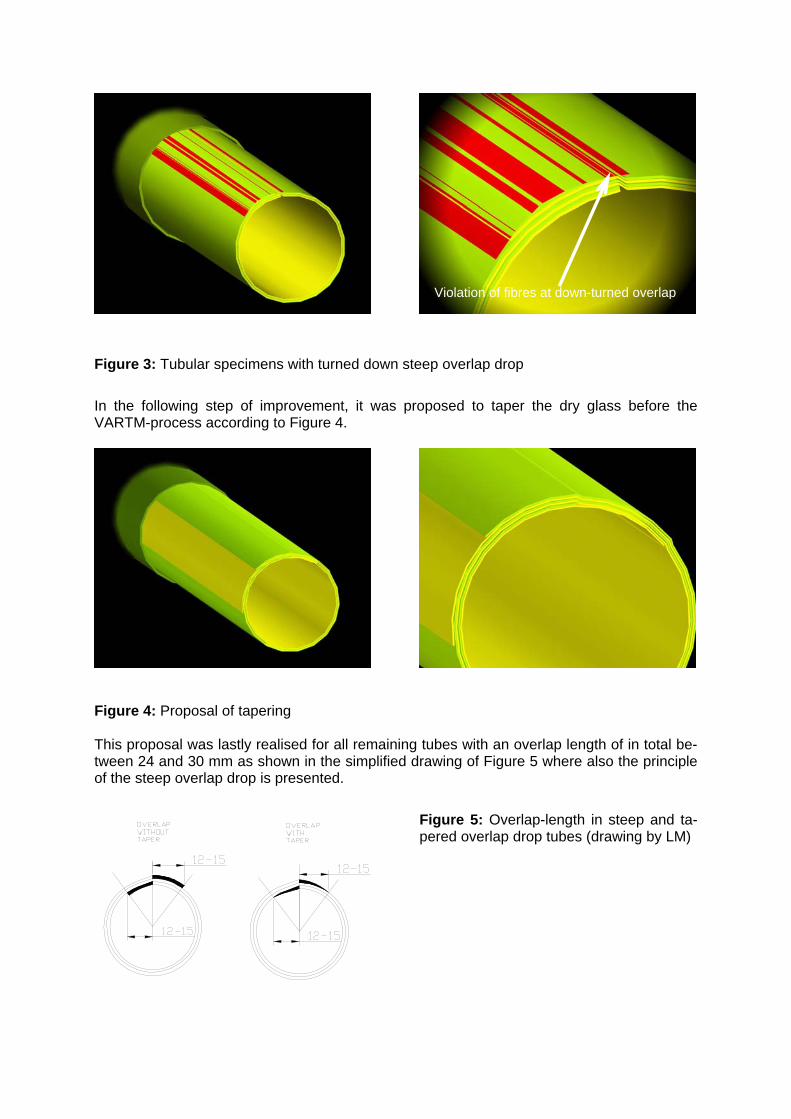
Figure 3: Tubular specimens with turned down steep overlap drop
In the following step of improvement, it was proposed to taper the dry glass before the VARTM-process according to Figure 4.
Figure 4: Proposal of tapering This proposal was lastly realised for all remaining tubes with an overlap length of in total be-tween 24 and 30 mm as shown in the simplified drawing of Figure 5 where also the principle of the steep overlap drop is presented.
Figure 5: Overlap-length in steep and ta-pered overlap drop tubes (drawing by LM)
Violation of fibres at down-turned overlap

OB_TG2_R038 rev.0
OPTIMAT BLADES Page 7 of 23
Last saved 19.06.2006 14:11
The Tables 1 and 2 give an overview of the overlap type of the tube specimens produced and delivered by LM and tested at DLR in pure torsion and at the IFB in torsion an tension / compression. Additionally, in Table 2 the specimens with another post-curing procedure are specified. OPTIMAT/FACT name Test-Lab Manner of overlap Test type R Tubes-_0200_0001 DLR steep overlap drop, foam core TUM Tubes-_0200_0002 DLR steep overlap drop, foam core TUM Tubes-_0200_0003 DLR steep overlap drop, foam core TUM Tubes-_0200_0004 DLR steep overlap drop TUCA -1 GEV215_S0232_0001 DLR steep overlap drop TUCA -1 GEV215_S0232_0002 DLR steep overlap drop TUCA -1 GEV215_S0232_0003 DLR steep overlap drop TUCA -1 GEV215_S0232_0004 DLR steep overlap drop TUCA -1 GEV215_S0232_0005 DLR steep overlap drop TUCA -1
GEV215-S1100-020-32m/m DLR steep overlap drop turned down TUCA -1
GEV215-S1100-021-32m/m DLR steep overlap drop turned down TUCA -1
GEV215-S1100-022-32m/m DLR steep overlap drop turned down TUCA -1
GEV215-S1100-023-32m/m DLR steep overlap drop turned down TUCA -1 GEV215_S0242_0031 DLR tapered overlap 20 mm TUCA -1 GEV215_S0242_0032 DLR tapered overlap 20 mm TUCA -1 GEV215_S0242_0033 DLR tapered overlap 12-15 mm TUCA -1 GEV215_S0242_0034 DLR tapered overlap 12-15 mm TUCA -1 GEV215_S0242_0035 DLR tapered overlap 12-15 mm TUCA -1 GEV215_S0242_0036 DLR tapered overlap 12-15 mm TUCA -1 GEV215_S0242_0037 DLR tapered overlap 12-15 mm TUCA -1 GEV215_S0242_0038 DLR tapered overlap 12-15 mm TUCA -1 GEV215_S0242_0039 DLR tapered overlap 12-15 mm TUCA -1 GEV215_S0242_0040 DLR tapered overlap 12-15 mm TUCA -1 GEV215_S0242_0041 DLR tapered overlap 12-15 mm TUCA -1 GEV215_S0242_0042 DLR tapered overlap 12-15 mm TUCA -1 GEV215_S0242_0043 DLR tapered overlap 12-15 mm TUCA -1 GEV215_S0232_0044 DLR tapered overlap 12-15 mm TUCA -1 GEV215_S0232_0045 DLR tapered overlap 12-15 mm TUCA -1 GEV215_S0232_0046 DLR tapered overlap 12-15 mm TUCA -1 GEV215_S0232_0047 DLR tapered overlap 12-15 mm TUCA -1 GEV215_S0232_0048 DLR tapered overlap 12-15 mm TUCA -1
TUCA: Fatigue on Tubular specimen TUST: Static test on tubular specimen TUM: Tubular specimen subjected to static moment only TUSTM: Tubular specimen subjected to static axial load and moment Table 1: Overview of the overlap type of the tube specimens produced and tested at DLR (pure torsion)

OB_TG2_R038 rev.0
OPTIMAT BLADES Page 8 of 23
Last saved 19.06.2006 14:11
OPTIMAT/FACT name Test-Lab manner of overlap, other post-curing Test type RGEV215_S0232_0006 IFB steep overlap drop, foam core TUSTM GEV215_S0232_0007 IFB steep overlap drop, foam core TUSTM GEV215_S0232_0008 IFB steep overlap drop, foam core TUSTM GEV215_S0232_0009 IFB steep overlap drop, foam core TUSTM GEV215_S0232_0010 IFB steep overlap drop, foam core no test GEV215_S0232_0011 IFB steep overlap drop, foam core TUSTM GEV215_S0232_0012 IFB steep overlap drop, foam core TUSTM GEV215_S0232_0013 IFB steep overlap drop, foam core TUSTM GEV215_S0232_0014 IFB steep overlap drop, foam core TUSTM GEV215_S0232_0015 IFB steep overlap drop, foam core TUSTM GEV215_S0233_0001 IFB tapered overlap 12-15 mm TUM GEV215_S0233_0002 IFB tapered overlap 12-15 mm TUST GEV215_S0233_0003 IFB tapered overlap 12-15 mm TUM GEV215_S0233_0004 IFB tapered overlap 12-15 mm TUCA -1 GEV215_S0233_0005-13 IFB tapered overlap 12-15 mm no test GEV215_S0243_0014 IFB tapered overlap 12-15 mm TUCA -1 GEV215_S0243_0015 IFB tapered overlap 12-15 mm TUCA -1 GEV215_S0243_0016 IFB tapered overlap 12-15 mm TUCA -1 GEV215_S0243_0017 IFB tapered overlap 12-15 mm TUCA -1 GEV215_S0233_0018 IFB tapered overlap 12-15 mm TUCA -1 GEV215_S0233_0019 IFB tapered overlap 12-15 mm TUCA -1 GEV215_S0233_0020 IFB tapered overlap 12-15 mm TUCA -1 GEV215_S0233_0021 IFB tapered overlap 12-15 mm TUCA -1 GEV215_S0233_0022 IFB tapered overlap 12-15 mm TUCA -1 GEV215_S0233_0023 IFB tapered overlap 12-15 mm TUCA -1 GEV215_S0233_0024 IFB tapered overlap 12-15 mm TUCA -1 GEV215_S0233_0025 IFB tapered overlap 12-15 mm TUCA -1 GEV215_S0233_0026 IFB tapered overlap 12-15 mm TUCA -1 GEV215_S0233_0027 IFB tapered overlap 12-15 mm TUCA -1 GEV215_S0233_0028 IFB tapered overlap 12-15 mm TUCA -1 GEV215_S0233_0029 IFB tapered overlap 12-15 mm TUCA -1 GEV215_S0233_0030 IFB tapered overlap 12-15 mm TUCA -1 GEV215_S0233_0031 IFB tapered overlap 12-15 mm TUCA -1 GEV215_S0243_0033 IFB tapered overlap 12-15 mm TUCA -1 GEV215_S0243_0034 IFB tapered overlap 12-15 mm TUCA -1 GEV215_S0243_0035 IFB tapered overlap 12-15 mm no test GEV215_S0243_0036 IFB tapered overlap 12-15 mm no test GEV215_S0243_0037 IFB tapered overlap 12-15 mm (other post-curing) TUCA -1 GEV215_S0243_0038 IFB tapered overlap 12-15 mm (other post-curing) TUCA -1 GEV215_S0243_0039 IFB tapered overlap 12-15 mm (other post-curing) TUCA -1 GEV215_S0243_0040 IFB tapered overlap 12-15 mm (other post-curing) TUCA -1 GEV215_S0243_0041 IFB tapered overlap 12-15 mm (other post-curing) TUCA -1 GEV215_S0243_0042 IFB tapered overlap 12-15 mm (other post-curing) TUCA -1
TUCA: Fatigue on Tubular specimen TUST: Static test on tubular specimen TUM: Tubular specimen subjected to static moment only TUSTM: Tubular specimen subjected to static axial load and moment Table 2: Overview of the overlap type of the tube specimens produced and foreseen to or tested at IFB/University Stuttgart (torsion combined with tension / compression)

OB_TG2_R038 rev.0
OPTIMAT BLADES Page 9 of 23
Last saved 19.06.2006 14:11
5 Test program
5.1 Test program Two types of tests used within the experimental work are given in this section. They are briefly described in the DPA of TG2 [3]. A survey is given in Table 3. Types of tests
# Test method Laminate Geometry (OB Definition)
Testing condition
1 Static, Torsion S02, Foam core Tubes-_0200 RT, Dry 2 Fatigue, R=-1 S02 Tubes-_0200, S0232, S0242, S1100 RT, Dry
3 Static, Torsion- Tension/Compression S02, Foam core S0232, S0233 RT, Dry
4 Fatigue, Torsion- Tension/Compression MD2 S0233, S0243 RT, Dry
Table 3: Overview of test types For the description of an S-N curve in pure torsion at DLR, the static tests were carried out with tubes filled with a foam core to prevent the thin-walled specimens from buckling. The fatigued torsion tubes did not need such a core, since the fatigue loads were lower than the static failure loads. The stress ratio was R=-1. For the tests at the IFB with torsion and tension / compression, at first a failure envelope on the basis of static tests was foreseen. Also these tubes had to be filled with a foam core to avoid buckling. The R=-1 fatigue tests were then foreseen for a certain ratio between the torsion moment and the axial load on the tubes to simulate the different loadings in the ±45°fibres of a shear web near the spar caps of a bent spar beam. This ratio was defined on the basis of a work described in [4]. In pre-investigations then it was found that for the achievement of a strain of 0.2 % in the tubes in the tensile loaded (+45°) fibres and -0.37 % in the compression loaded (-45°) fibres the corresponding axial load must be 4.23 kN and the moment 85 Nm. All test results are reported in the official database, OptiDat.
5.2 Test equipment At DLR, a servo-hydraulic 1.000 Nm Schenck torsion machine of type 88603 was used, see Figure 6. At IFB, a hydraulic Tension/Compression-Torsion Machine 8502 from Instron with Mmax = 2.000 Nm and Fmax = ±100 kN was used see Figure 7. At DLR, the data acquisition was carried out with Hottinger UPM60 and UPM100, at the IFB with Hottinger UPM60 and Spider 8. The strain gauge rosettes were glued on the opposite side to the overlap of the tubes to achieve merely the signals of the two layers the tubes have in their undisturbed ar-eas. The rosettes were orientated under 45° to the tube axis, see e.g. Figures 8 and 25.

OB_TG2_R038 rev.0
OPTIMAT BLADES Page 10 of 23
Last saved 19.06.2006 14:11
Figure 6: Hydraulic 1.000 Nm Schenck torsion machine with (with thermo-camera, DLR)
Figure 7: Hydraulic Tension/Compression-Torsion Machine 8502 from Instron (IFB)

OB_TG2_R038 rev.0
OPTIMAT BLADES Page 11 of 23
Last saved 19.06.2006 14:11
5.3 Testing conditions All tests were accomplished under ambient conditions in a non-air-conditioned lab. For the fatigue tests at DLR, a fan was used for cooling by an air stream.
5.4 Testing procedures The static tests were performed in such a speed that the failure should occur within about 1 minute. For the fatigue tests at DLR, the frequencies were set such that the temperature should not exceed about 35°C. The minimum frequency was 2.6 Hz, the maximum 8.5 Hz. The temperature could be measured by a calibrated laser optic. At IFB, the frequencies in general were 2 Hz. In some cases either 1 or 3 Hz were applied which is reported in Table 6.
6 Results
6.1 Torsion tests at DLR
6.1.1 Static tests 3 tube specimens were tested statically. The first one was twisted in clockwise direction so that the 45°- oriented fibres of the outer single layer were tensile-loaded and could support themselves against the inner one what resulted in a higher torsion strength, see Figure 8 and Table 4. The other two tubes were twisted in the other direction, so the outer layer were compression-loaded and could delaminate form the inner one resulting in slightly lower val-ues, see Figure 9 and Table 4.
Figure 8: Failure due to twist in clockwise direction
Figure 9: Failure due to twist against clockwise direction

OB_TG1_R003 rev.1
OPTIMAT BLADES Page 12 of 23
Last saved 19.06.2006 14:11
6.1.2 Fatigue tests on tubes with steep overlap drop The first 6 tubes tested in fatigue hat a steep overlap drop. Figure 10 shows an assembly of 5 tubes to demonstrate the delamination behaviour described before. The results (moment, maximum strain in 45°-fibre and load cycles) are shown in Table 4.
Figure 10: Failure behaviour (delamination) of tube specimens with steep overlap drop
6.1.3 Fatigue tests on tubes with turned down steep overlap drop Some few specimens were tested in fatigue which had a turned down steep overlap drop. Figure 11 shows a view on the failure of the fibres injured by the turning. At first the testing of those tubes was stopped, to continue the tests with the above described tapered overlap drop. However, whilst tests with a GOM and with an infrared camera which were carried out later with some remaining turned down specimens, the results were comparable with those of the tapered overlap specimens. Therefore, those 4 specimens are reported also in Table 4.
Figure 11: Failure pattern of tube with turned down steep overlap drop
OB_TG1_R003 rev.1
OPTIMAT BLADES Page 13 of 23
Last saved 19.06.2006 14:11
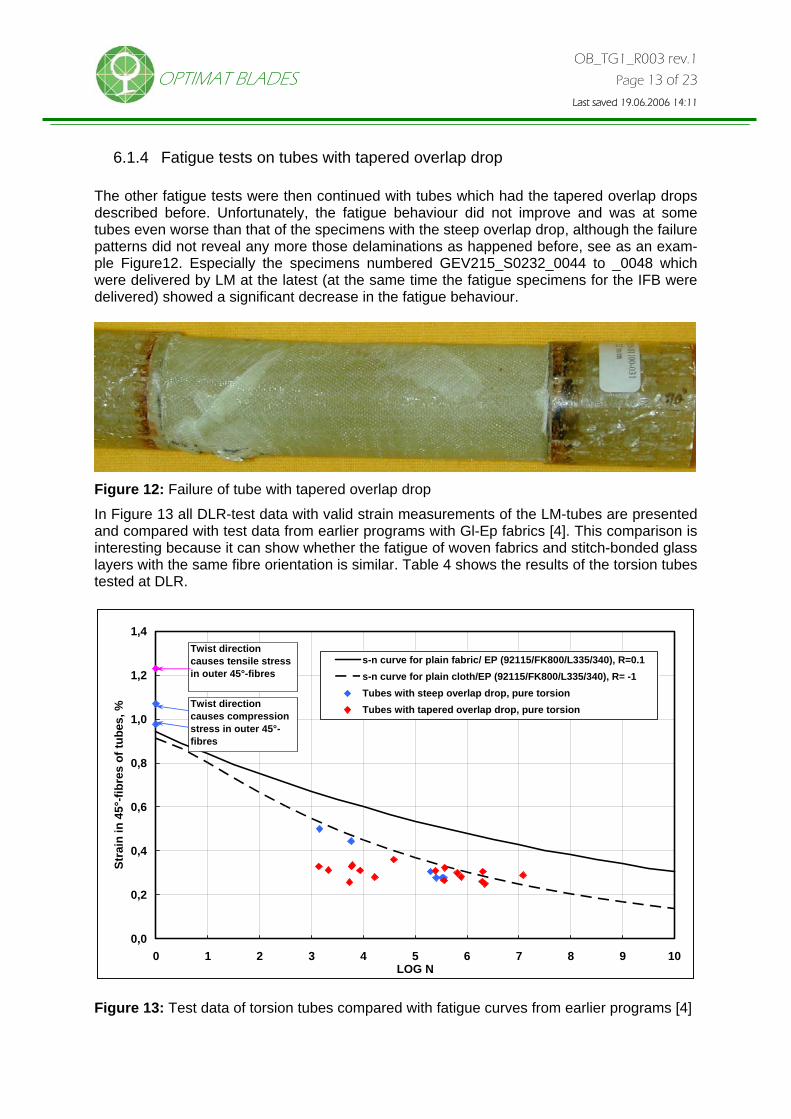
6.1.4 Fatigue tests on tubes with tapered overlap drop The other fatigue tests were then continued with tubes which had the tapered overlap drops described before. Unfortunately, the fatigue behaviour did not improve and was at some tubes even worse than that of the specimens with the steep overlap drop, although the failure patterns did not reveal any more those delaminations as happened before, see as an exam-ple Figure12. Especially the specimens numbered GEV215_S0232_0044 to _0048 which were delivered by LM at the latest (at the same time the fatigue specimens for the IFB were delivered) showed a significant decrease in the fatigue behaviour.
Figure 12: Failure of tube with tapered overlap drop
In Figure 13 all DLR-test data with valid strain measurements of the LM-tubes are presented and compared with test data from earlier programs with Gl-Ep fabrics [4]. This comparison is interesting because it can show whether the fatigue of woven fabrics and stitch-bonded glass layers with the same fibre orientation is similar. Table 4 shows the results of the torsion tubes tested at DLR.
0,0
0,2
0,4
0,6
0,8
1,0
1,2
1,4
0 1 2 3 4 5 6 7 8 9 10LOG N
Stra
in in
45°
-fibr
es o
f tub
es, %
s-n curve for plain fabric/ EP (92115/FK800/L335/340), R=0.1s-n curve for plain cloth/EP (92115/FK800/L335/340), R= -1Tubes with steep overlap drop, pure torsionTubes with tapered overlap drop, pure torsion
Twist direction causes compression stress in outer 45°-fibres
Twist direction causes tensile stress in outer 45°-fibres
Figure 13: Test data of torsion tubes compared with fatigue curves from earlier programs [4]

OB_TG1_R003 rev.1
OPTIMAT BLADES Page 14 of 23
Last saved 19.06.2006 14:11
Optimat/FACT name Test-Lab R eps45° Shear modulus Torquemax Ncycles
% Gpa Nm Tubes-_0200_0001 DLR 1,23 -446,40 1 Tubes-_0200_0002 DLR 1,07 398,90 1 Tubes-_0200_0003 DLR 0,98 364,50 1 Tubes-_0200_0004 DLR -1 0,50 180,00 1440 GEV215_S0232_0001 DLR -1 0,30 14,50 110,00 198169 GEV215_S0232_0002 DLR -1 0,45 14,5 160,00 5837 GEV215_S0232_0003 DLR -1 0,27 14,14 100,00 254804 GEV215_S0232_0004 DLR -1 0,28 14,24 100,00 356097 GEV215_S0232_0005 DLR -1 0,28 100,00 331854 GEV215-S1100-020-32m/m DLR -1 160,00 1224 GEV215-S1100-021-32m/m DLR -1 160,00 2967 GEV215-S1100-022-32m/m DLR -1 100,00 497255 GEV215-S1100-023-32m/m DLR -1 90,00 725064 GEV215_S0242_0031 DLR -1 0,25 100,00 2213876 GEV215_S0242_0032 DLR -1 160,00 2812 GEV215_S0242_0033 DLR -1 0,32 13,70 100,00 373281 GEV215_S0242_0034 DLR -1 0,29 85,00 12000000 GEV215_S0242_0035 DLR -1 0,26 100,00 1956095 GEV215_S0242_0036 DLR -1 0,28 13,07 110,00 771463 GEV215_S0242_0037 DLR -1 0,27 13,76 110,00 363697 GEV215_S0242_0038 DLR -1 0,31 12,14 110,00 2018819 GEV215_S0242_0039 DLR -1 0,30 13,39 120,00 650000 GEV215_S0242_0040 DLR -1 0,31 13,12 120,00 247599 GEV215_S0242_0041 DLR -1 0,33 12,15 120,00 1387 GEV215_S0242_0042 DLR -1 0,33 13,33 130,00 5873 GEV215_S0242_0043 DLR -1 0,36 140,00 38756 GEV215_S0232_0044 DLR -1 0,26 140,00 4528 GEV215_S0232_0045 DLR -1 0,31 140,00 2110 GEV215_S0232_0046 DLR -1 0,34 160,00 6155 GEV215_S0232_0047 DLR -1 0,31 140,00 8646 GEV215_S0232_0048 DLR -1 0,28 130,00 16593
Table 4: Overview of test results of torsion tubes tested at DLR
6.1.5 NDT-observations at DLR with thermo camera During the fatigue testing some NDT-observations were carried out. The Figures 14 and 15 show the failure pattern of one tube specimen and the thermo-graphic picture of the same tube short before failure which was taken by a thermo camera. It is obvious that the hot spots revealed by the thermo camera in Figure 15 can be reduced to the fatigue-related increasing defects and/or delaminations in the tube, since the failures shown in Figure 14 are in the same area. The photos of the camera and the thermo camera were taken from different stand points or angles, respectively. Therefore, the locations of the failures in Figure 14 and of the increased temperature appear different.

OB_TG1_R003 rev.1
OPTIMAT BLADES Page 15 of 23
Last saved 19.06.2006 14:11
Figure 14: Failure pattern of a tube specimen after 38.787 load cycles
Figure 15: Thermo-graphic picture of the same tube short before failure at 38.600 load cycles
6.2 Torsion and tension / compression tests at the IFB/University Stuttgart
6.2.1 Static tests with torsion and tension / compression At the IFB of the University of Stuttgart, the torsion tests of the LM-tubes were carried out in combination with tension / compression. In a first phase, static failure tests were performed on 9 tubes which were filled with a foam core each to prevent them from buckling. These tests were needed to achieve a failure envelope as complete as possible by applying differ-ent ratios of moment and axial load. The individual strain readings in load versus strains of the fibres under +45° and -45° as well as in the direction of the axis are shown in the Figures 16 to 24. For the definition of positive and negative torsion moment, see Figure 25. The fail-ure envelope is presented in Figure 26 in terms of torsion moment versus the axial load. In Table 5 the maximum strains for the 3 measured strain directions are presented together with the torque and axial force achieved at failure.
GEV215_S0232_0006
0
2
4
6
8
10
12
-0,6 -0,4 -0,2 0 0,2 0,4 0,6 0,8 1 1,2Strain, %
Load
, kN
DMS1
DMS2
DMS3
Figure 16: Load versus strain of GEV215_S0232_0006
GEV215_S0232_0007
-2
0
2
4
6
8
10
12
14
-0,5 0 0,5 1 1,5 2 2,5 3
Strain, %
Load
, kN
DMS1
DMS2
DMS3
Figure 17: Load versus strain of GEV215_S0232_0007
LW: 38.787

OB_TG1_R003 rev.1
OPTIMAT BLADES Page 16 of 23
Last saved 19.06.2006 14:11
GEV215_S0232_0008
-2
0
2
4
6
8
10
12
14
16
-0,5 0 0,5 1 1,5 2 2,5 3
Strain, %
Load
, kN
DMS1
DMS2
DMS3
Figure 18: Load versus strain of GEV215_S0232_0008
GEV215_S0232_0009
-2
0
2
4
6
8
10
12
14
-0,5 0 0,5 1 1,5 2 2,5 3 3,5 4
Strain, %
Load
, kN
DMS1
DMS2
DMS3
Figure 19: Load versus strain of GEV215_S0232_0009
GEV215_S0232_0011
-1
0
1
2
3
4
5
6
7
8
9
-0,8 -0,6 -0,4 -0,2 0 0,2 0,4 0,6 0,8 1 1,2 1,4
Strain, %
Load
, kN
DMS1
DMS2
DMS3
Figure 20: Load versus strain of GEV215_S0232_0011
GEV215_S0232_0012
-9
-8
-7
-6
-5
-4
-3
-2
-1
0
1
-0,8 -0,6 -0,4 -0,2 0 0,2 0,4 0,6
Strain, %
Load
, kN
DMS1
DMS2
DMS3
Figure 21: Load versus strain of GEV215_S0232_0012
GEV215_S0232_0013
-16
-14
-12
-10
-8
-6
-4
-2
0
2
-1,4 -1,2 -1 -0,8 -0,6 -0,4 -0,2 0 0,2 0,4 0,6
Strain, %
Load
, kN
DMS1
DMS2
DMS3
Figure 22: Load versus strain of GEV215_S0232_0013
GEV215_S0232_0014
-12
-10
-8
-6
-4
-2
0
2
-1,4 -1,2 -1 -0,8 -0,6 -0,4 -0,2 0 0,2 0,4
Strain, %
Load
, kN
DMS1
DMS2
DMS3
Figure 23: Load versus strain of GEV215_S0232_0014
GEV215_S0232_0015
-9
-8
-7
-6
-5
-4
-3
-2
-1
0
1
-1,2 -1 -0,8 -0,6 -0,4 -0,2 0 0,2 0,4 0,6 0,8
Strain, %
Load
, kN
DMS1
DMS2
DMS3
Figure 24: Load versus strain of GEV215_S0232_0015

OB_TG1_R003 rev.1
OPTIMAT BLADES Page 17 of 23
Last saved 19.06.2006 14:11
Figure 25: Strain gauges DMS 1, DMS 2 and DMS 3 at a tube specimen in the IFB-Torsion-tension/compression machine for explanation of sign of loadings. The positive directions are tensile load-ing for the force and twisting of the tube in clockwise direction for the moment
Failure Envelope
-300
-200
-100
0
100
200
300
-15 -12,5 -10 -7,5 -5 -2,5 0 2,5 5 7,5 10 12,5 15
Axial Load [kN]
Tors
ion
Mom
ent [
Nm
]
+Load+Moment
-Load-Moment
-Load+Moment
+Load-Moment
Figure 26: Static failure envelope of torsion tubes

OB_TG1_R003 rev.1
OPTIMAT BLADES Page 18 of 23
Last saved 19.06.2006 14:11
Optimat/FACT name Test-
Lab epsDMS1 epsDMS2 epsDMS3 Fmax Torquemax Ncycles
% % % kN Nm GEV215_S0232_0006 IFB 0,936 0,853 -0,518 9,6 259,9 1GEV215_S0232_0007 IFB 0,816 2,411 0,230 12,8 193,7 1GEV215_S0232_0008 IFB 0,656 2,827 0,516 13,5 78,8 1GEV215_S0232_0009 IFB 0,052 3,488 1,163 12,2 -183,9 1GEV215_S0232_0011 IFB -0,565 1,180 0,866 8,1 -217,3 1GEV215_S0232_0012 IFB -0,734 -0,590 0,458 -8,6 -230,6 1GEV215_S0232_0013 IFB -0,801 -1,303 0,376 -13,9 -208,9 1GEV215_S0232_0014 IFB 0,300 -1,158 -0,661 -10,7 160,7 1GEV215_S0232_0015 IFB 0,599 -0,873 -0,960 -8,5 230,7 1
Table 5: Static torsion-tension/compression tests for envelope at IFB/University of Stuttgart
6.2.2 Fatigue tests with torsion and tension / compression The fatigue tests of the tubes in combination of torsion and axial loading were carried out without foam core. As mentioned above, between the axial load and the torsion moment, a ratio of 4.23/85 kN/Nm was applied. In a first series, 10 specimens were fatigued at R=-1 between +load/+moment and –load/-moment according to the corresponding radial line in Figure 26. To be able to compare the results with those of the pure torsion tests in Figure 13, their presentation is performed in terms of the maximum (and positive) strains of the 45° strain gauges versus the logarithm of the load cycle number, see Figure 27. In Table 6, all strains (as far as available) as well as the applied maximum load and moment, the load cy-cles number and the applied frequencies are shown. A second series of tubes was then fatigued between –load/+ moment and +load/-moment along the other radial line in Figure 26 with the purpose to detect eventually differences be-tween the “positive” and “negative” loadings of the tubes. Again the positive strains are plot-ted versus the logarithm of the load cycle number in Figure 27. In Table 6 the complete data set is shown. Since the test results were not as good as expected, some specimens were delivered by LM at final which were post-cured in a different manner as the predecessors (GEV215_S0243_0037-0042). But there was no improvement visible, see Figure 27 and Table 6. In Figure 27 only valid test data are presented including run outs, i.e. not data with early fail-ures due to errors in the control system which, unfortunately, happened several times at the testing machine of the University institute. There are differences in the results of the two test directions especially in the higher loading regime whereas at lower loads the differences are smaller and the scatter is larger.

OB_TG1_R003 rev.1
OPTIMAT BLADES Page 19 of 23
Last saved 19.06.2006 14:11
0,0
0,2
0,4
0,6
0,8
1,0
1,2
1,4
0 1 2 3 4 5 6 7 8 9 10LOG N
Stra
in in
45°
-fibr
es o
f tub
es, %
s-n curve for plain fabric/ EP (92115/FK800/L335/340), R=0.1
s-n curve for plain cloth/EP (92115/FK800/L335/340), R= -1
Tapered overlap drop, torsion and axial loading (Moment+, Load+)
Tapered overlap drop, torsion and axial loading (Moment-, Load +)
Run Outs
Figure 27: S-N data of fatigue tests at IFB with torsion-tension/compression tests in com-parison to data with plain fabrics [4]

OB_TG1_R003 rev.1
OPTIMAT BLADES Page 20 of 23
Last saved 19.06.2006 14:11
Optimat/FACT name Test-Lab
R epsDMS1 epsDMS2 epsDMS3 Fmax Torquemax Ncycles f
% % % kN Nm Hz
GEV215_S0243_0014 IFB -1 4,2 -85,0 1318 3 GEV215_S0243_0015 IFB -1 4,2 85,0 116814 3 GEV215_S0243_0016 IFB -1 4,2 85,0 4256 3 GEV215_S0243_0017 IFB -1 4,2 85,0 72171 3 GEV215_S0233_0018 IFB -1 0,285 0,237 -0,136 4,2 85,0 5517 1 GEV215_S0233_0019 IFB -1 0,324 0,290 -0,166 5,0 100,5 1317 2 GEV215_S0233_0020 IFB -1 0,186 0,151 -0,095 2,5 50,2 415397 2 GEV215_S0233_0021 IFB -1 0,189 0,167 -0,085 3,5 70,3 54115 2 GEV215_S0233_0022** IFB -1 0,204 0,175 -0,117 3,0 60,3 35082 3 GEV215_S0233_0023 IFB -1 0,209 0,164 -0,104 3,0 60,3 684268 2 GEV215_S0233_0024* IFB -1 0,103 0,075 -0,064 2,0 40,2 2385524 2 GEV215_S0233_0025 IFB -1 -0,184 0,322 0,289 4,2 -85,0 396 2 GEV215_S0233_0026 IFB -1 -0,167 0,229 0,287 3,0 -60,3 1021 2 GEV215_S0233_0027 IFB -1 -0,107 0,127 0,193 2,0 -40,2 205698 2 GEV215_S0233_0028 IFB -1 -0,127 0,159 0,203 2,5 -50,2 170188 2 GEV215_S0233_0029 IFB -1 -0,120 0,210 0,219 3,5 -70,3 2223 2 GEV215_S0233_0030 IFB -1 3,0 -60,3 10719 2 GEV215_S0233_0031* IFB -1 -0,103 0,156 0,178 2,3 -45,2 1745647 2 GEV215_S0233_0032 IFB -1 -0,150 0,227 0,257 3,3 -65,3 1382 2 GEV215_S0243_0033** IFB -1 -0,153 -0,127 0,099 2,5 50,2 139854 2 GEV215_S0243_0034 IFB -1 2,4 49,1 480053 2 GEV215_S0243_0037 IFB -1 4,3 86,4 1356 2 GEV215_S0243_0038 IFB -1 -0,483 -0,525 0,196 4,1 83,7 1877 2 GEV215_S0243_0039 IFB -1 3,5 71,4 9564 2 GEV215_S0243_0040 IFB -1 -0,178 -0,112 0,119 2,8 56,3 247929 2 GEV215_S0243_0041 IFB -1 -0,189 -0,173 0,122 2,4 47,2 1246289 2 GEV215_S0243_0042** IFB -1 -0,193 -0,127 0,148 3,2 63,3 188 2 * Run Outs ** Early failure due to control error
Table 6: Fatigue results torsion-tension/compression tests at IFB/University of Stuttgart
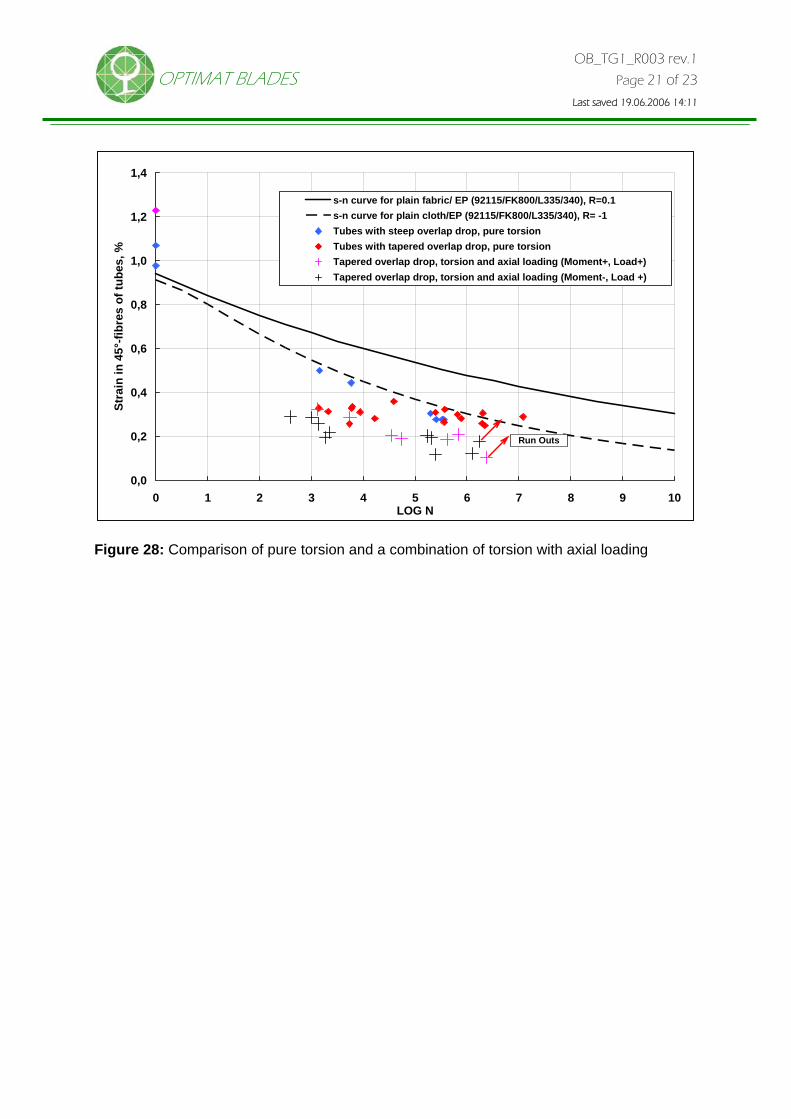
6.3 Comparison of pure torsion and the combination of torsion with axial loading
In Figure 28, the 45° strain results of both the pure torsion tests and the torsion tests com-bined with tension / compression are presented for comparison purposes. It is seems that the pure torsion tests lead to higher maximum fatigue strains in the fibre direction than with the combined torsion / axial loading. But it must be considered that all specimens with signifi-cantly lower strain values than marked by the “basic” fatigue curves from [4] have been de-livered about one year after the first tested series. This leads to the cognition that over the time, a deterioration of the fatigue properties has happened in spite of the improvements due to manufacturing changes in terms of overlap modifications. Therefore, some investigations were carried out additionally to eventually find the reasons.
OB_TG1_R003 rev.1
OPTIMAT BLADES Page 21 of 23
Last saved 19.06.2006 14:11
0,0
0,2
0,4
0,6
0,8
1,0
1,2
1,4
0 1 2 3 4 5 6 7 8 9 10LOG N
Stra
in in
45°
-fibr
es o
f tub
es, %
s-n curve for plain fabric/ EP (92115/FK800/L335/340), R=0.1s-n curve for plain cloth/EP (92115/FK800/L335/340), R= -1Tubes with steep overlap drop, pure torsionTubes with tapered overlap drop, pure torsionTapered overlap drop, torsion and axial loading (Moment+, Load+)Tapered overlap drop, torsion and axial loading (Moment-, Load +)
Run Outs
Figure 28: Comparison of pure torsion and a combination of torsion with axial loading

OB_TG1_R003 rev.1
OPTIMAT BLADES Page 22 of 23
Last saved 19.06.2006 14:11
6.4 Measurements of glass fibre content and glass transition point The fatigue results of both the pure torsion tests and the tests in combination of torsion and axial loading revealed that within the phase of manufacturing the tube specimens, a change in the fatigue behaviour has happened. To exclude reasons for this such as e.g. variations in the manufacturing process measurements of the glass transition point and the fibre content were accomplished. For this purpose, some samples from the early and the later stage of fabrication were selected. Table 7 shows the results of the fibre content measurements for these samples which were investigated by an ashing process according to DIN EN 60. The average fibre content is ac-cording to the VARTM process with 62.5 Vol% relatively high. However, the individual values do not differ significantly from each other. OPTIMAT/FACT name Test-
Lab Manner of overlap R Fibre
mass content
Fibre volume content
% % GEV215_S0232_0001 DLR steep overlap drop -1 79,3 63,6
GEV215_S0233_0005 IFB tapered overlap 12-15 mm 79,3 63,6
GEV215_S0233_0012 IFB tapered overlap 12-15 mm 78,8 62,9
GEV215-S1100-023-32m/m DLR steep overlap drop turned down -1 79,4 63,8
GEV215_S0242_0032 DLR tapered overlap 20 mm -1 77,9 61,6
GEV215_S0242_0033 DLR tapered overlap 12-15 mm -1 76,4 59,7
GEV215_S0243_0040 IFB tapered overlap 12-15 mm (other post-curing procedure)
-1 78,7 62,8
GEV215_S0242_0042 DLR tapered overlap 12-15 mm -1 78,1 61,9
GEV215_S0242_0048 DLR tapered overlap 12-15 mm -1 78,5 62,5
Table 7: Typical fibre content of tube specimens of different time of fabrication
Figure 29: Measurements of glass transition temperature of tube specimens of different time of fabrication by means of DSC-method
Also the measurements of the glass transition temperatures do not reveal large differences including specimen No. 40 which belongs to the later produced series which was post-cured in another process than the others.

OB_TG1_R003 rev.1
OPTIMAT BLADES Page 23 of 23
Last saved 19.06.2006 14:11
The fibre contents and glass transition temperatures of the specimens are very close to each other. Thus, the decrease of the fatigue results during the production and testing phase of the specimens cannot be referred to those conditions.
7 Summary and Conclusions In the frame of biaxial tests in Task Group 2 of the OPTIMAT BADES project, static and fa-tigue behaviour of pure torsion and combined torsion-axial force loaded tubular specimens was investigated. The stitch-bonded glass-epoxy lay up of the tubes was ±45°. In a primary stage and after the establishment of a static failure envelope, modifications had to be ac-complished on the design of the overlap geometry of the tubes which, however, did not im-prove the results. But then the achieved fatigue results which were carried out at R=-1 suf-fered from another problem: The quality of newer fabrication batches of the tubes decreased compared to the older ones. The reason could not be found. Investigations were performed e.g. on the fibre content as well as on the glass transition temperature of various batches. They did not show significant differences. Thus, variations in the fabrication method might at least be excluded. The fatigue results are presented in maximum strain of the 45°-oriented fibres versus life-time. Although the torsion-tensile/compression-loaded tubes seem to have lower fatigue properties than those loaded with pure torsion this should be verified by tests on tubes with reproducible good quality.
8 References [1] Torben K. Jacobsen, Reference material (Optimat) - Glass-Epoxy material, LM Glasfiber
A/S, doc. OB_SC_R001 rev. 1, 29.01.2003
[2] R.P.L. Nijssen, OptiDAT project database, 08_02_2006
[3] T.P. Philippidis, Detailed plan of action WP6: Complex Loading, OB_TC_R005_UP_TG2, 28/08/2002
[4] Ch.W. Kensche, Proposal for a certification procedure of extended sailplane lifetime. OSTIV-Seminar, Mafikeng, Southafrica, 14-18 Decembre 2001, (2001)
9 Acknowledgement The author grateful thanks Mr. Harald Kraft, DLR Stuttgart and Mr. Dirk Bolsch, IFB, Univer-sity of Stuttgart for their efforts in the experimental work of testing the tubular specimens.