Embed Size (px)
Citation preview

Financialmarkets and
March 19, 2020
wipflifinancial.com
COVID-19

Your presenters
Rafia Hasan, CFP®, CFAPrincipal, Chief Investment Officer
2
Dean Stange, J.D., CFP®Principal, Senior Financial Advisor

Questions?
§ Please submit in the chat box.
3

Question: How long do you think the stock market will remain depressed and how long will it take us to recover?
4

A history of market ups and downs
5Chart end date is 12/31/2019, the last trough to peak return of 451% represents the return through December 2019.Bear markets are defined as downturns of 20% of greater from new index highs. Bull markets are subsequent rises following the bear market trough through the next new market high. The chart shows bear markets and bull markets, the number of months they lasted and the associated cumulative performance for each market period. Results for different time periods could differ from the results shown.Past performance is no guarantee of future results. Indices are not available for direct investment; therefore, their performance does not reflect the expenses associated with the management of an actual portfolio. Source: S&P data © 2020 S&P Dow Jones Indices LLC, a division of S&P Global. All rights reserved.
S&P 500 Index total returns in USD, January 1926–December 2019
Using a 20% threshold for downturns
1926 1931 1936 1941 1946 1951 1956 1961 1966 1971 1976 1981 1986 1991 1996 2001 2006 2011 2016
S&
P 5
00
In
de
x T
ota
l Re
turn
(Lo
gar
ith
mic
Sca
le)
0%
-1%
1,000%
-100%
Bull Market
Bear Market
193%44 months
-83%34 months
-22%6 months
815%167 months
-22%6 months
936%181 months
144%77 months
-29%19 months
76%30 months
844%155 months
-43%21 months
-45%25 months
-30%3 months
-51%16 months
815%153 months
108%61 months
451%130 months

The market’s response to crisis
6
In US dollars. Represents cumulative total returns of a balanced strategy invested on the first day of the following calendar month of the event noted. Balanced Strategy: 12% S&P 500 Index, 12% Dimensional US Large Cap Value Index, 6% Dow Jones US Select REIT Index, 6% Dimensional International Value Index, 6% Dimensional US Small Cap Index, 6% Dimensional US Small Cap Value Index, 3% Dimensional International Small Cap Index, 3% Dimensional International Small Cap Value Index, 2.4% Dimensional Emerging Markets Small Index, 1.8% Dimensional Emerging Markets Value Index, 1.8% Dimensional Emerging Markets Index, 10% Bloomberg Barclays Treasury Bond Index 1-5 Years, 10% FTSE World Government Bond Index 1-5 Years (hedged), 10% FTSE World Government Bond Index 1-3 Years (hedged), 10% ICE BofAML 1-Year US Treasury Note Index. Assumes monthly rebalancing. For illustrative purposes only. S&P and Dow Jones data © 2019 S&P Dow Jones Indices LLC, a division of S&P Global. All rights reserved. ICE BofAML index data © 2019 ICE Data Indices, LLC. FTSE fixed income indices © 2019 FTSE Fixed Income LLC. All rights reserved. Bloomberg Barclays data provided by Bloomberg. Dimensional indices use CRSP and Compustat data. Indices are not available for direct investment. Their performance does not reflect the expenses associated with the management of an actual portfolio. Past performance is not a guarantee of future results. Not to be construed as investment advice. Returns of model portfolios are based on back-tested model allocation mixes designed with the benefit of hindsight and do not represent actual investment performance. See “Balanced Strategy Disclosure and Index Descriptions” pages in the Appendix for additional information.
Performance of a balanced strategy: 60% Stocks, 40% Bonds; Cumulative total return
19%
-2%
16%
2%
-1%
4%7%
33%
23% 25%
2%
40%
12%
36%
76%
61%
52% 51%
81%
47%42%
After 1 year
After 3 years
After 5 years
October 1987:Stock Market
Crash
August 1989:US Savings and
Loan Crisis
September 1998:Asian Contagion
Russian CrisisLTCM Collapse
March 2000:Dot-Com
Crash
September 2001:Terrorist Attack
September 2008:Bankruptcy of
Lehman Brothers
August 2011:US Debt
Downgrade

Question: Wouldn’t it be better to switch to a more conservative portfolio if we know a recession is imminent?
7

Market returns through recessions
8Source: Macrotrends, S&P 500 Index - 90 Year Historical Chart, https://www.macrotrends.net/2324/sp-500-historical-chart-data. Accessed April 8, 2019.
S&P 500, January 1928 – March 2019

Question: What are you doing for clients in the current environment?
9

The volatility bonus and the benefits of tax management
Tax Alpha (Gross):
11-year average = 2.13%
10
In the above illustration, the bars represent the tax alpha of the Parametric tax-managed Custom Core®–Benchmark: S&P 500® Composite, and the line represents the cross-sectional volatility of the S&P 500® Index, which is based on U.S. large cap equity securities. Cross-sectional volatility measures the return dispersion of a universe of securities at a single point in time, weighted by the market capitalization of the security. The above information is supplemental to the Composite’s Global Investment Performance Standards (GIPS®) presentation contained herein as an integral part of this material. Tax alpha (gross) is hypothetical and is defined as the simulated, gross after-tax excess return minus any gross pre-tax excess return. Tax alpha does not reflect the deduction of management fees which would reduce the return presented. Source: Parametric, Bloomberg & FactSet as of 9/30/2019. For illustrative purposes only; not an offer to buy or sell any security. Composite returns are presented net of advisory fees and brokerage commissions. Performance reflects the reinvestment of dividends and other earnings. Performance for periods of less than one year has not been annualized. Performance, cost basis, unrealized gain/losses, and realized gains/losses calculated and reported by Parametric may vary from official custodial statements based on different accounting procedures, reporting dates or valuation methodologies for certain securities. Past performance is not indicative of future results. It is not possible to invest directly in an index; they are unmanaged and do not reflect the deduction of fees, taxes and expenses.
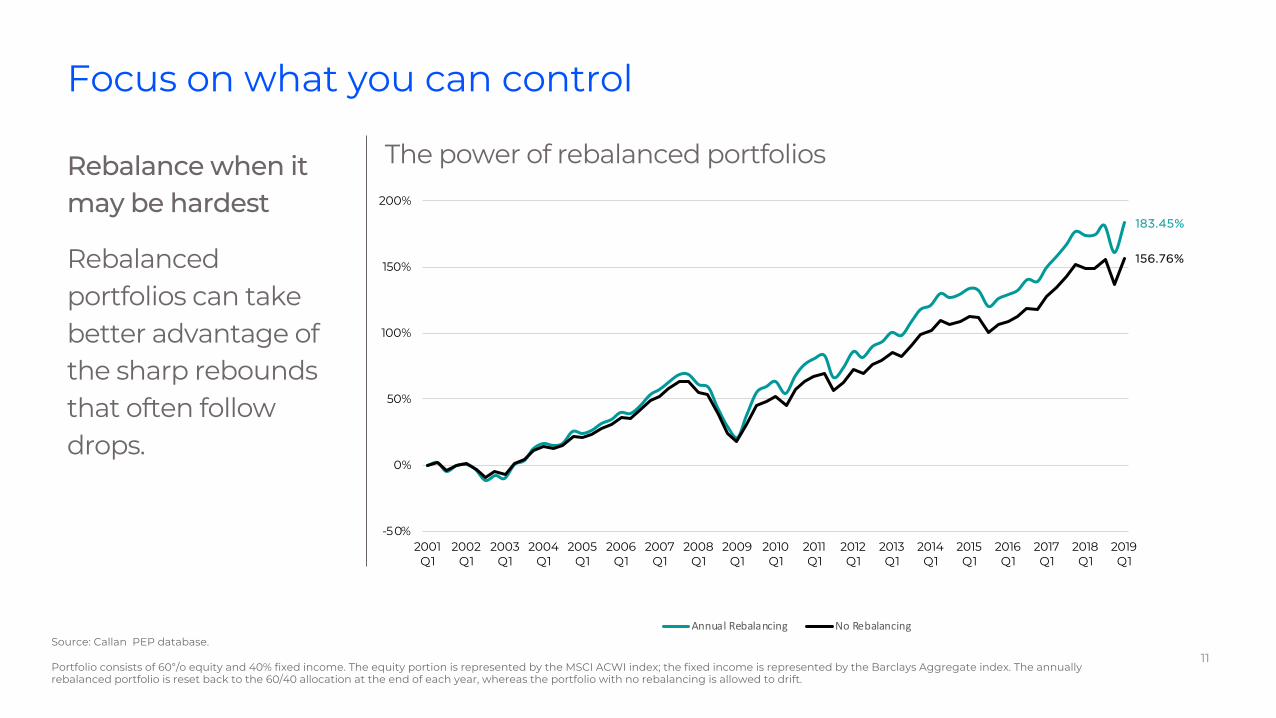
Focus on what you can control
Rebalance when it may be hardest
Rebalanced portfolios can take better advantage of the sharp rebounds that often follow drops.
11Source: Callan PEP database.
Portfolio consists of 60°/o equity and 40% fixed income. The equity portion is represented by the MSCI ACWI index; the fixed income is represented by the Barclays Aggregate index. The annually rebalanced portfolio is reset back to the 60/40 allocation at the end of each year, whereas the portfolio with no rebalancing is allowed to drift.
183.45%
156.76%
-50%
0%
50%
100%
150%
200%
2001Q1
2002Q1
2003Q1
2004Q1
2005Q1
2006Q1
2007Q1
2008Q1
2009Q1
2010Q1
2011Q1
2012Q1
2013Q1
2014Q1
2015Q1
2016Q1
2017Q1
2018Q1
2019Q1
Annual Rebalancing No Rebalancing
The power of rebalanced portfolios

Question: How do we keep our emotions in check so that we don’t make a mistake with our portfolio during this market turmoil?
12

NervousnessOptimism
Fear
Elation
Optimism
Many investors follow their emotions
§ People may struggle to separate their emotions from their investment decisions.
§ Following a reactive cycle of excessive optimism and fear may lead to poor decisions at the worst times.
13

Question: Why not make a switch to more bonds since they seem to be holding up so well in the current environment?
14

Stick with your plan
§ Emotions and investing can be a losing combination.
§ Don’t abandon your investment mix just because the market is uncertain.
15
Source: Vanguard, “Stick with your plan,” 2017, https://advisors.vanguard.com/iwe/pdf/crc/Market_Volatility_GetScary.pdf.Notes: The 50% stock/50% bond portfolio is represented by the Standard & Poor’s 500 Index and the Bloomberg Barclays U.S. Aggregate Bond Index (rebalanced monthly). The 100% bond portfolio is represented by the Bloomberg Barclays U.S. Aggregate Bond Index. The 100% cash portfolio is represented by 3-month Treasury bills. This is a hypothetical illustration. The final account balance does not reflect any taxes or penalties that may be due upon distribution. Withdrawals from a traditional IRA before age 59½ are subject to a 10% federal penalty tax unless an exception applies. Past performance is no guarantee of future returns. The performance of an index is not an exact representation of any particular investment, as you cannot invest directly in an index. All investments are subject to risk, including the possible loss of the money you invest.

Questions?
§ Please submit in the chat box.
16

Appendix
17

Downturns aren't rare events, and the typical investor will endure many
One attention-grabbing downturn every two years.
18Source: Vanguard analysis based on the MSCI World Index from January 1, 1980, through December 31, 1987, and the MSCI All Country World Index thereafter. Both indexes are denominated in U.S. dollars. Our count of corrections excludes those that turned into a bear market. We counted corrections that occurred after a bear market had recovered from its trough even if stock prices hadn’t yet reached their previous peak.
Global stock prices: January 1, 1980 to December 31, 2019
13 corrections
§ Decline of 10% or more
8 bear markets
§ Decline of 20% or more, at least
two months long

Fixed income diversification benefits
19Source: PIMCO.com. Bloomberg, PIMCO. Stocks represented by S&P 500 Index. Bonds represented by Barclay’s U.S. Aggregate index. Past performance does not guarantee or indicate future returns.

Markets have rewarded discipline
A disciplined investor looks beyond the concerns of today to the long-term growth potential of markets.
20In US dollars. MSCI data © MSCI 2019, all rights reserved. Indices are not available for direct investment. Their performance does not reflect the expenses associated with the management of an actual portfolio. Past performance is no guarantee of future results.
Growth of a dollar—MSCI World Index (net dividends), 1970–2018
$0
$1
$10
$100
$54
1970 1980 1990 2000 2010 2018
US home prices hit bottom
Fiscal cliff worries
Eurozone debt crisis
S&P 500 down 46%
Subprime mortgage
crisis
Hurricanes Katrina
and Rita
Iraq war begins
Dotcom stock crash
9/11 terrorist attacks
Y2K Scare
Russian financial
crisisAsian
currency crisis
Income tax rates rise
Iraq invades Kuwait
Savings and loan crisis
Dow drops 23% on Black Monday
US inflation at 13.5%
BusinessWeek: “The Death of Equities”
Gold hits record high
S&P 500 down 43%
Oil prices quadruple
Arab oil embargo
Brexit

Reacting can hurt performance
Missing only a few days of strong returns can drastically impact overall performance.
21
Source: Dimensional Fund Advisors.In US dollars. For illustrative purposes. The missed best day(s) examples assume that the hypothetical portfolio fully divested its holdings at the end of the day before the missed best day(s), held cash for the missed best day(s), and reinvested the entire portfolio in the S&P 500 at the end of the missed best day(s). Annualized returns for the missed best day(s) were calculated by substituting actual returns for the missed best day(s) with zero. S&P data copyright 2019 S&P Dow Jones Indices LLC, a division of S&P Global. All rights reserved. “One-Month US T- Bills” is the IA SBBI US 30 Day TBill TR USD, provided by Ibbotson Associates via Morningstar Direct. Data is calculated off rounded daily index values. Indices are not available for direct investment. Their performance does not reflect the expenses associated with the management of an actual portfolio. Past performance is not a guarantee of future results.
Performance of the S&P 500 Index, 1990–2018
TotalPeriod
Missed 1 Best
Day
Missed 5 Best Single
Days
Missed 15 Best Single
Days
Missed 25 Best
Single Days
One-Month
US T-Bills
Annualized Compound Return 9.29% 8.87% 7.75% 5.79% 4.18% 2.74%
$13,137
$11,773
$8,715
$5,121
$3,281$2,188
Gro
wth
of $
1,00
0

Important disclosures
Wipfli Financial Advisors, LLC (“Wipfli Financial”) is an investment advisor registered with the U.S. Securities and Exchange Commission (SEC); however, such registration does not imply a certain level of skill or training and no inference to the contrary should be made. Wipfli Financial is a proud affiliate of Wipfli LLP, a national accounting and consulting firm. Information pertaining to Wipfli Financial’s management, operations, services and fees is set forth in Wipfli Financial’s current Form ADV Part 2A brochure, copies of which are available from Wipfli Financial upon request at no cost or at www.adviserinfo.sec.gov. Wipfli Financial does not provide tax, accounting or legal services.
22wipflifinancial.com

Important disclosures
S&P 500: The S&P 500 index is a float-adjusted, market-cap weighted index that tracks the stocks of 500 large-cap
U.S. companies.
MSCI World: The MSCI World Index is a broad global equity index that represents large and mid-cap equity
performance across all 23 developed markets countries. It covers approximately 85% of the free float-adjusted
market capitalization in each country.
MCSI All Country World (also referred to as “MSCI ACWI”): The MSCI ACWI Index is designed to represent
performance of the full opportunity set of large- and mid-cap stocks across 23 developed and 26 emerging
markets. As of December 2019, it covers more than 3,000 constituents across 11 sectors and approximately 85% of
the free float-adjusted market capitalization in each market.
Barclay’s US Aggregate: The Barclay’s US Aggregate is a market capitalization-weighted index that measures the
investment grade, US dollar-denominated, fixed-rate taxable bond market, and includes treasuries, government-
related and corporate securities, mortgage-backed securities, asset-backed securities and commercial mortgage-
backed securities with maturities of at least one year. 23