Embed Size (px)
Citation preview
Rovio Entertainment Corporation
Financial Statement Bulletin
February 14, 2019
FINANCIAL STATEMENT BULLETIN FOR JANUARY-DECEMBER 2018
1
Record gross bookings for Games in Q4, Angry Birds 2 grew 77% year-on-year October-December 2018 highlights • Rovio’s revenue was EUR 72.7 million (73.9) or -1.7% decline year-on-year; In comparable currencies, the
decline was approximately -3%
• Rovio’s biggest game, Angry Birds 2 gross bookings grew for the fourth consecutive quarter and 77% year-on-year to reach a record number of EUR 35.2 (19.9) million
• Games segment gross bookings was EUR 66.7 million (66.1) or 1.0% growth year-on-year. In comparable currencies, the two quarters were at a similar level. An increase in deferred revenues in the quarter decreased revenues to EUR 65.2 million (66.1) or -1.4% year-on-year.
• User acquisition investments were EUR 23.3 million (15.9), or 35.7% of the Games segment’s revenue (24.0%)
• Brand Licensing revenue was EUR 7.5 million (7.8) or -4.0% lower year-on-year
• Group adjusted operating profit was EUR 5.3 million (10.5) and adjusted operating profit margin 7.2% (14.2 %)
• Group adjusted operating profit excluding Hatch Entertainment was EUR 8.2 million (12.2) and adjusted operating profit margin 11.2% (16.5%)
• Operating cash flow was EUR 19.2 million (5.8)
• Earnings per share was EUR 0.05 (0.10)
January-December 2018 highlights • Rovio’s revenue decreased by 5.4% to EUR 281.2 million (297.2). In comparable currencies, the revenue
decreased by approximately 3%. Year-on-year comparability was also impacted by large revenue peak of Angry Birds Movie in the second quarter in 2017.
• Games revenue grew 1.0% to EUR 250.4 million (248.0). The growth in comparable currencies was approximately 4%
• User acquisition investments increased by 12.9% to EUR 78.6 million (69.6) and were 31.4% of the Games segment’s revenue (28.1%)
• Brand Licensing revenue declined as expected year-on-year to EUR 30.8 million (49.2) or -37.4% due to the large revenue peak of the Angry Birds Movie in the second quarter in 2017
• Group adjusted operating profit was EUR 31.2 million (35.9) and adjusted operating profit margin 11.1% (12.1%)
• Group adjusted operating profit excluding Hatch Entertainment was EUR 38.4 million (40.7) and adjusted operating profit margin 13.7% (13.7%)
• Group profit before tax for the year was EUR 32.2 million (26.6)
• Operating cash flow was EUR 42.6 million (59.6)
• Earnings per share was EUR 0.31 (0.27)
2
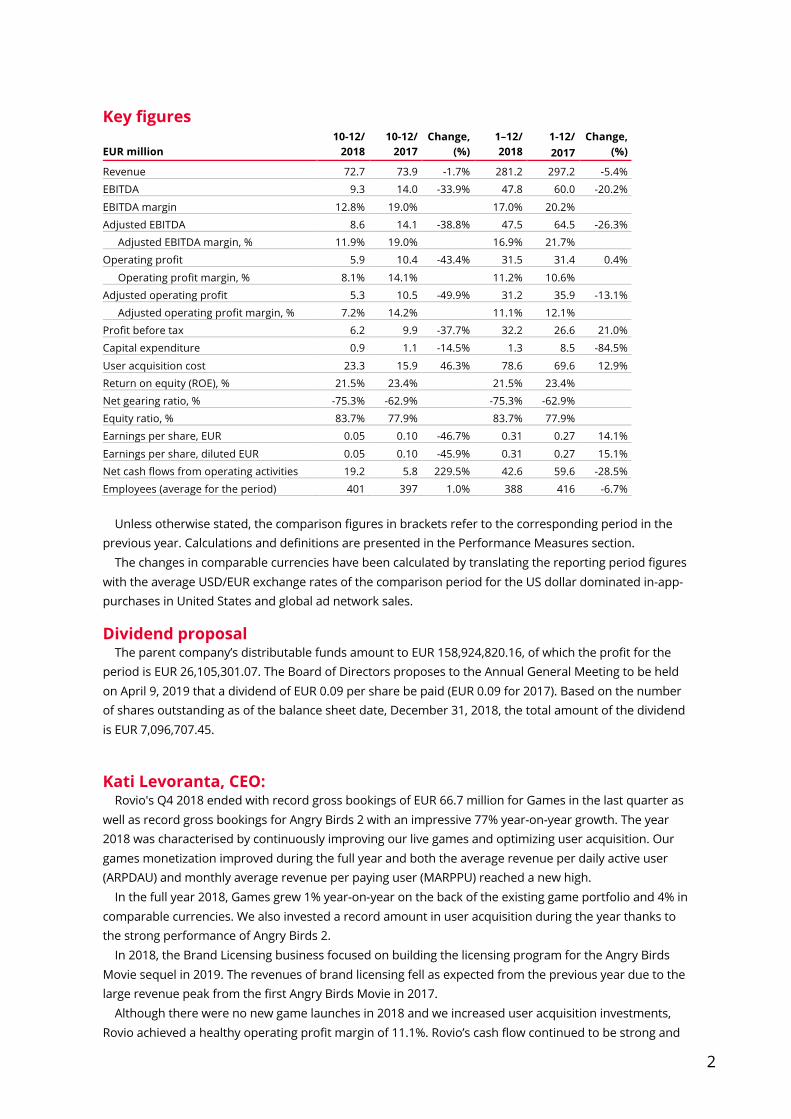
Key figures 10-12/ 10-12/ Change, 1–12/ 1-12/ Change, EUR million 2018 2017 (%) 2018 2017 (%)
Revenue 72.7 73.9 -1.7% 281.2 297.2 -5.4%
EBITDA 9.3 14.0 -33.9% 47.8 60.0 -20.2%
EBITDA margin 12.8% 19.0% 17.0% 20.2%
Adjusted EBITDA 8.6 14.1 -38.8% 47.5 64.5 -26.3%
Adjusted EBITDA margin, % 11.9% 19.0% 16.9% 21.7%
Operating profit 5.9 10.4 -43.4% 31.5 31.4 0.4%
Operating profit margin, % 8.1% 14.1% 11.2% 10.6%
Adjusted operating profit 5.3 10.5 -49.9% 31.2 35.9 -13.1%
Adjusted operating profit margin, % 7.2% 14.2% 11.1% 12.1%
Profit before tax 6.2 9.9 -37.7% 32.2 26.6 21.0%
Capital expenditure 0.9 1.1 -14.5% 1.3 8.5 -84.5%
User acquisition cost 23.3 15.9 46.3% 78.6 69.6 12.9%
Return on equity (ROE), % 21.5% 23.4% 21.5% 23.4%
Net gearing ratio, % -75.3% -62.9% -75.3% -62.9%
Equity ratio, % 83.7% 77.9% 83.7% 77.9%
Earnings per share, EUR 0.05 0.10 -46.7% 0.31 0.27 14.1%
Earnings per share, diluted EUR 0.05 0.10 -45.9% 0.31 0.27 15.1%
Net cash flows from operating activities 19.2 5.8 229.5% 42.6 59.6 -28.5%
Employees (average for the period) 401 397 1.0% 388 416 -6.7% Unless otherwise stated, the comparison figures in brackets refer to the corresponding period in the
previous year. Calculations and definitions are presented in the Performance Measures section. The changes in comparable currencies have been calculated by translating the reporting period figures
with the average USD/EUR exchange rates of the comparison period for the US dollar dominated in-app-purchases in United States and global ad network sales.
Dividend proposal The parent company’s distributable funds amount to EUR 158,924,820.16, of which the profit for the
period is EUR 26,105,301.07. The Board of Directors proposes to the Annual General Meeting to be held on April 9, 2019 that a dividend of EUR 0.09 per share be paid (EUR 0.09 for 2017). Based on the number of shares outstanding as of the balance sheet date, December 31, 2018, the total amount of the dividend is EUR 7,096,707.45.
Kati Levoranta, CEO: Rovio's Q4 2018 ended with record gross bookings of EUR 66.7 million for Games in the last quarter as
well as record gross bookings for Angry Birds 2 with an impressive 77% year-on-year growth. The year 2018 was characterised by continuously improving our live games and optimizing user acquisition. Our games monetization improved during the full year and both the average revenue per daily active user (ARPDAU) and monthly average revenue per paying user (MARPPU) reached a new high.
In the full year 2018, Games grew 1% year-on-year on the back of the existing game portfolio and 4% in comparable currencies. We also invested a record amount in user acquisition during the year thanks to the strong performance of Angry Birds 2.
In 2018, the Brand Licensing business focused on building the licensing program for the Angry Birds Movie sequel in 2019. The revenues of brand licensing fell as expected from the previous year due to the large revenue peak from the first Angry Birds Movie in 2017.
Although there were no new game launches in 2018 and we increased user acquisition investments, Rovio achieved a healthy operating profit margin of 11.1%. Rovio’s cash flow continued to be strong and

3
cash flow from operations was EUR 42.6 million for the full year. I want to thank all Rovians for their continuous effort in improving our business performance in highly
competitive markets. In November 2018, Rovio acquired the Finnish mobile strategy game developer PlayRaven. Strategy
games is one of the largest genres in mobile games and by joining forces with PlayRaven's talented and skilled personnel Rovio strengthens its know-how and can accelerate its expansion into strategy games.
The year 2019 marks the 10th anniversary of Angry Birds and we are this year aiming to launch at least two new games. One game, our new casual puzzle game Angry Birds Dream Blast was already launched on January 24th, 2019. The game has had a good initial performance, comparable to Angry Birds Match, although we are still ramping up user acquisition.
Our next game launch is likely to take place in the second half of the year. We have strengthened our new games pipeline which consists of 13 new games in development for 2019-2021, of which one is in soft launch. We are naturally also excited for the premier of the Angry Birds Movie sequel in August and expect the movie and surrounding marketing to boost our licensing business as well as drive users to our Angry Birds games towards the end of 2019.
To accelerate its growth, Hatch Entertainment, Rovio’s 80% owned subsidiary developing a game streaming service, is seeking external funding and further strategic partnerships. Hence, Rovio is prepared to reduce its ownership in Hatch Entertainment below 50%.
In February 2019, Hatch announced a strategic partnership with Japanese mobile teleoperator NTT DoCoMo. The collaboration aims to bring the 5G cloud gaming to Japan, the third largest mobile gaming market. As part of the strategic partnership, NTT DoCoMo Ventures made an investment into Hatch in the form of a convertible note where the conversion is dependent on the total external funding round.
Outlook for 2019 In 2019, Rovio expects group revenues to grow to EUR 300 – 330 million and adjusted operating profit
margin between 9 and 11 per cent.
Basis for outlook In 2019, Rovio Games business continues developing its live game portfolio according to the Games as
a Service strategy, profitable user acquisition and development of new games. Target is to launch at least two new games in 2019 (the first one, Angry Birds Dream Blast, was launched on January 24th). The expected timing of the second launch is during the second half of the year.
The user acquisition investments are expected to be around 30 percent of Games revenues for the full year with payback target of 12 months. The amount of user acquisition may vary depending on development of the games’ monetization, timing of new game launches and the level of competition in the market.
The Brand Licensing segment revenues are expected grow in 2019 with focus on the second half of the year when the Angry Birds Movie sequel is scheduled for release.
The first half of 2019 is expected to have revenues at a similar level or slightly better than the last half of 2018 while the profit is less than the average for the whole year of 2019. Overall, the largest revenue growth and profit contribution is expected from the second half of 2019. The profit margin excluding Hatch Entertainment is expected to be between 12 and 14 per cent.
4
Briefing and webcast: Rovio will host an English language webcast on the 2018 fourth quarter and full year financial results,
including the Q&A session for investors, media and institutional investors at 14:00-15:00 EET on 14.2.2019. The webcast can be viewed live at: http://www.rovio.com/investors-investor-calendar , and later on the same day as a recording.
More information: Kati Levoranta, CEO, tel. +358 207 888 300 René Lindell, CFO, tel. +358 207 888 300 Mikko Setälä EVP, Investor Relations, tel. +358 400 607 437 Distribution: Nasdaq Helsinki, principal media, www.rovio.com
Rovio in brief Rovio Entertainment Corporation is a global, games-first entertainment company that creates,
develops and publishes mobile games which have been downloaded over 4 billion times. The Company is best known for the global Angry Birds brand, which started as a popular mobile game in 2009, and has since evolved from games to various entertainment and consumer products in brand licensing. Today the Company offers multiple mobile games, animations and has produced The Angry Birds Movie, which opened number one in theaters in 50 countries, and the sequel to which is set for theatrical release in 2019. Rovio is headquartered in Finland and the Company's shares are listed on the main list of the NASDAQ Helsinki stock exchange with the trading code ROVIO. (www.rovio.com)
5
Rovio Entertainment Corporation Financial Statement Bulletin 1–12/2018
A description of the accounting standards applied in the preparation of this Financial Statement Bulletin is provided in the notes to this interim report, in Note 1 Accounting principles.
Market review According to market intelligence provider Newzoo’s latest global games market report published in
January 2019, the global mobile gaming market size in end-user generated revenue was estimated to be USD 63 billion in 2018 which represented 13% year-on-year growth. The global growth rate was somewhat reduced in 2018 from earlier estimates due to the Chinese government’s 9-month hiatus in approving new game launches for both foreign and domestic game developers. In December 2018, the Chinese government restarted the approving of new games. Newzoo estimates the global mobile gaming market to grow to USD 72 billion in 2019 which represents 14% year-on-year growth.
In the long-term, the global mobile gaming market is expected to continue its double-digit growth of 13% CAGR during 2018-2021. The Western market is expected to grow at 10% CAGR during 2018-21.
Revenue and result
October-December 2018 In the fourth quarter, Rovio group revenue was EUR 72.7 million (73.9) or decline of -1.7%. In
comparable currencies the decline was approximately -3%. The Games segment revenue was EUR 65.2 million (66.1) or -1.4% lower year-on-year. The decline in
revenues was due to increase in deferred revenues as the gross bookings grew to EUR 66.7 million (66.1) or 1.0% growth year-on-year%. In comparable currencies, the gross bookings for the quarter were at the same level as last year.
The revenue of the Brand Licensing -segment was EUR 7.5 million (7.8) or 4.0% decline year-on-year. The revenue consisted of EUR 4.6 million (3.8) from Content Licensing, the majority of which was income from the Angry Birds Movie, and EUR 2.8 million (4.0) from Consumer Products. The revenues from the Angry Birds Movie where a bit higher compared to last year’s reporting period, however, we see this as a variability in the timing of revenues rather than a trend change.
The Group’s adjusted EBITDA was EUR 8.6 million (14.1), or 11.9% (19.0%) of revenues. The lower EBITDA this year compared to last year was due to higher user acquisition investments in this quarter.
The Group’s adjusted operating profit was EUR 5.3 million (10.5) and adjusted operating profit margin 7.2% (14.2%). Excluding Hatch Entertainment operating expenses, the Group’s adjusted profit was 8.2 million (12.2) and operating profit margin 11.2% (16.5%). The adjustment in the quarter was EUR 0.7 million bargain profit from the acquisition of Playraven, a mobile games studio based in Helsinki. The profit was recorded as other income in the other segment. Adjustments in the fourth quarter of 2017 amounted to EUR 0.1 million and were related to Rovio’s Initial Public Offering.
The Games segment’s adjusted EBITDA was EUR 8.3 million (14.0) or 12.7% (21.2%) of revenues. Games profitability was lower compared to last year due to higher user acquisition investments in the current reporting period: EUR 23.3 million (15.9) or 35.7% of revenues (24.0%). The higher user acquisition investments were mainly targeted to drive growth of Angry Birds 2.
The Brand Licensing segment’s adjusted EBITDA was EUR 5.0 million (3.7) and grew year-on-year due to higher level of movie revenues in the reporting period.
The Group’s profit before taxes was EUR 6.2 million (9.9) and earnings per share EUR 0.05 (0.10).
6
January-December 2018 Rovio group full year revenue amounted to EUR 281.2 million (297.2). The 5.4% decrease in revenue
compared to last year was due to the large revenue peak from the Angry Birds Movie in second quarter of 2017. In comparable currencies, the revenue decrease was approximately -3%.
The Games segment revenue grew 1.0% to EUR 250.4 million (248.0). In comparable currencies, the year-on-year revenue of Games segment grew by approximately 4%.
The revenue of the Brand Licensing segment declined 37.4% to EUR 30.8 million (49.2). The revenue consisted of EUR 22.2 million (38.0) from Content Licensing, the majority of which was income from the Angry Birds Movie, and EUR 8.6 million (11.2) from Consumer Products. The year-on-year comparability of Content Licensing is impacted by the revenue peak from the Angry Birds Movie in second quarter of 2017.
The Group’s EBITDA declined to EUR 47.8 million (60.0), or to 17.0% (20.2) of revenues. The Group’s adjusted EBITDA declined to EUR 47.5 million (64.5), or 16.9% (21.7) of revenues. The year-on-year decline in EBITDA was due to the peak in movie revenues in 2017.
The Group’s operating profit was EUR 31.5 million (31.4) and the operating profit margin was 11.2 % (10.6). The Group’s adjusted operating profit was EUR 31.2 million (35.9) and adjusted operating profit margin 11.1% (12.1). Adjustments in January-December 2018 were in total EUR -0.3 million of which EUR 0.3 million were related to the closure of Rovio’s game studio in London and EUR -0.7 million related to bargain profit from the acquisition of Playraven, a mobile game studio based in Helsinki. Adjustments in January-December 2017 amounted to EUR 4.5 million and were related to the reorganization of the Brand Licensing unit and Rovio’s Initial Public Offering.
The Games segment’s adjusted EBITDA was EUR 40.8 million (43.2) or 16.3% of revenues (17.4). Games segment’s profitability was lower year-on-year due to higher user acquisition investments during the last quarter of 2018. The user acquisition investments grew to EUR 78.6 million (69.6) or 31.4% of revenues (28.1). The growth in user acquisition investments was possible due to improved performance of Angry Birds 2.
The Brand Licensing segment’s adjusted EBITDA was EUR 20.8 million (31.9). Brand licensing segment’s EBITDA decreased year-on-year due to the revenue peak of the Angry Birds Movie in the second quarter of 2017.
The Group’s profit before taxes was EUR 32.2 million (26.6) and earnings per share EUR 0.31 (0.27).
Financing and investments Rovio’s capital expenditure was EUR 0.9 million (1.1) in the fourth quarter of 2018. Rovio refers to the
user acquisition costs of the Games segment as investments, but pursuant to accounting regulations, they are recognized as expenses rather than investments due to their average payback period being less than one year.
The Games segment’s capital expenditure was EUR 0.0 million (0.9) in the fourth quarter. The decrease was mainly due to a decrease in the amount of external development projects. The Brand Licensing segment’s investments were EUR 0.2 million (0.2) in the fourth quarter. The Other-segment’s investments were EUR 0.8 million (0.0) for the last quarter and related to machinery and equipment as well as capitalized development costs in Hatch.
In the fourth quarter Rovio acquired all shares of PlayRaven Oy. PlayRaven is a Helsinki-based Finnish company that focuses on developing mobile strategy games.
Cash flow from financing amounted to EUR -2.4 million (-4.6) in the fourth quarter and consisted mainly of acquisition of treasury shares.
At the end of 2018, Rovio’s total interest-bearing loans amounted to EUR 3.6 million (2.5), consisting of product development loans from Tekes (the Finnish Funding Agency for Innovation). Rovio’s cash and cash equivalents at the end of the year amounted to EUR 123.6 million (90.8). In addition, the company has a revolving credit facility with an undrawn balance of EUR 20.0 million.
7
Development per business segment
Games
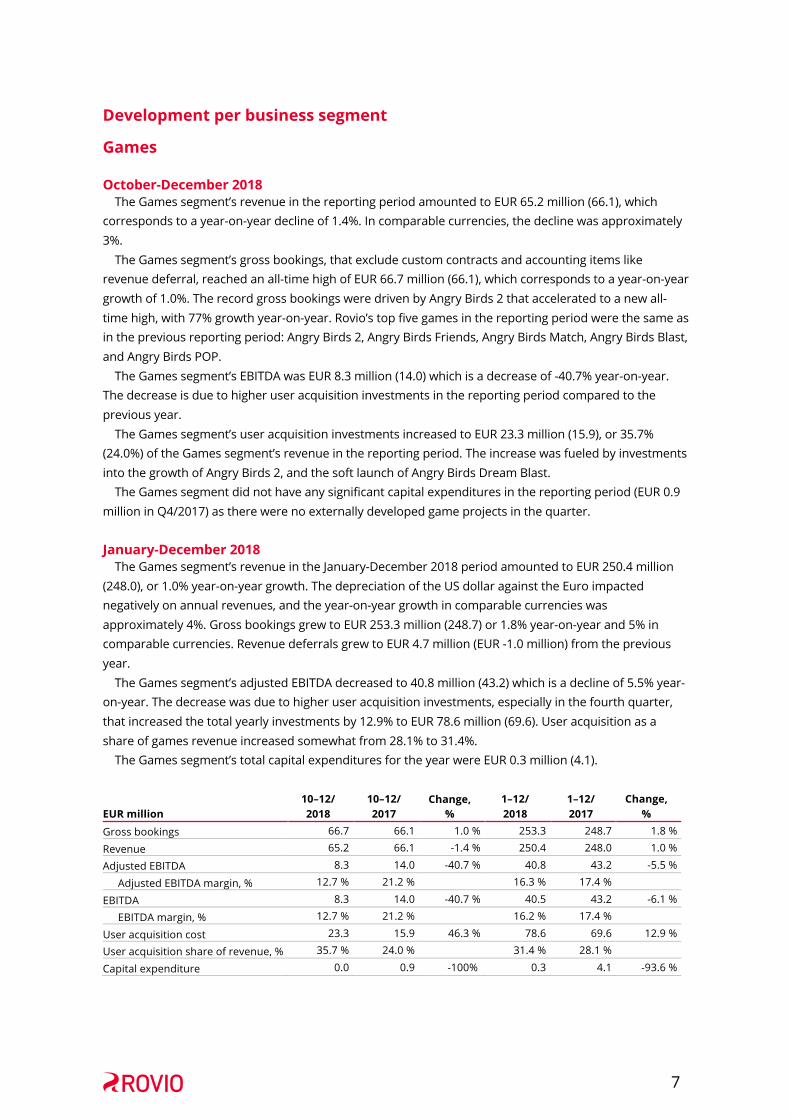
October-December 2018 The Games segment’s revenue in the reporting period amounted to EUR 65.2 million (66.1), which
corresponds to a year-on-year decline of 1.4%. In comparable currencies, the decline was approximately 3%.
The Games segment’s gross bookings, that exclude custom contracts and accounting items like revenue deferral, reached an all-time high of EUR 66.7 million (66.1), which corresponds to a year-on-year growth of 1.0%. The record gross bookings were driven by Angry Birds 2 that accelerated to a new all-time high, with 77% growth year-on-year. Rovio’s top five games in the reporting period were the same as in the previous reporting period: Angry Birds 2, Angry Birds Friends, Angry Birds Match, Angry Birds Blast, and Angry Birds POP.
The Games segment’s EBITDA was EUR 8.3 million (14.0) which is a decrease of -40.7% year-on-year. The decrease is due to higher user acquisition investments in the reporting period compared to the previous year.
The Games segment’s user acquisition investments increased to EUR 23.3 million (15.9), or 35.7% (24.0%) of the Games segment’s revenue in the reporting period. The increase was fueled by investments into the growth of Angry Birds 2, and the soft launch of Angry Birds Dream Blast.
The Games segment did not have any significant capital expenditures in the reporting period (EUR 0.9 million in Q4/2017) as there were no externally developed game projects in the quarter.
January-December 2018 The Games segment’s revenue in the January-December 2018 period amounted to EUR 250.4 million
(248.0), or 1.0% year-on-year growth. The depreciation of the US dollar against the Euro impacted negatively on annual revenues, and the year-on-year growth in comparable currencies was approximately 4%. Gross bookings grew to EUR 253.3 million (248.7) or 1.8% year-on-year and 5% in comparable currencies. Revenue deferrals grew to EUR 4.7 million (EUR -1.0 million) from the previous year.
The Games segment’s adjusted EBITDA decreased to 40.8 million (43.2) which is a decline of 5.5% year-on-year. The decrease was due to higher user acquisition investments, especially in the fourth quarter, that increased the total yearly investments by 12.9% to EUR 78.6 million (69.6). User acquisition as a share of games revenue increased somewhat from 28.1% to 31.4%.
The Games segment’s total capital expenditures for the year were EUR 0.3 million (4.1).
EUR million
10–12/ 2018
10–12/ 2017
Change, %
1–12/ 2018
1–12/ 2017
Change, %
Gross bookings 66.7 66.1 1.0 % 253.3 248.7 1.8 %
Revenue 65.2 66.1 -1.4 % 250.4 248.0 1.0 %
Adjusted EBITDA 8.3 14.0 -40.7 % 40.8 43.2 -5.5 %
Adjusted EBITDA margin, % 12.7 % 21.2 % 16.3 % 17.4 %
EBITDA 8.3 14.0 -40.7 % 40.5 43.2 -6.1 %
EBITDA margin, % 12.7 % 21.2 % 16.2 % 17.4 %
User acquisition cost 23.3 15.9 46.3 % 78.6 69.6 12.9 %
User acquisition share of revenue, % 35.7 % 24.0 % 31.4 % 28.1 %
Capital expenditure 0.0 0.9 -100% 0.3 4.1 -93.6 %

8
Key performance indicators of the Games segment The key performance indicators of the Games segment’s use gross bookings in place of revenue as it
gives a more accurate view of Rovio’s operating performance at a specific point in time. Gross bookings represent in-app purchases and in-app advertising sales in the given calendar month, reported based on the date of purchase/sale. Gross bookings do not include revenue from custom contracts, revenue deferrals or accounting adjustments due to, for example, foreign exchange rate differences between revenue accruals and actual payments, and thus differ from the reported revenue.
In the fourth quarter, the Games segment’s operative focus was in executing of its games-as-a-service strategy as well as in developing new games. Games-as-a-service strategy aims at improving game portfolio’s retention, i.e. keeping existing players longer in the game, and monetization through in-app purchases as well as in-app advertising. Improvements in these increase the expected lifetime value of a game’s player base, and thus allow for further growth through profitable user acquisition.
In the reporting period, both average revenue per daily active user (ARPDAU) and monthly average revenue per unique paying user (MARPPU) grew to all-time high figures. For the top 5 games, ARPDAU grew by 13% quarter-on-quarter from EUR 0.16 to EUR 0.18 and MARPPU by 8% from EUR 36.0 to EUR 38.7.
The amount of daily active users (DAU) declined quarter-on-quarter by 8% and 13% for the top 5 games and the whole game portfolio and amounted to 3.5 million (3.8) and 7.0 million (8.0), respectively. The decline was due to lower user acquisition spending outside Angry Birds 2, and less organic traffic from other sources such as app store discovery. Despite the decrease in daily active users, the number of monthly unique payers (MUP) remained stable at 444 thousand in top 5 games (451) and 504 thousand in the whole game portfolio (517).
EUR million 10-12/2018 7-9/2018 4-6/2018 1–3/2018 10–12/2017 7–9/2017
Gross bookings top 5 57.7 54.3 54.8 46.5 51.8 50.6
Gross bookings total 66.7 63.2 64.8 58.6 66.1 64.3 Million 10-12/2018 7-9/2018 4-6/2018 1–3/2018 10–12/2017 7–9/2017
DAU top 5 3.5 3.8 4.0 3.6 4.0 4.6
DAU all 7.0 8.0 8.8 8.7 9.2 10.7
MAU top 5 18.0 20.2 22.2 18.1 20.3 24.0 MAU all 50.1 59.6 64.2 61.7 64.8 79.5
Thousand 10-12/2018 7-9/2018 4-6/2018 1–3/2018 10–12/2017 7–9/2017
MUP top 5 444 451 497 407 447 469
MUP all 504 517 581 507 555 571
EUR 10-12/2018 7-9/2018 4-6/2018 1–3/2018 10–12/2017 7–9/2017
ARPDAU top 5 0.18 0.16 0.15 0.14 0.14 0.12
ARPDAU all 0.10 0.09 0.08 0.08 0.08 0.07
MARPPU top 5 38.7 36.0 33.5 35.6 35.6 33.7
MARPPU all 38.9 35.9 33.0 35.0 35.2 34.1
Game-specific performance in the Games segment In the fourth quarter of 2018, the Games segment’s gross bookings reached an all-time high of EUR
66.7 million (66.1), which is a growth of 1.0% year-on-year and 5.6% quarter-on-quarter. Angry Birds 2, which was released in July 2015 and is world’s leading slingshot game, continued to be
Rovio’s biggest and fastest growing game also in the fourth quarter of 2018, achieving all-time high gross bookings with 77% growth year-on-year and 14% quarter-on-quarter. The gross bookings of Angry Birds 2 amounted to EUR 35.2 million (19.9). Since its release, Angry Birds 2 has already reached total gross bookings of EUR 253 million.
9
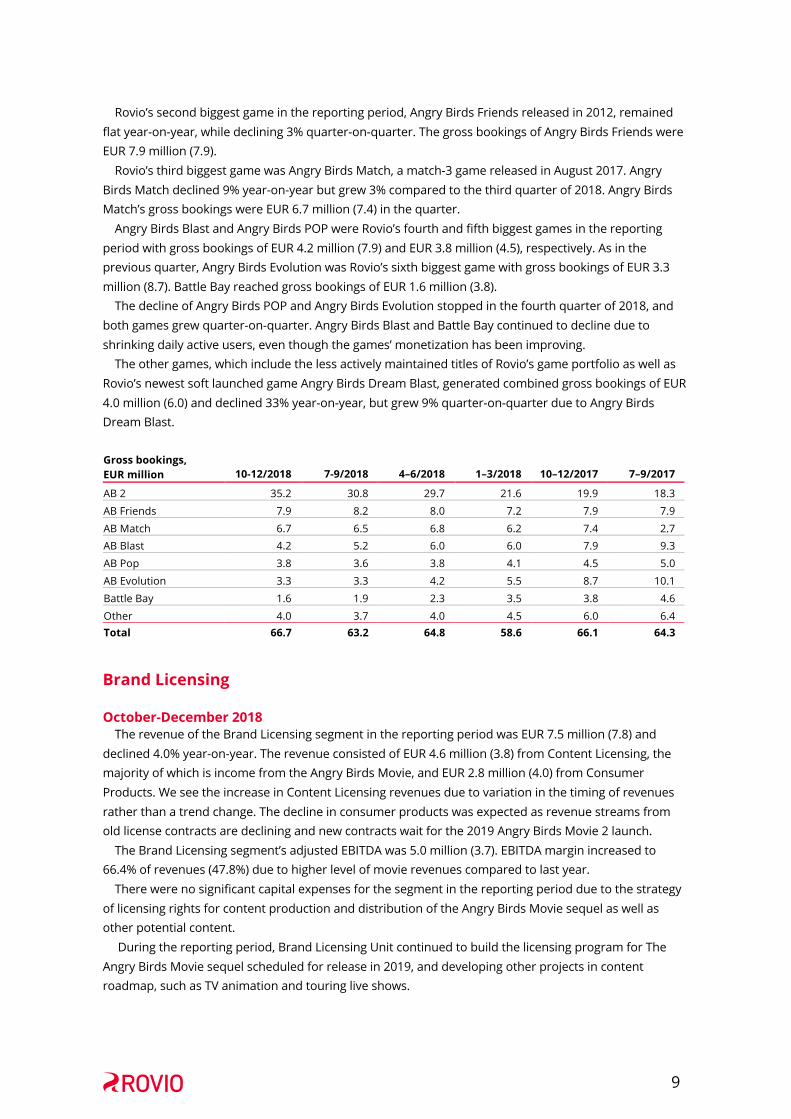
Rovio’s second biggest game in the reporting period, Angry Birds Friends released in 2012, remained flat year-on-year, while declining 3% quarter-on-quarter. The gross bookings of Angry Birds Friends were EUR 7.9 million (7.9).
Rovio’s third biggest game was Angry Birds Match, a match-3 game released in August 2017. Angry Birds Match declined 9% year-on-year but grew 3% compared to the third quarter of 2018. Angry Birds Match’s gross bookings were EUR 6.7 million (7.4) in the quarter.
Angry Birds Blast and Angry Birds POP were Rovio’s fourth and fifth biggest games in the reporting period with gross bookings of EUR 4.2 million (7.9) and EUR 3.8 million (4.5), respectively. As in the previous quarter, Angry Birds Evolution was Rovio’s sixth biggest game with gross bookings of EUR 3.3 million (8.7). Battle Bay reached gross bookings of EUR 1.6 million (3.8).
The decline of Angry Birds POP and Angry Birds Evolution stopped in the fourth quarter of 2018, and both games grew quarter-on-quarter. Angry Birds Blast and Battle Bay continued to decline due to shrinking daily active users, even though the games’ monetization has been improving.
The other games, which include the less actively maintained titles of Rovio’s game portfolio as well as Rovio’s newest soft launched game Angry Birds Dream Blast, generated combined gross bookings of EUR 4.0 million (6.0) and declined 33% year-on-year, but grew 9% quarter-on-quarter due to Angry Birds Dream Blast.
Gross bookings, EUR million 10-12/2018 7-9/2018 4–6/2018 1–3/2018 10–12/2017 7–9/2017
AB 2 35.2 30.8 29.7 21.6 19.9 18.3
AB Friends 7.9 8.2 8.0 7.2 7.9 7.9
AB Match 6.7 6.5 6.8 6.2 7.4 2.7 AB Blast 4.2 5.2 6.0 6.0 7.9 9.3
AB Pop 3.8 3.6 3.8 4.1 4.5 5.0
AB Evolution 3.3 3.3 4.2 5.5 8.7 10.1
Battle Bay 1.6 1.9 2.3 3.5 3.8 4.6
Other 4.0 3.7 4.0 4.5 6.0 6.4 Total 66.7 63.2 64.8 58.6 66.1 64.3
Brand Licensing
October-December 2018 The revenue of the Brand Licensing segment in the reporting period was EUR 7.5 million (7.8) and
declined 4.0% year-on-year. The revenue consisted of EUR 4.6 million (3.8) from Content Licensing, the majority of which is income from the Angry Birds Movie, and EUR 2.8 million (4.0) from Consumer Products. We see the increase in Content Licensing revenues due to variation in the timing of revenues rather than a trend change. The decline in consumer products was expected as revenue streams from old license contracts are declining and new contracts wait for the 2019 Angry Birds Movie 2 launch.
The Brand Licensing segment’s adjusted EBITDA was 5.0 million (3.7). EBITDA margin increased to 66.4% of revenues (47.8%) due to higher level of movie revenues compared to last year.
There were no significant capital expenses for the segment in the reporting period due to the strategy of licensing rights for content production and distribution of the Angry Birds Movie sequel as well as other potential content.
During the reporting period, Brand Licensing Unit continued to build the licensing program for The Angry Birds Movie sequel scheduled for release in 2019, and developing other projects in content roadmap, such as TV animation and touring live shows.
10
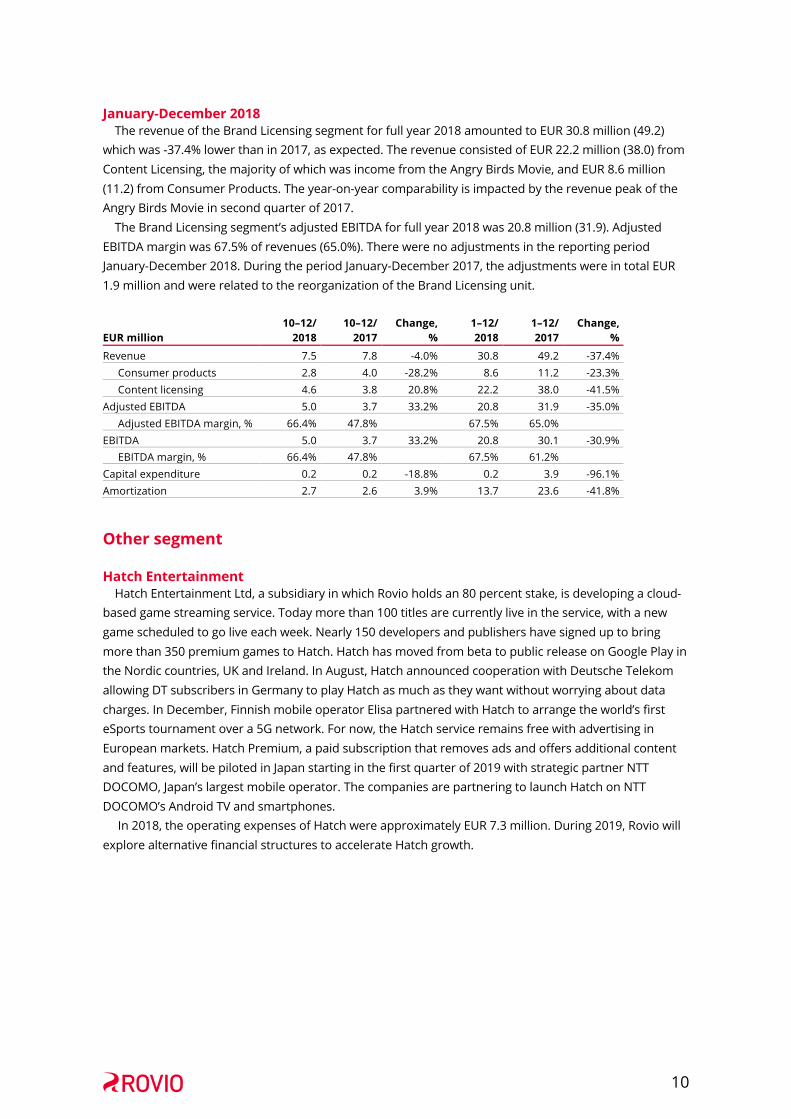
January-December 2018 The revenue of the Brand Licensing segment for full year 2018 amounted to EUR 30.8 million (49.2)
which was -37.4% lower than in 2017, as expected. The revenue consisted of EUR 22.2 million (38.0) from Content Licensing, the majority of which was income from the Angry Birds Movie, and EUR 8.6 million (11.2) from Consumer Products. The year-on-year comparability is impacted by the revenue peak of the Angry Birds Movie in second quarter of 2017.
The Brand Licensing segment’s adjusted EBITDA for full year 2018 was 20.8 million (31.9). Adjusted EBITDA margin was 67.5% of revenues (65.0%). There were no adjustments in the reporting period January-December 2018. During the period January-December 2017, the adjustments were in total EUR 1.9 million and were related to the reorganization of the Brand Licensing unit.
EUR million 10–12/
2018 10–12/
2017 Change,
% 1–12/ 2018
1–12/ 2017
Change, %
Revenue 7.5 7.8 -4.0% 30.8 49.2 -37.4% Consumer products 2.8 4.0 -28.2% 8.6 11.2 -23.3% Content licensing 4.6 3.8 20.8% 22.2 38.0 -41.5%
Adjusted EBITDA 5.0 3.7 33.2% 20.8 31.9 -35.0% Adjusted EBITDA margin, % 66.4% 47.8% 67.5% 65.0%
EBITDA 5.0 3.7 33.2% 20.8 30.1 -30.9% EBITDA margin, % 66.4% 47.8% 67.5% 61.2%
Capital expenditure 0.2 0.2 -18.8% 0.2 3.9 -96.1% Amortization 2.7 2.6 3.9% 13.7 23.6 -41.8%
Other segment
Hatch Entertainment Hatch Entertainment Ltd, a subsidiary in which Rovio holds an 80 percent stake, is developing a cloud-
based game streaming service. Today more than 100 titles are currently live in the service, with a new game scheduled to go live each week. Nearly 150 developers and publishers have signed up to bring more than 350 premium games to Hatch. Hatch has moved from beta to public release on Google Play in the Nordic countries, UK and Ireland. In August, Hatch announced cooperation with Deutsche Telekom allowing DT subscribers in Germany to play Hatch as much as they want without worrying about data charges. In December, Finnish mobile operator Elisa partnered with Hatch to arrange the world’s first eSports tournament over a 5G network. For now, the Hatch service remains free with advertising in European markets. Hatch Premium, a paid subscription that removes ads and offers additional content and features, will be piloted in Japan starting in the first quarter of 2019 with strategic partner NTT DOCOMO, Japan’s largest mobile operator. The companies are partnering to launch Hatch on NTT DOCOMO’s Android TV and smartphones.
In 2018, the operating expenses of Hatch were approximately EUR 7.3 million. During 2019, Rovio will explore alternative financial structures to accelerate Hatch growth.
11
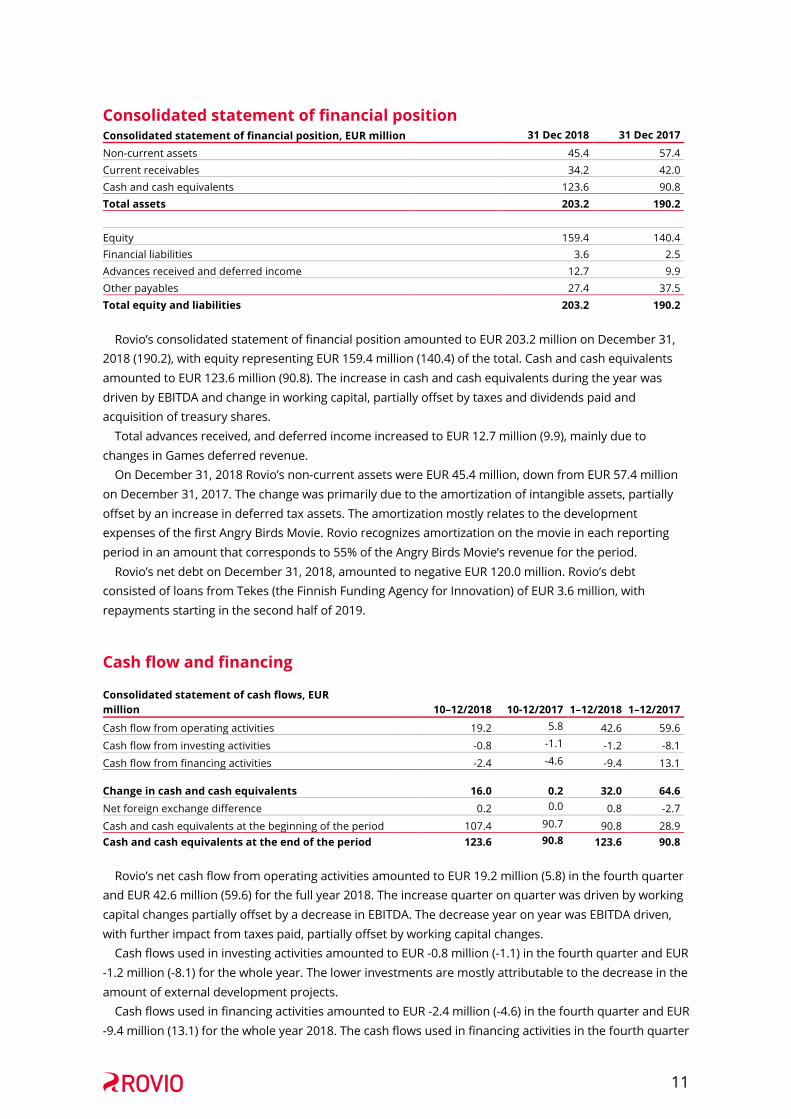
Consolidated statement of financial position Consolidated statement of financial position, EUR million 31 Dec 2018 31 Dec 2017
Non-current assets 45.4 57.4 Current receivables 34.2 42.0 Cash and cash equivalents 123.6 90.8 Total assets 203.2 190.2 Equity 159.4 140.4 Financial liabilities 3.6 2.5 Advances received and deferred income 12.7 9.9 Other payables 27.4 37.5 Total equity and liabilities 203.2 190.2
Rovio’s consolidated statement of financial position amounted to EUR 203.2 million on December 31,
2018 (190.2), with equity representing EUR 159.4 million (140.4) of the total. Cash and cash equivalents amounted to EUR 123.6 million (90.8). The increase in cash and cash equivalents during the year was driven by EBITDA and change in working capital, partially offset by taxes and dividends paid and acquisition of treasury shares.
Total advances received, and deferred income increased to EUR 12.7 million (9.9), mainly due to changes in Games deferred revenue.
On December 31, 2018 Rovio’s non-current assets were EUR 45.4 million, down from EUR 57.4 million on December 31, 2017. The change was primarily due to the amortization of intangible assets, partially offset by an increase in deferred tax assets. The amortization mostly relates to the development expenses of the first Angry Birds Movie. Rovio recognizes amortization on the movie in each reporting period in an amount that corresponds to 55% of the Angry Birds Movie’s revenue for the period.
Rovio’s net debt on December 31, 2018, amounted to negative EUR 120.0 million. Rovio’s debt consisted of loans from Tekes (the Finnish Funding Agency for Innovation) of EUR 3.6 million, with repayments starting in the second half of 2019.
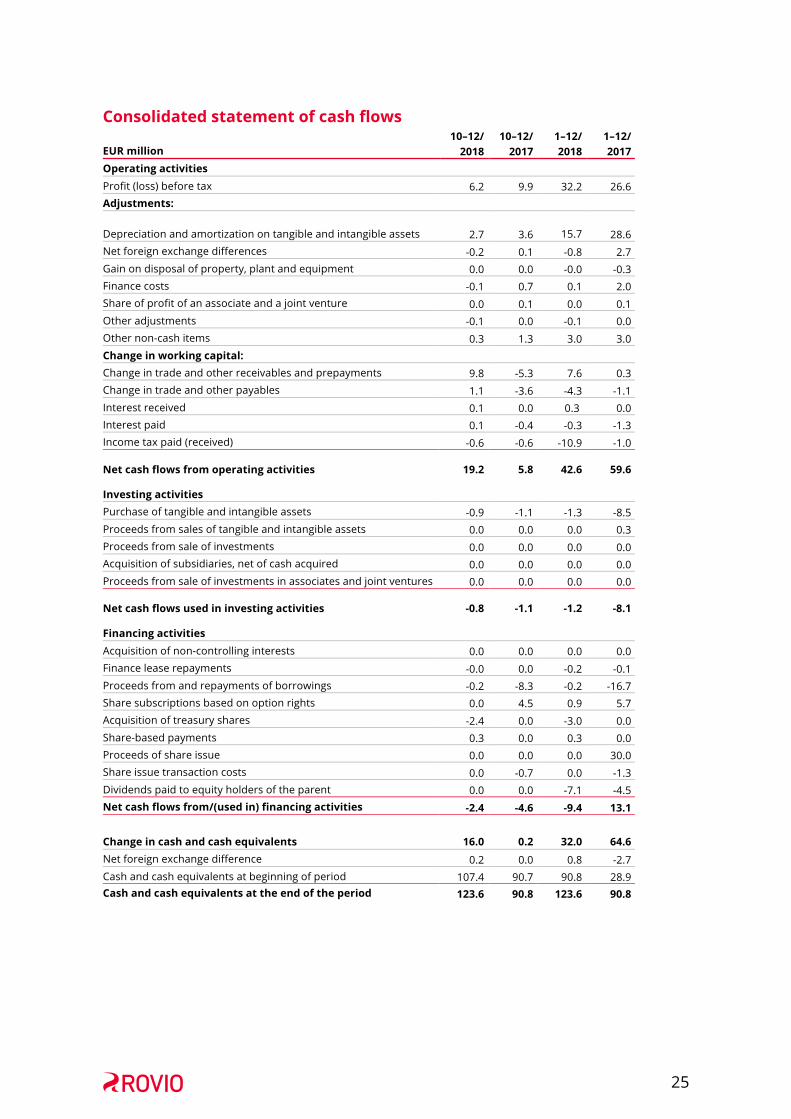
Cash flow and financing Consolidated statement of cash flows, EUR million
10–12/2018 10-12/2017 1–12/2018
1–12/2017
Cash flow from operating activities 19.2 5.8 42.6 59.6
Cash flow from investing activities -0.8 -1.1 -1.2 -8.1
Cash flow from financing activities -2.4 -4.6 -9.4 13.1
Change in cash and cash equivalents 16.0 0.2 32.0 64.6 Net foreign exchange difference 0.2 0.0 0.8 -2.7
Cash and cash equivalents at the beginning of the period 107.4 90.7 90.8 28.9 Cash and cash equivalents at the end of the period 123.6 90.8 123.6 90.8
Rovio’s net cash flow from operating activities amounted to EUR 19.2 million (5.8) in the fourth quarter
and EUR 42.6 million (59.6) for the full year 2018. The increase quarter on quarter was driven by working capital changes partially offset by a decrease in EBITDA. The decrease year on year was EBITDA driven, with further impact from taxes paid, partially offset by working capital changes.
Cash flows used in investing activities amounted to EUR -0.8 million (-1.1) in the fourth quarter and EUR -1.2 million (-8.1) for the whole year. The lower investments are mostly attributable to the decrease in the amount of external development projects.
Cash flows used in financing activities amounted to EUR -2.4 million (-4.6) in the fourth quarter and EUR -9.4 million (13.1) for the whole year 2018. The cash flows used in financing activities in the fourth quarter
12
2018 were driven by acquisition of treasury shares, whereas the fourth quarter of 2017 included a loan repayment of EUR 8.3 million partially offset by funds received from stock option subscriptions. The full year 2018 financing cash flows mainly consisted of dividends paid and acquisition of treasury shares, whereas in 2017 in addition to dividends paid they included the proceeds from the share issue in connection with the IPO and loan repayments, which did not occur in 2018.
Personnel From October to December 2018, Rovio’s average number of employees was 401 (397). The Games
business unit employed 307 people (313), the Brand Licensing business unit 32 people (36), and other operations, including Hatch Entertainment and administrative functions employed 62 people (48).
The average number of employees declined year-on-year due to the restructuring of the Brand Licensing business and support functions in 2017. The new movie and other animated content licensing model was implemented during the first quarter of 2017, which enabled the Company to operate with a smaller number of employees. 10–12/
2018 10–12/
2017 Change,
% 1–12/ 2018
1–12/ 2017
Change, %
Employees (average for the Period) 401 397 1.0% 388 416 -6.7%
Flagging notices Rovio received the following flagging notices during the fourth quarter. On December 19, Rovio Entertainment Corporation (the "Company") received a notification pursuant to
Chapter 9, Section 5 of the Securities Markets Act from Oivor AB. According to the notification, the holding of Oivor AB in the Company's shares and votes has risen above 30 percent threshold on 18 December 2018.
The change is due to a reorganization where the Company's shares previously owned by Trema International Holding B.V. have been resolved to be transferred to Oivor AB. Following the transfer, Trema International Holding B.V's direct ownership in the Company will decrease to zero. The beneficial owners of both, Oivor AB and Trema International Holding B.V., are Kaj Hed with 40 percent share of ownership and Camilla Hed-Wilson, Mikael Hed and Jonathan Hed, each with a 20 percent share of ownership. The beneficial owners use their decision-making powers in Oivor AB and Trema International Holding B.V. in proportion to their ownership. As the control of the Company's shares won't de facto be transferred, the Financial Supervisory Authority has granted Oivor AB an exemption from the obligation to make a takeover offer pursuant to the Securities Markets Act.
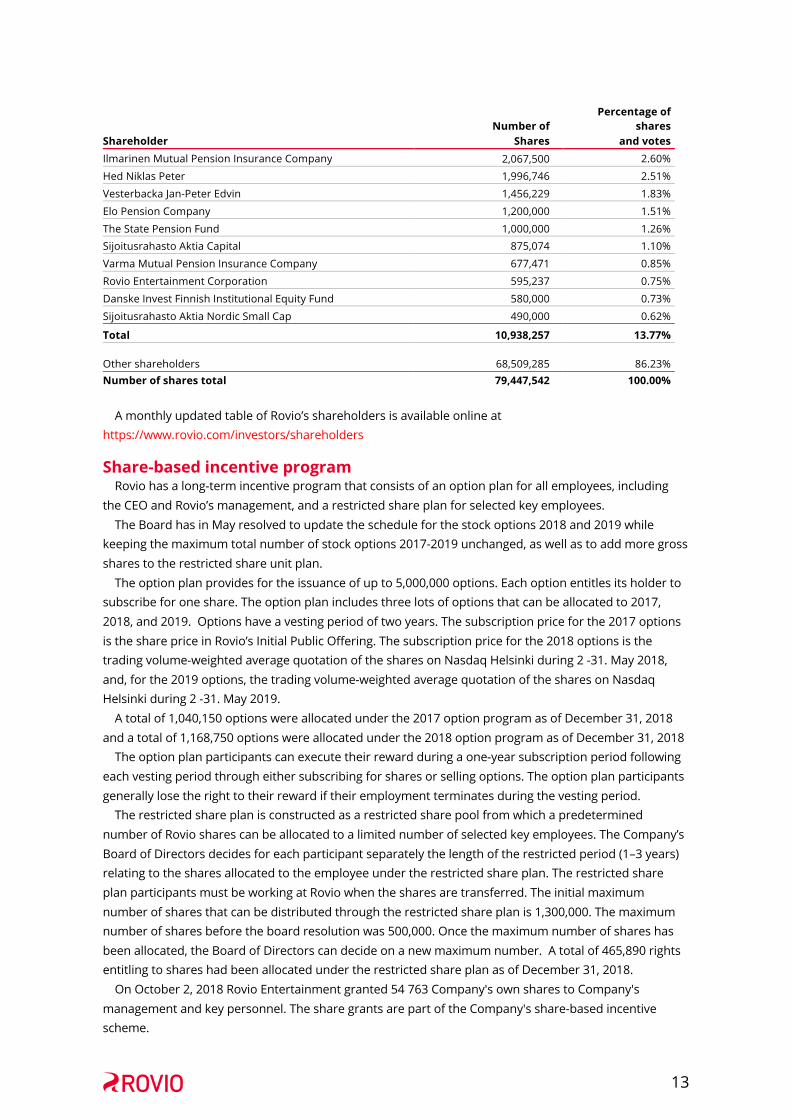
Shares and shareholders On December 31, 2018, Rovio’s share capital amounted to EUR 0.7 million and the number of shares
was 79,447,542. The shareholdings of the 10 largest shareholders are presented in the table below (nominee-registered holdings excluded). Oivor AB’s shareholding is nominee-registered and not explicitly shown in the table.
During the third quarter Rovio Entertainment started its share repurchase program. The shares are repurchased to be used as a part of the Company's incentive program. The maximum number of shares to be acquired is 650,000 corresponding to 0.8% of the total number of shares at the start of repurchase and the maximum sum to be used for the repurchase is EUR 7.0 million. The share repurchase ceased in December, when the 650,000 shares had been acquired. On October 2, 2018 Rovio Entertainment granted 54 763 Company's own shares to Company's management and key personnel. The share grants are part of the Company's share-based incentive scheme.
On December 31, 2018 Rovio Entertainment Corporation held 595,237 of its own shares.
13
Shareholder
Number of Shares
Percentage of shares
and votes Ilmarinen Mutual Pension Insurance Company 2,067,500 2.60%
Hed Niklas Peter 1,996,746 2.51%
Vesterbacka Jan-Peter Edvin 1,456,229 1.83%
Elo Pension Company 1,200,000 1.51%
The State Pension Fund 1,000,000 1.26% Sijoitusrahasto Aktia Capital 875,074 1.10%
Varma Mutual Pension Insurance Company 677,471 0.85%
Rovio Entertainment Corporation 595,237 0.75%
Danske Invest Finnish Institutional Equity Fund 580,000 0.73%
Sijoitusrahasto Aktia Nordic Small Cap 490,000 0.62%
Total 10,938,257 13.77%
Other shareholders 68,509,285 86.23% Number of shares total 79,447,542 100.00%
A monthly updated table of Rovio’s shareholders is available online at
https://www.rovio.com/investors/shareholders
Share-based incentive program Rovio has a long-term incentive program that consists of an option plan for all employees, including
the CEO and Rovio’s management, and a restricted share plan for selected key employees. The Board has in May resolved to update the schedule for the stock options 2018 and 2019 while
keeping the maximum total number of stock options 2017-2019 unchanged, as well as to add more gross shares to the restricted share unit plan.
The option plan provides for the issuance of up to 5,000,000 options. Each option entitles its holder to subscribe for one share. The option plan includes three lots of options that can be allocated to 2017, 2018, and 2019. Options have a vesting period of two years. The subscription price for the 2017 options is the share price in Rovio’s Initial Public Offering. The subscription price for the 2018 options is the trading volume-weighted average quotation of the shares on Nasdaq Helsinki during 2 -31. May 2018, and, for the 2019 options, the trading volume-weighted average quotation of the shares on Nasdaq Helsinki during 2 -31. May 2019.
A total of 1,040,150 options were allocated under the 2017 option program as of December 31, 2018 and a total of 1,168,750 options were allocated under the 2018 option program as of December 31, 2018
The option plan participants can execute their reward during a one-year subscription period following each vesting period through either subscribing for shares or selling options. The option plan participants generally lose the right to their reward if their employment terminates during the vesting period.
The restricted share plan is constructed as a restricted share pool from which a predetermined number of Rovio shares can be allocated to a limited number of selected key employees. The Company’s Board of Directors decides for each participant separately the length of the restricted period (1–3 years) relating to the shares allocated to the employee under the restricted share plan. The restricted share plan participants must be working at Rovio when the shares are transferred. The initial maximum number of shares that can be distributed through the restricted share plan is 1,300,000. The maximum number of shares before the board resolution was 500,000. Once the maximum number of shares has been allocated, the Board of Directors can decide on a new maximum number. A total of 465,890 rights entitling to shares had been allocated under the restricted share plan as of December 31, 2018.
On October 2, 2018 Rovio Entertainment granted 54 763 Company's own shares to Company's management and key personnel. The share grants are part of the Company's share-based incentive scheme.

14
Changes in Management On November 14th Rovio announced that Alexandre Pelletier-Normand has been appointed as the
Executive Vice President of Rovio’s Games Business Unit and a member of Leadership Team. Alexandre is a seasoned games executive with a remarkable career in the industry. He is joining Rovio from Gameloft and started on January 2, 2019.
On 1st February, 2019 Heini Kaihu, previously head of Rovio Games Puzzle studio, was appointed as head of HR and will be a member of the Rovio Leadership Team.
Risks The Company’s liquidity and cash flow is strong, and the profitability outlook remains positive, which
enables the Company to continue to execute its business in accordance with its strategy. Based on the Company’s assessment, there were no material changes in the risks and uncertainties
during the review period. The most significant risks are related to the financial performance of Rovio’s top games in the market,
the continuous development of these games, and keeping up player activity. Risks in user acquisition relate to the accuracy of the profit models and the impact on the Group’s net profit. New games introduced by competitors and changes in the competitive landscape may also impact the success of Rovio’s games, revenues, size of user acquisition investments, and the Group’s profit. Changes in governmental regulations in different countries can have both short- and long-term implications for the business.
Other significant risks relate to the demand for Angry Birds branded consumer products and other content that may impact the revenues of the Brand Licensing business unit.
The Company engages in business in several currencies, with the euro and U.S. dollar being the most significant. Fluctuations in exchange rates, particularly between the euro and the U.S. dollar could have a material impact on the Company’s result.
More details on the risks, uncertainties, and Rovio’s risk management can be found online at Rovio.com and in the most recent published financial statements.
Outlook for 2019 In 2019, Rovio expects group revenues to grow to EUR 300 – 330 million and adjusted operating profit
margin between 9 and 11 per cent.
Basis for outlook In 2019, Rovio Games business continues developing its live game portfolio according to the Games as
a Service strategy, profitable user acquisition and development of new games. Target is to launch at least two new games in 2019 (the first one, Angry Birds Dream Blast, was launched on January 24th). The expected timing of the second launch is during the second half of the year.
The user acquisition investments are expected to be around 30 percent of Games revenues for the full year with payback target of 12 months. The amount of user acquisition may vary depending on development of the games’ monetization, timing of new game launches and the level of competition in the market.
The brand Licensing segment revenues are expected grow in 2019 with focus on the second half of the year when the Angry Birds movie sequel is scheduled for release.
The first half of 2019 is expected to have revenues at a similar level or slightly better than the last half of 2018 while the profit is less than the average for the whole year of 2019. Overall, the largest revenue growth and profit contribution is expected from the second half of 2019. The profit margin excluding Hatch Entertainment is expected to be between 12 and 14 per cent.

15
Decisions of the Annual General Meeting and the organizing meeting of the Board of Directors
The Annual General Meeting of Rovio was held on April 16, 2018. The Annual General Meeting approved the financial statements for the financial year 2017 and discharged the members of the Board of Directors and the CEO from liability for the 2017 financial year. The Annual General Meeting decided, in accordance with the proposal of the Board of Directors, to distribute a dividend of EUR 0.09 per share. The record date of the dividend distribution was April 18, 2018 and the dividend was paid on April 25, 2018.
The Annual General Meeting decided that the Board of Directors shall comprise six (6) members. Mr. Kaj Hed, Ms. Camilla Hed-Wilson, Mr. Kim Ignatius, Mr. Mika Ihamuotila, Ms. Jenny Wolfram and Mr. Niklas Zennström were re-elected members of the Board of Directors for a term of office expiring at the end of the Annual General Meeting in 2019. Mr. Mika Ihamuotila was elected as the Chairman and Mr. Kaj Hed was elected as the Vice Chairman of the Board of Directors. The Annual General Meeting decided that the members of the Board of Directors will be paid monthly remuneration as follows: Chairman EUR 9,500; Vice Chairman EUR 7,500; other members EUR 5,000 each and EUR 2,500 as additional monthly compensation to the chairman of the Audit Committee. If the chairman of the Audit Committee is the Chairman or Vice Chairman of the Board of Directors, no additional compensation will be paid. Reasonable travel expenses of the Board members and committee members arising from Board or committee work will be compensated. Ernst & Young Oy, authorized public accountants, was re-elected as the auditor of the company.
The Annual General Meeting authorized the Board of Directors to decide on the repurchase and/or on the acceptance as pledge of the company's own shares up to a maximum of 7,938,554 shares (approximately 10 % of all the current shares in the company).
The Annual General Meeting authorized the Board of Directors to decide on the issuance of shares and the issuance of special rights entitling to shares up to a maximum of 15,877,108 shares (approximately 20 percent of all the current shares of the company).
Both authorizations will be in force until the closing of the next Annual General Meeting, however no longer than until June 30, 2019.
In the organizing meeting of the Board of Directors held after the Annual General Meeting, the Board of Directors elected from amongst its members Mr. Kim Ignatius (Chair), Mr. Mika Ihamuotila and Ms. Jenny Wolfram as members of the Audit Committee, and Mr. Kim Ignatius (Chair), Mr. Mika Ihamuotila and Ms. Jenny Wolfram as members of the Remuneration Committee.
Dividend proposal The parent company’s distributable funds amount to EUR 158,924,820.16, of which the profit for the
period is EUR 26,105,301.07. The Board of Directors proposes to the Annual General Meeting to be held on April 9, 2019 that a dividend of EUR 0.09 per share be paid (EUR 0.09 for 2017). Based on the number of shares outstanding as of the balance sheet date, December 31, 2018, the total amount of the dividend is EUR 7,096,707.45.
There have been no significant changes in the Company’s financial position after the end of the financial year. In the Board of Directors’ view, the proposed distribution dividend does not compromise the Company’s solvency.
Annual Report and Corporate Governance Statement The estimated time of publication of Rovio’s Annual Report 2018 is latest during the week 12, 2019.
The Annual Report will be published online at www.rovio.com. The Annual Report will include the Report by the Board of Directors and the financial statements for 2018. Rovio’s Corporate Governance
16
Statement and Remuneration Statement will be issued as separate documents from the financial statements and will become available for download at [www.rovio.com].
Annual General Meeting Rovio Entertainment Corporation’s Annual General Meeting will be held in Helsinki on April 9, 2019.
More information is available online at https://www.rovio.com/investors/governance/corporate-governance/general-meeting-2019.
Events after the review period After the review period a total of 17,200 Rovio Entertainment Corporation's new shares were
subscribed for with stock options. The entire subscription price of EUR 49,020.00 was recorded into the invested unrestricted equity reserve.
As a result of the share subscriptions, the number of Rovio Entertainment Corporation's shares increased to 79,464,742 shares. The shares subscribed for under the stock options were registered in the Trade Register on 30 January 2019, as of which date the new shares established shareholder rights.
ROVIO ENTERTAINMENT CORPORATION Board of Directors
17
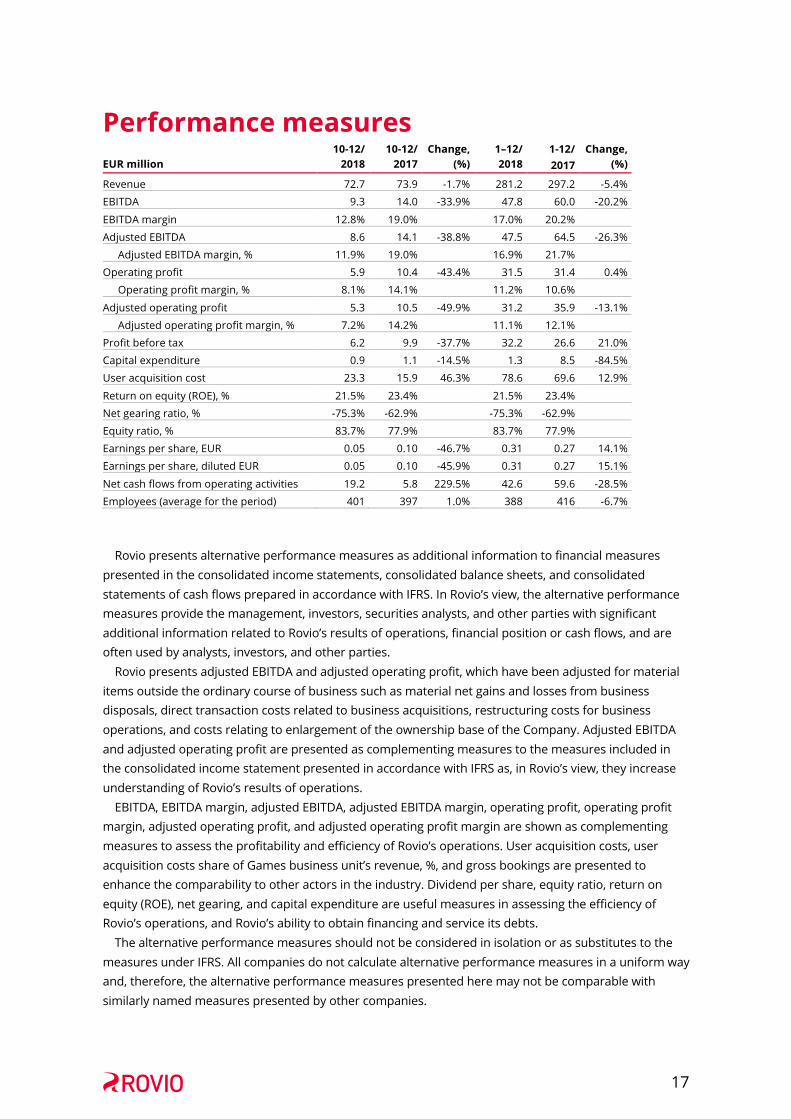
Performance measures 10-12/ 10-12/ Change, 1–12/ 1-12/ Change, EUR million 2018 2017 (%) 2018 2017 (%)
Revenue 72.7 73.9 -1.7% 281.2 297.2 -5.4%
EBITDA 9.3 14.0 -33.9% 47.8 60.0 -20.2%
EBITDA margin 12.8% 19.0% 17.0% 20.2%
Adjusted EBITDA 8.6 14.1 -38.8% 47.5 64.5 -26.3%
Adjusted EBITDA margin, % 11.9% 19.0% 16.9% 21.7%
Operating profit 5.9 10.4 -43.4% 31.5 31.4 0.4%
Operating profit margin, % 8.1% 14.1% 11.2% 10.6%
Adjusted operating profit 5.3 10.5 -49.9% 31.2 35.9 -13.1%
Adjusted operating profit margin, % 7.2% 14.2% 11.1% 12.1%
Profit before tax 6.2 9.9 -37.7% 32.2 26.6 21.0%
Capital expenditure 0.9 1.1 -14.5% 1.3 8.5 -84.5%
User acquisition cost 23.3 15.9 46.3% 78.6 69.6 12.9%
Return on equity (ROE), % 21.5% 23.4% 21.5% 23.4%
Net gearing ratio, % -75.3% -62.9% -75.3% -62.9%
Equity ratio, % 83.7% 77.9% 83.7% 77.9%
Earnings per share, EUR 0.05 0.10 -46.7% 0.31 0.27 14.1%
Earnings per share, diluted EUR 0.05 0.10 -45.9% 0.31 0.27 15.1%
Net cash flows from operating activities 19.2 5.8 229.5% 42.6 59.6 -28.5%
Employees (average for the period) 401 397 1.0% 388 416 -6.7% Rovio presents alternative performance measures as additional information to financial measures
presented in the consolidated income statements, consolidated balance sheets, and consolidated statements of cash flows prepared in accordance with IFRS. In Rovio’s view, the alternative performance measures provide the management, investors, securities analysts, and other parties with significant additional information related to Rovio’s results of operations, financial position or cash flows, and are often used by analysts, investors, and other parties.
Rovio presents adjusted EBITDA and adjusted operating profit, which have been adjusted for material items outside the ordinary course of business such as material net gains and losses from business disposals, direct transaction costs related to business acquisitions, restructuring costs for business operations, and costs relating to enlargement of the ownership base of the Company. Adjusted EBITDA and adjusted operating profit are presented as complementing measures to the measures included in the consolidated income statement presented in accordance with IFRS as, in Rovio’s view, they increase understanding of Rovio’s results of operations.
EBITDA, EBITDA margin, adjusted EBITDA, adjusted EBITDA margin, operating profit, operating profit margin, adjusted operating profit, and adjusted operating profit margin are shown as complementing measures to assess the profitability and efficiency of Rovio’s operations. User acquisition costs, user acquisition costs share of Games business unit’s revenue, %, and gross bookings are presented to enhance the comparability to other actors in the industry. Dividend per share, equity ratio, return on equity (ROE), net gearing, and capital expenditure are useful measures in assessing the efficiency of Rovio’s operations, and Rovio’s ability to obtain financing and service its debts.
The alternative performance measures should not be considered in isolation or as substitutes to the measures under IFRS. All companies do not calculate alternative performance measures in a uniform way and, therefore, the alternative performance measures presented here may not be comparable with similarly named measures presented by other companies.

18
Reconciliation of adjusted operating profit
EUR million 10-12/2018
Items affecting comparability
Income statement excluding items affecting
comparability
Revenue 72.7 72.7
Other operating income 1.0 -0.7 0.3
Materials and services -20.4 -20.4
Employee benefits expense -11.4 -11.4
Depreciation and amortization -3.4 -3.4
Other operating expenses -32.6 -32.6
Operating profit 5.9 -0.7 5.3
EUR million 10–12/2017
Items affecting
comparability
Income statement excluding items affecting
comparability
Revenue 73.9 73.9 Other operating income 0.0 0.0
Materials and services -22.1 -22.1
Employee benefits expense -13.7 -13.7
Depreciation and amortization -3.6 -3.6
Other operating expenses -24.2 0.1 -24.1
Operating profit 10.4 0.1 10.5
EUR million 1–12/2018
Items affecting
comparability
Income statement excluding items affecting
comparability
Revenue 281.2 281.2
Other operating income 1.1 -0.7 0.4
Materials and services -79.8 -79.8
Employee benefits expense -42.6 0.3 -42.4
Depreciation and amortization -16.3 0.0 -16.3
Other operating expenses -111.9 0.1 -111.9
Operating profit 31.5 -0.3 31.2
EUR million 1–12/2017
Items affecting
comparability
Income statement excluding items affecting
comparability
Revenue 297.2 297.2 Other operating income 0.8 0.8 Materials and services -81.8 -81.8 Employee benefits expense -51.9 1.8 -50.1 Depreciation and amortization -28.6 -28.6 Other operating expenses -104.2 2.7 -101.5 Operating profit 31.4 4.5 35.9
Reconciliation of adjusted operating profit EUR million 10–12/2018 10–12/2017 1–12/2018 1–12/2017 Operating profit 5.9 10.4 31.5 31.4 Income from Bargain Purchase -0.7 -0.7
Restructuring costs arising from employee benefits expenses 0.3
1.8
Restructuring costs in Other operating expenses 0.1
0.1
Restructuring costs in Depreciation and amortization 0.0 Listing-related expenses 0.1 2.5 Adjusted operating profit 5.3 10.5 31.2 35.9

19
Reconciliation of EBITDA and Adjusted EBITDA EUR million 10–12/2018 10–12/2017 1–12/2018 1–12/2017 Operating profit 5.9 10.4 31.5 31.4 Depreciation and amortization 3.4 3.6 16.3 28.6
EBITDA 9.3 14.0 47.8 60.0
Income from Bargain Purchase -0.7 -0.7 Restructuring costs arising from employee benefits expenses 0.3 1.8
Restructuring costs in Other operating expenses
0.1 0.1
Listing-related expenses 0.1 2.5 Adjusted EBITDA 8.6 14.1 47.5 64.5
Reconciliation of equity ratio, %, return on equity, %, net gearing ratio, %, and net debt EUR million 10–12/2018 10–12/2017 1–12/2018 1–12/2017
Equity ratio, % 83.7% 77.9% 83.7% 77.9% Equity 159.4 140.4 159.4 140.4
Advances received 6.5 8.3 6.5 8.3
Deferred revenue 6.2 1.6 6.2 1.6
Total assets 203.2 190.2 203.2 190.2
Return on equity, % 21.5% 23.4% 21.5% 23.4% Profit/loss before tax 32.2 26.6 32.2 26.6 Shareholder's equity beginning of period 140.4 86.8 140.4 86.8 Shareholder's equity end of period 159.4 140.4 159.4 140.4
Net gearing ratio, % -75.3% -62.9% -75.3% -62.9% Total interest-bearing debt 3.6 2.5 3.6 2.5 Cash and short-term deposits 123.6 90.8 123.6 90.8
Equity 159.4 140.4 159.4 140.4 Non-current interest-bearing loans and borrowings 3.4
2.5 3.4
2.5
Current interest-bearing loans and borrowings 0.1
0.0 0.1
0.0
Cash and short-term deposits 123.6 90.8 123.6 90.8 Net debt -120.0 -88.3 -120.0 -88.3
Gross bookings The following table sets out reconciliation of gross bookings used in key operational metrics and
reported revenue:
Reconciliation of gross bookings to revenue EUR million 10–12/2018 10–12/2017 1–12/2018 1–12/2017
Gross bookings 66.7 66.1 253.3 248.7
Change in deferred revenue -2.1 0.3 -4.7 1.0
Custom contracts 0.4 0.7 1.5 1.4
Other adjustments 0.3 -1.0 0.3 -3.1 Revenue 65.2 66.1 250.4 248.0
Custom contracts are distribution contracts that are signed with partners who pre-download Rovio’s
games onto their own devices or distribute Rovio’s games through their proprietary distribution platforms. Custom contracts usually contain a minimum guarantee and revenue share to Rovio. Rovio
20
recognizes corresponding minimum guarantee revenue over the contract period. Custom contracts do not include the application stores operated by Apple and Google.
Calculation principles of alternative performance measures EBITDA (Earnings before interest, taxes, depreciation and amortization), which is operating profit
before depreciations and amortizations. EBITDA margin, %, which is defined as EBITDA as a percentage of revenue. Items affecting comparability, which are defined as material items outside the ordinary course of
business such as material net gains and losses from business disposals, direct transaction costs related to business acquisitions, restructuring costs for business operations, and costs relating to enlargement of the ownership base of the company.
Adjusted EBITDA, which is defined as EBITDA excluding items affecting comparability. Adjusted EBITDA margin, %, which is defined as comparable EBITDA as a percentage of revenue. Operating profit margin, %, which is operating profit as a percentage of revenue. Adjusted operating profit, which is defined as operating profit excluding items affecting
comparability. Adjusted operating profit margin, %, which is defined as adjusted operating profit as a percentage of
revenue. User acquisition costs, which relate to acquisition of new players in the Company’s games through
performance marketing campaigns. User acquisition costs share of Games revenue, %, which is user acquisition costs as a percentage of
Games revenue. Dividend per share, which is total dividend divided by number of shares, adjusted for share issues, at
the end of the financial period less own shares. Earnings per share, which is the net result for the review period divided by the average number of
shares in the review period, less treasury shares. Equity ratio, %, which is calculated by dividing (i) Total equity by (ii) Total equity and liabilities less
advances received and deferred revenue. Return on equity (ROE), which is calculated by dividing profit before tax, quarterly reports adjusted to
correspond with 12 months, by the average of total equity in the opening and closing balance sheet. Capital expenditure, which is cash flow of purchase of tangible and intangible assets. Net debt, which is calculated by subtracting cash and short-term deposits from current and non-
current interest-bearing loans and borrowings. Net gearing %, which is calculated by dividing net debt by the total equity. Gross bookings represent in-app purchases and in-app advertising sales in the given calendar month,
reported on the basis of the date of purchase/sale. Gross bookings do not include revenue from custom contracts, revenue deferrals or accounting adjustments due to e.g., foreign exchange rate differences between revenue accruals and actual payments, and thus differs from the actual reported revenue.
DAU (Daily Active Users), which is defined as the number of devices that played one of our games during a particular day. Under this metric, a device that plays two different games on the same day is counted as two DAUs. We primarily use information provided by Rovio’s own technology but we also use third-party tracking solutions for historical data and in cases when a game does not contain Rovio’s tracking tools. Average DAUs for a particular period is the average of the DAUs for each day during that period.
MAU (Monthly Active Users), which is defined as the number of devices that played one of our games in the during a particular calendar month. Under this metric, a device that plays two different games in the same month is counted as two MAUs. We primarily use information provided by Rovio’s own technology but we also use third party tracking solutions for historical data and in cases when a game
21
does not contain Rovio’s tracking tools. MUP (Monthly Unique Payers), which is defined as the number of devices that made a payment at least
once during the calendar month through a payment method for which we can quantify the number of individuals, including payers from our mobile games. MUPs does not include individuals who use certain payment methods for which we cannot quantify the number of unique payers. We only use information provided by Rovio’s own payment verification technology.
ARPDAU (Average Revenue Per Daily Active User), which is defined as Sum of quarterly Gross Bookings divided by number of days in the quarter divided by average DAU for the quarter.
MARPPU (Monthly Average Revenue Per Paying User), which is defined as Monthly Gross IAP Bookings divided by MUP from verified purchases. MARPPU does not include revenue from custom contracts, revenue deferrals or accounting adjustments such as foreign exchange rate differences between revenue accruals and actual payments.

22
Financial Statement Bulletin January 1– December 31, 2018 - Tables
The Financial Statement Bulletin is based on the audited financial statements for the year 2018
Statement of consolidated profit or loss and other comprehensive income
EUR million
10–12/ 2018
10–12/ 2017
1–12/ 2018
1–12/ 2017
Revenue 72.7 73.9 281.2 297.2 Other operating income 1.0 0.0 1.1 0.8 Materials and services 20.4 22.1 79.8 81.8 Employee benefits expense 11.4 13.7 42.6 51.9 Depreciation and amortization 3.4 3.6 16.3 28.6 Other operating expenses 32.6 24.2 111.9 104.2
Operating profit 5.9 10.4 31.5 31.4 Finance income and expenses 0.3 -0.4 0.7 -4.7 Share of profit of associates 0.0 -0.1 0.0 -0.1 Profit (loss) before tax 6.2 9.9 32.2 26.6
Income tax expense 1.9 1.9 7.7 6.0 Profit for the period 4.3 8.0 24.6 20.6
Attributable to: Non-controlling interests 0.0 0.0 0.0 0.0 Equity holders of the parent company 4.3 8.0 24.6 20.6 Other comprehensive income/expense
Other comprehensive income to be reclassified to profit or loss in subsequent periods (net of tax):
Translation differences 0.0 0.0 0.0 -0.4 Total comprehensive income for the period, net of tax 4.4 8.0 24.6 20.2
Attributable to: Non-controlling interests 0.0 0.0 0.0 0.0 Equity holders of the parent company 4.4 8.0 24.6 20.2
Earnings per share for net result attributable to owners of the parent:
Earnings per share, EUR 0.05 0.10 0.31 0.27 Earnings per share, diluted EUR 0.05 0.10 0.31 0.27
23
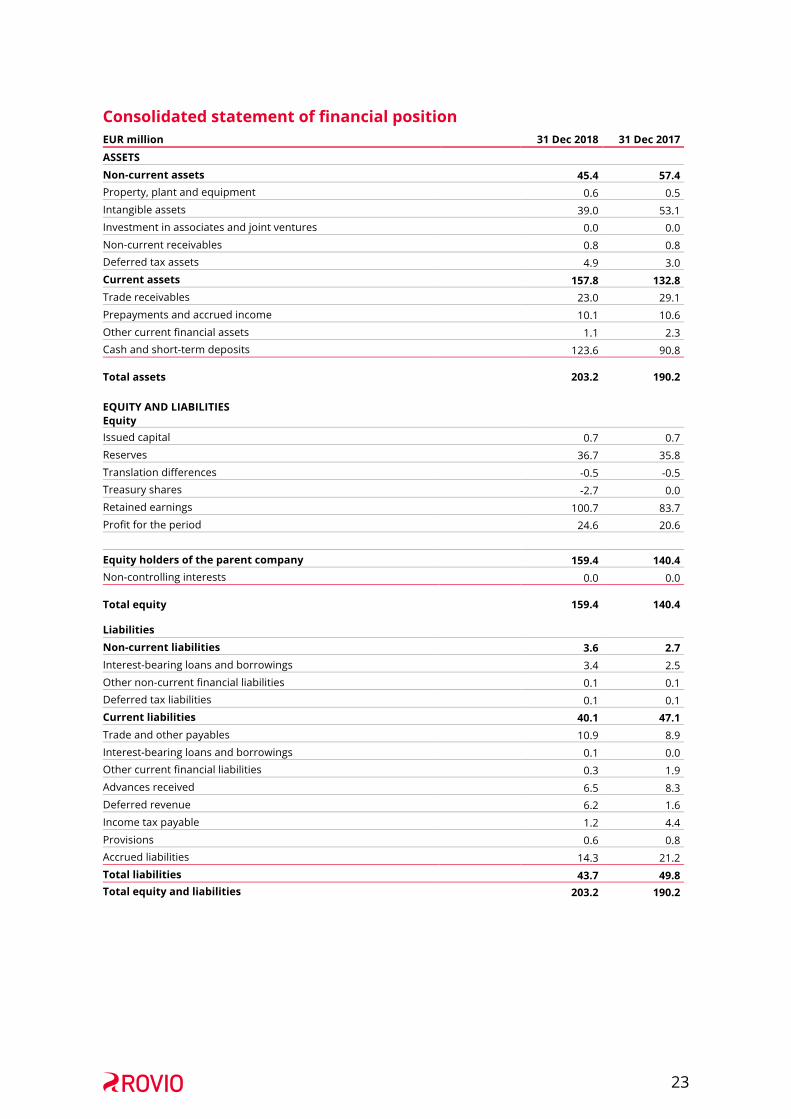
Consolidated statement of financial position EUR million 31 Dec 2018 31 Dec 2017 ASSETS
Non-current assets 45.4 57.4 Property, plant and equipment 0.6 0.5 Intangible assets 39.0 53.1 Investment in associates and joint ventures 0.0 0.0 Non-current receivables 0.8 0.8 Deferred tax assets 4.9 3.0 Current assets 157.8 132.8 Trade receivables 23.0 29.1 Prepayments and accrued income 10.1 10.6 Other current financial assets 1.1 2.3 Cash and short-term deposits 123.6 90.8
Total assets 203.2 190.2
EQUITY AND LIABILITIES Equity
Issued capital 0.7 0.7 Reserves 36.7 35.8 Translation differences -0.5 -0.5 Treasury shares -2.7 0.0 Retained earnings 100.7 83.7 Profit for the period 24.6 20.6
Equity holders of the parent company 159.4 140.4 Non-controlling interests 0.0 0.0
Total equity 159.4 140.4
Liabilities
Non-current liabilities 3.6 2.7 Interest-bearing loans and borrowings 3.4 2.5 Other non-current financial liabilities 0.1 0.1 Deferred tax liabilities 0.1 0.1 Current liabilities 40.1 47.1 Trade and other payables 10.9 8.9 Interest-bearing loans and borrowings 0.1 0.0 Other current financial liabilities 0.3 1.9 Advances received 6.5 8.3 Deferred revenue 6.2 1.6 Income tax payable 1.2 4.4 Provisions 0.6 0.8 Accrued liabilities 14.3 21.2 Total liabilities 43.7 49.8 Total equity and liabilities 203.2 190.2
24
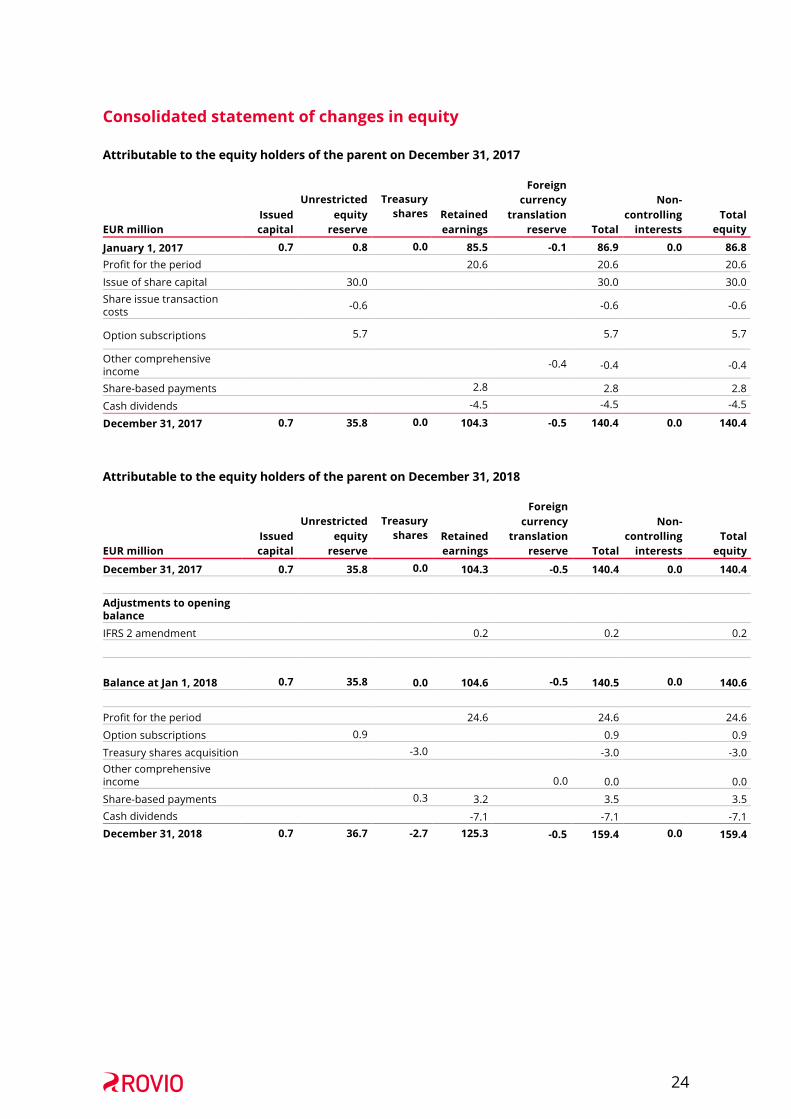
Consolidated statement of changes in equity
Attributable to the equity holders of the parent on December 31, 2017
EUR million
Issued capital
Unrestricted
equity reserve
Treasury shares
Retained earnings
Foreign currency
translation reserve
Total
Non-
controlling interests
Total
equity
January 1, 2017 0.7 0.8 0.0 85.5 -0.1 86.9 0.0 86.8 Profit for the period 20.6 20.6 20.6
Issue of share capital 30.0 30.0 30.0 Share issue transaction costs
-0.6
-0.6 -0.6
Option subscriptions 5.7
5.7 5.7
Other comprehensive income
-0.4 -0.4 -0.4
Share-based payments 2.8 2.8 2.8
Cash dividends -4.5 -4.5 -4.5
December 31, 2017 0.7 35.8 0.0 104.3 -0.5 140.4 0.0 140.4
Attributable to the equity holders of the parent on December 31, 2018
EUR million
Issued capital
Unrestricted
equity reserve
Treasury shares
Retained earnings
Foreign currency
translation reserve
Total
Non-
controlling interests
Total
equity
December 31, 2017 0.7 35.8 0.0 104.3 -0.5 140.4 0.0 140.4 Adjustments to opening balance
IFRS 2 amendment 0.2 0.2 0.2
Balance at Jan 1, 2018
0.7 35.8
0.0 104.6 -0.5 140.5 0.0 140.6
Profit for the period 24.6 24.6 24.6
Option subscriptions 0.9 0.9 0.9
Treasury shares acquisition -3.0 -3.0 -3.0 Other comprehensive income
0.0 0.0 0.0
Share-based payments 0.3 3.2 3.5 3.5 Cash dividends -7.1 -7.1 -7.1 December 31, 2018 0.7 36.7 -2.7 125.3 -0.5 159.4 0.0 159.4
25
Consolidated statement of cash flows
EUR million 10–12/
2018 10–12/
2017 1–12/ 2018
1–12/ 2017
Operating activities
Profit (loss) before tax 6.2 9.9 32.2 26.6 Adjustments:
Depreciation and amortization on tangible and intangible assets 2.7 3.6 15.7
28.6 Net foreign exchange differences -0.2 0.1 -0.8 2.7 Gain on disposal of property, plant and equipment 0.0 0.0 -0.0 -0.3 Finance costs -0.1 0.7 0.1 2.0 Share of profit of an associate and a joint venture 0.0 0.1 0.0 0.1 Other adjustments -0.1 0.0 -0.1 0.0 Other non-cash items 0.3 1.3 3.0 3.0 Change in working capital: Change in trade and other receivables and prepayments 9.8 -5.3 7.6 0.3 Change in trade and other payables 1.1 -3.6 -4.3 -1.1 Interest received 0.1 0.0 0.3 0.0 Interest paid 0.1 -0.4 -0.3 -1.3 Income tax paid (received) -0.6 -0.6 -10.9 -1.0
Net cash flows from operating activities 19.2 5.8 42.6 59.6
Investing activities Purchase of tangible and intangible assets -0.9 -1.1 -1.3 -8.5 Proceeds from sales of tangible and intangible assets 0.0 0.0 0.0 0.3 Proceeds from sale of investments 0.0 0.0 0.0 0.0 Acquisition of subsidiaries, net of cash acquired 0.0 0.0 0.0 0.0 Proceeds from sale of investments in associates and joint ventures 0.0 0.0 0.0 0.0
Net cash flows used in investing activities -0.8 -1.1 -1.2 -8.1
Financing activities
Acquisition of non-controlling interests 0.0 0.0 0.0 0.0 Finance lease repayments -0.0 0.0 -0.2 -0.1 Proceeds from and repayments of borrowings -0.2 -8.3 -0.2 -16.7 Share subscriptions based on option rights 0.0 4.5 0.9 5.7 Acquisition of treasury shares -2.4 0.0 -3.0 0.0 Share-based payments 0.3 0.0 0.3 0.0 Proceeds of share issue 0.0 0.0 0.0 30.0 Share issue transaction costs 0.0 -0.7 0.0 -1.3 Dividends paid to equity holders of the parent 0.0 0.0 -7.1 -4.5 Net cash flows from/(used in) financing activities -2.4 -4.6 -9.4 13.1
Change in cash and cash equivalents 16.0 0.2 32.0 64.6 Net foreign exchange difference 0.2 0.0 0.8 -2.7 Cash and cash equivalents at beginning of period 107.4 90.7 90.8 28.9 Cash and cash equivalents at the end of the period 123.6 90.8 123.6 90.8
26
Notes
1. Key accounting principles Rovio’s consolidated financial statements are prepared in accordance with the International Financial
Reporting Standards (IFRS) adopted by the EU. The Financial Statement Bulletin has been drawn up in accordance with IAS 34 and using the same accounting policies and calculation methods as the annual financial statements. The figures in the Financial Statement Bulletin are based on the audited financial statements for 2018.
The company has adopted the IFRS 2 – Classification and Measurement of Share-based Payment Transactions – Amendments to IFRS 2 during the first quarter of 2018. As a result of the amendment, the share-based payments that are settled net in shares after withholding taxes are accounted for in full as equity-settled arrangements despite the fact that Rovio pays in cash the taxes related to the rewards on behalf of the participants. Amendments to IFRS 2 regarding the classification and measurement of share-based payment transactions were adopted prospectively and resulted in an increase of EUR 0.2 million in Rovio’s equity in the opening balance of 2018.
Rovio will adopt the IFRS 16 Leases-standard when it becomes effective, on January 1, 2019 using the modified retrospective approach. According to the standard, the lessee will recognize a liability for future lease payments and an asset representing the right to use the underlying asset during the lease term.
Rovio estimates the lease liability and the lease asset to be recognized in the opening 2019 balance due to adapting IFRS 16 to be approximately EUR 6 million. In addition, approximately EUR 4.5 million will be recognized based on lease agreements commencing in the first quarter of 2019. The adoption is expected to improve EBITDA by slightly under EUR 3 million compared to earlier reporting requirements . It will also have an impact to the presentation of the cash flow statement. Cash flow from operating activities is expected to increase and cash flow from financing is expected to decrease by slightly under EUR 3 million.
The figures in the consolidated interim financial statements have been rounded and consequently the sum of individual figures may deviate from the sum presented. Key figures have been calculated using exact figures.
This interim report does not include all the information or disclosures as presented in the consolidated financial statements of December 31, 2018.
2. Notes to the statement of profit or loss 2.1 Segment disclosures
Rovio adopted IFRS 8 in 2017 and defined its operating segments as Games, Brand Licensing (BLU) and Other. Rovio’s business was previously divided into three business lines: Games, Licensing, and Merchandise and Media.
Rovio defines the Group’s Board of Directors as its chief operating decision maker (CODM). The CODM follows Rovio’s performance on the segment level, which is presented in section 2.2 Segment operating performance. EBITDA is the primary performance measure that CODM follows. There are no revenues between the operating segments of Rovio Group.
The segment assets and liabilities except for non-current assets are not reported and reviewed by the chief operating decision maker and have not been included in the table below.
Rovio did not during the interim period have customers that would require disclosure (i.e. 10% or more of revenues from transactions with a single customer).
2.2 Segment operating performance
The allocations between segments consist of shared functions employee benefits expense as well as general and administrative expenses that are recognized centrally and allocated to the reportable segments as a separate line item in management reporting.
27
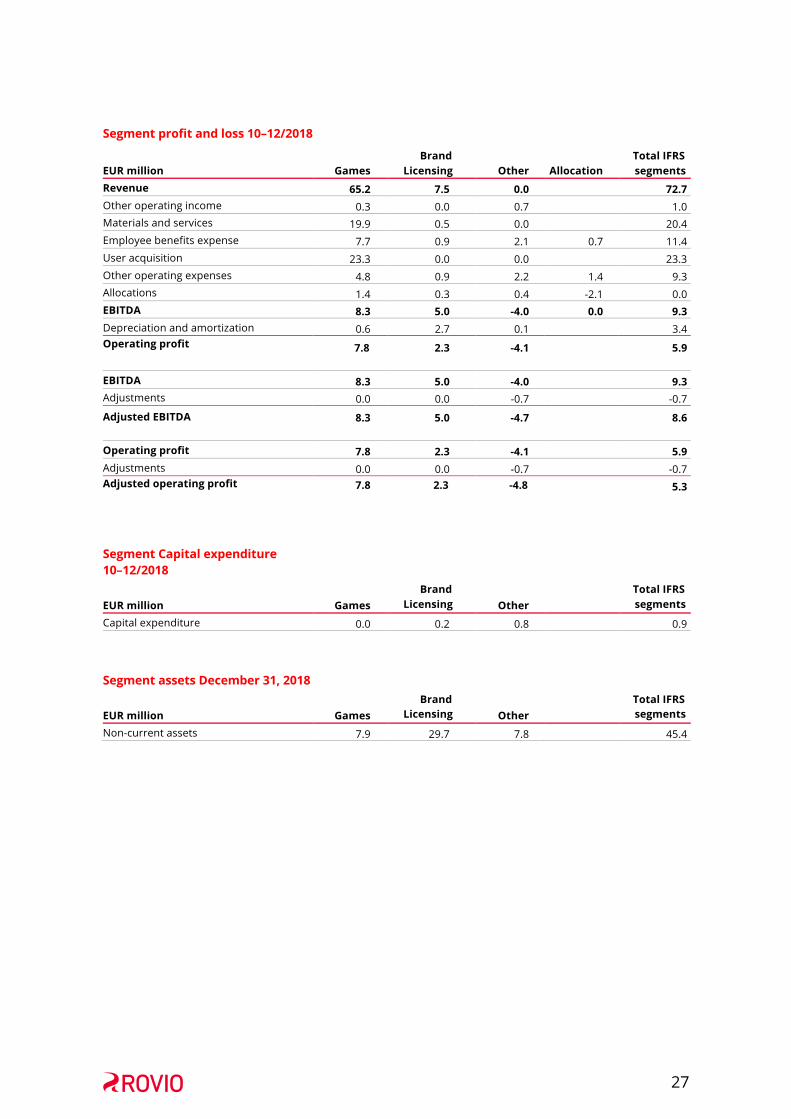
Segment profit and loss 10–12/2018
EUR million
Games
Brand Licensing
Other
Allocation
Total IFRS segments
Revenue 65.2 7.5 0.0 72.7 Other operating income 0.3 0.0 0.7 1.0 Materials and services 19.9 0.5 0.0 20.4 Employee benefits expense 7.7 0.9 2.1 0.7 11.4 User acquisition 23.3 0.0 0.0 23.3 Other operating expenses 4.8 0.9 2.2 1.4 9.3 Allocations 1.4 0.3 0.4 -2.1 0.0 EBITDA 8.3 5.0 -4.0 0.0 9.3 Depreciation and amortization 0.6 2.7 0.1 3.4 Operating profit 7.8 2.3 -4.1 5.9
EBITDA 8.3 5.0 -4.0 9.3 Adjustments 0.0 0.0 -0.7 -0.7
Adjusted EBITDA 8.3 5.0 -4.7 8.6
Operating profit 7.8 2.3 -4.1 5.9 Adjustments 0.0 0.0 -0.7 -0.7 Adjusted operating profit 7.8 2.3 -4.8 5.3
Segment Capital expenditure 10–12/2018
EUR million
Games
Brand Licensing
Other
Total IFRS segments
Capital expenditure 0.0 0.2 0.8 0.9
Segment assets December 31, 2018
EUR million
Games
Brand Licensing
Other
Total IFRS segments
Non-current assets 7.9 29.7 7.8 45.4
28
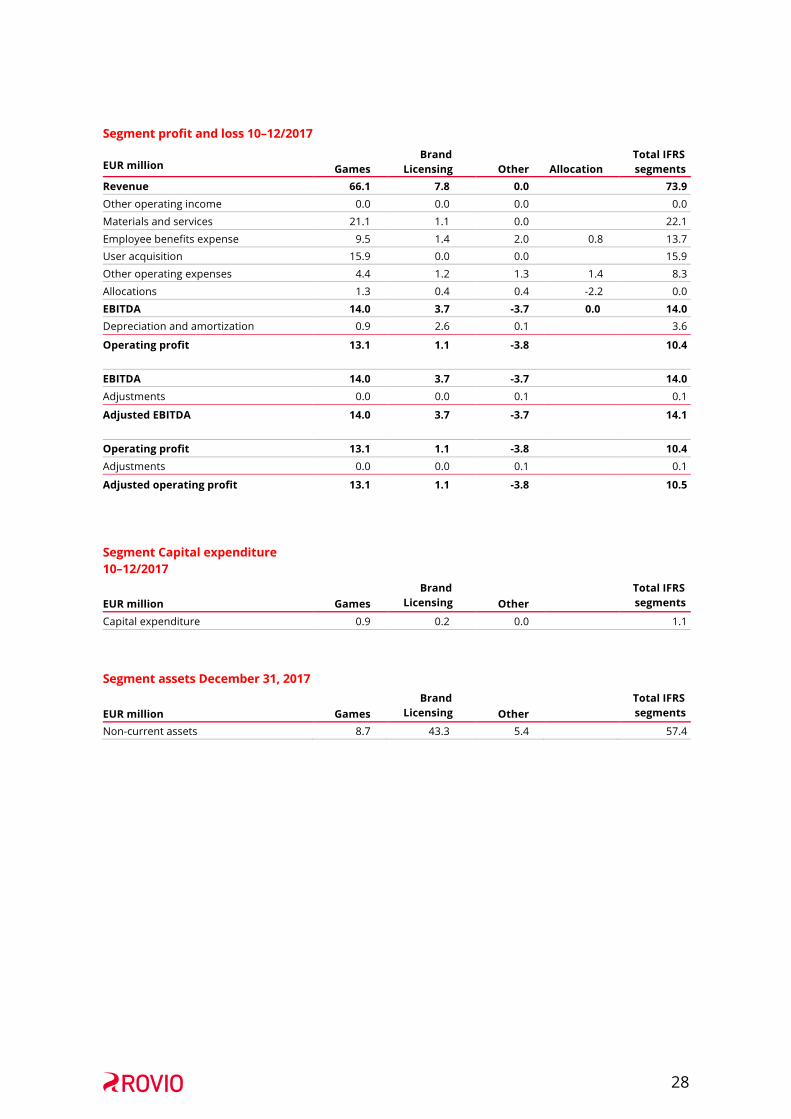
Segment profit and loss 10–12/2017
EUR million
Games
Brand Licensing
Other
Allocation
Total IFRS segments
Revenue 66.1 7.8 0.0 73.9 Other operating income 0.0 0.0 0.0 0.0
Materials and services 21.1 1.1 0.0 22.1
Employee benefits expense 9.5 1.4 2.0 0.8 13.7 User acquisition 15.9 0.0 0.0 15.9
Other operating expenses 4.4 1.2 1.3 1.4 8.3
Allocations 1.3 0.4 0.4 -2.2 0.0
EBITDA 14.0 3.7 -3.7 0.0 14.0 Depreciation and amortization 0.9 2.6 0.1 3.6
Operating profit 13.1 1.1 -3.8 10.4
EBITDA 14.0 3.7 -3.7 14.0 Adjustments 0.0 0.0 0.1 0.1
Adjusted EBITDA 14.0 3.7 -3.7 14.1
Operating profit 13.1 1.1 -3.8 10.4 Adjustments 0.0 0.0 0.1 0.1
Adjusted operating profit 13.1 1.1 -3.8 10.5
Segment Capital expenditure 10–12/2017
EUR million
Games
Brand Licensing
Other
Total IFRS segments
Capital expenditure 0.9 0.2 0.0 1.1
Segment assets December 31, 2017
EUR million
Games
Brand Licensing
Other
Total IFRS segments
Non-current assets 8.7 43.3 5.4 57.4
29
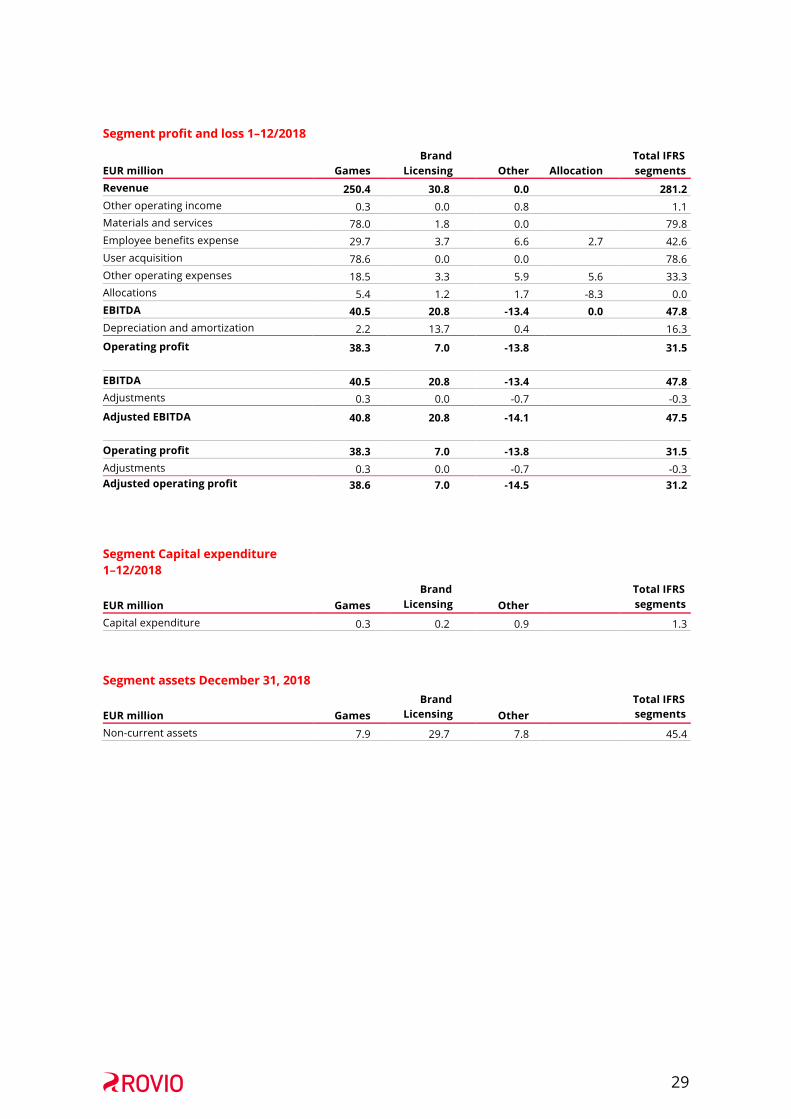
Segment profit and loss 1–12/2018
EUR million
Games
Brand Licensing
Other
Allocation
Total IFRS segments
Revenue 250.4 30.8 0.0 281.2 Other operating income 0.3 0.0 0.8 1.1 Materials and services 78.0 1.8 0.0 79.8 Employee benefits expense 29.7 3.7 6.6 2.7 42.6 User acquisition 78.6 0.0 0.0 78.6 Other operating expenses 18.5 3.3 5.9 5.6 33.3 Allocations 5.4 1.2 1.7 -8.3 0.0 EBITDA 40.5 20.8 -13.4 0.0 47.8 Depreciation and amortization 2.2 13.7 0.4 16.3
Operating profit 38.3 7.0 -13.8 31.5
EBITDA 40.5 20.8 -13.4 47.8 Adjustments 0.3 0.0 -0.7 -0.3
Adjusted EBITDA 40.8 20.8 -14.1 47.5
Operating profit 38.3 7.0 -13.8 31.5 Adjustments 0.3 0.0 -0.7 -0.3 Adjusted operating profit 38.6 7.0 -14.5 31.2
Segment Capital expenditure 1–12/2018
EUR million
Games
Brand Licensing
Other
Total IFRS segments
Capital expenditure 0.3 0.2 0.9 1.3
Segment assets December 31, 2018
EUR million
Games
Brand Licensing
Other
Total IFRS segments
Non-current assets 7.9 29.7 7.8 45.4
30
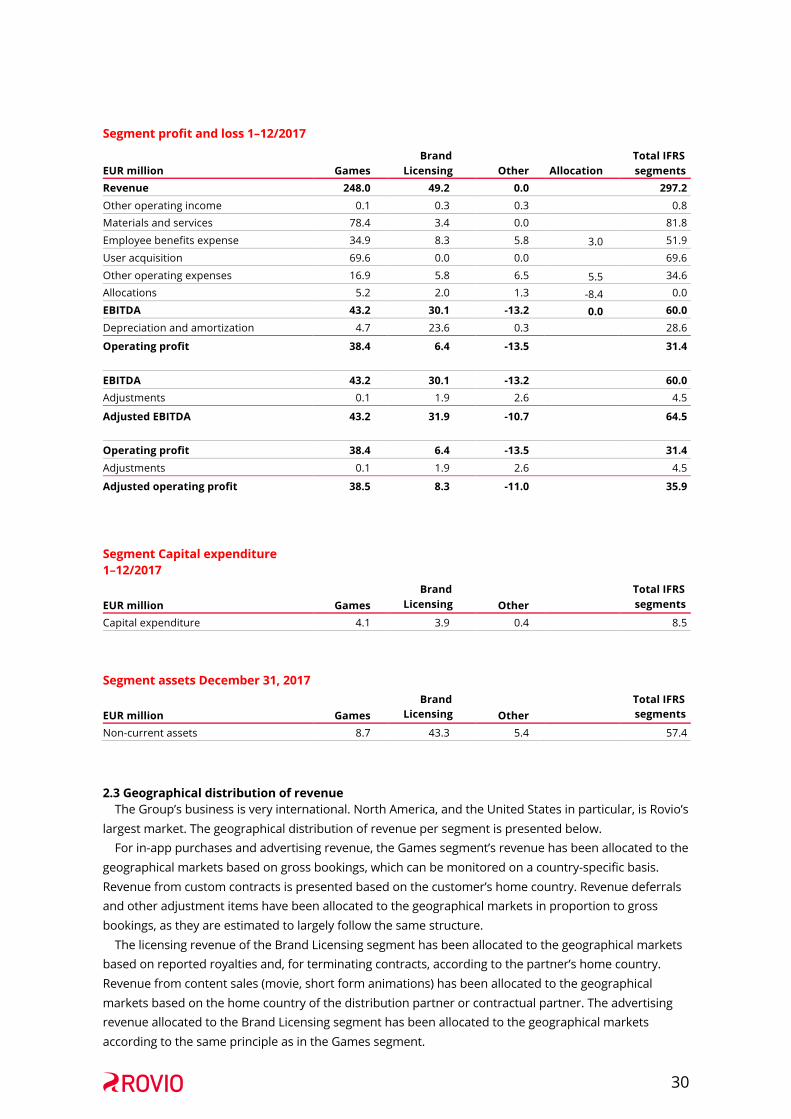
Segment profit and loss 1–12/2017
EUR million
Games
Brand Licensing
Other
Allocation
Total IFRS segments
Revenue 248.0 49.2 0.0 297.2 Other operating income 0.1 0.3 0.3 0.8 Materials and services 78.4 3.4 0.0 81.8
Employee benefits expense 34.9 8.3 5.8 3.0 51.9
User acquisition 69.6 0.0 0.0 69.6
Other operating expenses 16.9 5.8 6.5 5.5 34.6 Allocations 5.2 2.0 1.3 -8.4 0.0
EBITDA 43.2 30.1 -13.2 0.0 60.0 Depreciation and amortization 4.7 23.6 0.3 28.6
Operating profit 38.4 6.4 -13.5
31.4
EBITDA 43.2 30.1 -13.2 60.0 Adjustments 0.1 1.9 2.6 4.5
Adjusted EBITDA 43.2 31.9 -10.7
64.5
Operating profit 38.4 6.4 -13.5 31.4 Adjustments 0.1 1.9 2.6 4.5
Adjusted operating profit 38.5 8.3 -11.0
35.9
Segment Capital expenditure 1–12/2017
EUR million
Games
Brand Licensing
Other
Total IFRS segments
Capital expenditure 4.1 3.9 0.4 8.5
Segment assets December 31, 2017
EUR million
Games
Brand Licensing
Other
Total IFRS segments
Non-current assets 8.7 43.3 5.4 57.4
2.3 Geographical distribution of revenue The Group’s business is very international. North America, and the United States in particular, is Rovio’s
largest market. The geographical distribution of revenue per segment is presented below. For in-app purchases and advertising revenue, the Games segment’s revenue has been allocated to the
geographical markets based on gross bookings, which can be monitored on a country-specific basis. Revenue from custom contracts is presented based on the customer’s home country. Revenue deferrals and other adjustment items have been allocated to the geographical markets in proportion to gross bookings, as they are estimated to largely follow the same structure.
The licensing revenue of the Brand Licensing segment has been allocated to the geographical markets based on reported royalties and, for terminating contracts, according to the partner’s home country. Revenue from content sales (movie, short form animations) has been allocated to the geographical markets based on the home country of the distribution partner or contractual partner. The advertising revenue allocated to the Brand Licensing segment has been allocated to the geographical markets according to the same principle as in the Games segment.

31
EUR Million
Games
10–12/2018
Brand Licensing
Total
Games
10–12/2017
Brand Licensing
Total NAM 42.3 4.6 46.9 40.5 4.0 44.5 LATAM 0.7 0.1 0.9 1.2 1.0 2.1 EMEA 15.8 1.7 17.5 18.5 1.8 20.3 APAC 6.3 1.1 7.3 5.9 1.0 7.0 Total 65.2 7.5 72.7 66.1 7.8 73.9
EUR Million
Games
1–12/2018
Brand Licensing
Total
Games
1–12/2017
Brand Licensing Total
NAM 156.1 21.8 177.8 158.0 38.2 196.2 LATAM 3.4 0.6 4.0 3.7 2.1 5.8 EMEA 64.2 4.9 69.1 64.0 5.9 69.9 APAC 26.8 3.5 30.3 22.3 2.9 25.2 Total 250.4 30.8 281.2 248.0 49.2 297.2
2.4 Disaggregation of revenue from contracts with Customers EUR million
Segment and revenue stream Timing of revenue recognition
10–12/ 2018
10–12/ 2017
1–12/ 2018
1–12/ 2017
Games In-application purchases
At a point in time and over time 56.7 58.0 220.3 219.7
Subscription payments Over time 0.0 0.0 0.0 0.0 Custom contracts Over time 0.4 0.7 1.5 1.4 Advertising At a point in time 8.1 7.4 28.6 27.0 Games total revenue 65.2 66.1 250.4 248.0 Brand Licensing IP Licensing and tangible sales
At a point in time and over time 2.8 4.0 8.6 11.2
Animation broadcasting and distribution
At a point in time 4.6 3.8 21.9 37.3
Advertising At a point in time 0.1 0.1 0.3 0.7 Brand Licensing total revenue 7.5 7.8 30.8 49.2 Group revenue 72.7 73.9 281.2 297.2
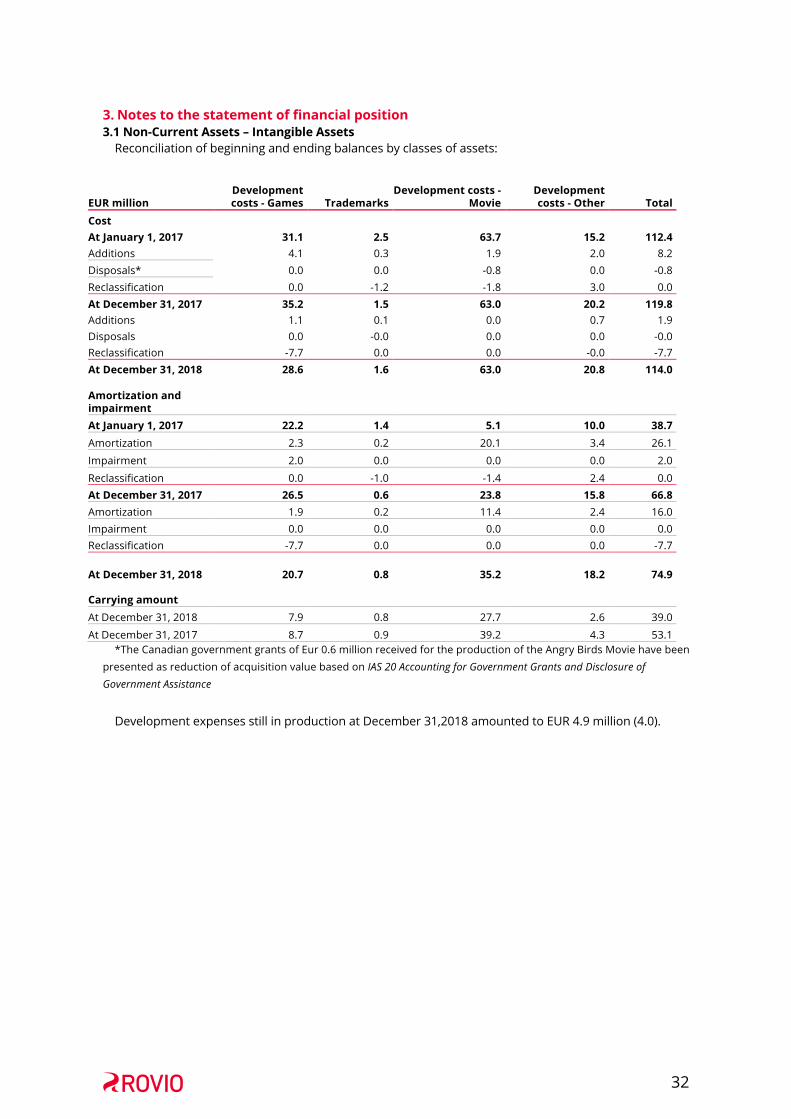
32
3. Notes to the statement of financial position 3.1 Non-Current Assets – Intangible Assets
Reconciliation of beginning and ending balances by classes of assets:
EUR million
Development costs - Games
Trademarks
Development costs - Movie
Development costs - Other
Total
Cost At January 1, 2017 31.1 2.5 63.7 15.2 112.4 Additions 4.1 0.3 1.9 2.0 8.2 Disposals* 0.0 0.0 -0.8 0.0 -0.8 Reclassification 0.0 -1.2 -1.8 3.0 0.0 At December 31, 2017 35.2 1.5 63.0 20.2 119.8 Additions 1.1 0.1 0.0 0.7 1.9 Disposals 0.0 -0.0 0.0 0.0 -0.0 Reclassification -7.7 0.0 0.0 -0.0 -7.7 At December 31, 2018 28.6 1.6 63.0 20.8 114.0
Amortization and impairment At January 1, 2017 22.2 1.4 5.1 10.0 38.7 Amortization 2.3 0.2 20.1 3.4 26.1
Impairment 2.0 0.0 0.0 0.0 2.0
Reclassification 0.0 -1.0 -1.4 2.4 0.0 At December 31, 2017 26.5 0.6 23.8 15.8 66.8 Amortization 1.9 0.2 11.4 2.4 16.0 Impairment 0.0 0.0 0.0 0.0 0.0 Reclassification -7.7 0.0 0.0 0.0 -7.7
At December 31, 2018 20.7
0.8 35.2 18.2 74.9
Carrying amount
At December 31, 2018 7.9 0.8 27.7 2.6 39.0
At December 31, 2017 8.7 0.9 39.2 4.3 53.1 *The Canadian government grants of Eur 0.6 million received for the production of the Angry Birds Movie have been
presented as reduction of acquisition value based on IAS 20 Accounting for Government Grants and Disclosure of Government Assistance
Development expenses still in production at December 31,2018 amounted to EUR 4.9 million (4.0).
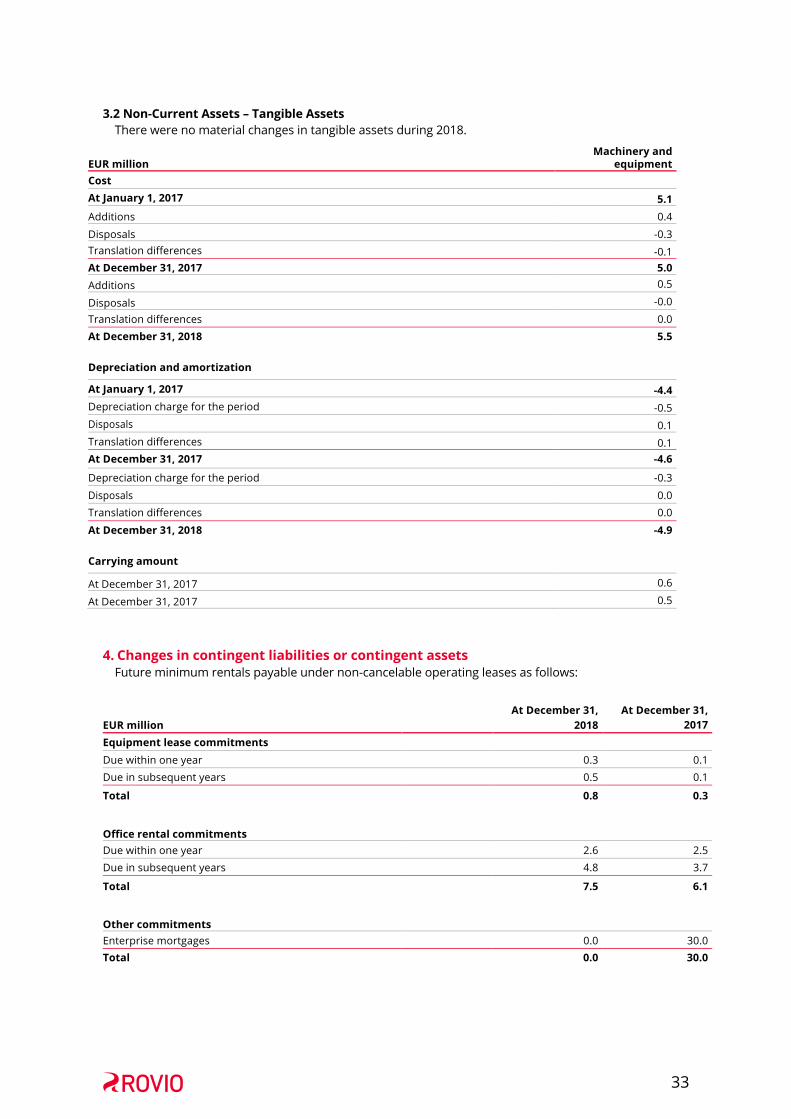
33
3.2 Non-Current Assets – Tangible Assets There were no material changes in tangible assets during 2018.
EUR million Machinery and
equipment Cost At January 1, 2017 5.1 Additions 0.4
Disposals -0.3 Translation differences -0.1 At December 31, 2017 5.0 Additions 0.5
Disposals -0.0
Translation differences 0.0 At December 31, 2018 Depreciation and amortization
5.5
At January 1, 2017 -4.4 Depreciation charge for the period -0.5 Disposals 0.1 Translation differences 0.1 At December 31, 2017 -4.6
Depreciation charge for the period -0.3
Disposals 0.0 Translation differences 0.0
At December 31, 2018 Carrying amount
-4.9
At December 31, 2017 0.6
At December 31, 2017 0.5
4. Changes in contingent liabilities or contingent assets Future minimum rentals payable under non-cancelable operating leases as follows:
EUR million At December 31,
2018 At December 31,
2017 Equipment lease commitments
Due within one year 0.3 0.1 Due in subsequent years 0.5 0.1
Total
Office rental commitments
0.8 0.3
Due within one year 2.6 2.5 Due in subsequent years 4.8 3.7
Total
Other commitments
7.5 6.1
Enterprise mortgages 0.0 30.0 Total 0.0 30.0
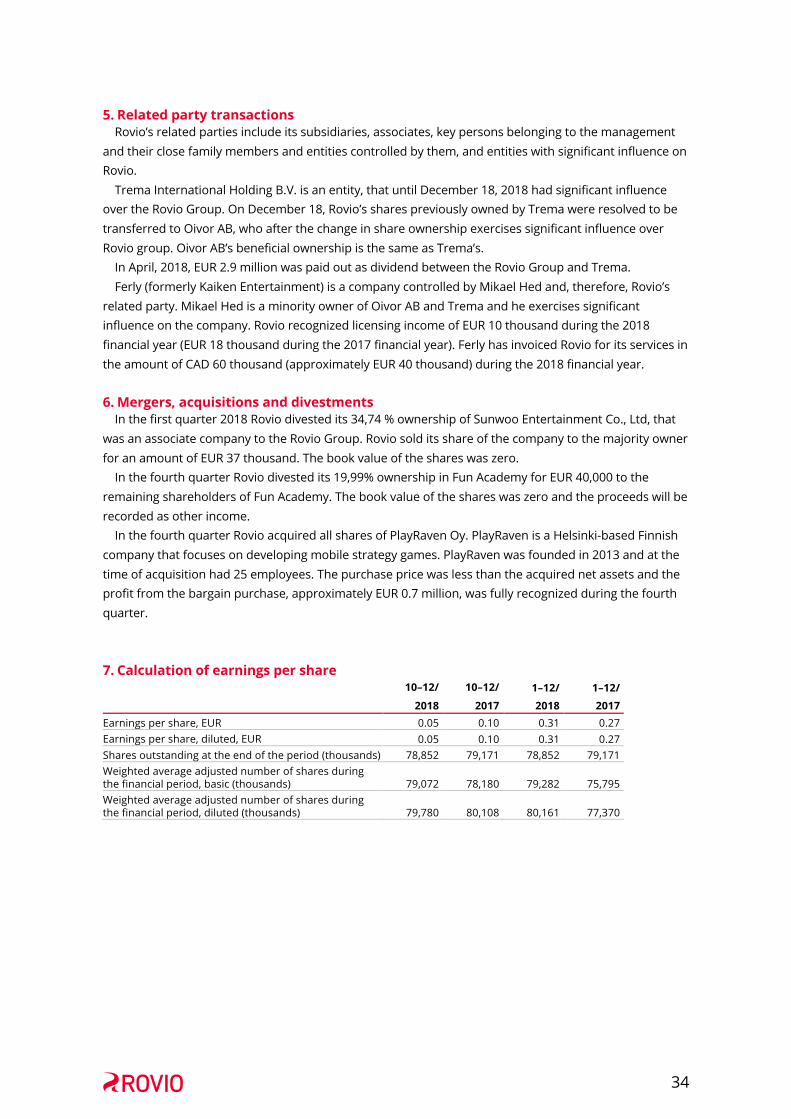
34
5. Related party transactions Rovio’s related parties include its subsidiaries, associates, key persons belonging to the management
and their close family members and entities controlled by them, and entities with significant influence on Rovio.
Trema International Holding B.V. is an entity, that until December 18, 2018 had significant influence over the Rovio Group. On December 18, Rovio’s shares previously owned by Trema were resolved to be transferred to Oivor AB, who after the change in share ownership exercises significant influence over Rovio group. Oivor AB’s beneficial ownership is the same as Trema’s.
In April, 2018, EUR 2.9 million was paid out as dividend between the Rovio Group and Trema. Ferly (formerly Kaiken Entertainment) is a company controlled by Mikael Hed and, therefore, Rovio’s
related party. Mikael Hed is a minority owner of Oivor AB and Trema and he exercises significant influence on the company. Rovio recognized licensing income of EUR 10 thousand during the 2018 financial year (EUR 18 thousand during the 2017 financial year). Ferly has invoiced Rovio for its services in the amount of CAD 60 thousand (approximately EUR 40 thousand) during the 2018 financial year.
6. Mergers, acquisitions and divestments In the first quarter 2018 Rovio divested its 34,74 % ownership of Sunwoo Entertainment Co., Ltd, that
was an associate company to the Rovio Group. Rovio sold its share of the company to the majority owner for an amount of EUR 37 thousand. The book value of the shares was zero.
In the fourth quarter Rovio divested its 19,99% ownership in Fun Academy for EUR 40,000 to the remaining shareholders of Fun Academy. The book value of the shares was zero and the proceeds will be recorded as other income.
In the fourth quarter Rovio acquired all shares of PlayRaven Oy. PlayRaven is a Helsinki-based Finnish company that focuses on developing mobile strategy games. PlayRaven was founded in 2013 and at the time of acquisition had 25 employees. The purchase price was less than the acquired net assets and the profit from the bargain purchase, approximately EUR 0.7 million, was fully recognized during the fourth quarter.
7. Calculation of earnings per share 10–12/
2018
10–12/
2017 1–12/ 2018
1–12/ 2017
Earnings per share, EUR 0.05 0.10 0.31 0.27 Earnings per share, diluted, EUR 0.05 0.10 0.31 0.27 Shares outstanding at the end of the period (thousands) 78,852 79,171 78,852 79,171 Weighted average adjusted number of shares during the financial period, basic (thousands) 79,072 78,180 79,282 75,795 Weighted average adjusted number of shares during the financial period, diluted (thousands) 79,780 80,108 80,161 77,370