Embed Size (px)
Citation preview

The report accompanying these financial statements was issued by BDO USA, LLP, a Delaware limited liability partnership and the U.S. member of BDO International Limited, a UK company limited by guarantee.
Public Gas Partners, Inc.
Financial Statements and
Supplemental Schedules
As of and for the Years Ended June 30, 2017 and 2016
F I N A N C I A L S T A T E M E N T S A N D S U P P L E M E N T A L S C H E D U L E S
Public Gas Partners, Inc. As of and for the Years Ended June 30, 2017 and 2016 With Report of Independent Auditors
Public Gas Partners, Inc.
Financial Statements and Supplemental Schedules
As of and for the Years Ended June 30, 2017 and 2016
Contents
Independent Auditor’s Report ..........................................................................................................1 Management’s Discussion and Analysis (Unaudited) .....................................................................3
Financial Statements
Statements of Net Position .............................................................................................................11 Statements of Revenues, Expenses, and Changes in Net Position ................................................12 Statements of Cash Flows ..............................................................................................................13 Notes to Financial Statements ........................................................................................................14
Supplemental Pool-Level Schedules
Statements of Net Position .............................................................................................................28 Statements of Revenues, Expenses, and Changes in Net Position ................................................29 Statements of Cash Flows ..............................................................................................................30
Tel: 404-688-6841 Fax: 404-688-1075 www.bdo.com
1100 Peachtree Street NE, Suite 700 Atlanta, GA 30309
1
Independent Auditor’s Report
Board of Directors Public Gas Partners, Inc. Kennesaw, Georgia
Report on the Financial Statements
We have audited the accompanying financial statements of Public Gas Partners, Inc., which comprise the statements of net position as of June 30, 2017 and 2016, and the related statements of revenues, expenses and changes in net position, and cash flows for the years then ended, and the related notes to the financial statements.
Management’s Responsibility for the Financial Statements
Management is responsible for the preparation and fair presentation of these financial statements in accordance with accounting principles generally accepted in the United States of America; this includes the design, implementation, and maintenance of internal control relevant to the preparation and fair presentation of financial statements that are free from material misstatement, whether due to fraud or error.
Auditor’s Responsibility
Our responsibility is to express an opinion on these financial statements based on our audit. We conducted our audit in accordance with auditing standards generally accepted in the United States of America and the standards applicable to financial audits contained in Government Auditing Standards issued by the Comptroller General of the United States. Those standards require that we plan and perform the audit to obtain reasonable assurance about whether the financial statements are free from material misstatement.
An audit involves performing procedures to obtain audit evidence about the amounts and disclosures in the financial statements. The procedures selected depend on the auditor’s judgment, including the assessment of the risks of material misstatement of the financial statements, whether due to fraud or error. In making those risk assessments, the auditor considers internal control relevant to the entity’s preparation and fair presentation of the financial statements in order to design audit procedures that are appropriate in the circumstances, but not for the purpose of expressing an opinion on the effectiveness of the entity’s internal control. Accordingly, we express no such opinion. An audit also includes evaluating the appropriateness of accounting policies used and the reasonableness of significant accounting estimates made by management, as well as evaluating the overall presentation of the financial statements.
We believe that the audit evidence we have obtained is sufficient and appropriate to provide a basis for our audit opinion.
BDO USA, LLP, a Delaware limited liability partnership, is the U.S. member of BDO International Limited, a UK company limited by guarantee, and forms part of the international BDO network of independent member firms. BDO is the brand name for the BDO network and for each of the BDO Member Firms.

2
Opinion
In our opinion, the financial statements referred to above present fairly, in all material respects, the financial position of Public Gas Partners, Inc. as of June 30, 2017 and 2016, and the changes in its financial position and its cash flows for the years then ended in accordance with accounting principles generally accepted in the United States of America.
Other Matters
Required Supplementary Information
Accounting principles generally accepted in the United States of America require that the management’s discussion and analysis on pages 3 through 10 be presented to supplement the basic financial statements. Such information, although not a part of the basic financial statements, is required by the Governmental Accounting Standards Board who considers it to be an essential part of financial reporting for placing the basic financial statements in an appropriate operational, economic, or historical context. We have applied certain limited procedures to the required supplementary information in accordance with auditing standards generally accepted in the United States of America, which consisted of inquiries of management about the methods of preparing the information and comparing the information for consistency with management’s responses to our inquiries, the basic financial statements, and other knowledge we obtained during our audit of the basic financial statements. We do not express an opinion or provide any assurance on the information because the limited procedures do not provide us with sufficient evidence to express an opinion or provide any assurance.
Other Information
Our audits were conducted for the purpose of forming an opinion on the financial statements as a whole. The accompanying supplemental pool level schedules are presented for purposes of additional analysis and are not a required part of the financial statements. The accompanying supplemental pool level schedules are the responsibility of management and were derived from and relate directly to the underlying accounting and other records used to prepare the basic financial statements. Such information has been subjected to the auditing procedures applied in the audits of the basic financial statements and certain additional procedures, including comparing and reconciling such information directly to the underlying accounting and other records used to prepare the basic financial statements or to the basic financial statements themselves, and other additional procedures in accordance with auditing standards generally accepted in the United States of America. In our opinion, the supplemental pool level schedules are fairly stated, in all material respects, in relation to the basic financial statements as a whole.
Atlanta, Georgia September 21, 2017

Management’s Discussion and Analysis (Unaudited)
3
Corporate Structure
Public Gas Partners, Inc. (PGP) is a nonprofit corporation organized under Georgia law, formed on November 15, 2004. PGP is comprised of six members: Florida Municipal Power Agency (FMPA), Municipal Gas Authority of Georgia (the Gas Authority), National Public Gas Agency, Patriots Energy Group, The Southeast Alabama Gas District, and Tennessee Energy Acquisition Corporation (collectively, the Members).
PGP’s mission is to build a portfolio of economic long-term gas supplies for its Members. PGP is organized into projects in which Members may elect to participate. Each of the Members participating in a PGP project has executed a Production Sharing Agreement (PSA) for that project. PGP has undertaken three projects: Gas Supply Pool No. 1 (Pool 1), Gas Supply Pool No. 2 (Pool 2), and Gas Supply Pool No. 3 (Pool 3). Pool 1 was formed in 2004; Pool 2 was formed in 2005; and Pool 3 was formed in 2009. Five Members are participants in Pools 1 and 2, and four Members are participants in Pool 3. For Pools 1 and 2, PGP was authorized to acquire gas reserves or other contract rights during a three-year acquisition period that ended June 30, 2008. Pool 3 is authorized to acquire gas reserves or other contract rights on an ongoing basis, as necessary, to fulfill gas deliveries requested by Pool 3 participants. PGP utilizes wholly owned subsidiaries to own the assets and manage the operations of its various projects. Specifically, Pool 3’s subsidiary, PGP Operating, LLC (PGP Operating), operates approximately 1,354 wells in the Black Warrior Basin of Alabama.
Joint Action
Although the Members are individually governed, through joint action they can share the costs of mutual endeavors, such as natural gas purchasing, and accomplish those tasks more efficiently than if they were conducted individually. In addition, by contracting with PGP, the Members can diversify their source of long-term supplies through a portfolio of supply arrangements. Similarly, they can pool their credit strength to manage risks and reduce costs through joint financing of acquisitions, hedging of long-term gas supplies, and other financing activities. Through joint action, the Members can use economies of scale to reduce the overall cost and price volatility of natural gas to their ultimate customers.
Authority
The Bylaws of PGP and each PSA provide that PGP will be governed by a Board of Directors that includes one representative from each PGP Member. In addition, each PGP project is managed by an Operating Committee made up of two representatives from each participating Member. The Operating Committees for each Pool have been authorized by the Board of Directors and their respective PSAs to undertake the acquisition and management of gas supplies that meet the property criteria or other requirements in the PSAs and to issue debt to finance the costs of such activities. The PSAs authorize the Board of Directors to establish rates and charges to produce revenue sufficient to cover all project costs, including allocations from PGP or other projects, and obligate the participating Members to pay those charges.

Management’s Discussion and Analysis (Unaudited) (continued)
4
Administrative Management
The Gas Authority manages PGP’s day-to-day administrative operations under a contract that ends on November 1, 2018. This contract renews automatically for two-year periods until either party provides notice of termination no later than 180 days from the date of expiration.
Derivative Instruments
PGP uses derivative instruments to hedge its commodity price risk associated with forecasted oil and gas sales from owned reserves by converting the revenues that PGP will receive from customers from a variable price, based on a spot market price, to a fixed price.
Proprietary Funds
PGP operates only one type of proprietary fund, the enterprise fund type, to account for its general operations in accordance with Governmental Accounting Standards Board (GASB) pronouncements. Enterprise funds are used to report business-type activities (as contrasted with tax-supported governmental activities).
Overview of the Financial Statements
This discussion and analysis is intended to serve as an introduction to PGP’s basic financial statements. These financial statements are designed to provide readers with a broad overview of PGP’s finances in a manner similar to a private-sector business.
The statements of net position present information on PGP’s assets, liabilities, and deferred inflows/outflows of resources with the differences between these amounts reported as net position. Because PGP is a nonprofit organization and an extension of the municipal utilities participating in the Pools, net position is likely to be limited since, generally, all billings and revenues in excess of actual costs are returned to the Members in the form of billing credits or rate changes. The statements of revenues, expenses, and changes in net position present information showing how PGP’s net position changed during the most recent fiscal year. All changes in net position are reported when the underlying event giving rise to the change occurs, regardless of the timing of related cash flows. Therefore, certain revenues and expenses, such as costs recoverable from future billings, will result in cash flows in future fiscal periods. All of the activities of PGP are considered business-type activities.
Notes to Financial Statements
The notes provide additional information that is essential to a full understanding of the data provided in the financial statements.
Management’s Discussion and Analysis (Unaudited) (continued)
5
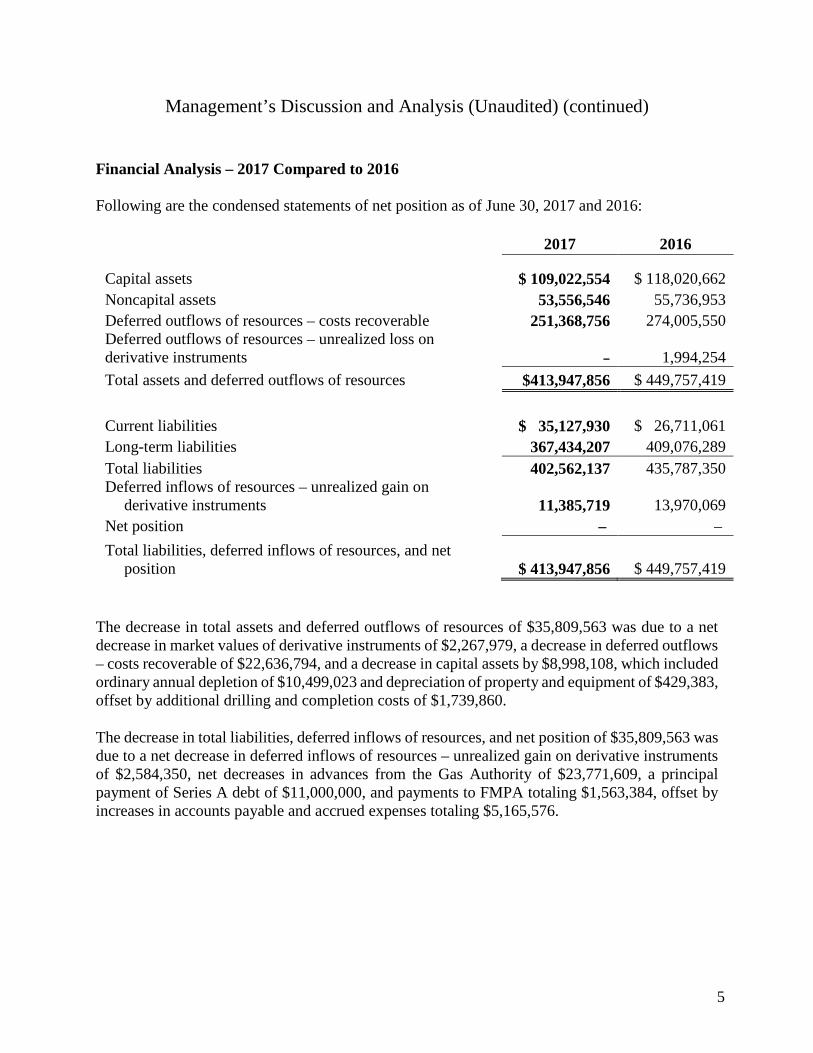
Financial Analysis – 2017 Compared to 2016
Following are the condensed statements of net position as of June 30, 2017 and 2016:
2017 2016
Capital assets $ 109,022,554 $ 118,020,662 Noncapital assets 53,556,546 55,736,953 Deferred outflows of resources – costs recoverable 251,368,756 274,005,550 Deferred outflows of resources – unrealized loss on derivative instruments – 1,994,254 Total assets and deferred outflows of resources $413,947,856 $ 449,757,419
Current liabilities $ 35,127,930 $ 26,711,061 Long-term liabilities 367,434,207 409,076,289 Total liabilities 402,562,137 435,787,350 Deferred inflows of resources – unrealized gain on
derivative instruments 11,385,719 13,970,069 Net position – – Total liabilities, deferred inflows of resources, and net
position $ 413,947,856 $ 449,757,419
The decrease in total assets and deferred outflows of resources of $35,809,563 was due to a net decrease in market values of derivative instruments of $2,267,979, a decrease in deferred outflows – costs recoverable of $22,636,794, and a decrease in capital assets by $8,998,108, which included ordinary annual depletion of $10,499,023 and depreciation of property and equipment of $429,383, offset by additional drilling and completion costs of $1,739,860.
The decrease in total liabilities, deferred inflows of resources, and net position of $35,809,563 was due to a net decrease in deferred inflows of resources – unrealized gain on derivative instruments of $2,584,350, net decreases in advances from the Gas Authority of $23,771,609, a principal payment of Series A debt of $11,000,000, and payments to FMPA totaling $1,563,384, offset by increases in accounts payable and accrued expenses totaling $5,165,576.

Management’s Discussion and Analysis (Unaudited) (continued)
6
Financial Analysis – 2017 Compared to 2016 (continued)
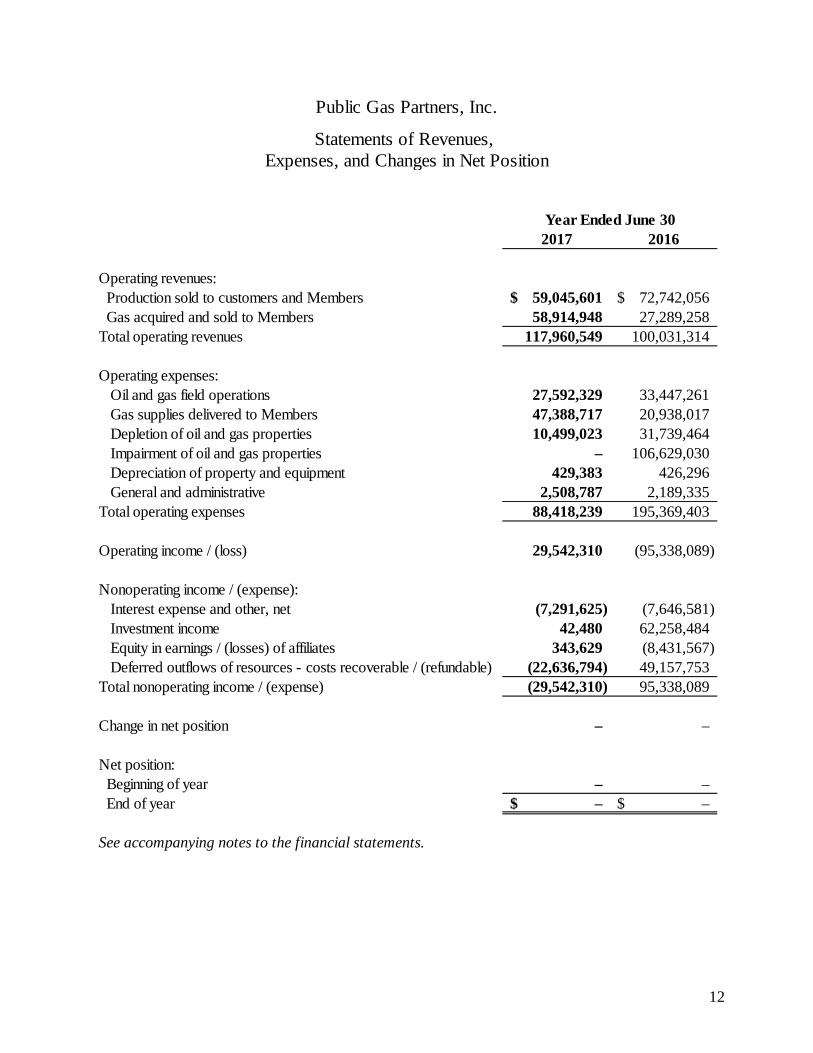
Following is a summary of operations for the years ended June 30, 2017 and 2016:
2017 2016 Operating revenues:
Production sold to customers and Members $ 59,045,601 $ 72,742,056 Gas acquired and sold to Members 58,914,948 27,289,258
Total operating revenues 117,960,549 100,031,314 Operating expenses:
Oil and gas field operations 27,592,329 33,447,261 Gas supplies delivered to Members 47,388,717 20,938,017 Depletion of oil and gas properties 10,499,023 31,739,464 Impairment of oil and gas properties - 106,629,030 Depreciation of property and equipment 429,383 426,296 General and administrative 2,508,787 2,189,335
Total operating expenses 88,418,239 195,369,403 Operating income / (loss) 29,542,310 (95,338,089) Nonoperating income / (expense):
Interest expense and other, net (7,291,625) (7,646,581) Investment income 42,480 62,258,484 Equity in earnings / (losses) of affiliates 343,629 (8,431,567) Deferred outflows of resources – costs recoverable /
(refundable) in future billings (22,636,794) 49,157,753 Total nonoperating income / (expense) (29,542,310) 95,338,089 Changes in net position – – Net position:
Beginning of year – – End of year $ – $ –
Management’s Discussion and Analysis (Unaudited) (continued)
7
Financial Analysis – 2017 Compared to 2016 (continued)
Operating Revenues
Operating revenues from production sold to customers and Members decreased $13,696,455, or 18.8%, due to hedge terminations in fiscal year 2016. The hedge contracts which were terminated were substantially in-the-money and monthly settlements were supplementing operating revenues until the time of termination. Fiscal year 2017 operating revenues were not supplemented by hedging settlements, the effect of which more than offset higher market prices for oil and gas in the current fiscal year. Gas acquired and resold to Members increased $31,625,690, or 115.9%, due to higher billing rates in the current fiscal year for natural gas sales to PGP Members.
Operating Expenses
Operating expenses decreased $106,951,164, or 54.7%, primarily due to decreases in oil and gas field operations expenses of $5,854,932, depletion of oil and gas properties of $21,240,441, and full-cost ceiling impairment of oil and gas properties of $106,629,030. These decreases were offset by an increase in gas supplies delivered to Members of $26,450,700, which were driven by higher than average oil and gas pricing year over year. General and administrative expenses increased by $319,452, or 14.6%, primarily due to an increase in incentive compensation for PGP Operating employees.
Liquidity and Capital Resources
PGP’s cash balance decreased $3,998,275 to $17,556,939 at June 30, 2017. See the accompanying statements of cash flows for details of cash activity during fiscal year 2017.
PGP is exposed to credit risk in the normal course of business. PGP has adopted policies and procedures to minimize this risk. Expected borrowing arrangements with banks, along with operating cash flow, are expected to provide sufficient liquidity for planned operations. PGP uses derivative instruments, specifically commodity swaps, to hedge its commodity price risk associated with short and long-term changes in oil and natural gas prices.

Management’s Discussion and Analysis (Unaudited) (continued)
8
Financial Analysis – 2016 Compared to 2015
Following are the condensed statements of net position as of June 30, 2016 and 2015:
2016 2015
Capital assets $ 118,020,661 $ 255,143,425 Noncapital assets 55,736,953 125,916,429 Deferred outflows of resources – costs recoverable 274,005,550 224,847,797 Deferred outflows of resources - unrealized loss on derivative instruments 1,994,254 - Total assets and deferred outflows of resources $ 449,757,419 $ 605,907,651
Current liabilities $ 26,711,061 $ 28,266,922 Long-term liabilities 409,076,289 507,833,958 Total liabilities 435,787,350 536,100,880 Deferred inflows of resources – unrealized gain on derivative instruments 13,970,069 69,806,771 Net position – – Total liabilities, deferred inflows of resources, and net position $ 449,757,419 $ 605,907,651
The decrease in total assets and deferred outflows of resources of $156,150,232 was due to a net decrease in market values of derivative instruments of $55,738,579, which included early hedge terminations of $14,109,213 in Pool 1, $2,855,102 in Pool 2, and $45,438,367 in Pool 3; a decrease to accounts receivable by $7,922,432 due to lower market pricing in oil and natural gas; a decrease in the value of an equity method investment by $8,582,088, which included a full cost ceiling test impairment of $6,679,766; and a decrease in capital assets by $137,122,763, which included ordinary annual depletion of $31,739,464 and a full-cost ceiling impairment of $106,629,030. Additional drilling and completion costs during the year in the amount of $5,392,447 offset the depletion expenses and the full-cost ceiling impairment charges. These decreases were offset by an increase to deferred outflows of resources – costs recoverable by $49,157,753.
The decrease in total liabilities, deferred inflows of resources, and net position of $156,150,232 was due to a net decrease in the deferred inflows of resources – unrealized gain on derivative instruments of $55,836,702, net decreases in advances from the Gas Authority of $78,867,744; a principal payment of Series A debt of $11,000,000; payments to FMPA totaling $7,177,605; and reductions in accounts payable and accrued expenses totaling $3,875,710; offset by increases in hedge liabilities of $2,025,269.
Management’s Discussion and Analysis (Unaudited) (continued)
9
Financial Analysis – 2016 Compared to 2015 (continued)
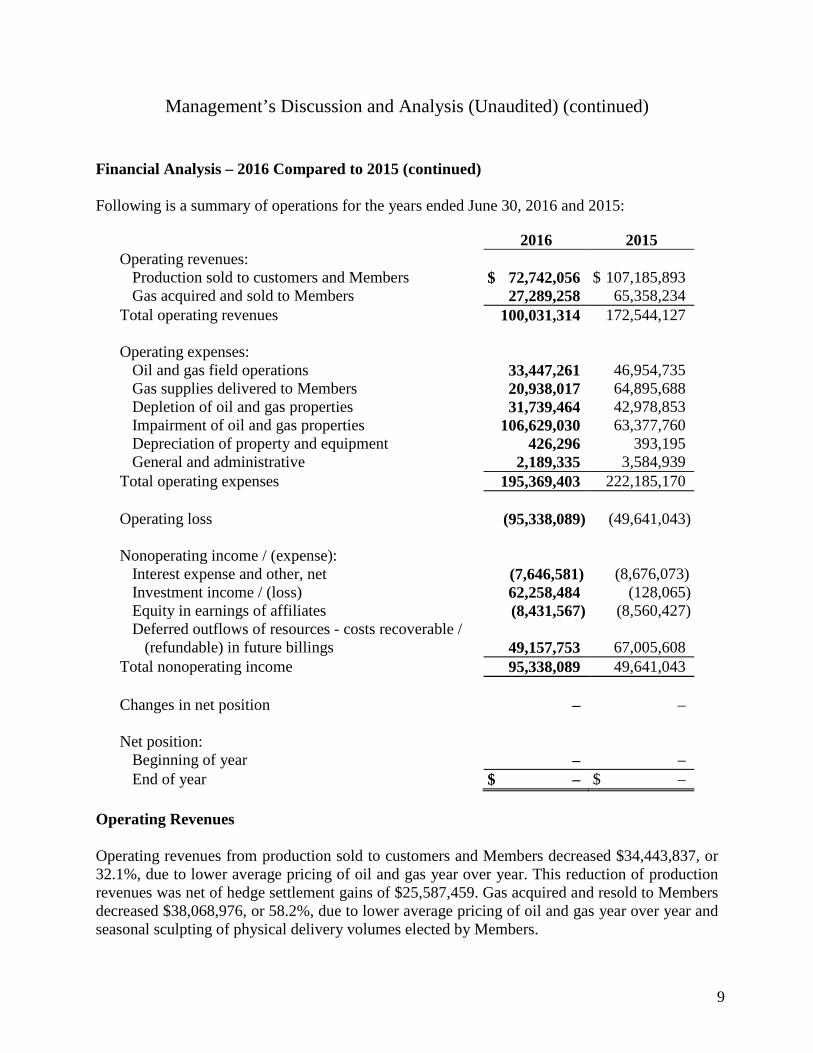
Following is a summary of operations for the years ended June 30, 2016 and 2015:
2016 2015 Operating revenues:
Production sold to customers and Members $ 72,742,056 $ 107,185,893 Gas acquired and sold to Members 27,289,258 65,358,234
Total operating revenues 100,031,314 172,544,127 Operating expenses:
Oil and gas field operations 33,447,261 46,954,735 Gas supplies delivered to Members 20,938,017 64,895,688 Depletion of oil and gas properties 31,739,464 42,978,853 Impairment of oil and gas properties 106,629,030 63,377,760 Depreciation of property and equipment 426,296 393,195 General and administrative 2,189,335 3,584,939
Total operating expenses 195,369,403 222,185,170 Operating loss (95,338,089) (49,641,043) Nonoperating income / (expense):
Interest expense and other, net (7,646,581) (8,676,073) Investment income / (loss) 62,258,484 (128,065) Equity in earnings of affiliates (8,431,567) (8,560,427) Deferred outflows of resources - costs recoverable /
(refundable) in future billings 49,157,753 67,005,608 Total nonoperating income 95,338,089 49,641,043 Changes in net position – – Net position:
Beginning of year – – End of year $ – $ –
Operating Revenues
Operating revenues from production sold to customers and Members decreased $34,443,837, or 32.1%, due to lower average pricing of oil and gas year over year. This reduction of production revenues was net of hedge settlement gains of $25,587,459. Gas acquired and resold to Members decreased $38,068,976, or 58.2%, due to lower average pricing of oil and gas year over year and seasonal sculpting of physical delivery volumes elected by Members.
Management’s Discussion and Analysis (Unaudited) (continued)
10
Financial Analysis – 2016 Compared to 2015 (continued)
Operating Expenses
Operating expenses decreased $26,815,767, or 12.1%, primarily due to decreases in oil and gas field operations expenses of $13,507,474, gas supplies delivered to Members of $43,957,671, and depletion of oil and gas properties of $11,239,389. These decreases were offset by an increase in the full-cost ceiling impairment of oil and gas properties of $43,251,270. These changes were driven by lower than average oil and gas pricing year over year. General and administrative expenses decreased by $1,395,604, or 38.9%, primarily due to cost controls in PGP Operating, a wholly-owned subsidiary of PGP which operates approximately 1,370 wells in the Black Warrior Basin of Alabama.
11
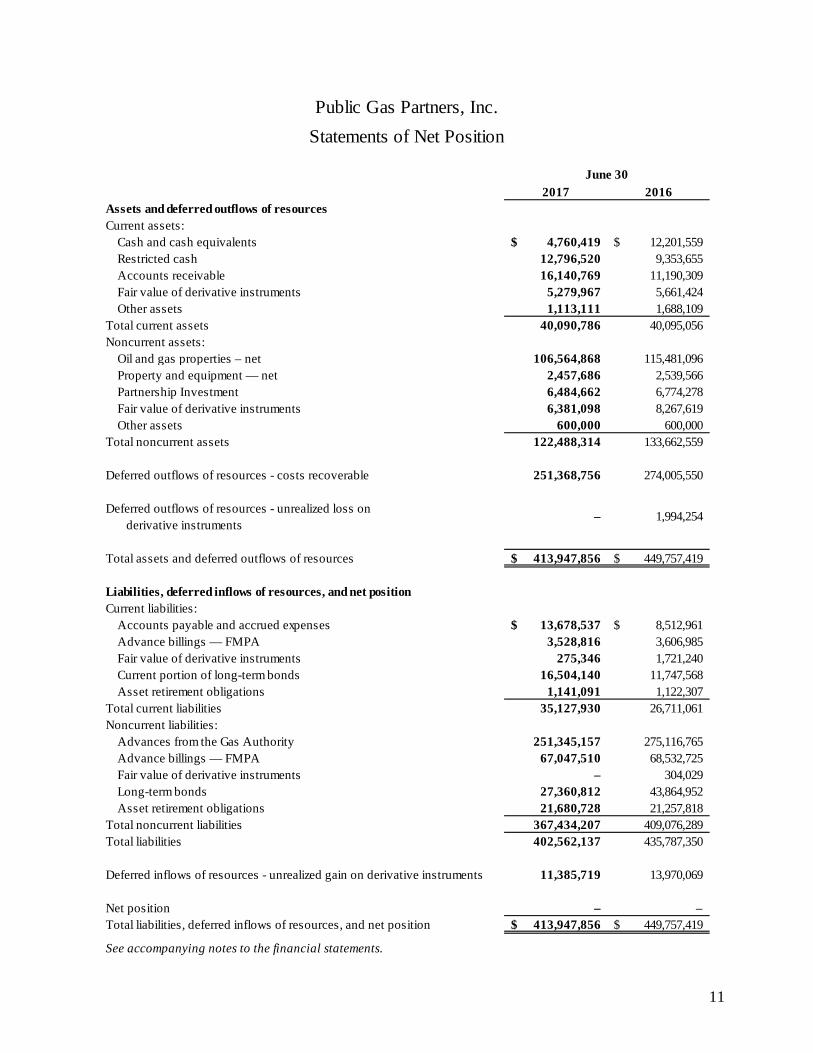
2017 2016Assets and deferred outflows of resourcesCurrent assets:
Cash and cash equivalents 4,760,419$ 12,201,559$ Restricted cash 12,796,520 9,353,655 Accounts receivable 16,140,769 11,190,309 Fair value of derivative instruments 5,279,967 5,661,424 Other assets 1,113,111 1,688,109
Total current assets 40,090,786 40,095,056 Noncurrent assets:
Oil and gas properties – net 106,564,868 115,481,096 Property and equipment — net 2,457,686 2,539,566 Partnership Investment 6,484,662 6,774,278 Fair value of derivative instruments 6,381,098 8,267,619 Other assets 600,000 600,000
Total noncurrent assets 122,488,314 133,662,559
Deferred outflows of resources - costs recoverable 251,368,756 274,005,550
Deferred outflows of resources - unrealized loss on derivative instruments
– 1,994,254
Total assets and deferred outflows of resources 413,947,856$ 449,757,419$
Liabilities, deferred inflows of resources, and net positionCurrent liabilities:
Accounts payable and accrued expenses 13,678,537$ 8,512,961$ Advance billings — FMPA 3,528,816 3,606,985 Fair value of derivative instruments 275,346 1,721,240 Current portion of long-term bonds 16,504,140 11,747,568 Asset retirement obligations 1,141,091 1,122,307
Total current liabilities 35,127,930 26,711,061 Noncurrent liabilities:
Advances from the Gas Authority 251,345,157 275,116,765 Advance billings — FMPA 67,047,510 68,532,725 Fair value of derivative instruments – 304,029 Long-term bonds 27,360,812 43,864,952 Asset retirement obligations 21,680,728 21,257,818
Total noncurrent liabilities 367,434,207 409,076,289 Total liabilities 402,562,137 435,787,350
Deferred inflows of resources - unrealized gain on derivative instruments 11,385,719 13,970,069
Net position – – Total liabilities, deferred inflows of resources, and net position 413,947,856$ 449,757,419$
See accompanying notes to the financial statements.
Public Gas Partners, Inc.Statements of Net Position
June 30
12
2016
Operating revenues: Production sold to customers and Members 59,045,601$ 72,742,056$ Gas acquired and sold to Members 58,914,948 27,289,258 Total operating revenues 117,960,549 100,031,314
Operating expenses:Oil and gas field operations 27,592,329 33,447,261 Gas supplies delivered to Members 47,388,717 20,938,017 Depletion of oil and gas properties 10,499,023 31,739,464 Impairment of oil and gas properties – 106,629,030 Depreciation of property and equipment 429,383 426,296 General and administrative 2,508,787 2,189,335
Total operating expenses 88,418,239 195,369,403
Operating income / (loss) 29,542,310 (95,338,089)
Nonoperating income / (expense):Interest expense and other, net (7,291,625) (7,646,581) Investment income 42,480 62,258,484 Equity in earnings / (losses) of affiliates 343,629 (8,431,567) Deferred outflows of resources - costs recoverable / (refundable) (22,636,794) 49,157,753
Total nonoperating income / (expense) (29,542,310) 95,338,089
Change in net position – –
Net position: Beginning of year – – End of year –$ –$
See accompanying notes to the financial statements.
Public Gas Partners, Inc.
Statements of Revenues, Expenses, and Changes in Net Position
Year Ended June 302017

13
2017 2016O perating activitiesReceipts from customers and Members 108,028,455$ 80,509,284$ Payments to Members (9,244,845) (15,862,378) Payments to operators and suppliers (64,330,694) (46,349,450) Payments from / (to) oil and gas derivative counterparties, net 5,811,220 88,892,778 Net cash provided by operating activities 40,264,136 107,190,234
Capital and related financing activitiesSales of oil and gas properties 511,941 689,048 Capital expenditures of property and equipment (386,081) (55,467) Sale of property and equipment 55,608 161,554 Drilling and completion costs, net of refunds (2,082,230) (5,392,447) Repayments of gas revenue bonds (11,000,000) (11,000,000) Repayments to the Gas Authority (23,771,609) (78,867,744) Interest payments and debt issuance costs (8,193,724) (8,597,824) Net cash used in capital and related financing activities (44,866,095) (103,062,880)
Investing activitiesInvestment distributions / (additions) 603,684 (13,725) Net cash provided by / (used in) investing activities 603,684 (13,725)
Net increase / (decrease) in cash equivalents (3,998,275) 4,113,629 Cash and cash equivalents:
Beginning of year 21,555,214 17,441,585 End of year 17,556,939$ 21,555,214$
Reconciliation of revenues in excess of operatingexpenses to net cash provided by operating activities:
Operating income / (loss) 29,542,310$ (95,338,089)$ Adjustments to reconcile to net cash flows provided by operating activities:
Accretion of asset retirement obligation 761,652 777,171 Depreciation of property and equipment 429,383 426,296 Depletion of oil and gas properties 10,499,023 31,739,464 Impairment of oil and gas properties – 106,629,030 Changes in certain assets and liabilit ies:
Accounts receivable (4,950,462) 7,922,432 Fair value of terminated hedges – 62,402,682 Other assets 574,999 2,052,105 Accounts payable and accrued expenses 4,970,615 (2,243,252) Advance billings — FMPA (1,563,384) (7,177,605)
Net cash provided by operating activities 40,264,136$ 107,190,234$
See accompanying notes to the financial statements.
Public Gas Partners, Inc.
Statements of Cash Flows
Year Ended June 30
Public Gas Partners, Inc.
Notes to Financial Statements
June 30, 2017
14
1. Summary of Significant Accounting Policies
Overview of Business and Reporting Entity
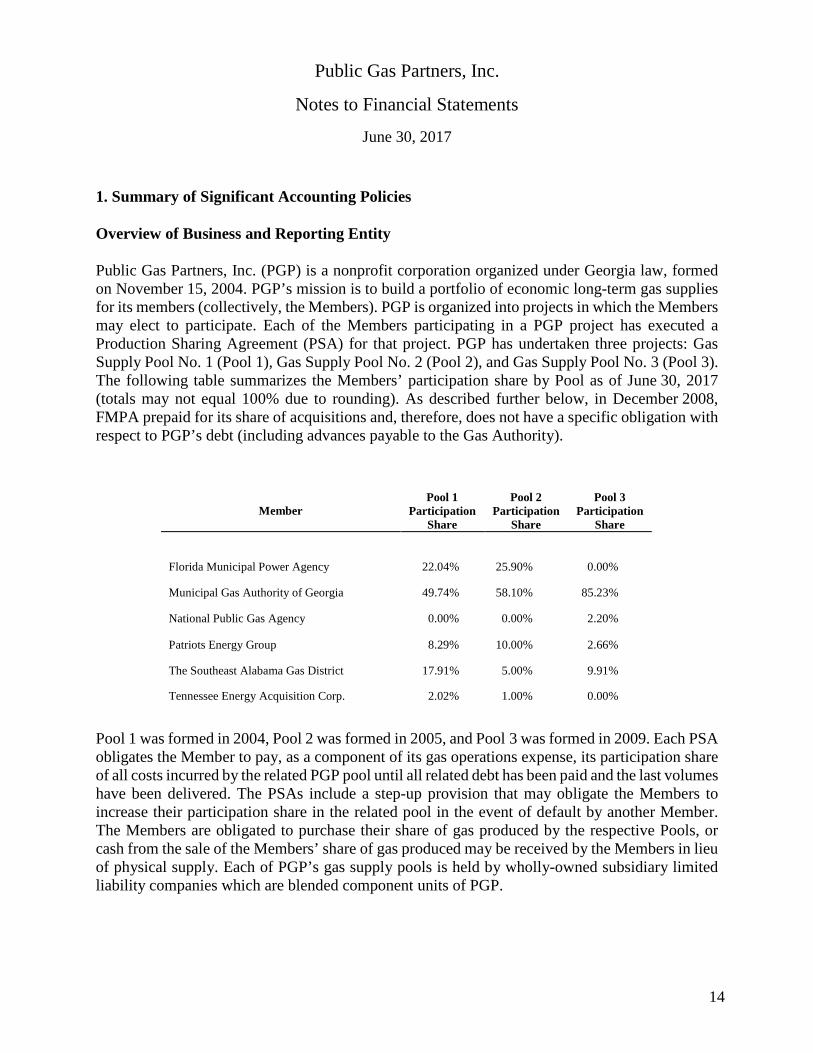
Public Gas Partners, Inc. (PGP) is a nonprofit corporation organized under Georgia law, formed on November 15, 2004. PGP’s mission is to build a portfolio of economic long-term gas supplies for its members (collectively, the Members). PGP is organized into projects in which the Members may elect to participate. Each of the Members participating in a PGP project has executed a Production Sharing Agreement (PSA) for that project. PGP has undertaken three projects: Gas Supply Pool No. 1 (Pool 1), Gas Supply Pool No. 2 (Pool 2), and Gas Supply Pool No. 3 (Pool 3). The following table summarizes the Members’ participation share by Pool as of June 30, 2017 (totals may not equal 100% due to rounding). As described further below, in December 2008, FMPA prepaid for its share of acquisitions and, therefore, does not have a specific obligation with respect to PGP’s debt (including advances payable to the Gas Authority).
Pool 1 was formed in 2004, Pool 2 was formed in 2005, and Pool 3 was formed in 2009. Each PSA obligates the Member to pay, as a component of its gas operations expense, its participation share of all costs incurred by the related PGP pool until all related debt has been paid and the last volumes have been delivered. The PSAs include a step-up provision that may obligate the Members to increase their participation share in the related pool in the event of default by another Member. The Members are obligated to purchase their share of gas produced by the respective Pools, or cash from the sale of the Members’ share of gas produced may be received by the Members in lieu of physical supply. Each of PGP’s gas supply pools is held by wholly-owned subsidiary limited liability companies which are blended component units of PGP.
Member Pool 1
Participation Share
Pool 2 Participation
Share
Pool 3 Participation
Share
Florida Municipal Power Agency 22.04% 25.90% 0.00%
Municipal Gas Authority of Georgia 49.74% 58.10% 85.23%
National Public Gas Agency 0.00% 0.00% 2.20%
Patriots Energy Group 8.29% 10.00% 2.66%
The Southeast Alabama Gas District 17.91% 5.00% 9.91%
Tennessee Energy Acquisition Corp. 2.02% 1.00% 0.00%

Public Gas Partners, Inc.
Notes to Financial Statements (continued)
15
1. Summary of Significant Accounting Policies (continued)
Additionally, Pool 3 has a wholly-owned subsidiary, PGP Operating, which operates approximately 1,354 wells in the Black Warrior Basin of Alabama.
For Pools 1 and 2, PGP was authorized to acquire gas reserves or other contract rights during a three-year acquisition period that ended June 30, 2008. Pool 3 is authorized to acquire gas reserves or other contract rights on an ongoing basis as necessary to fulfill the gas deliveries requested by Pool 3 participants. PGP utilizes wholly owned subsidiaries to own the assets and manage the operations of its various projects. All intercompany transactions have been eliminated.
The Gas Authority manages PGP’s day-to-day operations under a contract that ends on November 1, 2018, and renews automatically for two-year periods unless either party gives 180 days’ notice. Under this agreement, PGP paid the Gas Authority $1,923,308 and $1,996,770 for management fees for the years ended June 30, 2017 and 2016, respectively. Also, PGP Operating paid $5,758,153 and $6,688,002 for the years ended June 30, 2017 and 2016, respectively, to the Gas Authority in salaries and benefits costs for field personnel who are employees of the Gas Authority. These amounts are shown within Payments to Members on the Statements of Cash Flows.
Subsequent Events
In preparing the accompanying financial statements, management reviewed all known events that have occurred after June 30, 2017, and through September 21, 2017, for inclusion in the financial statements and footnotes.
Basis of Accounting
PGP follows proprietary fund accounting in accordance with Governmental Accounting Standards Board (GASB) pronouncements. Proprietary fund accounting is used to report business-type activities, as contrasted with tax-supported governmental activities.
PGP also complies with policies and practices prescribed by its Board of Directors and to practices common in the natural gas industry. As the Board of Directors has the authority to set rates, PGP follows GASB-regulated accounting guidance in GASB Statement No. 62, Codification of Accounting and Financial Reporting Guidance Contained in Pre-November 30, 1989 FASB and AICPA Pronouncements (GASB 62), which provides for the reporting of assets and liabilities consistent with the economic effect of the rate structure. Under GASB 62, regulatory assets are recorded to reflect probable future revenues associated with certain costs that are expected to be recovered from customers through the ratemaking process. Regulatory liabilities are recorded to reflect probable future reductions in revenues associated with amounts that are expected to be credited to customers through the ratemaking process.
Public Gas Partners, Inc.
Notes to Financial Statements (continued)
16
1. Summary of Significant Accounting Policies (continued)
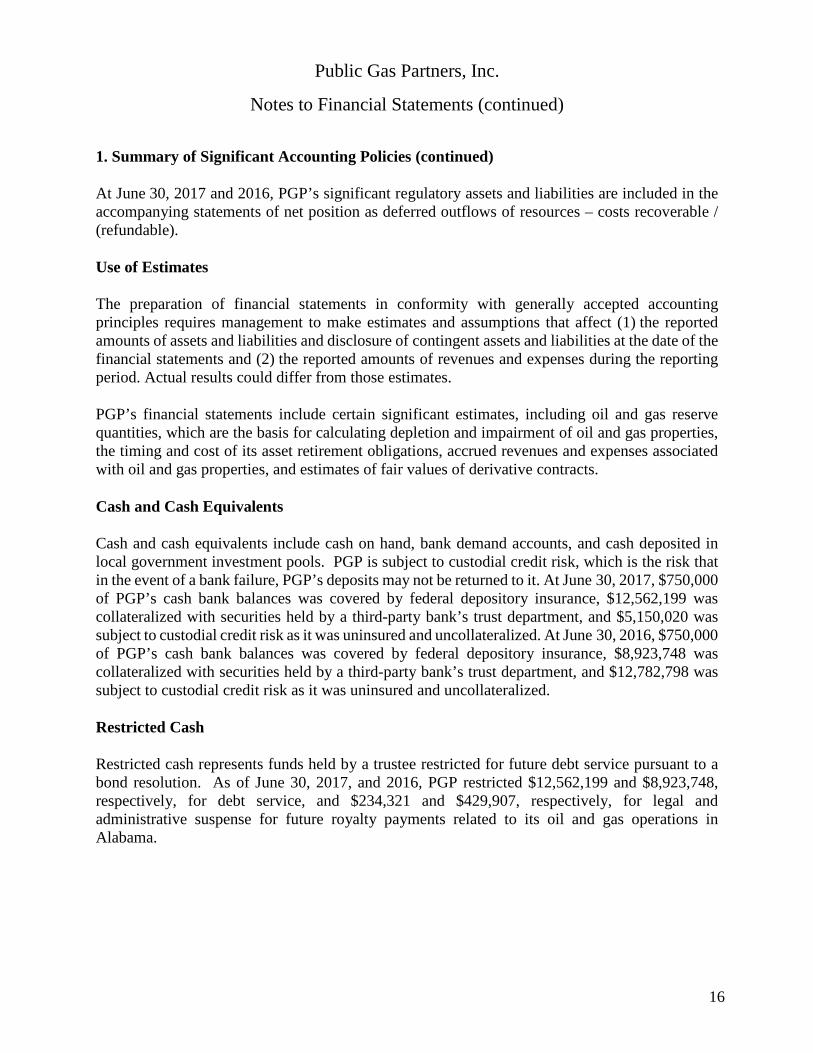
At June 30, 2017 and 2016, PGP’s significant regulatory assets and liabilities are included in the accompanying statements of net position as deferred outflows of resources – costs recoverable / (refundable).
Use of Estimates
The preparation of financial statements in conformity with generally accepted accounting principles requires management to make estimates and assumptions that affect (1) the reported amounts of assets and liabilities and disclosure of contingent assets and liabilities at the date of the financial statements and (2) the reported amounts of revenues and expenses during the reporting period. Actual results could differ from those estimates.
PGP’s financial statements include certain significant estimates, including oil and gas reserve quantities, which are the basis for calculating depletion and impairment of oil and gas properties, the timing and cost of its asset retirement obligations, accrued revenues and expenses associated with oil and gas properties, and estimates of fair values of derivative contracts.
Cash and Cash Equivalents
Cash and cash equivalents include cash on hand, bank demand accounts, and cash deposited in local government investment pools. PGP is subject to custodial credit risk, which is the risk that in the event of a bank failure, PGP’s deposits may not be returned to it. At June 30, 2017, $750,000 of PGP’s cash bank balances was covered by federal depository insurance, $12,562,199 was collateralized with securities held by a third-party bank’s trust department, and $5,150,020 was subject to custodial credit risk as it was uninsured and uncollateralized. At June 30, 2016, $750,000 of PGP’s cash bank balances was covered by federal depository insurance, $8,923,748 was collateralized with securities held by a third-party bank’s trust department, and $12,782,798 was subject to custodial credit risk as it was uninsured and uncollateralized.
Restricted Cash
Restricted cash represents funds held by a trustee restricted for future debt service pursuant to a bond resolution. As of June 30, 2017, and 2016, PGP restricted $12,562,199 and $8,923,748, respectively, for debt service, and $234,321 and $429,907, respectively, for legal and administrative suspense for future royalty payments related to its oil and gas operations in Alabama.

Public Gas Partners, Inc.
Notes to Financial Statements (continued)
17
1. Summary of Significant Accounting Policies (continued)
Other Assets
Other assets include well materials such as pumps and rotors, advances on well drilling, and deposits. The well materials are used in PGP’s gas production operations and are held at purchased cost on the statements of net position.
Oil and Gas Properties
Oil and gas properties represent working and royalty interests in oil and natural gas wells and related contract rights, facilities, and equipment. PGP uses the full-cost method of accounting for its investments in oil and gas properties. Under this method, PGP capitalizes all acquisition, exploration, and development costs incurred for the purpose of finding oil and gas reserves. Costs associated with production are expensed in the period incurred. PGP also includes the present value as of the date of incurrence of its dismantlement, restoration, and abandonment costs within the capitalized oil and gas property balance.
PGP computes the depreciation, depletion, and amortization (DD&A) of oil and gas properties using the unit-of-production method based upon a ratio of production and estimates of proved reserve quantities. The Company’s total oil and gas properties consisted of the following:
Oil and gas properties, full cost method of accounting: 2017 2016 Proved properties $ 919,858,675 $ 918,275,880 Total oil and gas properties 919,858,675 918,275,880 Accumulated depletion of proved properties (813,293,807) (802,794,784) Total oil and gas properties, net $ 106,564,868 $ 115,481,096 Accumulated depletion was $490,723,652 for Pool 1, $157,732,003 for Pool 2, and $164,838,152 for Pool 3 as of June 30, 2017, and $484,467,016 for Pool 1, $157,645,268 for Pool 2, and $160,682,500 for Pool 3 as of June 30, 2016.
Under the full-cost method, capitalized costs are limited to an amount not to exceed the value of the related oil and gas reserves (referred to as a ceiling on capitalized costs). In performing its annual ceiling test, PGP limits the capitalized costs of oil and gas properties, net of accumulated DD&A, to the present value of estimated future net cash flows, including cash flows from hedging transactions, from proved oil and gas reserves, plus the lower of cost or fair value of any unproved properties included in the costs being amortized. The full-cost method stipulates that future cash flows are discounted at 10%. If capitalized costs exceed this limit, the excess is charged as additional DD&A expense.
Public Gas Partners, Inc.
Notes to Financial Statements (continued)
18
1. Summary of Significant Accounting Policies (continued)
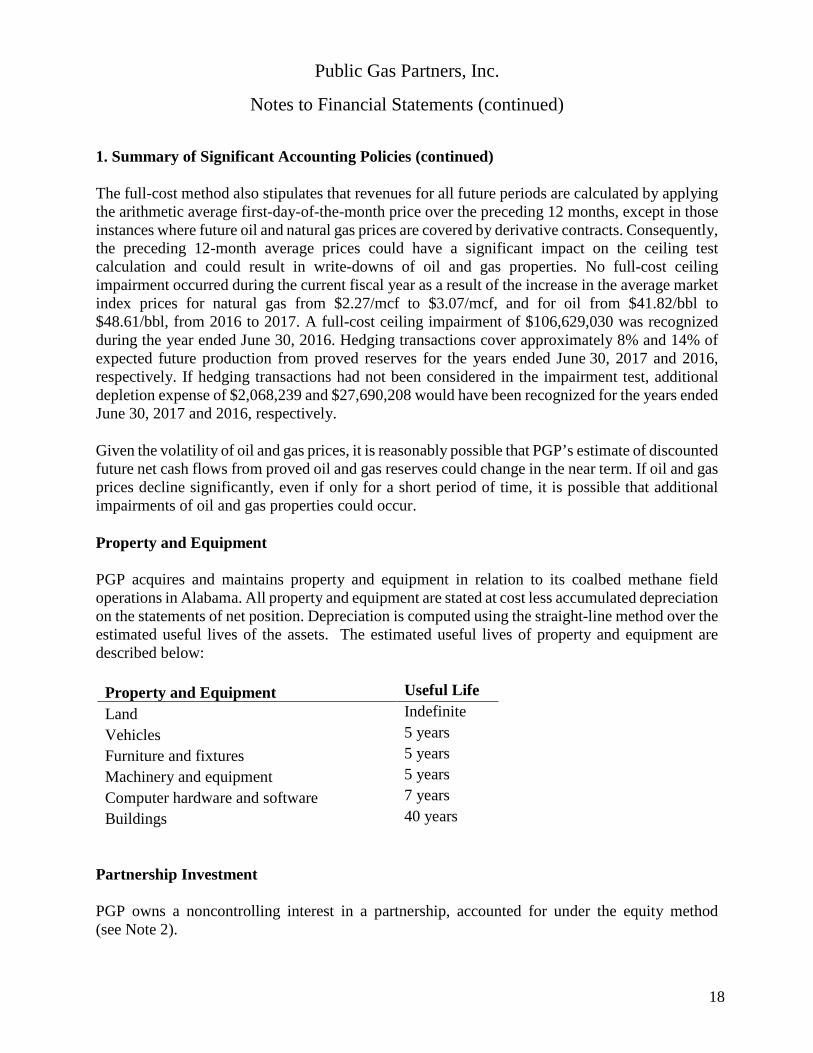
The full-cost method also stipulates that revenues for all future periods are calculated by applying the arithmetic average first-day-of-the-month price over the preceding 12 months, except in those instances where future oil and natural gas prices are covered by derivative contracts. Consequently, the preceding 12-month average prices could have a significant impact on the ceiling test calculation and could result in write-downs of oil and gas properties. No full-cost ceiling impairment occurred during the current fiscal year as a result of the increase in the average market index prices for natural gas from $2.27/mcf to $3.07/mcf, and for oil from $41.82/bbl to $48.61/bbl, from 2016 to 2017. A full-cost ceiling impairment of $106,629,030 was recognized during the year ended June 30, 2016. Hedging transactions cover approximately 8% and 14% of expected future production from proved reserves for the years ended June 30, 2017 and 2016, respectively. If hedging transactions had not been considered in the impairment test, additional depletion expense of $2,068,239 and $27,690,208 would have been recognized for the years ended June 30, 2017 and 2016, respectively.
Given the volatility of oil and gas prices, it is reasonably possible that PGP’s estimate of discounted future net cash flows from proved oil and gas reserves could change in the near term. If oil and gas prices decline significantly, even if only for a short period of time, it is possible that additional impairments of oil and gas properties could occur.
Property and Equipment
PGP acquires and maintains property and equipment in relation to its coalbed methane field operations in Alabama. All property and equipment are stated at cost less accumulated depreciation on the statements of net position. Depreciation is computed using the straight-line method over the estimated useful lives of the assets. The estimated useful lives of property and equipment are described below:
Property and Equipment Useful Life Land Indefinite Vehicles 5 years Furniture and fixtures 5 years Machinery and equipment 5 years Computer hardware and software 7 years Buildings 40 years
Partnership Investment
PGP owns a noncontrolling interest in a partnership, accounted for under the equity method (see Note 2).

Public Gas Partners, Inc.
Notes to Financial Statements (continued)
19
1. Summary of Significant Accounting Policies (continued)
Deferred Outflows of Resources - Costs Recoverable / (Refundable)
Under the provisions of the PSAs, the Board of Directors establishes rates and charges to produce revenues sufficient to cover PGP’s costs. Expenses in excess of amounts currently billable to the Members under the pricing mechanism will be recovered from future billings to the Members and are classified as a deferred outflow.
Asset Retirement Obligations
Asset retirement obligations represent the present value of the estimated costs for well shut-ins and abandonments upon retirement of the related oil and gas properties. Such costs are recorded in oil and gas properties and amortized to expense using the units-of-production method.
Advance Billings – FMPA
Advance billings – FMPA represents FMPA’s payment to PGP in December 2008 of $101,649,489 for a portion of its participation share of future gas deliveries over the life of Pools 1 and 2, adjusted by payments to or from FMPA subsequent to December 2008 for FMPA’s participation share of net cash flows from oil and gas operations. The original amount advanced was based on FMPA’s participation share of the December 2008 balances of PGP’s lines of credit, which had been used to fund acquisitions and certain capital development costs in accordance with the terms of FMPA’s PSAs for Pools 1 and 2.
Derivative Instruments
PGP uses derivative instruments, including swaps and options, to hedge its commodity price risk associated with short-term and long-term changes in oil and natural gas prices. Realized gains or losses on hedging derivative instruments are recognized in operating revenues in the period to which the derivative instruments relate. Realized gains or losses on derivative instruments that do not meet the criteria to be accounted for as hedging derivative instruments (investment derivative instruments), if any, are recognized in investment income in the period to which the derivative instruments relate. GASB Statement No. 53, Accounting and Financial Reporting for Derivative Instruments (GASB 53), requires PGP to record the fair value of derivative instruments on the statements of net position as an asset or liability. The change in fair value of hedging derivative instruments (unrealized gains or losses) is recorded as a deferred gain or deferred loss on the statements of net position (referred to as deferred inflows or outflows of resources). Changes in the fair value of investment derivative instruments (unrealized gains or losses) are recognized as investment income (loss) and then deferred as regulatory assets or liabilities under GASB 62. The fair values of derivative instruments with individual counterparties under master netting arrangements are offset as current and/or long-term net position or liabilities on the statements of net position.
Public Gas Partners, Inc.
Notes to Financial Statements (continued)
20
1. Summary of Significant Accounting Policies (continued)
Cash receipts and payments for commodity instruments are classified as operating activities in the statements of cash flows. Unrealized gains and losses on commodity derivatives held on behalf of PGP are deferred and offset corresponding fair value changes in the Gas Authority’s receivable from PGP.
Deferred Inflows/Outflows of Resources – Unrealized Gain/Loss on Derivative Instruments
Deferred inflows/outflows of resources represent the unrealized gain/loss on hedging derivative instruments.
Revenues
Oil and gas revenues are recognized when production or acquired gas is sold to a purchaser at a fixed or determinable price, when delivery has occurred and title has transferred, and if collectability of the revenue is probable. Oil and gas are sold in their local markets and shown as Production sold to customers and Members in the statements of revenues, expenses, and changes in net position. PGP acquires comparable volumes of produced gas in its Members’ service areas and delivers that gas to the Members, shown as Gas acquired and sold to Members in the statements of revenues, expenses, and changes in net position. Additionally, realized gains and losses related to PGP’s natural gas and oil derivatives are recognized in operating revenues, as described above. Under the provisions of the PSAs, PGP is required to set rates sufficient to recover all its costs. Any excess revenues or expenses are either credited or billed, respectively, to the Members in accordance with policies established by the Board of Directors.
Income Taxes
PGP is a nonprofit corporation comprised of governmental entities and, therefore, claims exemption from federal and state income taxes. Accordingly, no provision for such taxes is made in the accompanying financial statements.
Fair Value of Financial Instruments
PGP’s financial instruments, including cash and cash equivalents, restricted cash, accounts receivable, accounts payable, and other current liabilities, are carried at cost, which approximates fair values due to the short-term maturities of these instruments. PGP’s derivative instruments to hedge its commodity price risk are recorded at estimated fair values.
Reclassifications
Certain amounts in the 2016 financial statements have been reclassified to conform to the 2017 presentation.

Public Gas Partners, Inc.
Notes to Financial Statements (continued)
21
1. Summary of Significant Accounting Policies (continued)
Business Combinations
PGP applies GASB Statement No. 69, Government Combinations and Disposals of Government Operations (GASB 69) in its accounting for acquisitions. It requires PGP to recognize the assets acquired and the liabilities assumed at their acquisition date fair values. While PGP uses its best estimates and assumptions to accurately value assets acquired and liabilities assumed at the acquisition date as well as contingent consideration, where applicable, the estimates are inherently uncertain and subject to refinement. As a result, during the measurement period, which may be up to one year from the acquisition date, PGP may record adjustments to the assets acquired and liabilities assumed.
2. Partnership Investment
PGP owns a noncontrolling interest in a partnership that owns oil and gas properties. Summarized financial information for this investment as of and for the years ended June 30, 2017 and 2016, is as follows:
2017 2016 Assets $ 14,751,982 $ 10,834,510 Liabilities $ 1,633,972 $ 154,073 Revenues $ 4,250,645 $ 5,078,201 Expenses (3,782,969) (7,614,631) Impairment loss - (8,906,354)
Net income / (loss) $ 467,676 $ (11,442,784)
Partnership interest assets are shown net of full-cost ceiling impairments of $0 and $8,906,354, for 2017 and 2016, respectively.
The difference between PGP’s carrying amount and its share of net assets of investees at June 30, 2017 and 2016, primarily relates to the contribution of cash into the partnership by TGP’s general partner and a corresponding change in the interest owned by PGP.

Public Gas Partners, Inc.
Notes to Financial Statements (continued)
22
3. Property and Equipment
Property and equipment activity for the year ended June 30, 2017 was as follows:
Balance at
June 30, 2016 Additions Disposals Depreciation Balance at
June 30, 2017 Buildings $ 1,266,888 $ - $ - $ - $ 1,266,888 Vehicles 1,360,203 367,342 (127,085) - 1,600,460 Computer hardware and software 666,901 18,739 - - 685,640 Land 100,000 - - - 100,000 Machinery and equipment 37,563 - - - 37,563 Accumulated depreciation (891,989) - 88,507 (429,383) (1,232,865)
Total property and equipment, net $ 2,539,566 $ 386,081 $ (38,578) $ (429,383) $ 2,457,686
Depreciation expense relating to property and equipment was $429,383 and $426,296 for 2017 and 2016, respectively.
4. Debt and Advances from the Gas Authority
In October 2009, PGP issued 10-year, fixed-rate bonds (the Series A Bonds) in a principal amount of $125,000,000. Annual principal payments are due through October 1, 2019.
Following is a summary of activity for the Series A Bonds:
June 30, 2016 Proceeds Payments June 30, 2017 Series A Bonds $ 54,000,000 $ – $ 11,000,000 $ 43,000,000 June 30, 2015 Proceeds Payments June 30, 2016 Series A Bonds $ 65,000,000 $ – $ 11,000,000 $ 54,000,000
Public Gas Partners, Inc.
Notes to Financial Statements (continued)
23
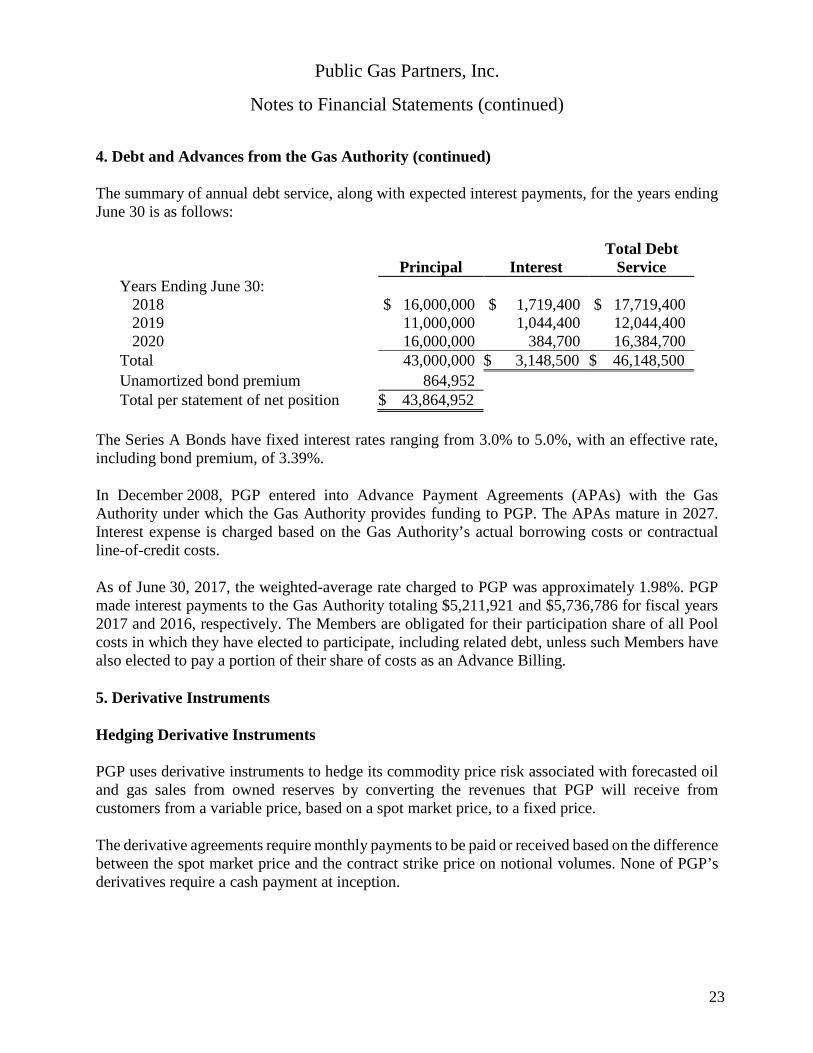
4. Debt and Advances from the Gas Authority (continued)
The summary of annual debt service, along with expected interest payments, for the years ending June 30 is as follows:
Principal Interest Total Debt
Service Years Ending June 30:
2018 $ 16,000,000 $ 1,719,400 $ 17,719,400 2019 11,000,000 1,044,400 12,044,400 2020 16,000,000 384,700 16,384,700
Total 43,000,000 $ 3,148,500 $ 46,148,500 Unamortized bond premium 864,952 Total per statement of net position $ 43,864,952
The Series A Bonds have fixed interest rates ranging from 3.0% to 5.0%, with an effective rate, including bond premium, of 3.39%.
In December 2008, PGP entered into Advance Payment Agreements (APAs) with the Gas Authority under which the Gas Authority provides funding to PGP. The APAs mature in 2027. Interest expense is charged based on the Gas Authority’s actual borrowing costs or contractual line-of-credit costs.
As of June 30, 2017, the weighted-average rate charged to PGP was approximately 1.98%. PGP made interest payments to the Gas Authority totaling $5,211,921 and $5,736,786 for fiscal years 2017 and 2016, respectively. The Members are obligated for their participation share of all Pool costs in which they have elected to participate, including related debt, unless such Members have also elected to pay a portion of their share of costs as an Advance Billing.
5. Derivative Instruments
Hedging Derivative Instruments
PGP uses derivative instruments to hedge its commodity price risk associated with forecasted oil and gas sales from owned reserves by converting the revenues that PGP will receive from customers from a variable price, based on a spot market price, to a fixed price.
The derivative agreements require monthly payments to be paid or received based on the difference between the spot market price and the contract strike price on notional volumes. None of PGP’s derivatives require a cash payment at inception.
Public Gas Partners, Inc.
Notes to Financial Statements (continued)
24
5. Derivative Instruments (continued)
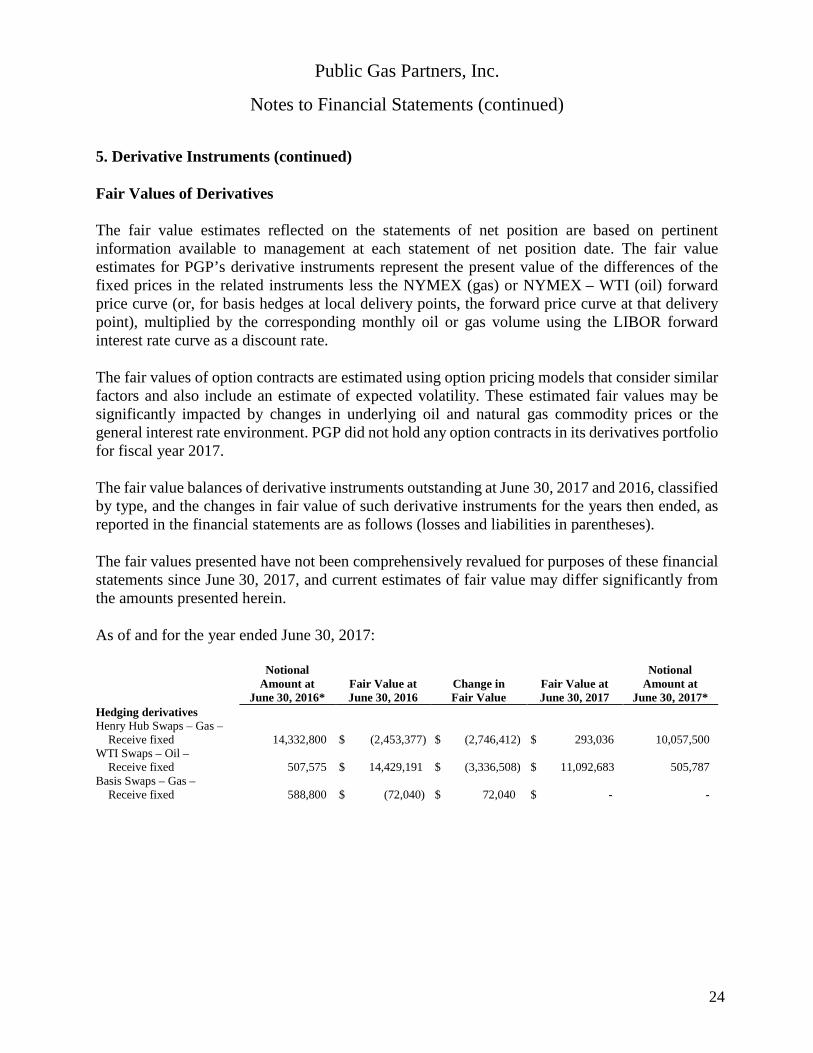
Fair Values of Derivatives
The fair value estimates reflected on the statements of net position are based on pertinent information available to management at each statement of net position date. The fair value estimates for PGP’s derivative instruments represent the present value of the differences of the fixed prices in the related instruments less the NYMEX (gas) or NYMEX – WTI (oil) forward price curve (or, for basis hedges at local delivery points, the forward price curve at that delivery point), multiplied by the corresponding monthly oil or gas volume using the LIBOR forward interest rate curve as a discount rate.
The fair values of option contracts are estimated using option pricing models that consider similar factors and also include an estimate of expected volatility. These estimated fair values may be significantly impacted by changes in underlying oil and natural gas commodity prices or the general interest rate environment. PGP did not hold any option contracts in its derivatives portfolio for fiscal year 2017.
The fair value balances of derivative instruments outstanding at June 30, 2017 and 2016, classified by type, and the changes in fair value of such derivative instruments for the years then ended, as reported in the financial statements are as follows (losses and liabilities in parentheses).
The fair values presented have not been comprehensively revalued for purposes of these financial statements since June 30, 2017, and current estimates of fair value may differ significantly from the amounts presented herein.
As of and for the year ended June 30, 2017:
Notional Amount at
June 30, 2016* Fair Value at June 30, 2016
Change in Fair Value
Fair Value at June 30, 2017
Notional Amount at
June 30, 2017* Hedging derivatives Henry Hub Swaps – Gas –
Receive fixed 14,332,800 $ (2,453,377) $ (2,746,412) $ 293,036 10,057,500 WTI Swaps – Oil –
Receive fixed 507,575 $ 14,429,191 $ (3,336,508) $ 11,092,683 505,787 Basis Swaps – Gas –
Receive fixed 588,800 $ (72,040) $ 72,040 $ - -
Public Gas Partners, Inc.
Notes to Financial Statements (continued)
25
5. Derivative Instruments (continued)
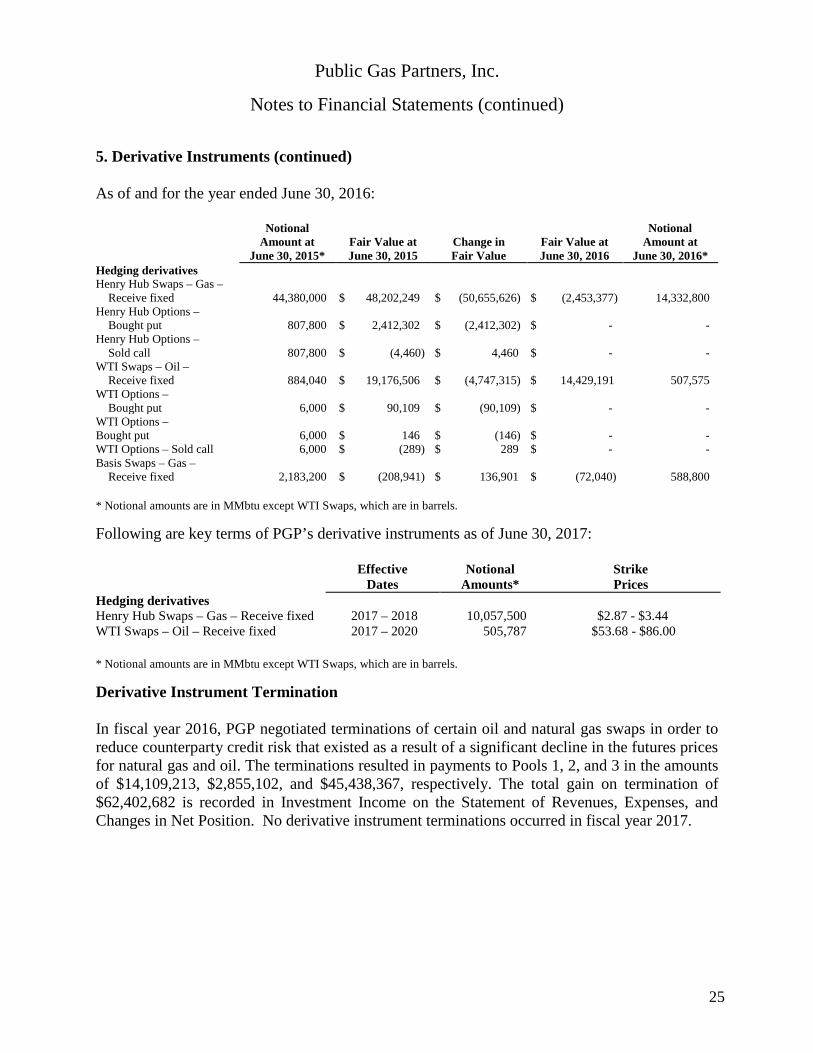
As of and for the year ended June 30, 2016:
Notional Amount at
June 30, 2015* Fair Value at June 30, 2015
Change in Fair Value
Fair Value at June 30, 2016
Notional Amount at
June 30, 2016* Hedging derivatives Henry Hub Swaps – Gas –
Receive fixed 44,380,000 $ 48,202,249 $ (50,655,626) $ (2,453,377) 14,332,800 Henry Hub Options –
Bought put 807,800 $ 2,412,302 $ (2,412,302) $ - - Henry Hub Options –
Sold call 807,800 $ (4,460) $ 4,460 $ - - WTI Swaps – Oil –
Receive fixed 884,040 $ 19,176,506 $ (4,747,315) $ 14,429,191 507,575 WTI Options –
Bought put 6,000 $ 90,109 $ (90,109) $ - - WTI Options – Bought put 6,000 $ 146 $ (146) $ - - WTI Options – Sold call 6,000 $ (289) $ 289 $ - - Basis Swaps – Gas –
Receive fixed 2,183,200 $ (208,941) $ 136,901 $ (72,040) 588,800 * Notional amounts are in MMbtu except WTI Swaps, which are in barrels.
Following are key terms of PGP’s derivative instruments as of June 30, 2017:
Effective Dates
Notional Amounts*
Strike Prices
Hedging derivatives Henry Hub Swaps – Gas – Receive fixed 2017 – 2018 10,057,500 $2.87 - $3.44 WTI Swaps – Oil – Receive fixed 2017 – 2020 505,787 $53.68 - $86.00 * Notional amounts are in MMbtu except WTI Swaps, which are in barrels.
Derivative Instrument Termination
In fiscal year 2016, PGP negotiated terminations of certain oil and natural gas swaps in order to reduce counterparty credit risk that existed as a result of a significant decline in the futures prices for natural gas and oil. The terminations resulted in payments to Pools 1, 2, and 3 in the amounts of $14,109,213, $2,855,102, and $45,438,367, respectively. The total gain on termination of $62,402,682 is recorded in Investment Income on the Statement of Revenues, Expenses, and Changes in Net Position. No derivative instrument terminations occurred in fiscal year 2017.
Public Gas Partners, Inc.
Notes to Financial Statements (continued)
26
5. Derivative Instruments (continued)
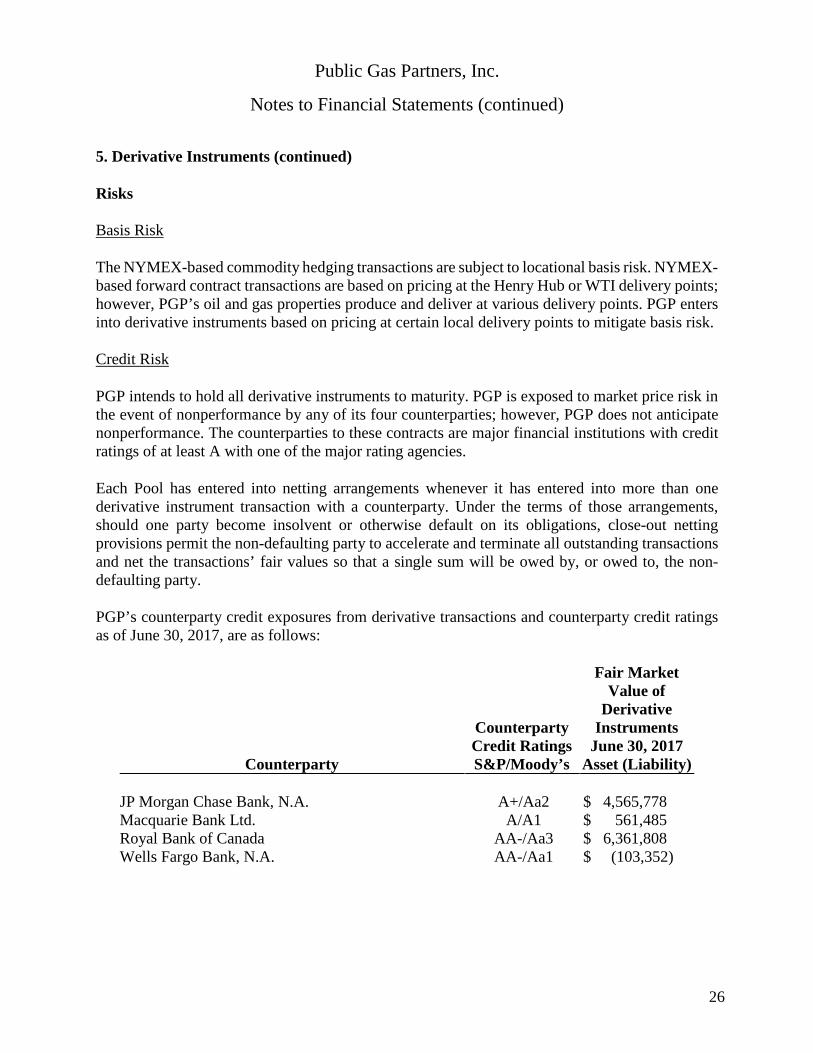
Risks
Basis Risk
The NYMEX-based commodity hedging transactions are subject to locational basis risk. NYMEX-based forward contract transactions are based on pricing at the Henry Hub or WTI delivery points; however, PGP’s oil and gas properties produce and deliver at various delivery points. PGP enters into derivative instruments based on pricing at certain local delivery points to mitigate basis risk.
Credit Risk
PGP intends to hold all derivative instruments to maturity. PGP is exposed to market price risk in the event of nonperformance by any of its four counterparties; however, PGP does not anticipate nonperformance. The counterparties to these contracts are major financial institutions with credit ratings of at least A with one of the major rating agencies.
Each Pool has entered into netting arrangements whenever it has entered into more than one derivative instrument transaction with a counterparty. Under the terms of those arrangements, should one party become insolvent or otherwise default on its obligations, close-out netting provisions permit the non-defaulting party to accelerate and terminate all outstanding transactions and net the transactions’ fair values so that a single sum will be owed by, or owed to, the non-defaulting party.
PGP’s counterparty credit exposures from derivative transactions and counterparty credit ratings as of June 30, 2017, are as follows:
Counterparty
Counterparty Credit Ratings S&P/Moody’s
Fair Market Value of
Derivative Instruments
June 30, 2017 Asset (Liability)
JP Morgan Chase Bank, N.A. A+/Aa2 $ 4,565,778 Macquarie Bank Ltd. A/A1 $ 561,485 Royal Bank of Canada AA-/Aa3 $ 6,361,808 Wells Fargo Bank, N.A. AA-/Aa1 $ (103,352)
Public Gas Partners, Inc.
Notes to Financial Statements (continued)
27
5. Derivative Instruments (continued)
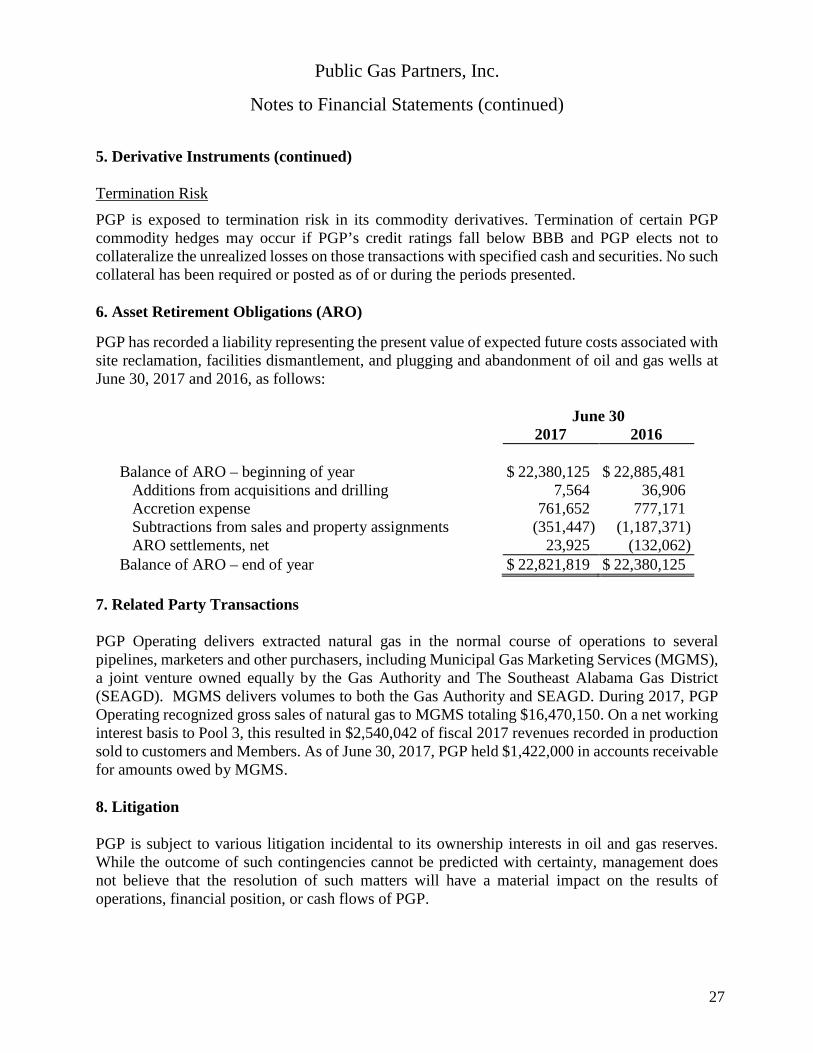
Termination Risk PGP is exposed to termination risk in its commodity derivatives. Termination of certain PGP commodity hedges may occur if PGP’s credit ratings fall below BBB and PGP elects not to collateralize the unrealized losses on those transactions with specified cash and securities. No such collateral has been required or posted as of or during the periods presented.
6. Asset Retirement Obligations (ARO)
PGP has recorded a liability representing the present value of expected future costs associated with site reclamation, facilities dismantlement, and plugging and abandonment of oil and gas wells at June 30, 2017 and 2016, as follows:
June 30 2017 2016 Balance of ARO – beginning of year $ 22,380,125 $ 22,885,481
Additions from acquisitions and drilling 7,564 36,906 Accretion expense 761,652 777,171 Subtractions from sales and property assignments (351,447) (1,187,371) ARO settlements, net 23,925 (132,062)
Balance of ARO – end of year $ 22,821,819 $ 22,380,125 7. Related Party Transactions
PGP Operating delivers extracted natural gas in the normal course of operations to several pipelines, marketers and other purchasers, including Municipal Gas Marketing Services (MGMS), a joint venture owned equally by the Gas Authority and The Southeast Alabama Gas District (SEAGD). MGMS delivers volumes to both the Gas Authority and SEAGD. During 2017, PGP Operating recognized gross sales of natural gas to MGMS totaling $16,470,150. On a net working interest basis to Pool 3, this resulted in $2,540,042 of fiscal 2017 revenues recorded in production sold to customers and Members. As of June 30, 2017, PGP held $1,422,000 in accounts receivable for amounts owed by MGMS.
8. Litigation
PGP is subject to various litigation incidental to its ownership interests in oil and gas reserves. While the outcome of such contingencies cannot be predicted with certainty, management does not believe that the resolution of such matters will have a material impact on the results of operations, financial position, or cash flows of PGP.

Supplemental Schedules
28
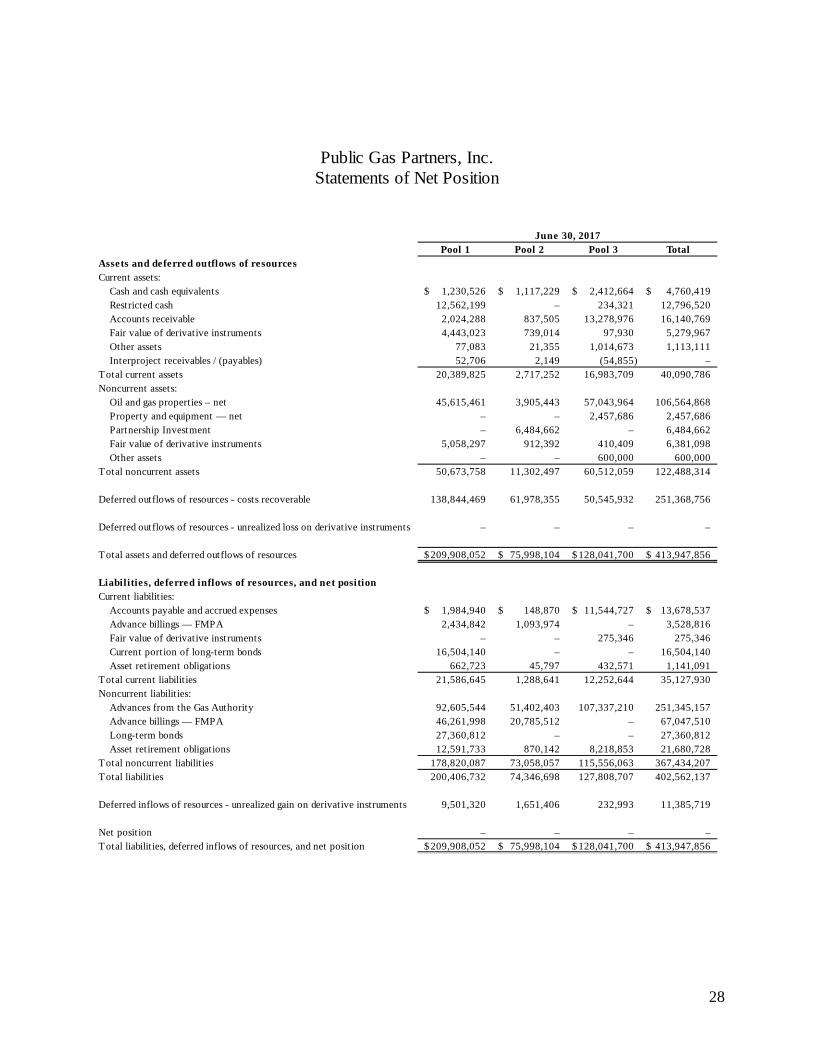
Pool 1 Pool 2 Pool 3 TotalAssets and deferred outflows of resourcesCurrent assets:
Cash and cash equivalents 1,230,526$ 1,117,229$ 2,412,664$ 4,760,419$ Restricted cash 12,562,199 – 234,321 12,796,520 Accounts receivable 2,024,288 837,505 13,278,976 16,140,769 Fair value of derivative instruments 4,443,023 739,014 97,930 5,279,967 Other assets 77,083 21,355 1,014,673 1,113,111 Interproject receivables / (payables) 52,706 2,149 (54,855) –
Total current assets 20,389,825 2,717,252 16,983,709 40,090,786 Noncurrent assets:
Oil and gas properties – net 45,615,461 3,905,443 57,043,964 106,564,868 Property and equipment — net – – 2,457,686 2,457,686 Partnership Investment – 6,484,662 – 6,484,662 Fair value of derivative instruments 5,058,297 912,392 410,409 6,381,098 Other assets – – 600,000 600,000
Total noncurrent assets 50,673,758 11,302,497 60,512,059 122,488,314
Deferred outflows of resources - costs recoverable 138,844,469 61,978,355 50,545,932 251,368,756
Deferred outflows of resources - unrealized loss on derivative instruments – – – –
Total assets and deferred outflows of resources 209,908,052$ 75,998,104$ 128,041,700$ 413,947,856$
Liabilities, deferred inflows of resources, and net positionCurrent liabilit ies:
Accounts payable and accrued expenses 1,984,940$ 148,870$ 11,544,727$ 13,678,537$ Advance billings — FMPA 2,434,842 1,093,974 – 3,528,816 Fair value of derivative instruments – – 275,346 275,346 Current portion of long-term bonds 16,504,140 – – 16,504,140 Asset retirement obligations 662,723 45,797 432,571 1,141,091
Total current liabilit ies 21,586,645 1,288,641 12,252,644 35,127,930 Noncurrent liabilit ies:
Advances from the Gas Authority 92,605,544 51,402,403 107,337,210 251,345,157 Advance billings — FMPA 46,261,998 20,785,512 – 67,047,510 Long-term bonds 27,360,812 – – 27,360,812 Asset retirement obligations 12,591,733 870,142 8,218,853 21,680,728
Total noncurrent liabilit ies 178,820,087 73,058,057 115,556,063 367,434,207 Total liabilit ies 200,406,732 74,346,698 127,808,707 402,562,137
Deferred inflows of resources - unrealized gain on derivative instruments 9,501,320 1,651,406 232,993 11,385,719
Net position – – – – Total liabilit ies, deferred inflows of resources, and net position 209,908,052$ 75,998,104$ 128,041,700$ 413,947,856$
Public Gas Partners, Inc.Statements of Net Position
June 30, 2017
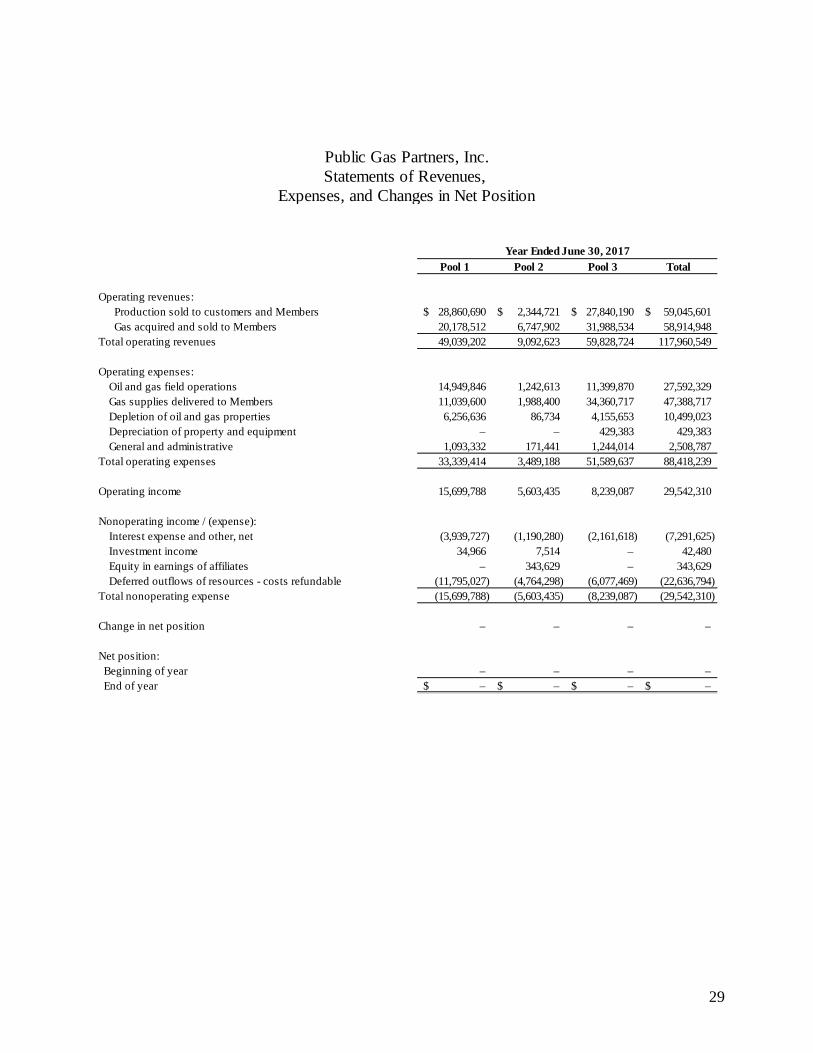
29
Pool 1 Pool 2 Pool 3 Total
Operating revenues: Production sold to customers and Members 28,860,690$ 2,344,721$ 27,840,190$ 59,045,601$ Gas acquired and sold to Members 20,178,512 6,747,902 31,988,534 58,914,948
Total operating revenues 49,039,202 9,092,623 59,828,724 117,960,549
Operating expenses:Oil and gas field operations 14,949,846 1,242,613 11,399,870 27,592,329 Gas supplies delivered to Members 11,039,600 1,988,400 34,360,717 47,388,717 Depletion of oil and gas properties 6,256,636 86,734 4,155,653 10,499,023 Depreciation of property and equipment – – 429,383 429,383 General and administrative 1,093,332 171,441 1,244,014 2,508,787
Total operating expenses 33,339,414 3,489,188 51,589,637 88,418,239
Operating income 15,699,788 5,603,435 8,239,087 29,542,310
Nonoperating income / (expense):Interest expense and other, net (3,939,727) (1,190,280) (2,161,618) (7,291,625) Investment income 34,966 7,514 – 42,480 Equity in earnings of affiliates – 343,629 – 343,629 Deferred outflows of resources - costs refundable (11,795,027) (4,764,298) (6,077,469) (22,636,794)
Total nonoperating expense (15,699,788) (5,603,435) (8,239,087) (29,542,310)
Change in net position – – – –
Net position: Beginning of year – – – – End of year –$ –$ –$ –$
Public Gas Partners, Inc.Statements of Revenues,
Expenses, and Changes in Net Position
Year Ended June 30, 2017

30
Pool 1 Pool 2 Pool 3 TotalO perating activitiesReceipts from customers and Members 43,741,735$ 8,009,345$ 56,277,375$ 108,028,455$ Payments to Members (2,094,164) (229,713) (6,920,968) (9,244,845) Payments to operators and suppliers (25,774,694) (3,365,482) (35,190,518) (64,330,694) Payments from / (to) oil and gas derivative counterparties, net 5,737,121 877,360 (803,261) 5,811,220 Internal activity — payments from / (to) other pools (3,414) (5,886) 9,300 – Net cash provided by operating activities 21,606,584 5,285,624 13,371,928 40,264,136
Capital and related financing activitiesSales of oil and gas properties 416,443 95,578 (80) 511,941 Capital expenditures of property and equipment – – (386,081) (386,081) Sale of property and equipment – – 55,608 55,608 Drilling and completion costs, net of refunds (2,081,404) (826) – (2,082,230) Repayments of gas revenue bonds (11,000,000) – – (11,000,000) Repayments to the Gas Authority (1,074,491) (4,741,958) (17,955,160) (23,771,609) Interest payments and debt issuance costs (4,824,795) (1,190,280) (2,178,649) (8,193,724) Net cash used in capital and related financing activities (18,564,247) (5,837,486) (20,464,362) (44,866,095)
Investing activitiesInvestment distributions / (additions) (15,178) 618,861 – 603,684 Net cash provided by / (used in) investing activities (15,178) 618,861 – 603,684
Net increase / (decrease) in cash equivalents 3,027,160 66,999 (7,092,434) (3,998,275) Cash and cash equivalents:
Beginning of period 10,765,565 1,050,230 9,739,419 21,555,214 End of period 13,792,725$ 1,117,229$ 2,646,985$ 17,556,939$
Reconciliation of revenues in excess of operatingexpenses to net cash provided by operating activities:
Operating income 15,699,788$ 5,603,435$ 8,239,087$ 29,542,310$ Adjustments to reconcile to net cash flows provided by
operating activities: Accretion of asset retirement obligation 465,470 27,003 269,179 761,652 Depreciation of property and equipment – – 429,383 429,383 Depletion of oil and gas properties 6,256,636 86,734 4,155,653 10,499,023 Changes in certain assets and liabilit ies:
Accounts receivable 439,654 (205,918) (5,184,198) (4,950,462) Other assets 568,153 (2,208) 9,054 574,999 Accounts payable and accrued expenses (423,675) (50,180) 5,444,470 4,970,615 Advance billings — FMPA (1,396,028) (167,356) – (1,563,384) Interproject receivables / (payables) (3,414) (5,886) 9,300 –
Net cash provided by operating activities 21,606,584$ 5,285,624$ 13,371,928$ 40,264,136$
Public Gas Partners, Inc.Statements of Cash Flows
Year Ended June 30, 2017