Embed Size (px)
Citation preview
Updated: 3/15/16
1
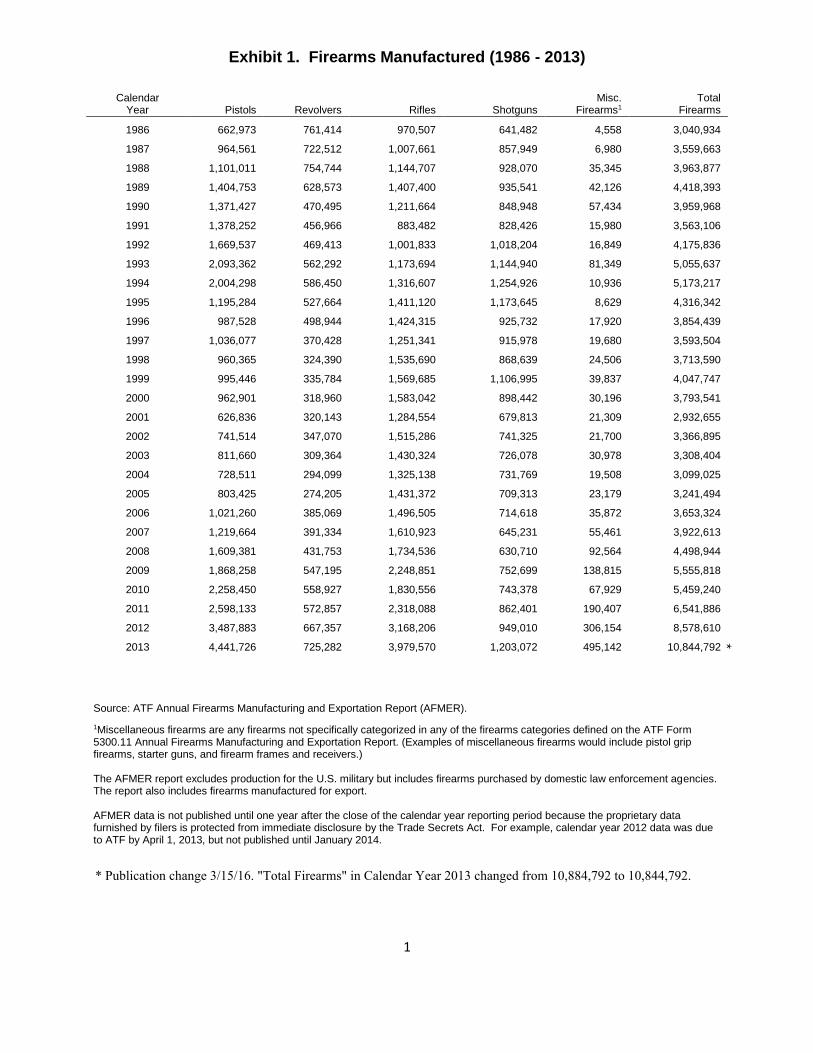
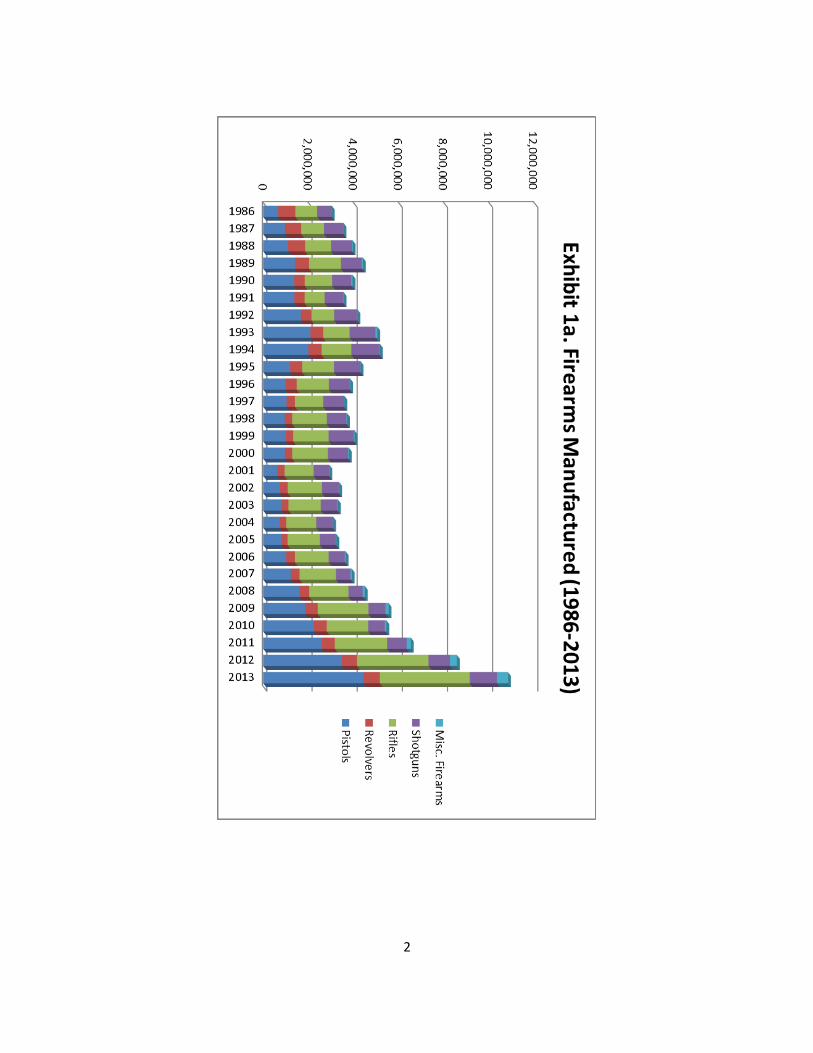
Exhibit 1. Firearms Manufactured (1986 - 2013)
Calendar Year Pistols Revolvers Rifles Shotguns
Misc. Firearms1
Total Firearms
1986 662,973 761,414 970,507 641,482 4,558 3,040,934
1987 964,561 722,512 1,007,661 857,949 6,980 3,559,663
1988 1,101,011 754,744 1,144,707 928,070 35,345 3,963,877
1989 1,404,753 628,573 1,407,400 935,541 42,126 4,418,393
1990 1,371,427 470,495 1,211,664 848,948 57,434 3,959,968
1991 1,378,252 456,966 883,482 828,426 15,980 3,563,106
1992 1,669,537 469,413 1,001,833 1,018,204 16,849 4,175,836
1993 2,093,362 562,292 1,173,694 1,144,940 81,349 5,055,637
1994 2,004,298 586,450 1,316,607 1,254,926 10,936 5,173,217
1995 1,195,284 527,664 1,411,120 1,173,645 8,629 4,316,342
1996 987,528 498,944 1,424,315 925,732 17,920 3,854,439
1997 1,036,077 370,428 1,251,341 915,978 19,680 3,593,504
1998 960,365 324,390 1,535,690 868,639 24,506 3,713,590
1999 995,446 335,784 1,569,685 1,106,995 39,837 4,047,747
2000 962,901 318,960 1,583,042 898,442 30,196 3,793,541
2001 626,836 320,143 1,284,554 679,813 21,309 2,932,655
2002 741,514 347,070 1,515,286 741,325 21,700 3,366,895
2003 811,660 309,364 1,430,324 726,078 30,978 3,308,404
2004 728,511 294,099 1,325,138 731,769 19,508 3,099,025
2005 803,425 274,205 1,431,372 709,313 23,179 3,241,494
2006 1,021,260 385,069 1,496,505 714,618 35,872 3,653,324
2007 1,219,664 391,334 1,610,923 645,231 55,461 3,922,613
2008 1,609,381 431,753 1,734,536 630,710 92,564 4,498,944
2009 1,868,258 547,195 2,248,851 752,699 138,815 5,555,818
2010 2,258,450 558,927 1,830,556 743,378 67,929 5,459,240
2011 2,598,133 572,857 2,318,088 862,401 190,407 6,541,886
2012 3,487,883 667,357 3,168,206 949,010 306,154 8,578,610
2013 4,441,726 725,282 3,979,570 1,203,072 495,142 10,844,792
Source: ATF Annual Firearms Manufacturing and Exportation Report (AFMER).
1Miscellaneous firearms are any firearms not specifically categorized in any of the firearms categories defined on the ATF Form 5300.11 Annual Firearms Manufacturing and Exportation Report. (Examples of miscellaneous firearms would include pistol grip firearms, starter guns, and firearm frames and receivers.)
The AFMER report excludes production for the U.S. military but includes firearms purchased by domestic law enforcement agencies. The report also includes firearms manufactured for export.
AFMER data is not published until one year after the close of the calendar year reporting period because the proprietary data furnished by filers is protected from immediate disclosure by the Trade Secrets Act. For example, calendar year 2012 data was due to ATF by April 1, 2013, but not published until January 2014.
*
* Publication change 3/15/16. "Total Firearms" in Calendar Year 2013 changed from 10,884,792 to 10,844,792.
2
3
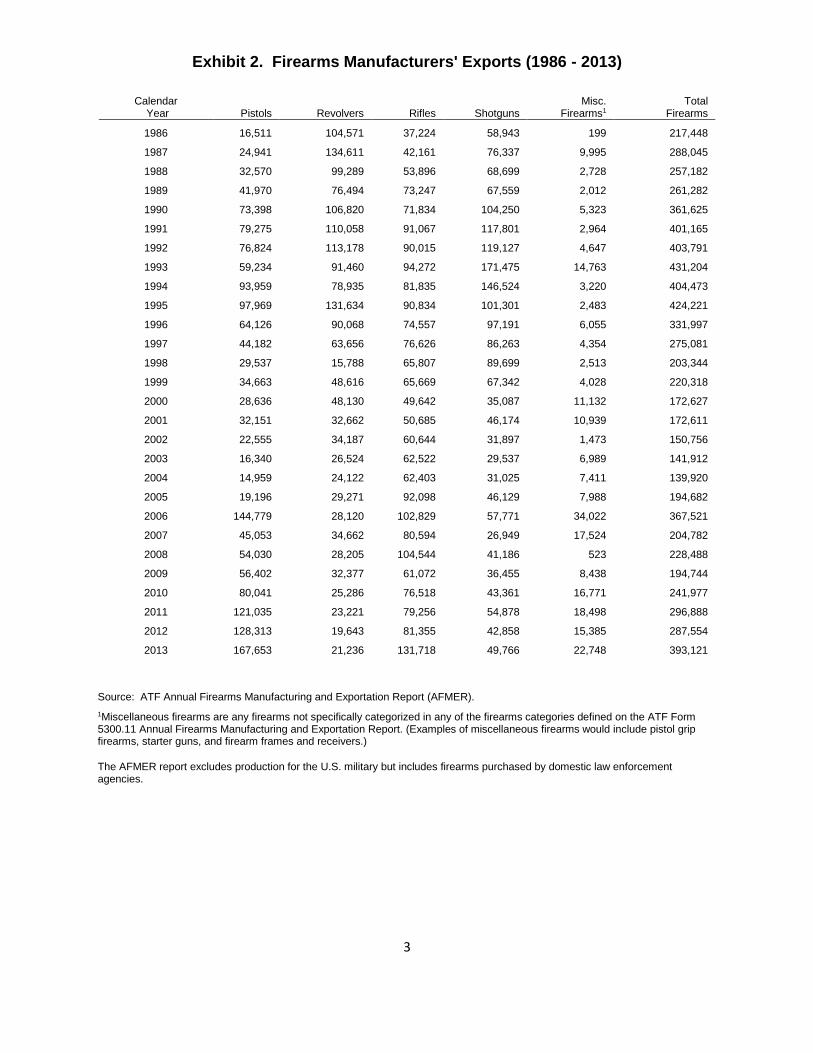
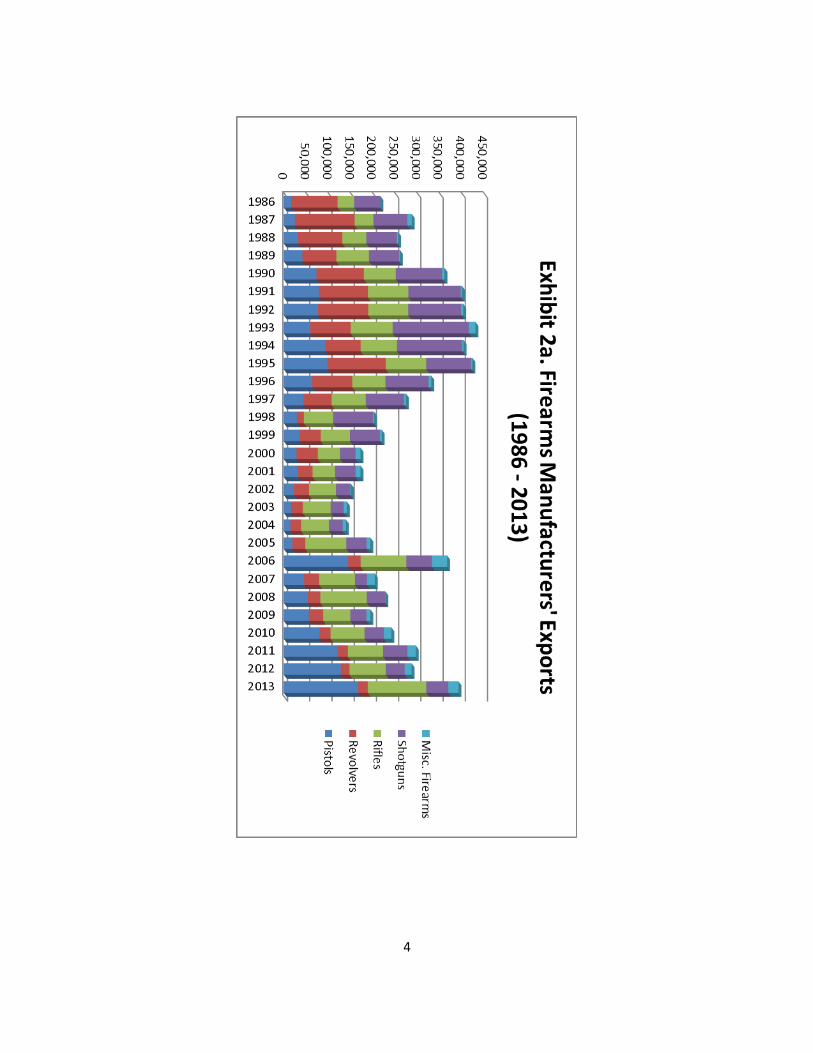
Exhibit 2. Firearms Manufacturers' Exports (1986 - 2013)
Pistols Revolvers Rifles Shotguns Misc.
Firearms1
Calendar Year
Total Firearms
1986 16,511 104,571 37,224 58,943 199 217,448
1987 24,941 134,611 42,161 76,337 9,995 288,045
1988 32,570 99,289 53,896 68,699 2,728 257,182
1989 41,970 76,494 73,247 67,559 2,012 261,282
1990 73,398 106,820 71,834 104,250 5,323 361,625
1991 79,275 110,058 91,067 117,801 2,964 401,165
1992 76,824 113,178 90,015 119,127 4,647 403,791
1993 59,234 91,460 94,272 171,475 14,763 431,204
1994 93,959 78,935 81,835 146,524 3,220 404,473
1995 97,969 131,634 90,834 101,301 2,483 424,221
1996 64,126 90,068 74,557 97,191 6,055 331,997
1997 44,182 63,656 76,626 86,263 4,354 275,081
1998 29,537 15,788 65,807 89,699 2,513 203,344
1999 34,663 48,616 65,669 67,342 4,028 220,318
2000 28,636 48,130 49,642 35,087 11,132 172,627
2001 32,151 32,662 50,685 46,174 10,939 172,611
2002 22,555 34,187 60,644 31,897 1,473 150,756
2003 16,340 26,524 62,522 29,537 6,989 141,912
2004 14,959 24,122 62,403 31,025 7,411 139,920
2005 19,196 29,271 92,098 46,129 7,988 194,682
2006 144,779 28,120 102,829 57,771 34,022 367,521
2007 45,053 34,662 80,594 26,949 17,524 204,782
2008 54,030 28,205 104,544 41,186 523 228,488
2009 56,402 32,377 61,072 36,455 8,438 194,744
2010 80,041 25,286 76,518 43,361 16,771 241,977
2011 121,035 23,221 79,256 54,878 18,498 296,888
2012 128,313 19,643 81,355 42,858 15,385 287,554
2013 167,653 21,236 131,718 49,766 22,748 393,121
Source: ATF Annual Firearms Manufacturing and Exportation Report (AFMER).
1Miscellaneous firearms are any firearms not specifically categorized in any of the firearms categories defined on the ATF Form 5300.11 Annual Firearms Manufacturing and Exportation Report. (Examples of miscellaneous firearms would include pistol grip firearms, starter guns, and firearm frames and receivers.)
The AFMER report excludes production for the U.S. military but includes firearms purchased by domestic law enforcement agencies.
4
5
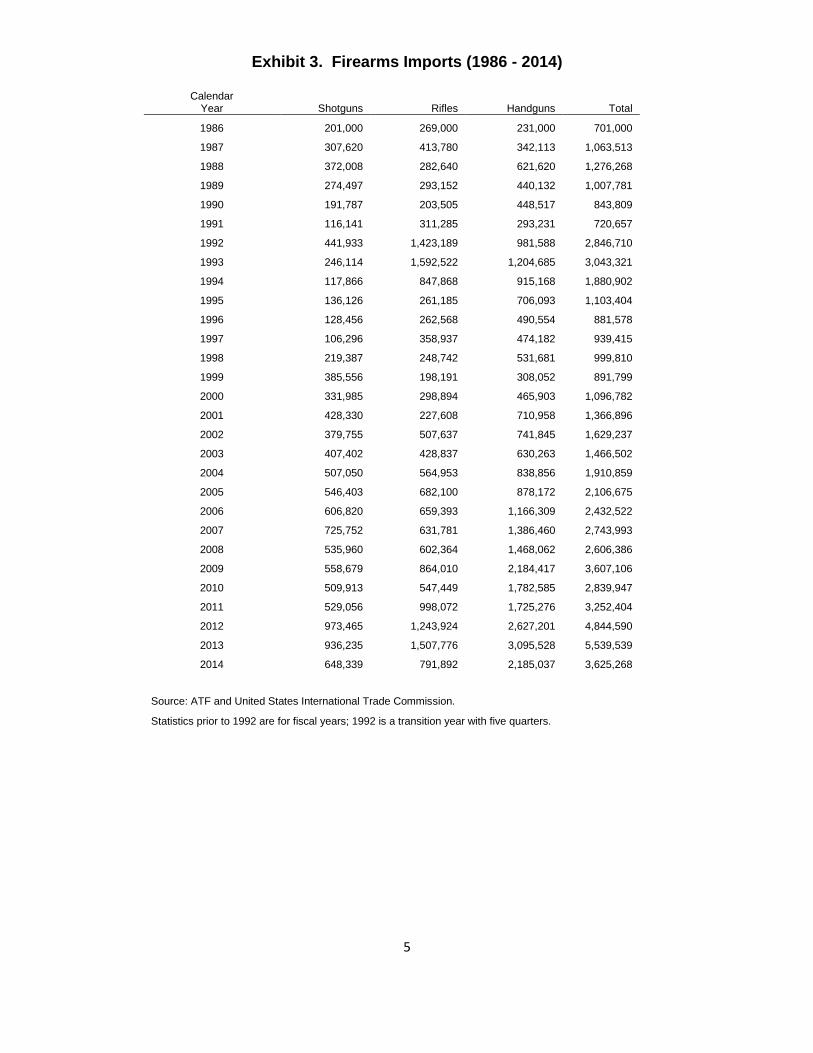
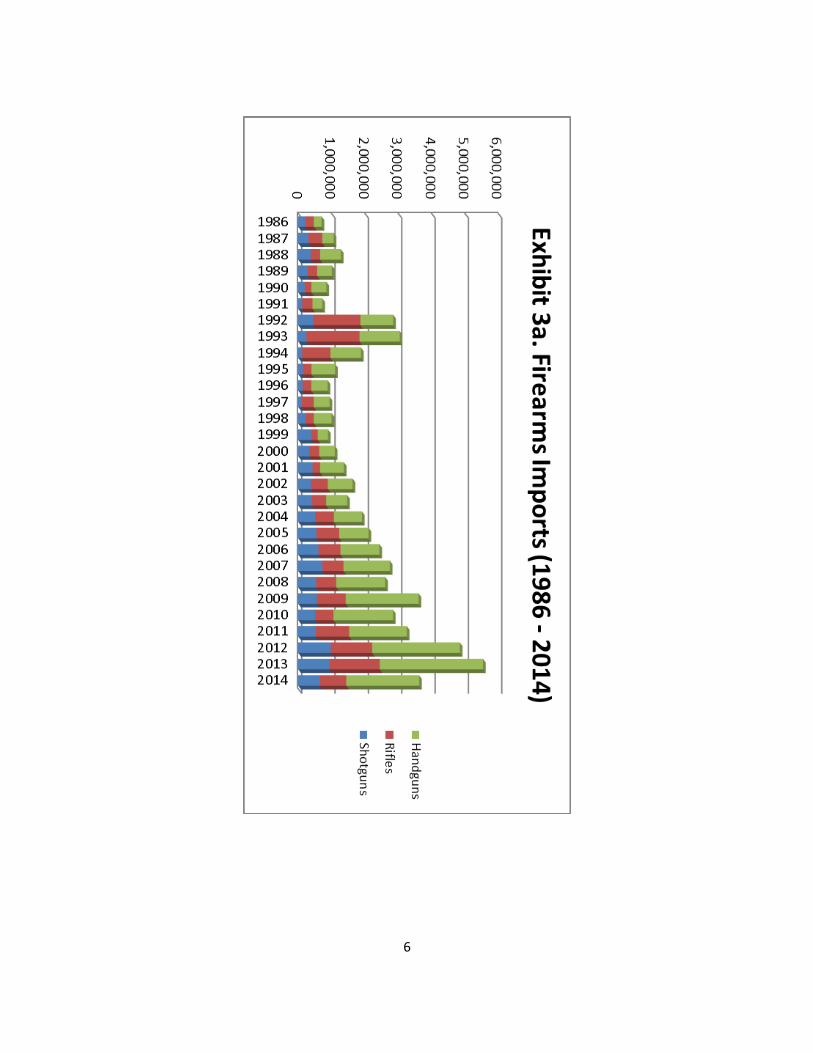
Exhibit 3. Firearms Imports (1986 - 2014)
Calendar Year Shotguns Rifles Handguns Total
1986 201,000 269,000 231,000 701,000
1987 307,620 413,780 342,113 1,063,513
1988 372,008 282,640 621,620 1,276,268
1989 274,497 293,152 440,132 1,007,781
1990 191,787 203,505 448,517 843,809
1991 116,141 311,285 293,231 720,657
1992 441,933 1,423,189 981,588 2,846,710
1993 246,114 1,592,522 1,204,685 3,043,321
1994 117,866 847,868 915,168 1,880,902
1995 136,126 261,185 706,093 1,103,404
1996 128,456 262,568 490,554 881,578
1997 106,296 358,937 474,182 939,415
1998 219,387 248,742 531,681 999,810
1999 385,556 198,191 308,052 891,799
2000 331,985 298,894 465,903 1,096,782
2001 428,330 227,608 710,958 1,366,896
2002 379,755 507,637 741,845 1,629,237
2003 407,402 428,837 630,263 1,466,502
2004 507,050 564,953 838,856 1,910,859
2005 546,403 682,100 878,172 2,106,675
2006 606,820 659,393 1,166,309 2,432,522
2007 725,752 631,781 1,386,460 2,743,993
2008 535,960 602,364 1,468,062 2,606,386
2009 558,679 864,010 2,184,417 3,607,106
2010 509,913 547,449 1,782,585 2,839,947
2011 529,056 998,072 1,725,276 3,252,404
2012 973,465 1,243,924 2,627,201 4,844,590
2013 936,235 1,507,776 3,095,528 5,539,539
2014 648,339 791,892 2,185,037 3,625,268 Source: ATF and United States International Trade Commission.
Statistics prior to 1992 are for fiscal years; 1992 is a transition year with five quarters.
6
7
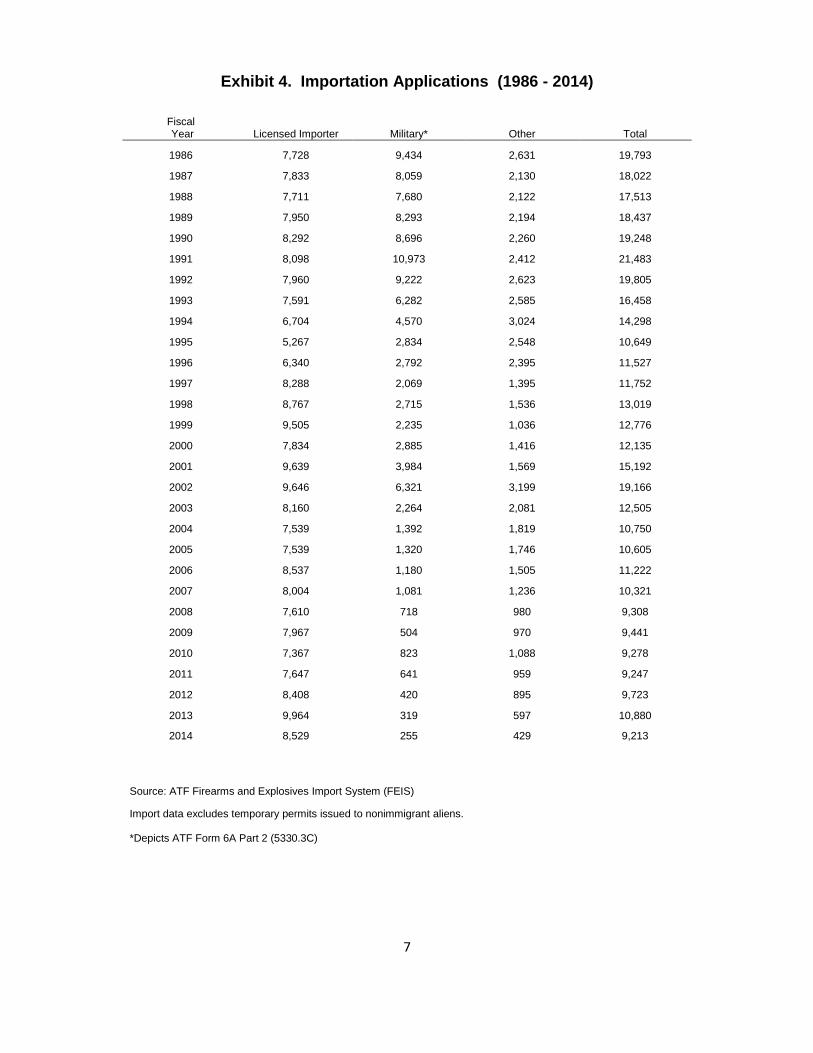
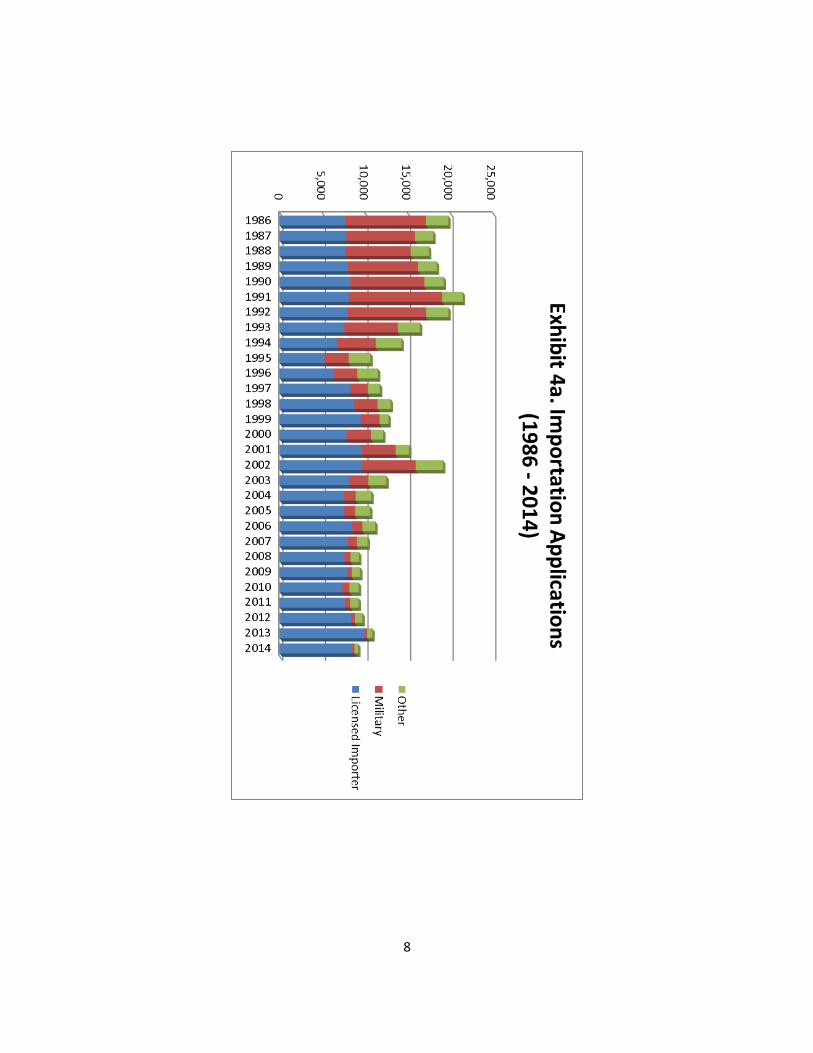
Exhibit 4. Importation Applications (1986 - 2014)
Fiscal Year Licensed Importer Military* Other Total
1986 7,728 9,434 2,631 19,793
1987 7,833 8,059 2,130 18,022
1988 7,711 7,680 2,122 17,513
1989 7,950 8,293 2,194 18,437
1990 8,292 8,696 2,260 19,248
1991 8,098 10,973 2,412 21,483
1992 7,960 9,222 2,623 19,805
1993 7,591 6,282 2,585 16,458
1994 6,704 4,570 3,024 14,298
1995 5,267 2,834 2,548 10,649
1996 6,340 2,792 2,395 11,527
1997 8,288 2,069 1,395 11,752
1998 8,767 2,715 1,536 13,019
1999 9,505 2,235 1,036 12,776
2000 7,834 2,885 1,416 12,135
2001 9,639 3,984 1,569 15,192
2002 9,646 6,321 3,199 19,166
2003 8,160 2,264 2,081 12,505
2004 7,539 1,392 1,819 10,750
2005 7,539 1,320 1,746 10,605
2006 8,537 1,180 1,505 11,222
2007 8,004 1,081 1,236 10,321
2008 7,610 718 980 9,308
2009 7,967 504 970 9,441
2010 7,367 823 1,088 9,278
2011 7,647 641 959 9,247
2012 8,408 420 895 9,723
2013 9,964 319 597 10,880
2014 8,529 255 429 9,213
Source: ATF Firearms and Explosives Import System (FEIS)
Import data excludes temporary permits issued to nonimmigrant aliens. *Depicts ATF Form 6A Part 2 (5330.3C)
8
9
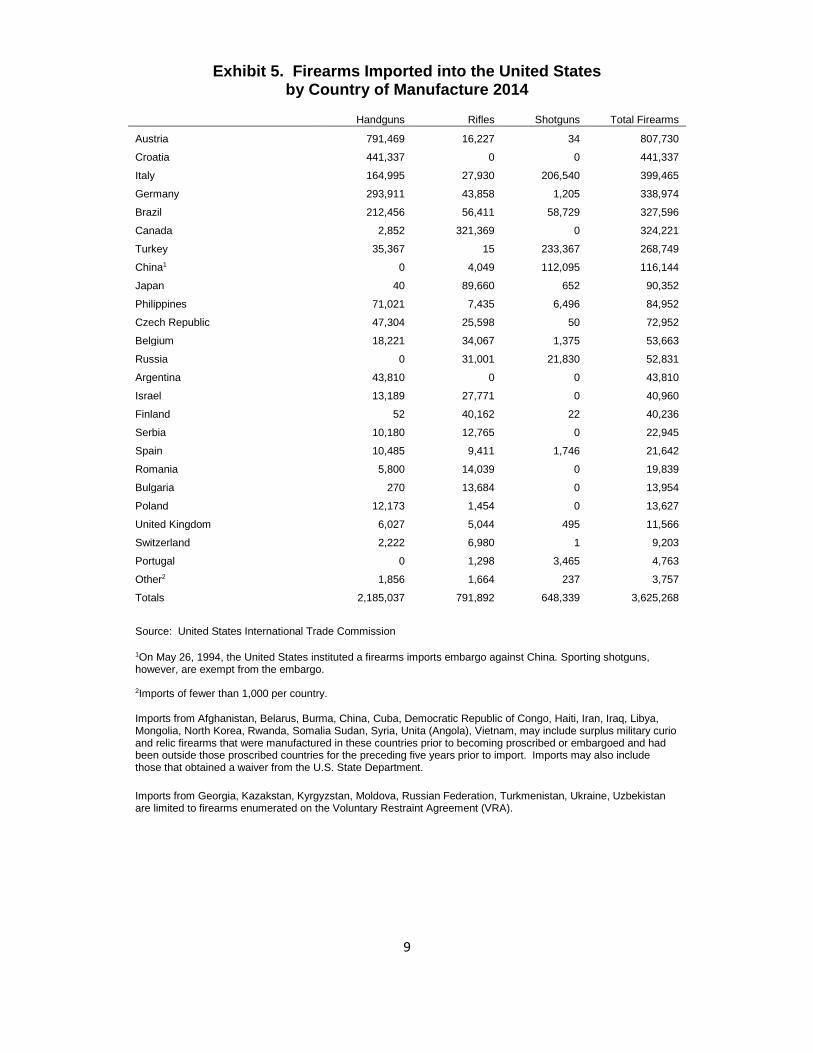
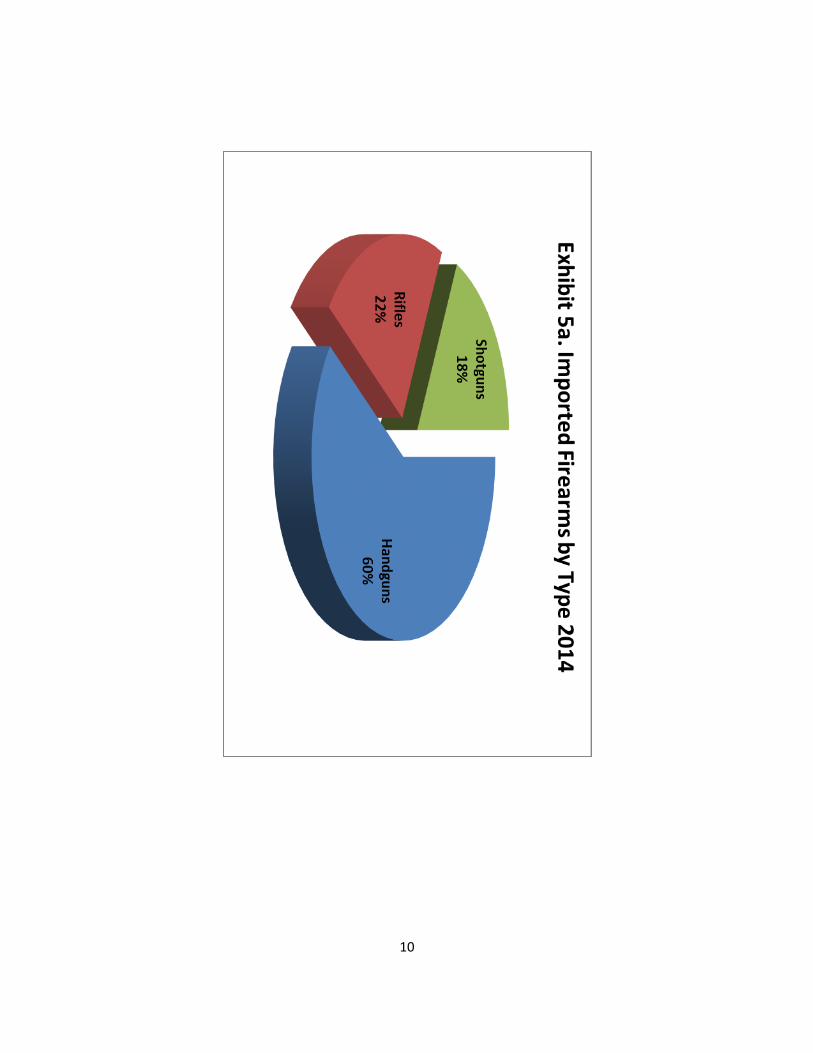
Exhibit 5. Firearms Imported into the United States by Country of Manufacture 2014
Handguns Rifles Shotguns Total Firearms
Austria 791,469 16,227 34 807,730
Croatia 441,337 0 0 441,337
Italy 164,995 27,930 206,540 399,465
Germany 293,911 43,858 1,205 338,974
Brazil 212,456 56,411 58,729 327,596
Canada 2,852 321,369 0 324,221
Turkey 35,367 15 233,367 268,749
China1 0 4,049 112,095 116,144
Japan 40 89,660 652 90,352
Philippines 71,021 7,435 6,496 84,952
Czech Republic 47,304 25,598 50 72,952
Belgium 18,221 34,067 1,375 53,663
Russia 0 31,001 21,830 52,831
Argentina 43,810 0 0 43,810
Israel 13,189 27,771 0 40,960
Finland 52 40,162 22 40,236
Serbia 10,180 12,765 0 22,945
Spain 10,485 9,411 1,746 21,642
Romania 5,800 14,039 0 19,839
Bulgaria 270 13,684 0 13,954
Poland 12,173 1,454 0 13,627
United Kingdom 6,027 5,044 495 11,566
Switzerland 2,222 6,980 1 9,203
Portugal 0 1,298 3,465 4,763
Other2 1,856 1,664 237 3,757
Totals 2,185,037 791,892 648,339 3,625,268
Source: United States International Trade Commission
1On May 26, 1994, the United States instituted a firearms imports embargo against China. Sporting shotguns, however, are exempt from the embargo.
2Imports of fewer than 1,000 per country.
Imports from Afghanistan, Belarus, Burma, China, Cuba, Democratic Republic of Congo, Haiti, Iran, Iraq, Libya, Mongolia, North Korea, Rwanda, Somalia Sudan, Syria, Unita (Angola), Vietnam, may include surplus military curio and relic firearms that were manufactured in these countries prior to becoming proscribed or embargoed and had been outside those proscribed countries for the preceding five years prior to import. Imports may also include those that obtained a waiver from the U.S. State Department.
Imports from Georgia, Kazakstan, Kyrgyzstan, Moldova, Russian Federation, Turkmenistan, Ukraine, Uzbekistan are limited to firearms enumerated on the Voluntary Restraint Agreement (VRA).
10
11
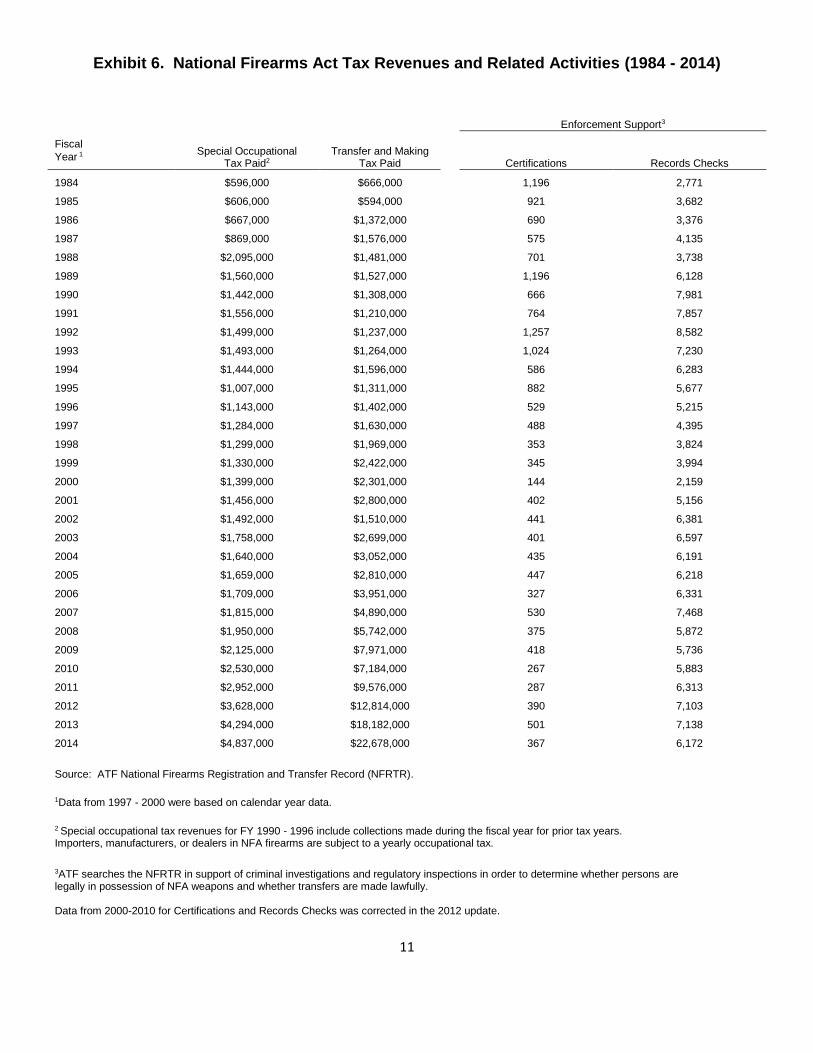
Exhibit 6. National Firearms Act Tax Revenues and Related Activities (1984 - 2014)
Enforcement Support3
Fiscal Special Occupational
Tax Paid2 Transfer and Making
Tax Paid
Certifications Records Checks Year 1
1984 $596,000 $666,000
1,196 2,771
1985 $606,000 $594,000
921 3,682
1986 $667,000 $1,372,000
690 3,376
1987 $869,000 $1,576,000
575 4,135
1988 $2,095,000 $1,481,000
701 3,738
1989 $1,560,000 $1,527,000
1,196 6,128
1990 $1,442,000 $1,308,000
666 7,981
1991 $1,556,000 $1,210,000
764 7,857
1992 $1,499,000 $1,237,000
1,257 8,582
1993 $1,493,000 $1,264,000
1,024 7,230
1994 $1,444,000 $1,596,000
586 6,283
1995 $1,007,000 $1,311,000
882 5,677
1996 $1,143,000 $1,402,000
529 5,215
1997 $1,284,000 $1,630,000
488 4,395
1998 $1,299,000 $1,969,000
353 3,824
1999 $1,330,000 $2,422,000
345 3,994
2000 $1,399,000 $2,301,000
144 2,159
2001 $1,456,000 $2,800,000
402 5,156
2002 $1,492,000 $1,510,000
441 6,381
2003 $1,758,000 $2,699,000
401 6,597
2004 $1,640,000 $3,052,000
435 6,191
2005 $1,659,000 $2,810,000
447 6,218
2006 $1,709,000 $3,951,000
327 6,331
2007 $1,815,000 $4,890,000 530 7,468
2008 $1,950,000 $5,742,000
375 5,872
2009 $2,125,000 $7,971,000
418 5,736
2010 $2,530,000 $7,184,000
267 5,883
2011 $2,952,000 $9,576,000
287 6,313
2012 $3,628,000 $12,814,000
390 7,103
2013 $4,294,000 $18,182,000
501 7,138
2014 $4,837,000 $22,678,000 367 6,172
Source: ATF National Firearms Registration and Transfer Record (NFRTR).
1Data from 1997 - 2000 were based on calendar year data.
2 Special occupational tax revenues for FY 1990 - 1996 include collections made during the fiscal year for prior tax years. Importers, manufacturers, or dealers in NFA firearms are subject to a yearly occupational tax.
3ATF searches the NFRTR in support of criminal investigations and regulatory inspections in order to determine whether persons are legally in possession of NFA weapons and whether transfers are made lawfully. Data from 2000-2010 for Certifications and Records Checks was corrected in the 2012 update.
12
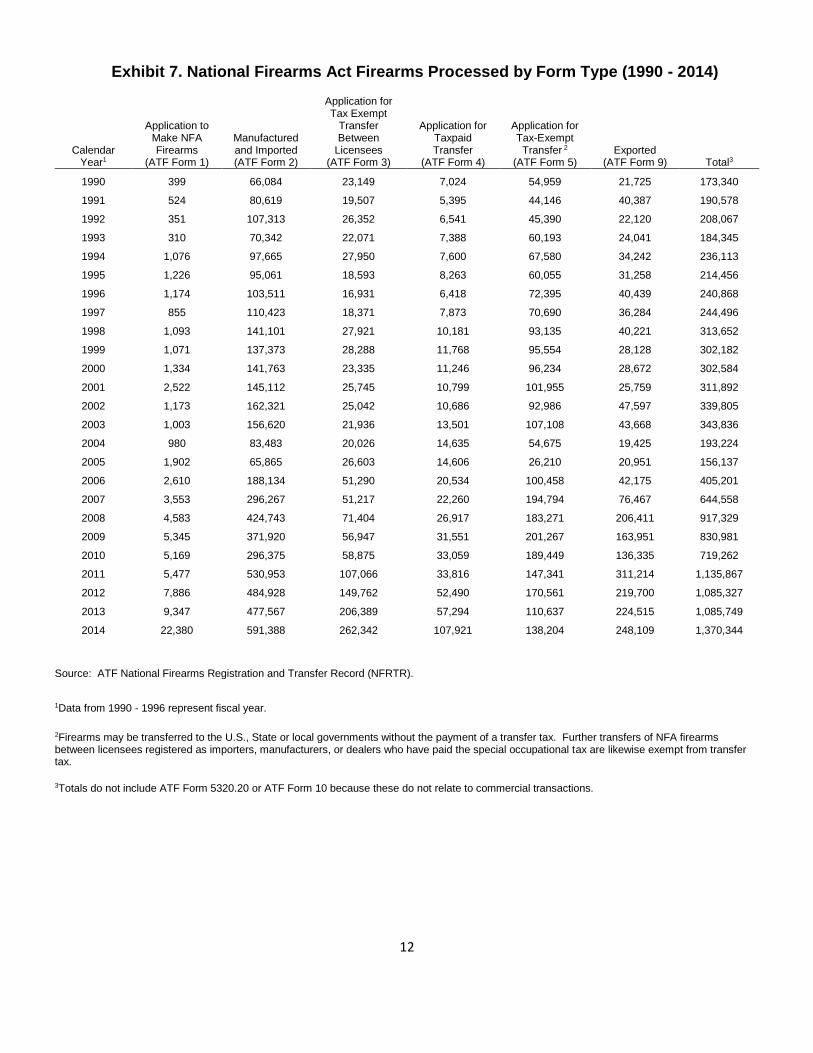
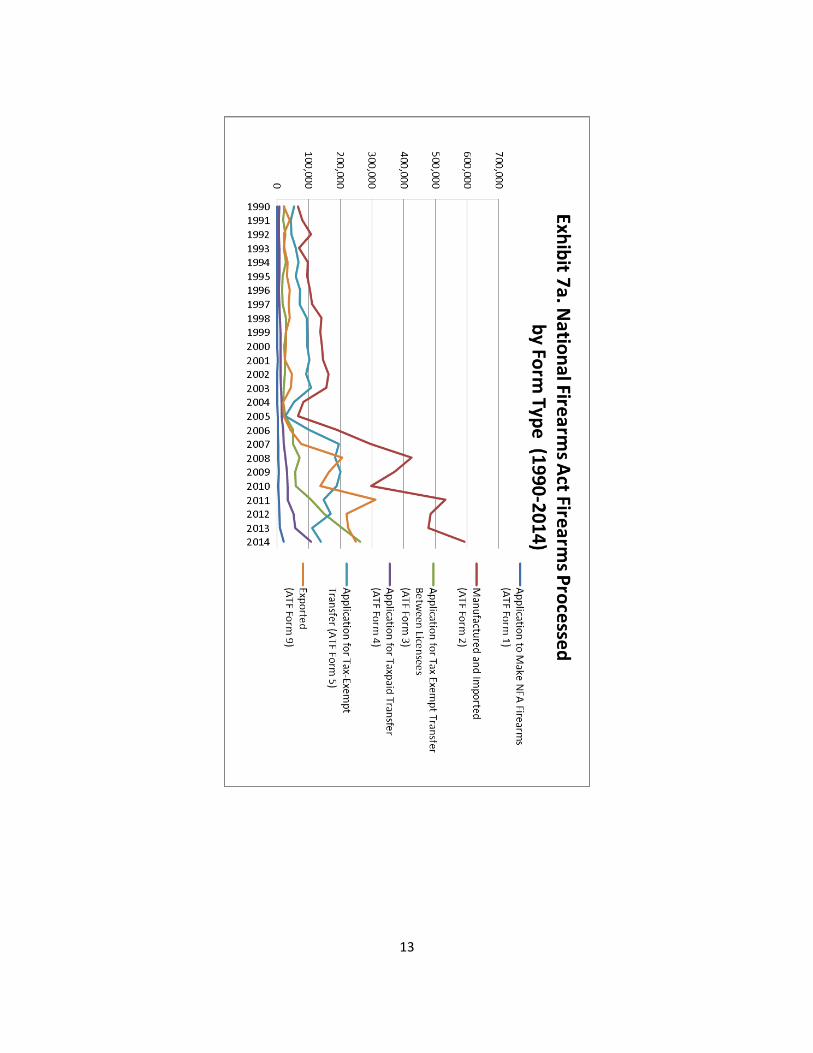
Exhibit 7. National Firearms Act Firearms Processed by Form Type (1990 - 2014)
Calendar Year1
Application to Make NFA Firearms
(ATF Form 1)
Manufactured and Imported (ATF Form 2)
Application for Tax Exempt
Transfer Between
Licensees (ATF Form 3)
Application for Taxpaid Transfer
(ATF Form 4)
Application for Tax-Exempt
Transfer 2 (ATF Form 5)
Exported (ATF Form 9) Total3
1990 399 66,084 23,149 7,024 54,959 21,725 173,340
1991 524 80,619 19,507 5,395 44,146 40,387 190,578
1992 351 107,313 26,352 6,541 45,390 22,120 208,067
1993 310 70,342 22,071 7,388 60,193 24,041 184,345
1994 1,076 97,665 27,950 7,600 67,580 34,242 236,113
1995 1,226 95,061 18,593 8,263 60,055 31,258 214,456
1996 1,174 103,511 16,931 6,418 72,395 40,439 240,868
1997 855 110,423 18,371 7,873 70,690 36,284 244,496
1998 1,093 141,101 27,921 10,181 93,135 40,221 313,652
1999 1,071 137,373 28,288 11,768 95,554 28,128 302,182
2000 1,334 141,763 23,335 11,246 96,234 28,672 302,584
2001 2,522 145,112 25,745 10,799 101,955 25,759 311,892
2002 1,173 162,321 25,042 10,686 92,986 47,597 339,805
2003 1,003 156,620 21,936 13,501 107,108 43,668 343,836
2004 980 83,483 20,026 14,635 54,675 19,425 193,224
2005 1,902 65,865 26,603 14,606 26,210 20,951 156,137
2006 2,610 188,134 51,290 20,534 100,458 42,175 405,201
2007 3,553 296,267 51,217 22,260 194,794 76,467 644,558
2008 4,583 424,743 71,404 26,917 183,271 206,411 917,329
2009 5,345 371,920 56,947 31,551 201,267 163,951 830,981
2010 5,169 296,375 58,875 33,059 189,449 136,335 719,262
2011 5,477 530,953 107,066 33,816 147,341 311,214 1,135,867
2012 7,886 484,928 149,762 52,490 170,561 219,700 1,085,327
2013 9,347 477,567 206,389 57,294 110,637 224,515 1,085,749
2014 22,380 591,388 262,342 107,921 138,204 248,109 1,370,344
Source: ATF National Firearms Registration and Transfer Record (NFRTR).
1Data from 1990 - 1996 represent fiscal year.
2Firearms may be transferred to the U.S., State or local governments without the payment of a transfer tax. Further transfers of NFA firearms between licensees registered as importers, manufacturers, or dealers who have paid the special occupational tax are likewise exempt from transfer tax.
3Totals do not include ATF Form 5320.20 or ATF Form 10 because these do not relate to commercial transactions.
13
14
15
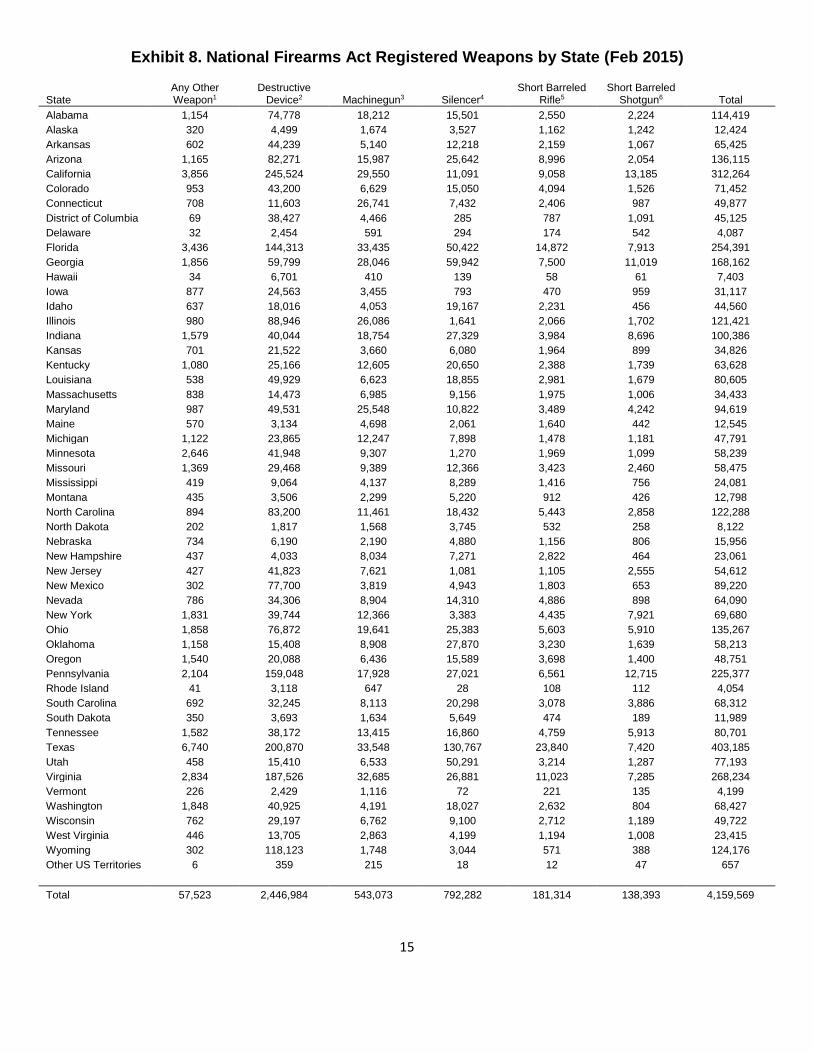
Exhibit 8. National Firearms Act Registered Weapons by State (Feb 2015)
Machinegun3 Silencer4
State Any Other Weapon1
Destructive Device2
Short Barreled Rifle5
Short Barreled Shotgun6 Total
Alabama 1,154 74,778 18,212 15,501 2,550 2,224 114,419
Alaska 320 4,499 1,674 3,527 1,162 1,242 12,424
Arkansas 602 44,239 5,140 12,218 2,159 1,067 65,425
Arizona 1,165 82,271 15,987 25,642 8,996 2,054 136,115
California 3,856 245,524 29,550 11,091 9,058 13,185 312,264
Colorado 953 43,200 6,629 15,050 4,094 1,526 71,452
Connecticut 708 11,603 26,741 7,432 2,406 987 49,877
District of Columbia 69 38,427 4,466 285 787 1,091 45,125
Delaware 32 2,454 591 294 174 542 4,087
Florida 3,436 144,313 33,435 50,422 14,872 7,913 254,391
Georgia 1,856 59,799 28,046 59,942 7,500 11,019 168,162
Hawaii 34 6,701 410 139 58 61 7,403
Iowa 877 24,563 3,455 793 470 959 31,117
Idaho 637 18,016 4,053 19,167 2,231 456 44,560
Illinois 980 88,946 26,086 1,641 2,066 1,702 121,421
Indiana 1,579 40,044 18,754 27,329 3,984 8,696 100,386
Kansas 701 21,522 3,660 6,080 1,964 899 34,826
Kentucky 1,080 25,166 12,605 20,650 2,388 1,739 63,628
Louisiana 538 49,929 6,623 18,855 2,981 1,679 80,605
Massachusetts 838 14,473 6,985 9,156 1,975 1,006 34,433
Maryland 987 49,531 25,548 10,822 3,489 4,242 94,619
Maine 570 3,134 4,698 2,061 1,640 442 12,545
Michigan 1,122 23,865 12,247 7,898 1,478 1,181 47,791
Minnesota 2,646 41,948 9,307 1,270 1,969 1,099 58,239
Missouri 1,369 29,468 9,389 12,366 3,423 2,460 58,475
Mississippi 419 9,064 4,137 8,289 1,416 756 24,081
Montana 435 3,506 2,299 5,220 912 426 12,798
North Carolina 894 83,200 11,461 18,432 5,443 2,858 122,288
North Dakota 202 1,817 1,568 3,745 532 258 8,122
Nebraska 734 6,190 2,190 4,880 1,156 806 15,956
New Hampshire 437 4,033 8,034 7,271 2,822 464 23,061
New Jersey 427 41,823 7,621 1,081 1,105 2,555 54,612
New Mexico 302 77,700 3,819 4,943 1,803 653 89,220
Nevada 786 34,306 8,904 14,310 4,886 898 64,090
New York 1,831 39,744 12,366 3,383 4,435 7,921 69,680
Ohio 1,858 76,872 19,641 25,383 5,603 5,910 135,267
Oklahoma 1,158 15,408 8,908 27,870 3,230 1,639 58,213
Oregon 1,540 20,088 6,436 15,589 3,698 1,400 48,751
Pennsylvania 2,104 159,048 17,928 27,021 6,561 12,715 225,377
Rhode Island 41 3,118 647 28 108 112 4,054
South Carolina 692 32,245 8,113 20,298 3,078 3,886 68,312
South Dakota 350 3,693 1,634 5,649 474 189 11,989
Tennessee 1,582 38,172 13,415 16,860 4,759 5,913 80,701
Texas 6,740 200,870 33,548 130,767 23,840 7,420 403,185
Utah 458 15,410 6,533 50,291 3,214 1,287 77,193
Virginia 2,834 187,526 32,685 26,881 11,023 7,285 268,234
Vermont 226 2,429 1,116 72 221 135 4,199
Washington 1,848 40,925 4,191 18,027 2,632 804 68,427
Wisconsin 762 29,197 6,762 9,100 2,712 1,189 49,722
West Virginia 446 13,705 2,863 4,199 1,194 1,008 23,415
Wyoming 302 118,123 1,748 3,044 571 388 124,176
Other US Territories 6 359 215 18 12 47 657
Total 57,523 2,446,984 543,073 792,282 181,314 138,393 4,159,569
16
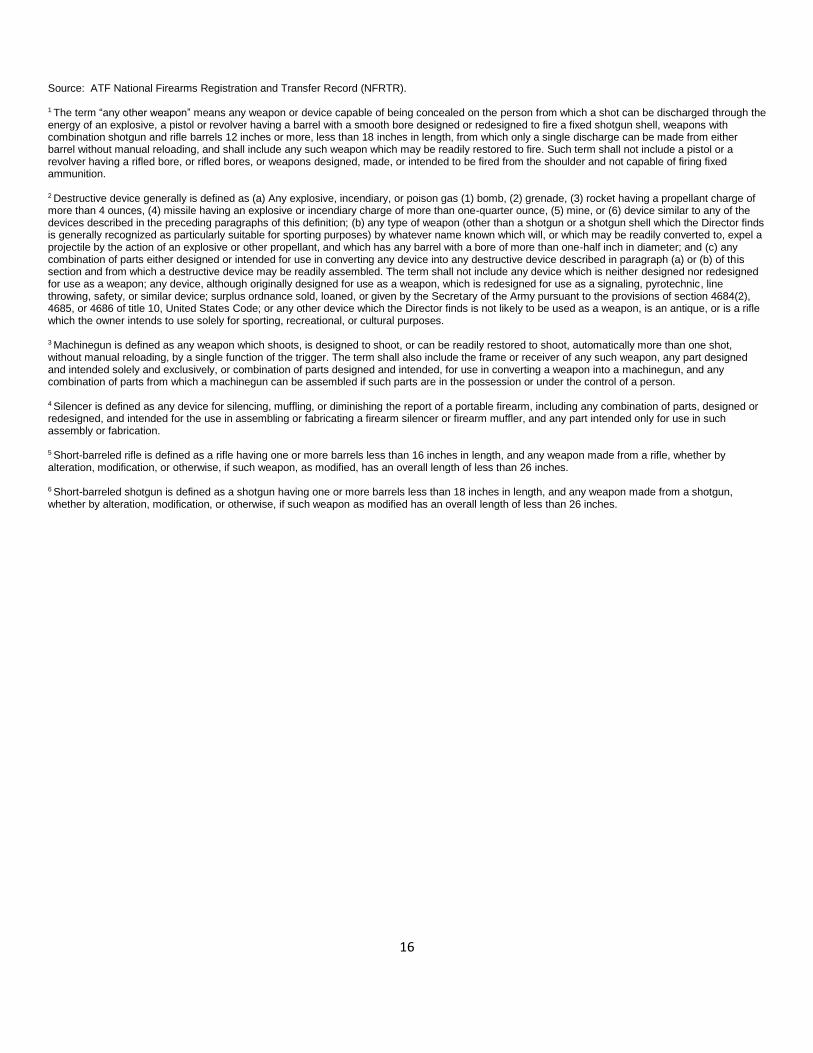
Source: ATF National Firearms Registration and Transfer Record (NFRTR). 1 The term “any other weapon” means any weapon or device capable of being concealed on the person from which a shot can be discharged through the energy of an explosive, a pistol or revolver having a barrel with a smooth bore designed or redesigned to fire a fixed shotgun shell, weapons with combination shotgun and rifle barrels 12 inches or more, less than 18 inches in length, from which only a single discharge can be made from either barrel without manual reloading, and shall include any such weapon which may be readily restored to fire. Such term shall not include a pistol or a revolver having a rifled bore, or rifled bores, or weapons designed, made, or intended to be fired from the shoulder and not capable of firing fixed ammunition. 2 Destructive device generally is defined as (a) Any explosive, incendiary, or poison gas (1) bomb, (2) grenade, (3) rocket having a propellant charge of more than 4 ounces, (4) missile having an explosive or incendiary charge of more than one-quarter ounce, (5) mine, or (6) device similar to any of the devices described in the preceding paragraphs of this definition; (b) any type of weapon (other than a shotgun or a shotgun shell which the Director finds is generally recognized as particularly suitable for sporting purposes) by whatever name known which will, or which may be readily converted to, expel a projectile by the action of an explosive or other propellant, and which has any barrel with a bore of more than one-half inch in diameter; and (c) any combination of parts either designed or intended for use in converting any device into any destructive device described in paragraph (a) or (b) of this section and from which a destructive device may be readily assembled. The term shall not include any device which is neither designed nor redesigned for use as a weapon; any device, although originally designed for use as a weapon, which is redesigned for use as a signaling, pyrotechnic, line throwing, safety, or similar device; surplus ordnance sold, loaned, or given by the Secretary of the Army pursuant to the provisions of section 4684(2), 4685, or 4686 of title 10, United States Code; or any other device which the Director finds is not likely to be used as a weapon, is an antique, or is a rifle which the owner intends to use solely for sporting, recreational, or cultural purposes. 3 Machinegun is defined as any weapon which shoots, is designed to shoot, or can be readily restored to shoot, automatically more than one shot, without manual reloading, by a single function of the trigger. The term shall also include the frame or receiver of any such weapon, any part designed and intended solely and exclusively, or combination of parts designed and intended, for use in converting a weapon into a machinegun, and any combination of parts from which a machinegun can be assembled if such parts are in the possession or under the control of a person. 4 Silencer is defined as any device for silencing, muffling, or diminishing the report of a portable firearm, including any combination of parts, designed or redesigned, and intended for the use in assembling or fabricating a firearm silencer or firearm muffler, and any part intended only for use in such assembly or fabrication. 5 Short-barreled rifle is defined as a rifle having one or more barrels less than 16 inches in length, and any weapon made from a rifle, whether by alteration, modification, or otherwise, if such weapon, as modified, has an overall length of less than 26 inches. 6 Short-barreled shotgun is defined as a shotgun having one or more barrels less than 18 inches in length, and any weapon made from a shotgun, whether by alteration, modification, or otherwise, if such weapon as modified has an overall length of less than 26 inches.
17
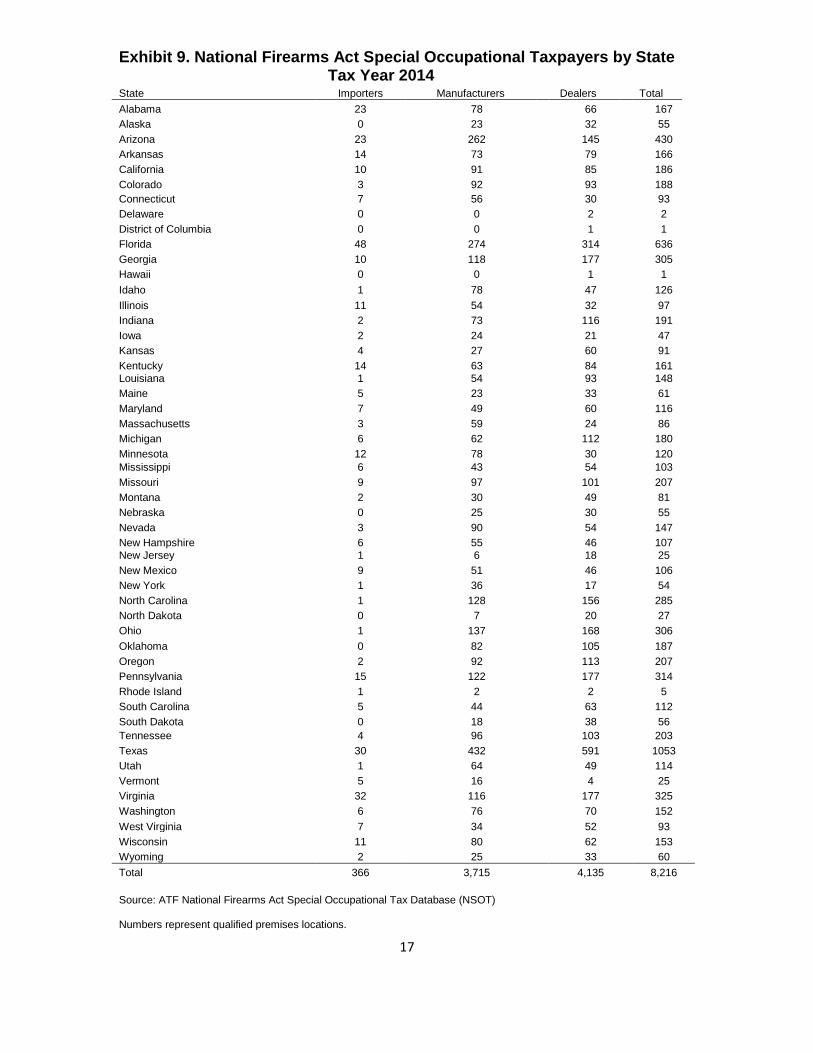
Exhibit 9. National Firearms Act Special Occupational Taxpayers by State Tax Year 2014
State Importers Manufacturers Dealers Total
Alabama 23 78 66 167
Alaska 0 23 32 55
Arizona 23 262 145 430
Arkansas 14 73 79 166
California 10 91 85 186
Colorado 3 92 93 188
Connecticut 7 56 30 93
Delaware 0 0 2 2
District of Columbia 0 0 1 1
Florida 48 274 314 636
Georgia 10 118 177 305
Hawaii 0 0 1 1
Idaho 1 78 47 126
Illinois 11 54 32 97
Indiana 2 73 116 191
Iowa 2 24 21 47
Kansas 4 27 60 91
Kentucky 14 63 84 161
Louisiana 1 54 93 148
Maine 5 23 33 61
Maryland 7 49 60 116
Massachusetts 3 59 24 86
Michigan 6 62 112 180
Minnesota 12 78 30 120
Mississippi 6 43 54 103
Missouri 9 97 101 207
Montana 2 30 49 81
Nebraska 0 25 30 55
Nevada 3 90 54 147
New Hampshire 6 55 46 107
New Jersey 1 6 18 25
New Mexico 9 51 46 106
New York 1 36 17 54
North Carolina 1 128 156 285
North Dakota 0 7 20 27
Ohio 1 137 168 306
Oklahoma 0 82 105 187
Oregon 2 92 113 207
Pennsylvania 15 122 177 314
Rhode Island 1 2 2 5
South Carolina 5 44 63 112
South Dakota 0 18 38 56
Tennessee 4 96 103 203
Texas 30 432 591 1053
Utah 1 64 49 114
Vermont 5 16 4 25
Virginia 32 116 177 325
Washington 6 76 70 152
West Virginia 7 34 52 93
Wisconsin 11 80 62 153
Wyoming 2 25 33 60
Total 366 3,715 4,135 8,216
Source: ATF National Firearms Act Special Occupational Tax Database (NSOT) Numbers represent qualified premises locations.
18
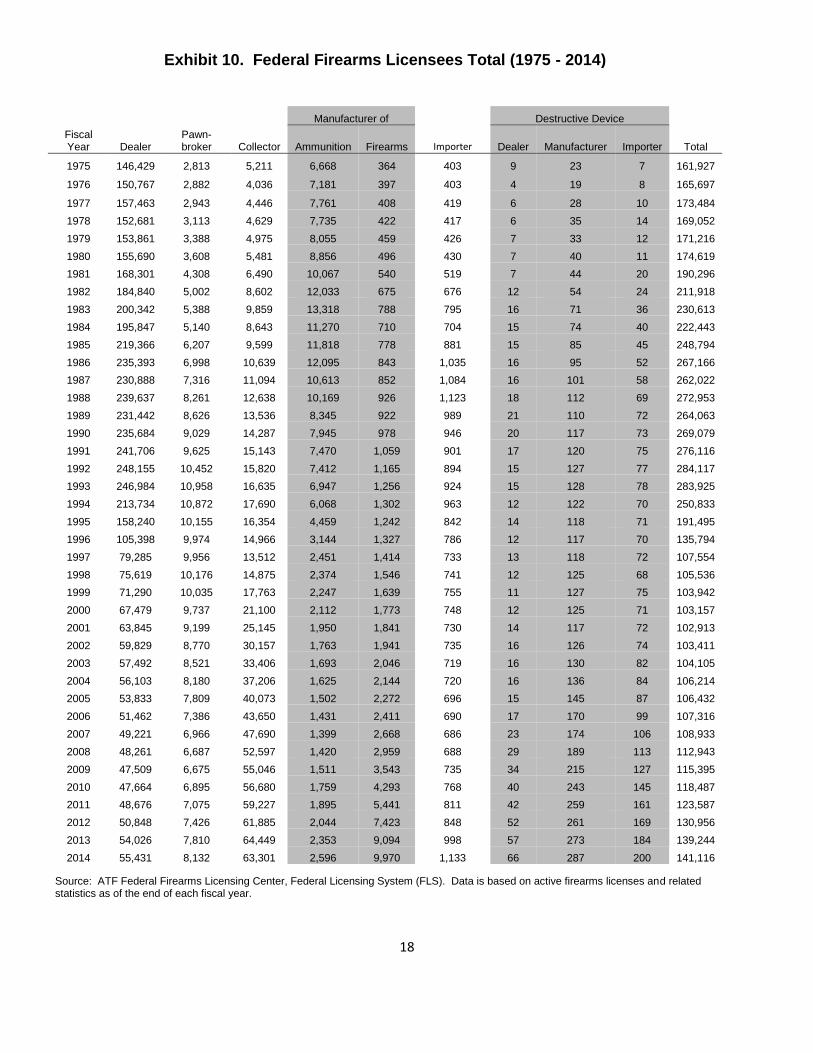
Exhibit 10. Federal Firearms Licensees Total (1975 - 2014)
Manufacturer of
Destructive Device
Fiscal Year Dealer
Pawn- broker Collector Ammunition Firearms Importer Dealer Manufacturer Importer Total
1975 146,429 2,813 5,211 6,668 364 403 9 23 7 161,927
1976 150,767 2,882 4,036 7,181 397 403 4 19 8 165,697
1977 157,463 2,943 4,446 7,761 408 419 6 28 10 173,484
1978 152,681 3,113 4,629 7,735 422 417 6 35 14 169,052
1979 153,861 3,388 4,975 8,055 459 426 7 33 12 171,216
1980 155,690 3,608 5,481 8,856 496 430 7 40 11 174,619
1981 168,301 4,308 6,490 10,067 540 519 7 44 20 190,296
1982 184,840 5,002 8,602 12,033 675 676 12 54 24 211,918
1983 200,342 5,388 9,859 13,318 788 795 16 71 36 230,613
1984 195,847 5,140 8,643 11,270 710 704 15 74 40 222,443
1985 219,366 6,207 9,599 11,818 778 881 15 85 45 248,794
1986 235,393 6,998 10,639 12,095 843 1,035 16 95 52 267,166
1987 230,888 7,316 11,094 10,613 852 1,084 16 101 58 262,022
1988 239,637 8,261 12,638 10,169 926 1,123 18 112 69 272,953
1989 231,442 8,626 13,536 8,345 922 989 21 110 72 264,063
1990 235,684 9,029 14,287 7,945 978 946 20 117 73 269,079
1991 241,706 9,625 15,143 7,470 1,059 901 17 120 75 276,116
1992 248,155 10,452 15,820 7,412 1,165 894 15 127 77 284,117
1993 246,984 10,958 16,635 6,947 1,256 924 15 128 78 283,925
1994 213,734 10,872 17,690 6,068 1,302 963 12 122 70 250,833
1995 158,240 10,155 16,354 4,459 1,242 842 14 118 71 191,495
1996 105,398 9,974 14,966 3,144 1,327 786 12 117 70 135,794
1997 79,285 9,956 13,512 2,451 1,414 733 13 118 72 107,554
1998 75,619 10,176 14,875 2,374 1,546 741 12 125 68 105,536
1999 71,290 10,035 17,763 2,247 1,639 755 11 127 75 103,942
2000 67,479 9,737 21,100 2,112 1,773 748 12 125 71 103,157
2001 63,845 9,199 25,145 1,950 1,841 730 14 117 72 102,913
2002 59,829 8,770 30,157 1,763 1,941 735 16 126 74 103,411
2003 57,492 8,521 33,406 1,693 2,046 719 16 130 82 104,105
2004 56,103 8,180 37,206 1,625 2,144 720 16 136 84 106,214
2005 53,833 7,809 40,073 1,502 2,272 696 15 145 87 106,432
2006 51,462 7,386 43,650 1,431 2,411 690 17 170 99 107,316
2007 49,221 6,966 47,690 1,399 2,668 686 23 174 106 108,933
2008 48,261 6,687 52,597 1,420 2,959 688 29 189 113 112,943
2009 47,509 6,675 55,046 1,511 3,543 735 34 215 127 115,395
2010 47,664 6,895 56,680 1,759 4,293 768 40 243 145 118,487
2011 48,676 7,075 59,227 1,895 5,441 811 42 259 161 123,587
2012 50,848 7,426 61,885 2,044 7,423 848 52 261 169 130,956
2013 54,026 7,810 64,449 2,353 9,094 998 57 273 184 139,244
2014 55,431 8,132 63,301 2,596 9,970 1,133 66 287 200 141,116
Source: ATF Federal Firearms Licensing Center, Federal Licensing System (FLS). Data is based on active firearms licenses and related statistics as of the end of each fiscal year.
19
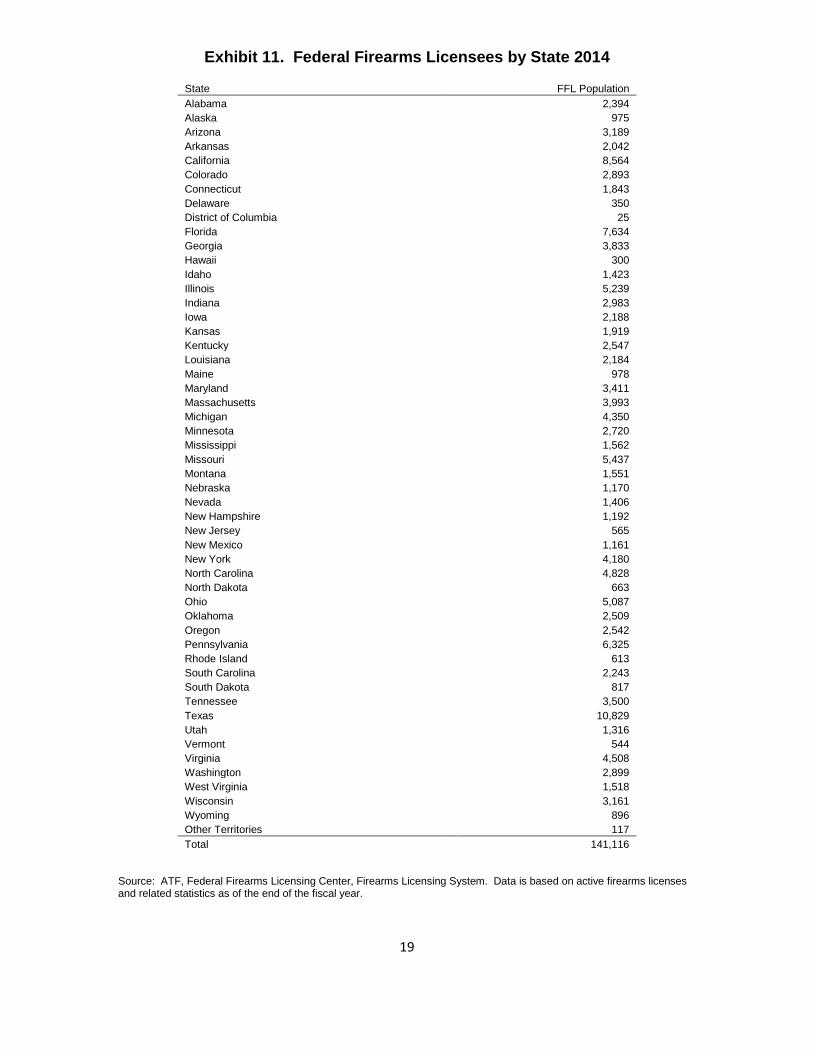
Exhibit 11. Federal Firearms Licensees by State 2014
State FFL Population
Alabama
2,394
Alaska
975
Arizona
3,189
Arkansas
2,042
California
8,564
Colorado
2,893
Connecticut
1,843
Delaware
350
District of Columbia
25
Florida
7,634
Georgia
3,833
Hawaii
300
Idaho
1,423
Illinois
5,239
Indiana
2,983
Iowa
2,188
Kansas
1,919
Kentucky
2,547
Louisiana
2,184
Maine
978
Maryland
3,411
Massachusetts
3,993
Michigan
4,350
Minnesota
2,720
Mississippi
1,562
Missouri
5,437
Montana
1,551
Nebraska
1,170
Nevada
1,406
New Hampshire
1,192
New Jersey
565
New Mexico
1,161
New York
4,180
North Carolina
4,828
North Dakota
663
Ohio
5,087
Oklahoma
2,509
Oregon
2,542
Pennsylvania
6,325
Rhode Island
613
South Carolina
2,243
South Dakota
817
Tennessee
3,500
Texas
10,829
Utah
1,316
Vermont
544
Virginia
4,508
Washington
2,899
West Virginia
1,518
Wisconsin
3,161
Wyoming
896
Other Territories 117
Total
141,116
Source: ATF, Federal Firearms Licensing Center, Firearms Licensing System. Data is based on active firearms licenses and related statistics as of the end of the fiscal year.
20
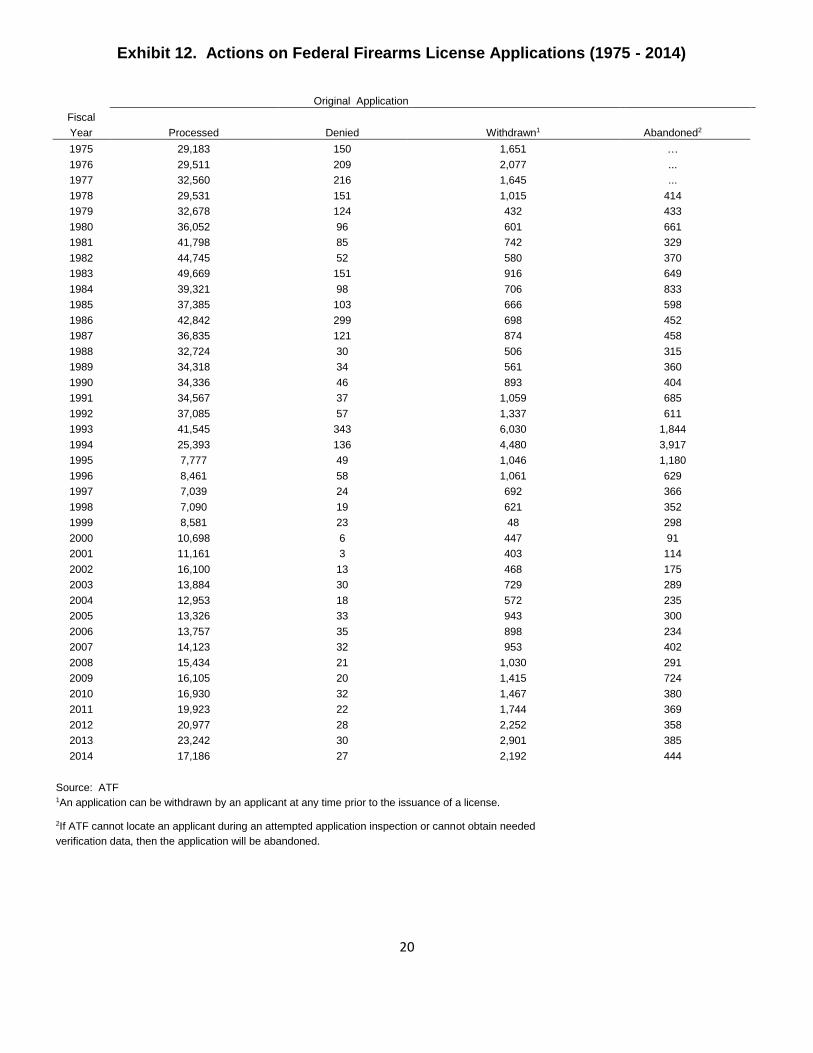
Exhibit 12. Actions on Federal Firearms License Applications (1975 - 2014)
Original Application
Fiscal Year Processed Denied Withdrawn1 Abandoned2
1975 29,183 150 1,651 …
1976 29,511 209 2,077 ...
1977 32,560 216 1,645 ...
1978 29,531 151 1,015 414
1979 32,678 124 432 433
1980 36,052 96 601 661
1981 41,798 85 742 329
1982 44,745 52 580 370
1983 49,669 151 916 649
1984 39,321 98 706 833
1985 37,385 103 666 598
1986 42,842 299 698 452
1987 36,835 121 874 458
1988 32,724 30 506 315
1989 34,318 34 561 360
1990 34,336 46 893 404
1991 34,567 37 1,059 685
1992 37,085 57 1,337 611
1993 41,545 343 6,030 1,844
1994 25,393 136 4,480 3,917
1995 7,777 49 1,046 1,180
1996 8,461 58 1,061 629
1997 7,039 24 692 366
1998 7,090 19 621 352
1999 8,581 23 48 298
2000 10,698 6 447 91
2001 11,161 3 403 114
2002 16,100 13 468 175
2003 13,884 30 729 289
2004 12,953 18 572 235
2005 13,326 33 943 300
2006 13,757 35 898 234
2007 14,123 32 953 402
2008 15,434 21 1,030 291
2009 16,105 20 1,415 724
2010 16,930 32 1,467 380
2011 19,923 22 1,744 369
2012 20,977 28 2,252 358
2013 23,242 30 2,901 385
2014 17,186 27 2,192 444
Source: ATF 1An application can be withdrawn by an applicant at any time prior to the issuance of a license.
2If ATF cannot locate an applicant during an attempted application inspection or cannot obtain needed
verification data, then the application will be abandoned.
21
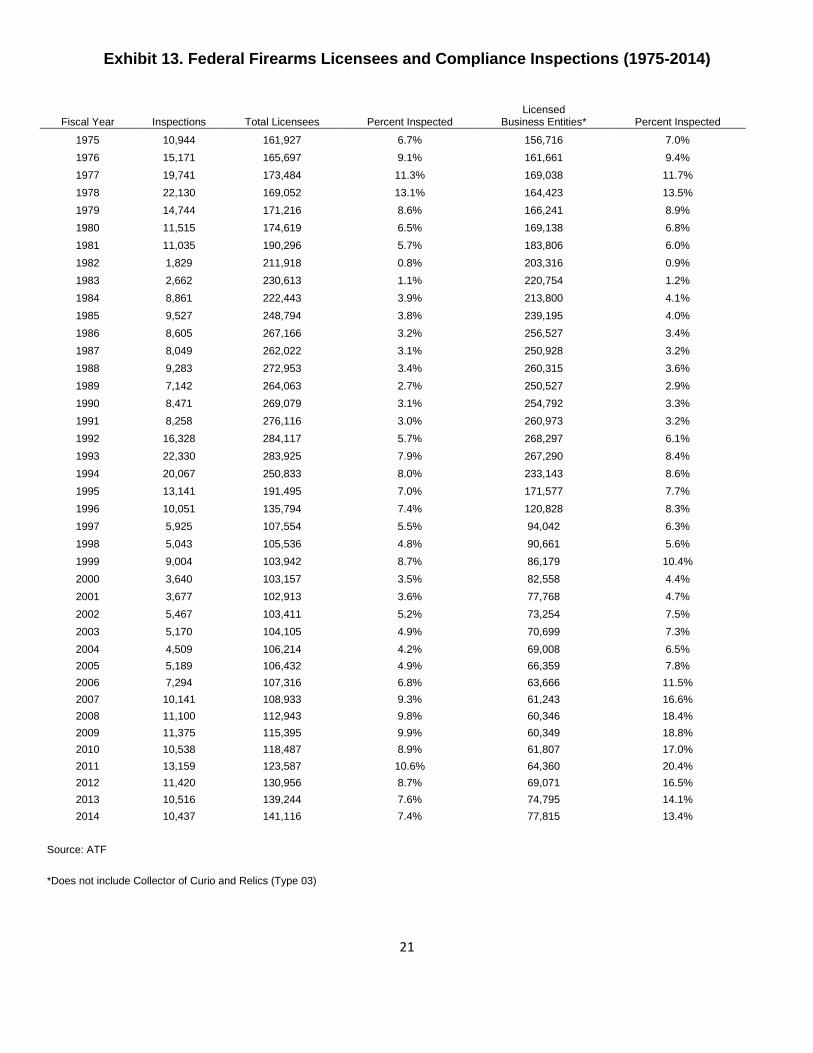
Exhibit 13. Federal Firearms Licensees and Compliance Inspections (1975-2014)
Fiscal Year Inspections Total Licensees Percent Inspected
Licensed Business Entities* Percent Inspected
1975 10,944 161,927 6.7% 156,716 7.0%
1976 15,171 165,697 9.1% 161,661 9.4%
1977 19,741 173,484 11.3% 169,038 11.7%
1978 22,130 169,052 13.1% 164,423 13.5%
1979 14,744 171,216 8.6% 166,241 8.9%
1980 11,515 174,619 6.5% 169,138 6.8%
1981 11,035 190,296 5.7% 183,806 6.0%
1982 1,829 211,918 0.8% 203,316 0.9%
1983 2,662 230,613 1.1% 220,754 1.2%
1984 8,861 222,443 3.9% 213,800 4.1%
1985 9,527 248,794 3.8% 239,195 4.0%
1986 8,605 267,166 3.2% 256,527 3.4%
1987 8,049 262,022 3.1% 250,928 3.2%
1988 9,283 272,953 3.4% 260,315 3.6%
1989 7,142 264,063 2.7% 250,527 2.9%
1990 8,471 269,079 3.1% 254,792 3.3%
1991 8,258 276,116 3.0% 260,973 3.2%
1992 16,328 284,117 5.7% 268,297 6.1%
1993 22,330 283,925 7.9% 267,290 8.4%
1994 20,067 250,833 8.0% 233,143 8.6%
1995 13,141 191,495 7.0% 171,577 7.7%
1996 10,051 135,794 7.4% 120,828 8.3%
1997 5,925 107,554 5.5% 94,042 6.3%
1998 5,043 105,536 4.8% 90,661 5.6%
1999 9,004 103,942 8.7% 86,179 10.4%
2000 3,640 103,157 3.5% 82,558 4.4%
2001 3,677 102,913 3.6% 77,768 4.7%
2002 5,467 103,411 5.2% 73,254 7.5%
2003 5,170 104,105 4.9% 70,699 7.3%
2004 4,509 106,214 4.2% 69,008 6.5%
2005 5,189 106,432 4.9% 66,359 7.8%
2006 7,294 107,316 6.8% 63,666 11.5%
2007 10,141 108,933 9.3% 61,243 16.6%
2008 11,100 112,943 9.8% 60,346 18.4%
2009 11,375 115,395 9.9% 60,349 18.8%
2010 10,538 118,487 8.9% 61,807 17.0%
2011 13,159 123,587 10.6% 64,360 20.4%
2012 11,420 130,956 8.7% 69,071 16.5%
2013 10,516 139,244 7.6% 74,795 14.1%
2014 10,437 141,116 7.4% 77,815 13.4%
Source: ATF
*Does not include Collector of Curio and Relics (Type 03)