Embed Size (px)
Citation preview
793.3742.2
+258.9 +22.8
–5.8 –40.9
–281.9
+254.3
–258.5
523.5605.7
498.4
718.6793.3
589.6
935.5882.4
600
800
1,000
0
200
400
2017201620152013 20142012
742.2685.0
(Forecast)
(Billions of yen)
(FY)
Operating Profit
(Billions of yen)
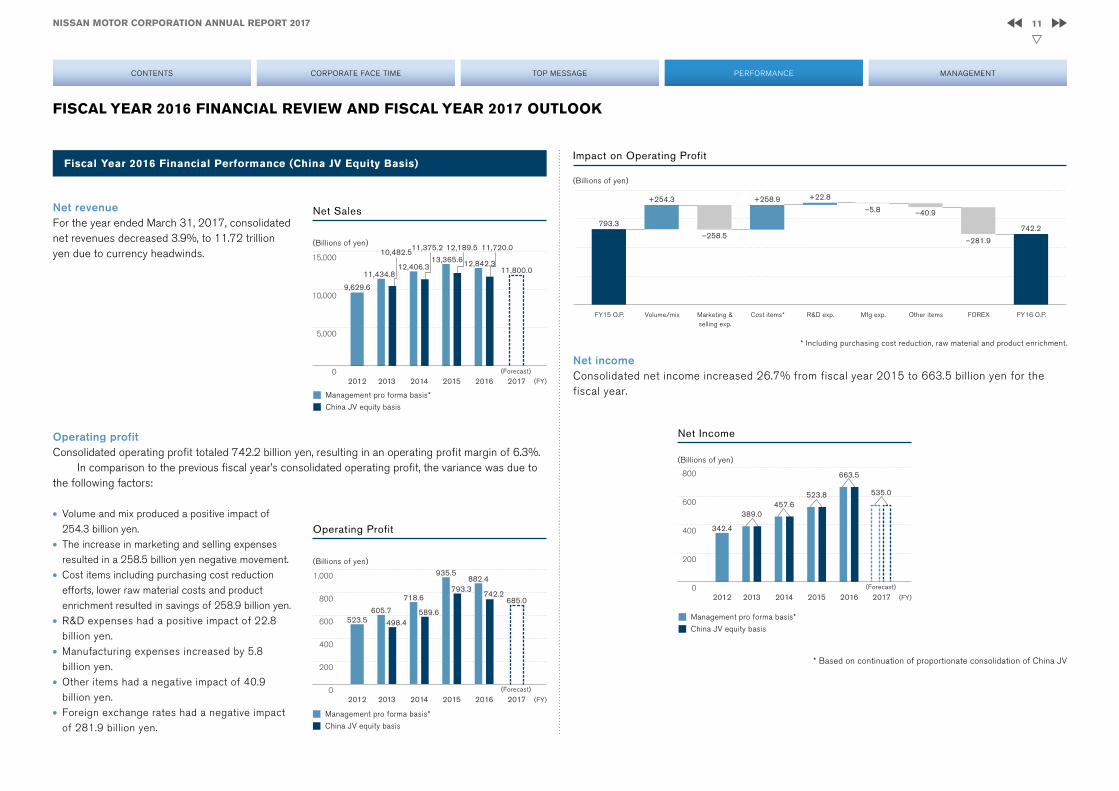
342.4
457.6523.8
663.5800
600
400
200
0
535.0
2017201620152013 20142012
389.0
(Forecast)
(Billions of yen)
(FY)
Net revenueFor the year ended March 31, 2017, consolidated net revenues decreased 3.9%, to 11.72 trillion yen due to currency headwinds.
Operating profitConsolidated operating profit totaled 742.2 billion yen, resulting in an operating profit margin of 6.3%.
In comparison to the previous fiscal year’s consolidated operating profit, the variance was due to the following factors:
l Volume and mix produced a positive impact of 254.3 billion yen.
l The increase in marketing and selling expenses resulted in a 258.5 billion yen negative movement.
l Cost items including purchasing cost reduction efforts, lower raw material costs and product enrichment resulted in savings of 258.9 billion yen.
l R&D expenses had a positive impact of 22.8 billion yen.
l Manufacturing expenses increased by 5.8 billion yen.
l Other items had a negative impact of 40.9 billion yen.
l Foreign exchange rates had a negative impact of 281.9 billion yen.
FISCAL YEAR 2016 FINANCIAL REVIEW AND FISCAL YEAR 2017 OUTLOOK
Net incomeConsolidated net income increased 26.7% from fiscal year 2015 to 663.5 billion yen for the fiscal year.
Fiscal Year 2016 Financial Performance (China JV Equity Basis)Impact on Operating Profit
FY15 O.P. Marketing & selling exp.
* Including purchasing cost reduction, raw material and product enrichment.
R&D exp. Mfg exp.Volume/mix Cost items* Other items FOREX FY16 O.P.
Net Income
Management pro forma basis*
China JV equity basis
Management pro forma basis*
China JV equity basis
Management pro forma basis*
China JV equity basis
2017201620152013 2014
11,800.0 13,365.6
12,189.5
12,842.3
11,720.0 11,375.2
9,629.6
11,434.8
10,482.5
12,406.3
20120
5,000
10,000
15,000
(Forecast)
Net Sales
(Billions of yen)
(FY)
* Based on continuation of proportionate consolidation of China JV
11NISSAN MOTOR CORPORATION ANNUAL REPORT 2017
CONTENTS CORPORATE FACE TIME TOP MESSAGE MANAGEMENTPERFORMANCE
Balance sheetAt March 31, 2017, current assets increased 6.7% to 11.463 trillion yen compared to the end of the prior fiscal year. This was mainly attributable to the increase in sales finance receivables by 687.4 billion yen and cash on hand and in banks by 203.7 billion yen.
Fixed assets increased 5.0% to 6.958 trillion yen compared to the end of the prior fiscal year. This was mainly attributable to the increase in investment securities and machinery, equipment and vehicles, net by 265.0 billion yen and 159.8 billion yen, respectively. As a result, total assets increased 6.0% to 18.421 trillion yen compared to March 31, 2016.
At March 31, 2017, current liabilities increased 4.3% to 7.054 trillion yen compared to the end of the prior fiscal year. This was mainly due to the increase in accrued expenses by 130.6 billion yen.
Long-term liabilities increased 13.4% to 6.199 trillion yen compared to the end of the prior fiscal year. This was mainly due to the increase in bonds and long-term borrowings by 523.2 billion yen and 347.9 billion yen, respectively. As a result, total liabilities increased 8.3% to 13.254 trillion yen compared to March 31, 2016.
At March 31, 2017, net assets increased 0.5% to 5.167 trillion yen compared to the end of the prior fiscal year. This was mainly attributable to the increase in retained earnings by 198.4 billion yen despite the increase in translation adjustments (loss) by 105.5 billion yen.
Free cash flow and net cash (auto business)For fiscal year 2016, automotive free cash flow was a positive 677.1 billion yen. As a result, automotive net cash was 1.635 trillion yen at the end of the period.
Aa3 AA–
A1 A+
A2 A
A3 A–
Baa1 BBB+
Baa2 BBB
Baa3 BBB–
Ba1 BB+
Financial Position (China JV Equity Basis)
Corporate Ratings
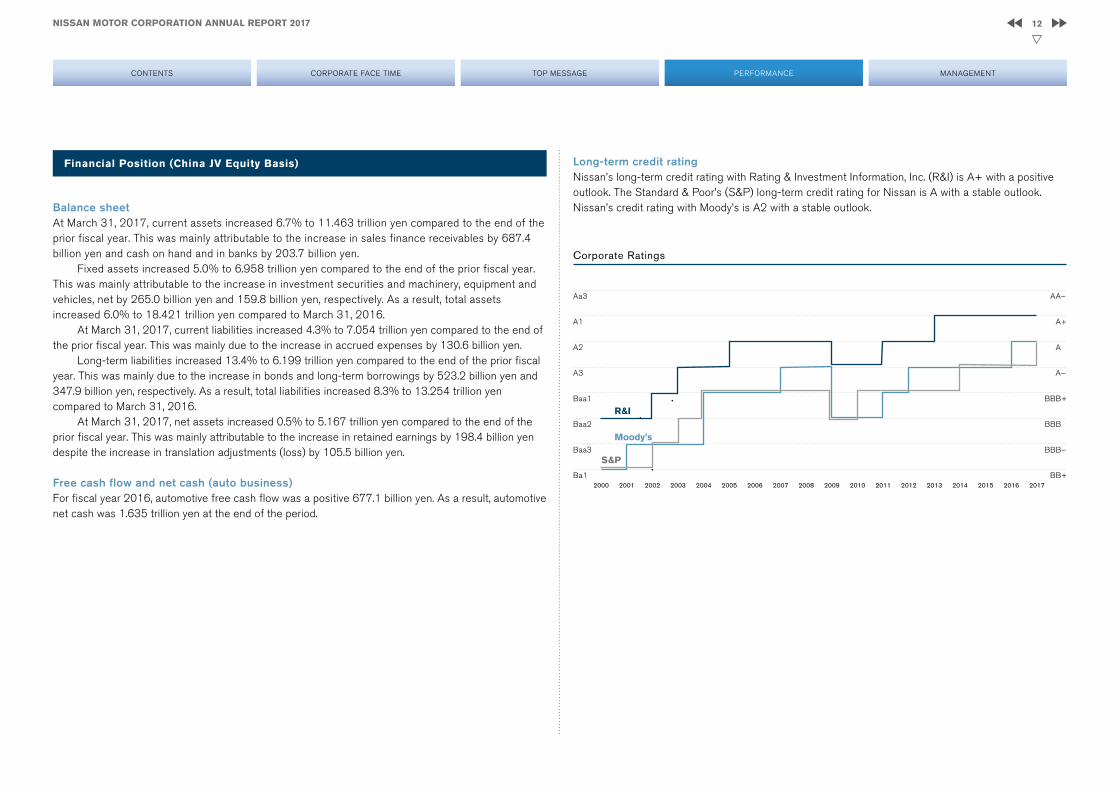
Long-term credit ratingNissan’s long-term credit rating with Rating & Investment Information, Inc. (R&I) is A+ with a positive outlook. The Standard & Poor’s (S&P) long-term credit rating for Nissan is A with a stable outlook. Nissan’s credit rating with Moody’s is A2 with a stable outlook.
2000 2001 2002 2003 2004 2005 2006 2007 2008 2009 2010 2011 2012 2013 2014 2015 2016 2017
R&I
S&P
Moody’s
12NISSAN MOTOR CORPORATION ANNUAL REPORT 2017
CONTENTS CORPORATE FACE TIME TOP MESSAGE MANAGEMENTPERFORMANCE
For fiscal year 2017, Nissan expects its global sales to increase 3.6% from the prior fiscal year to 5.83 million units.
Based on this sales forecast, the Company’s financial forecast, using a foreign exchange rate assumption of 108 yen to the dollar, is as follows:
Nissan’s Fiscal 2017 Outlookn Net sales 11.80 trillion yenn Operating profit 685.0 billion yenn Net income 535.0 billion yen
Fiscal Year 2017 Outlook (China JV Equity Basis)
(Forecast)
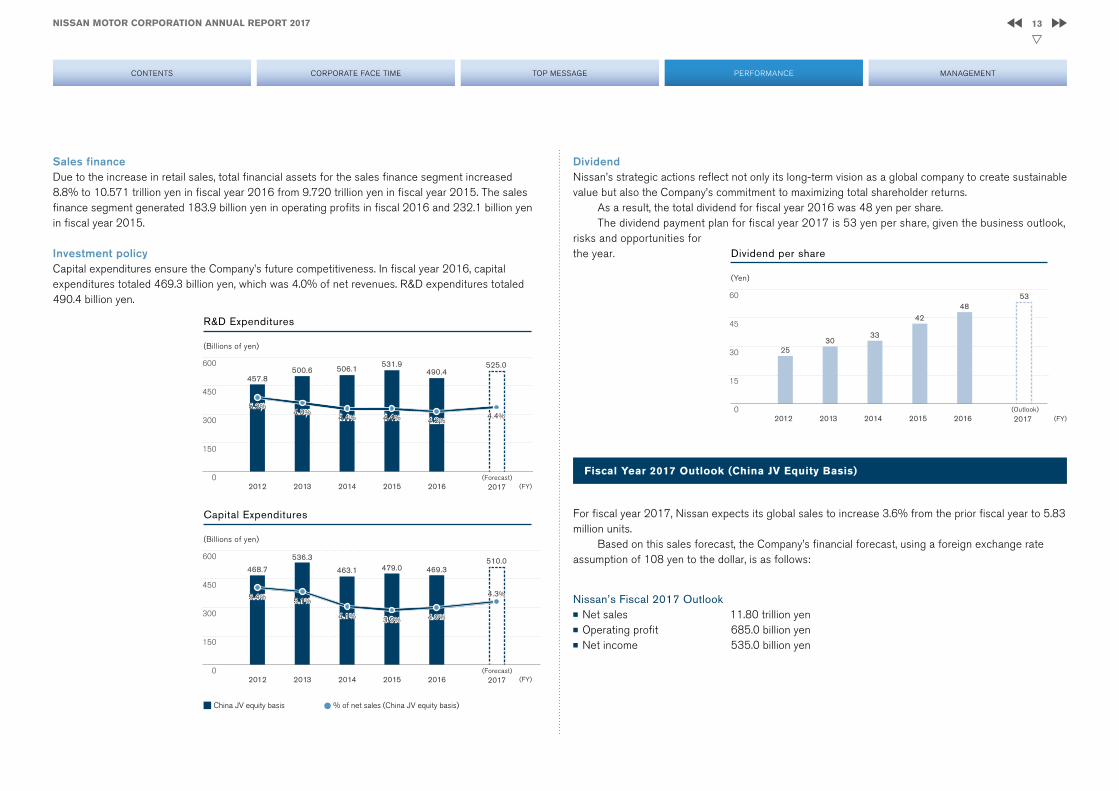
DividendNissan’s strategic actions reflect not only its long-term vision as a global company to create sustainable value but also the Company’s commitment to maximizing total shareholder returns.
As a result, the total dividend for fiscal year 2016 was 48 yen per share.The dividend payment plan for fiscal year 2017 is 53 yen per share, given the business outlook,
risks and opportunities for the year.
Sales financeDue to the increase in retail sales, total financial assets for the sales finance segment increased 8.8% to 10.571 trillion yen in fiscal year 2016 from 9.720 trillion yen in fiscal year 2015. The sales finance segment generated 183.9 billion yen in operating profits in fiscal 2016 and 232.1 billion yen in fiscal year 2015.
Investment policyCapital expenditures ensure the Company’s future competitiveness. In fiscal year 2016, capital expenditures totaled 469.3 billion yen, which was 4.0% of net revenues. R&D expenditures totaled 490.4 billion yen.
(Billions of yen)
Capital Expenditures
(FY)
China JV equity basis % of net sales (China JV equity basis)
(Outlook)(FY)
Dividend per share
(Yen)
60
45
30
15
0
5348
2530
33
42
2012 2017201620152013 2014
(Forecast)
(Billions of yen)
(FY)
R&D Expenditures
600
450
300
150
02012 2017201620152013 2014
490.4525.0
457.8500.6 506.1
531.9
4.2%
5.2%4.8%
4.4% 4.4% 4.7%4.2%4.4%
5.2%4.8%
4.4% 4.4%
600
450
300
150
0
468.7
536.3
463.1 479.0510.0
469.3
2012 2017201620152013 2014
5.4% 5.1%
4.1% 3.9%
4.3%
4.0%
5.4% 5.1%
4.1% 3.9%
4.3%
4.0%
13NISSAN MOTOR CORPORATION ANNUAL REPORT 2017
CONTENTS CORPORATE FACE TIME TOP MESSAGE MANAGEMENTPERFORMANCE