Embed Size (px)
Citation preview

SECOND QUARTER 2017 EARNINGS PRESENTATIONAUGUST 10, 2017

REGARDING FORWARD-LOOKING STATEMENTS
Statements contained in this press release that are not historical facts are forward-looking statements. Forward-looking statements relate to current expectations regarding our future financial condition, performance and results of operations, planned capital expenditures, long-term objectives of management, supply and demand, pricing trends and market forces, and integration plans and expected benefits of transactions and are often identified by the use of words and phrases such as "anticipate," "believe," "continue," "could," "estimate," "expect," "intend," "may," "plan," "predict," "project," "should," "will," "would," "is likely to," "is expected to" or "will continue," or the negative of these terms or other comparable terminology. All forward-looking statements are subject to risks and uncertainties that could cause actual results to differ from those projected. Other factors that may cause actual results to differ from the forward-looking statements contained in this release and that may affect the company's prospects in general include, but are not limited to (a) competitive conditions in the baked foods industry, including promotional and price competition, (b) changes in consumer demand for our products, including changes in consumer behavior, trends and preferences, including health and whole grain trends, and the movement toward more inexpensive store-branded products, (c) the success of productivity improvements and new product introductions, (d) a significant reduction in business with any of our major customers including a reduction from adverse developments in any of our customer's business, (e) fluctuations in commodity pricing, (f) energy and raw material costs and availability and hedging and counterparty risk, (g) our ability to fully integrate recent acquisitions into our business, (h) our ability to achieve cash flow from capital expenditures and acquisitions and the availability of new acquisitions that build shareholder value; (i) our ability to successfully implement our business strategies, including those strategies the company has initiated under Project Centennial, which may involve, among other things, the integration of recent acquisitions or the acquisition or disposition of assets at presently targeted values, the deployment of new systems and technology and an enhanced organizational structure, (j) consolidation within the baking industry and related industries; (k) disruptions in our direct-store delivery system, including litigation or an adverse ruling from a court or regulatory or government body that could affect the independent contractor classification of our independent distributors; (l) increasing legal complexity and legal proceedings that we are or may become subject to; and (m) the failure of our information technology systems to perform adequately, including any interruptions, intrusions or security breaches of such systems. The foregoing list of important factors does not include all such factors, nor necessarily present them in order of importance. In addition, you should consult other public disclosures made by the company, including the risk factors included in our most recently filed Annual Report on Form 10-K and Quarterly Reports on Form 10-Q filed with the Securities and Exchange Commission ("SEC") and disclosures made in other filings with the SEC and company press releases, for other factors that may cause actual results to differ materially from those projected by the company. We caution you not to place undue reliance on forward-looking statements, as they speak only as of the date made and are inherently uncertain. The company undertakes no obligation to publicly revise or update such statements, except as required by law.
2

TODAY’S AGENDA
3
• Review Second Quarter 2017 Business Performance
• Update on Strategic Priorities
• Quarterly Financial Review
• Updated Outlook for Full Year 2017
• Q&A

Q2 2017 BUSINESS PERFORMANCE
4
• Record second quarter market share of 15.4 in packaged bread
• Brand portfolio is outperforming the category
• Improved manufacturing efficiencies
• Early wins on savings initiatives

CATEGORY REVIEW
5
-0.9%
1.1%
2.8%
1.5%
2.6%
-0.1%
0.4%
-0.5%
1.2% 1.1%1.4%
1.0%
0.6%
-0.1%-0.3%
0.8%
-1.0%-0.7%
-2.5%
-0.9%
0.4%0.3%
2.8%
0.3%0.5%
-0.3%
0.6%
-0.7%
0.1%
-1.3% -1.2% -1.2%-1.0%
0.6%
-0.7%
-1.3%
Q 1 2013 Q 2 2013 Q 3 2013 Q 4 2013 Q 1 2014 Q 2 2014 Q 3 2014 Q 4 2014 Q 1 2015 Q 2 2015 Q 3 2015 Q 4 2015 Q 1 2016 Q 2 2016 Q 3 2016 Q 4 2016 Q 1 2017 Q 2 2017
Dollar Sales % Chg Unit Sales % Chg
Source: Flowers Custom Database – IRi Total US Mulo + C Store
FRESH PACKAGED BREADS

CATEGORY REVIEW
6
-9.6%
-6.8%
1.7%
6.0%
12.6%
9.6%
5.9%
4.1%
6.5% 6.7%
3.3% 3.2%
1.0%2.0%
1.0%2.4%
0.1%
-0.4%
-9.0%
-6.7%
0.0%
2.9%
9.4%
7.7%
4.4% 4.0%5.4%
4.8%
1.6% 1.6%
-0.2%
1.3%0.1%
1.1%
-0.6%
-2.8%
Q 1 2013 Q 2 2013 Q 3 2013 Q 4 2013 Q 1 2014 Q 2 2014 Q 3 2014 Q 4 2014 Q 1 2015 Q 2 2015 Q 3 2015 Q 4 2015 Q 1 2016 Q 2 2016 Q 3 2016 Q 4 2016 Q 1 2017 Q 2 2017
Dollar Sales % Chg Unit Sales % Chg
Source: Flowers Custom Database – IRi Total US Mulo + C Store
TOTAL CATEGORY: COMMERCIAL CAKE

FLOWERS’ MARKET SHARE
7
11.0
13.814.5
15.0 15.015.4
7.4
13.0
9.69.1 8.9
8.4
Q 2 2012 Q 2 2013 Q 2 2014 Q 2 2015 Q 2 2016 Q 2 2017
FLO Bread Share FLO Cake Share
Source: Flowers Custom Database – IRi Total US Mulo + C Store

FLOWERS’ CAKE SHARE SEQUENTIAL TREND
8
8.9
8.3 8.38.4 8.4
9.8
9.3 9.39.4
9.6
Q 2 2016 Q 3 2016 Q 4 2016 Q 1 2017 Q 2 2017
FLO Cake $ Share FLO Cake Unit Share
Source: Flowers Custom Database – IRi Total US Mulo + C Store

ORGANICS GENERATING GROWTH
9
$179.8 $220.8
$275.4
$357.6
$423.3
F Y 2013 F Y 2014 F Y 2015 F Y 2016 TTM 2017
35.3 34.6 38.2
43.6 48.5
F Y 2013 F Y 2014 F Y 2015 F Y 2016 TTM 2017
DKB IS DRIVING FLOWERS’ MARKET SHARE GAINS IN THE KEY GROWTH SEGMENT OF THE CATEGORY
Source: IRI Custom Database Total US + Convenience, calendar year ending 1-Jan-2017. 52 weeks ended 23-Jul-2017.
TOTAL ORGANIC FRESH PACKAGED BREADS FLO DOLLAR SHARE OF TOTAL ORGANICS

PROGRESS ON PROJECT CENTENNIAL
10
Generating Fuel for Growth
• Targeting 250bps of net EBITDA margin expansion by 2021• Equates to $100 million of net cost savings on 16FY sales base
• Components of Savings: PG&S, Org Structure, Operations• PG&S initiative on track to deliver annualized savings of at least $45 million by 2018.• Began transition to new org structure, expect to realize related savings in mid-2018• Operations initiatives underway including continuous improvement and supply chain
optimization and realignment; benefits expected second-half of 2018• Closing Winston-Salem cake facility to right-size production capacity and improve
profitability of the warehouse segment’s snack cake production
Progress on Additional Initiatives• Successfully contracted with third-parties to expand distribution in Midwest
• Rationalizing SKUs, expect to implement more streamlined brand assortment by end of 2017

11
PROJECT CENTENNIAL ROADMAP
TARGETING AT LEAST 250BPS OVERALL EBITDA MARGIN IMPROVEMENT BY FY2021
FY 2017-2018 FY 2019 & Beyond
FUND & DESIGNTHE FUTURE
TRANSFORM TO THE FUTURE
Focus• Generate savings• Build future organization
• Invest in growth• Leverage capabilities
Targets• Sales growth: flat to +2%• EBITDA margins: ~12% to 13%
• Sales growth: 3% to 4%• EBITDA margins: ~13% to 14%

Q2 2017 FINANCIAL REVIEW
12
NET SALES $926.6M -0.9%• Divestiture decreased sales by 50bps
• Price/Mix +1.9%; Volume -2.3%
• Lower sales of branded conventional breads, buns and cake, offset by organic bread growth
CASH FLOWS• Cash from Ops = $84.9 million, changes in hedge
margin activity partially offset Centennial costs
• Capex = $14.5 million
• Dividends = $35.7 million
• Net debt payments of $44.2 million
ADJ. EBITDA1 $113.7M• Decreased 5.2%
• 12.3% of sales, down 50bps
• Lower production costs offset by higher distributor fees as a percentage of sales
DILUTED EPS $0.21ADJ. DILUTED EPS2 $0.24
• Lower adj. EBITDA and higher D&A, partially offset by lower tax rate.
(1) Earnings before interest, taxes, depreciation & amortization, adjusted for matters affecting comparability. See non-GAAP reconciliations at the end of this slide presentation.
(2) Adjusted for matters affecting comparability. See non-GAAP reconciliations at the end of this slide presentation.
FY 2017 UPDATED OUTLOOK
13
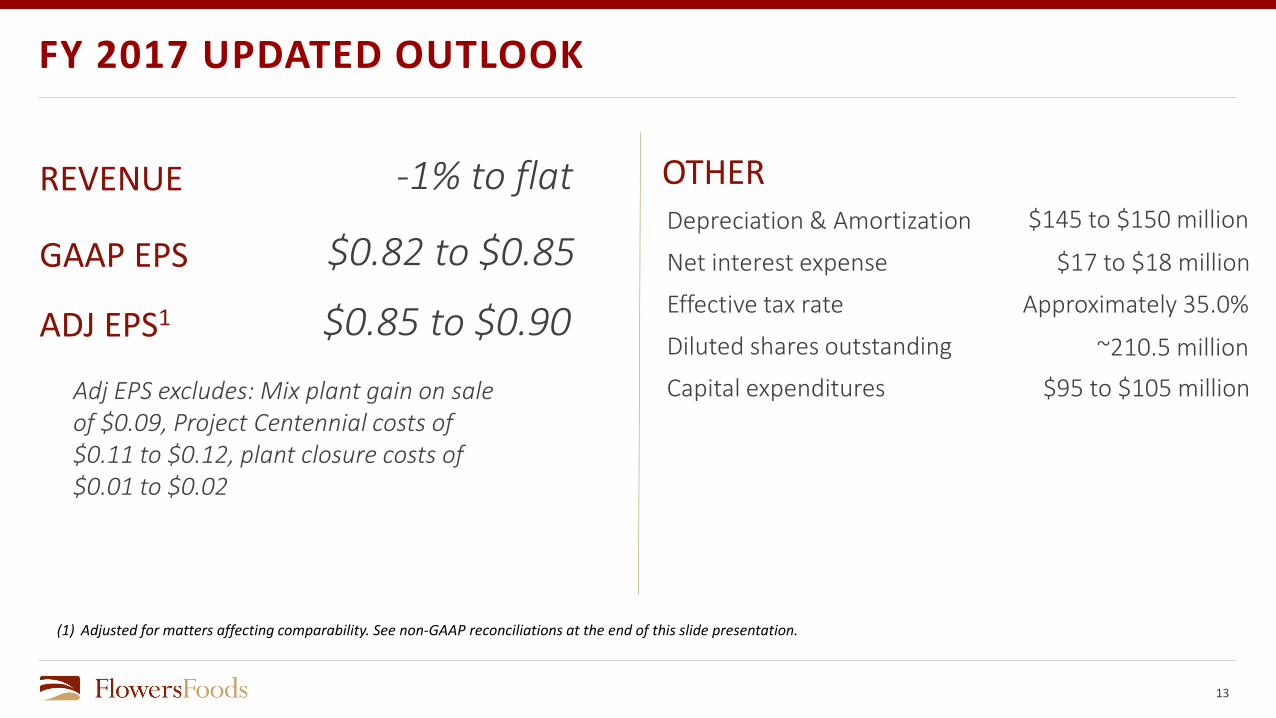
REVENUE OTHER
ADJ EPS1
-1% to flat
$0.85 to $0.90Adj EPS excludes: Mix plant gain on sale of $0.09, Project Centennial costs of $0.11 to $0.12, plant closure costs of $0.01 to $0.02
Depreciation & Amortization $145 to $150 million
Net interest expense $17 to $18 million
Effective tax rate Approximately 35.0%
Diluted shares outstanding ~210.5 million
Capital expenditures $95 to $105 million
GAAP EPS $0.82 to $0.85
(1) Adjusted for matters affecting comparability. See non-GAAP reconciliations at the end of this slide presentation.

KEY TAKEAWAYS
14
• Strong brands and a team committed to transforming the company
• Clear objectives to grow sales, expand margins, and deliver shareholder value
• Executing today on initiatives to reinvigorate the core, obtain fuel for growth, and improve financial performance
• Designing a company and operating model to deliver sustainable long-term value

Q&A
15

REGARDING NON-GAAP FINANCIAL MEASURES
The company prepares its consolidated financial statements in accordance with U.S. Generally Accepted Accounting Principles (GAAP). However, from time to time, thecompany may present in its public statements, press releases and SEC filings, non-GAAP financial measures such as, EBITDA, adjusted EBITDA, EBITDA margin, adjustedEBITDA margin, adjusted net income, adjusted operating income by segment, adjusted EPS, adjusted selling, distribution and administrative expenses (SD&A), grossmargin excluding depreciation and amortization and the ratio of net debt to adjusted EBITDA. The reconciliations attached provide reconciliations of the non-GAAPmeasures used in this presentation or release to the most comparable GAAP financial measure. The company’s definitions of these non-GAAP measures may differ fromsimilarly titled measures used by others. These non-GAAP measures should be considered supplemental to, and not a substitute for, financial information prepared inaccordance with GAAP. The company defines EBITDA as earnings from continuing operations before interest, income taxes, depreciation, amortization and incomeattributable to non-controlling interest. The company believes that EBITDA is a useful tool for managing the operations of its business and is an indicator of the company'sability to incur and service indebtedness and generate free cash flow. EBITDA is used as the primary performance measure in the company's 2014 Omnibus Equity andIncentive Compensation Plan. Furthermore, pursuant to the terms of our credit facility, EBITDA is used to determine the company's compliance with certain financialcovenants. The company also believes that EBITDA measures are commonly reported and widely used by investors and other interested parties as measures of acompany's operating performance and debt servicing ability because EBITDA measures assist in comparing performance on a consistent basis without regard todepreciation or amortization, which can vary significantly depending upon accounting methods and non-operating factors (such as historical cost). EBITDA is also a widely-accepted financial indicator of a company's ability to incur and service indebtedness. EBITDA should not be considered an alternative to (a) income from operations or netincome (loss) as a measure of operating performance; (b) cash flows provided by operating, investing and financing activities (as determined in accordance with GAAP) asa measure of the company's ability to meet its cash needs; or (c) any other indicator of performance or liquidity that has been determined in accordance with GAAP. Thecompany defines adjusted EBITDA, adjusted net income, adjusted operating income by segment, and adjusted net income per diluted share, respectively, excluding theimpact of asset impairment charges, acquisition-related costs, and pension plan settlements. The company believes that these measures, when considered together withits GAAP financial results, provides management and investors with a more complete understanding of its business operating results, including underlying trends, byexcluding the effects of certain charges. Net debt to EBITDA is used as a measure of financial leverage employed by the company. Gross margin excluding depreciation andamortization is used as a performance measure to provide additional transparent information regarding our results of operations on a consolidated and segment basis.Changes in depreciation and amortization are separately discussed and include depreciation and amortization for materials, supplies, labor and other production costsand operating activities. Presentation of gross margin includes depreciation and amortization in the materials, supplies, labor and other production costs according toGAAP. Our method of presenting gross margin excludes the depreciation and amortization components, as discussed above. The reconciliations attached providereconciliations of the non-GAAP measures used in this presentation or release to the most comparable GAAP financial measure.
16

RECONCILIATION OF NON-GAAP FINANCIAL MEASURES
17
For the 12 Week Period Ended
For the 12 Week Period Ended
July 15, 2017 July 16, 2016
Net income per diluted common share 0.21$ 0.24$ Project Centennial consulting costs 0.03 - Pension plan settlement loss - 0.02 Adjusted net income per diluted common share 0.24$ 0.26$
(000's omitted, except per share data)
Reconciliation of Earnings per Share to Adjusted Earnings per Share
Reconciliation of GAAP to Non-GAAP MeasuresFlowers Foods, Inc.
RECONCILIATION OF NON-GAAP FINANCIAL MEASURES
18
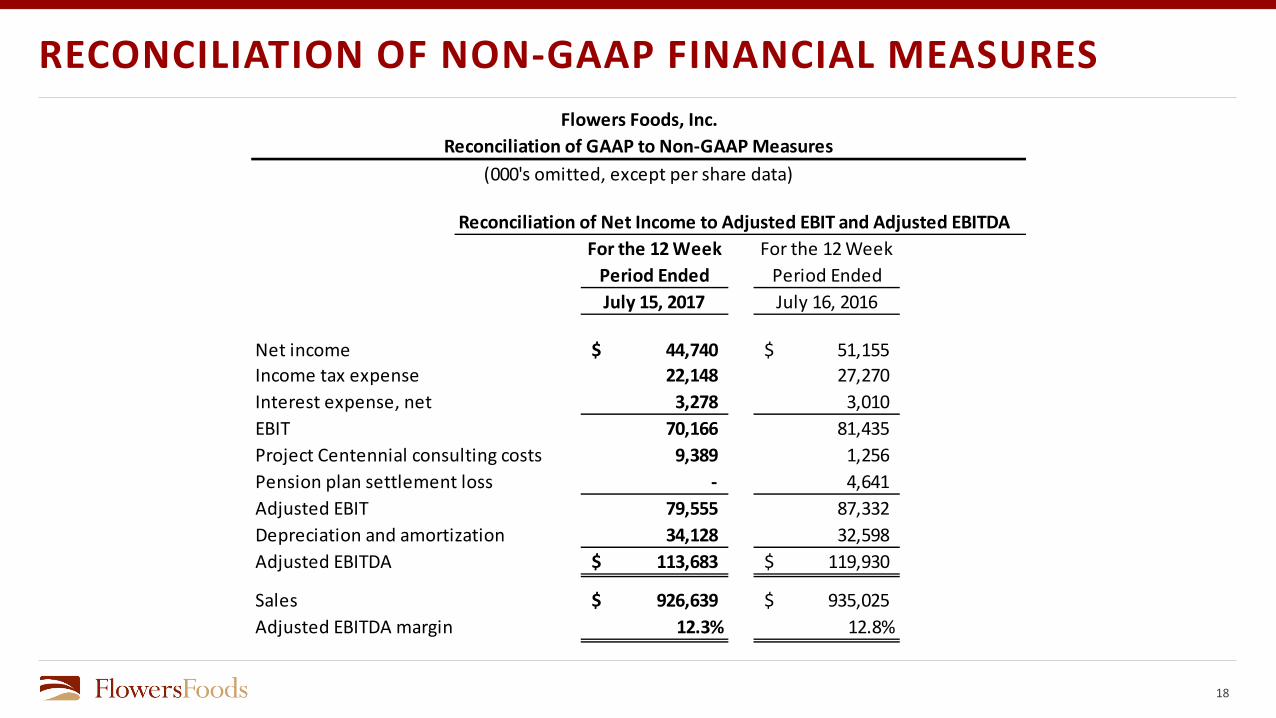
Reconciliation of Net Income to Adjusted EBIT and Adjusted EBITDAFor the 12 Week
Period EndedFor the 12 Week
Period EndedJuly 15, 2017 July 16, 2016
Net income 44,740$ 51,155$ Income tax expense 22,148 27,270 Interest expense, net 3,278 3,010 EBIT 70,166 81,435 Project Centennial consulting costs 9,389 1,256 Pension plan settlement loss - 4,641 Adjusted EBIT 79,555 87,332 Depreciation and amortization 34,128 32,598 Adjusted EBITDA 113,683$ 119,930$
Sales 926,639$ 935,025$ Adjusted EBITDA margin 12.3% 12.8%
Reconciliation of GAAP to Non-GAAP Measures(000's omitted, except per share data)
Flowers Foods, Inc.

RECONCILIATION OF NON-GAAP FINANCIAL MEASURES
19
For the 12 Week Period Ended
For the 12 Week Period Ended
July 15, 2017 July 16, 2016
EBIT 79,564$ 80,135$ Depreciation and amortization 29,355 27,980 EBITDA 108,919$ 108,115$
Sales 792,892$ 785,767$ EBITDA margin 13.7% 13.8%
(000's omitted, except per share data)
Reconciliation of EBIT to EBITDA - DSD
Reconciliation of GAAP to Non-GAAP MeasuresFlowers Foods, Inc.

RECONCILIATION OF NON-GAAP FINANCIAL MEASURES
20
For the 12 Week Period Ended
For the 12 Week Period Ended
July 15, 2017 July 16, 2016
EBIT 11,589$ 15,710$ Depreciation and amortization 4,761 4,599 EBITDA 16,350$ 20,309$
Sales 133,747$ 149,258$ EBITDA margin 12.2% 13.6%
(000's omitted, except per share data)
Reconciliation of EBIT to EBITDA - Warehouse Delivery
Reconciliation of GAAP to Non-GAAP MeasuresFlowers Foods, Inc.
RECONCILIATION OF NON-GAAP FINANCIAL MEASURES
21
For the 12 Week Period Ended
For the 12 Week Period Ended
July 15, 2017 July 16, 2016
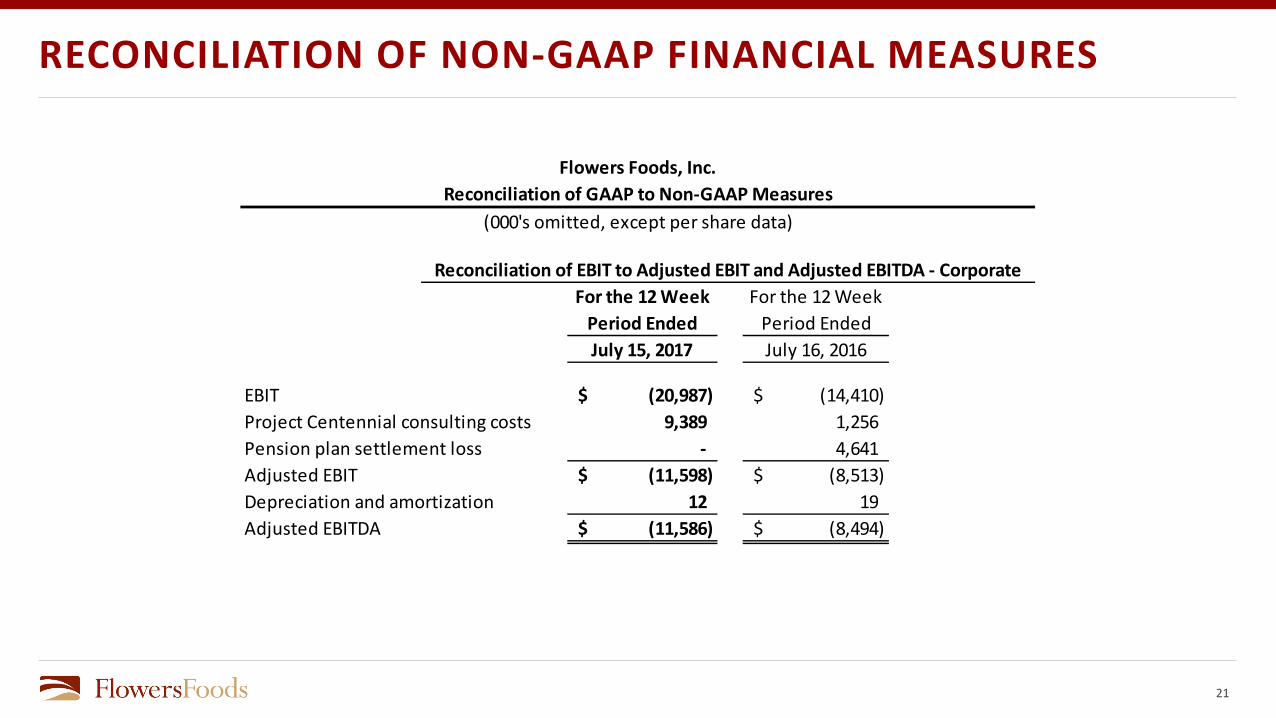
EBIT (20,987)$ (14,410)$ Project Centennial consulting costs 9,389 1,256 Pension plan settlement loss - 4,641 Adjusted EBIT (11,598)$ (8,513)$ Depreciation and amortization 12 19 Adjusted EBITDA (11,586)$ (8,494)$
Reconciliation of GAAP to Non-GAAP Measures(000's omitted, except per share data)
Reconciliation of EBIT to Adjusted EBIT and Adjusted EBITDA - Corporate
Flowers Foods, Inc.

RECONCILIATION OF NON-GAAP FINANCIAL MEASURES
22
For the 12 Week Period Ended
For the 12 Week Period Ended
For the 16 Week Period Ended
For the 12 Week Period Ended
Trailing 52 Week Period Ended
October 8, 2016 December 31, 2016 April 22, 2017 July 15, 2017 July 15, 2017
Net income 40,216$ 13,042$ 60,418$ 44,740$ 158,416$ Income tax expense 21,232 4,244 34,659 22,148 82,283 Interest expense, net 4,683 3,882 5,048 3,278 16,891 Depreciation and amortization 32,530 32,274 47,188 34,128 146,120 EBITDA 98,661 53,442 147,313 104,294 403,710 Gain on divestiture - - (28,875) - (28,875) Project Centennial consulting costs 1,218 3,849 15,406 9,389 29,862 Lease terminations - - (1,279) - (1,279) Asset impairment - 24,877 - - 24,877 Pension plan settlement loss 1,832 173 - - 2,005 Legal settlement 1,250 9,250 250 - 10,750 Adjusted EBITDA 102,961$ 91,591$ 132,815$ 113,683$ 441,050$
Flowers Foods, Inc.Reconciliation of GAAP to Non-GAAP Measures
(000's omitted, except per share data)
Reconciliation of Net Income to Adjusted EBITDA
RECONCILIATION OF NON-GAAP FINANCIAL MEASURES
23
As ofJuly 15, 2017
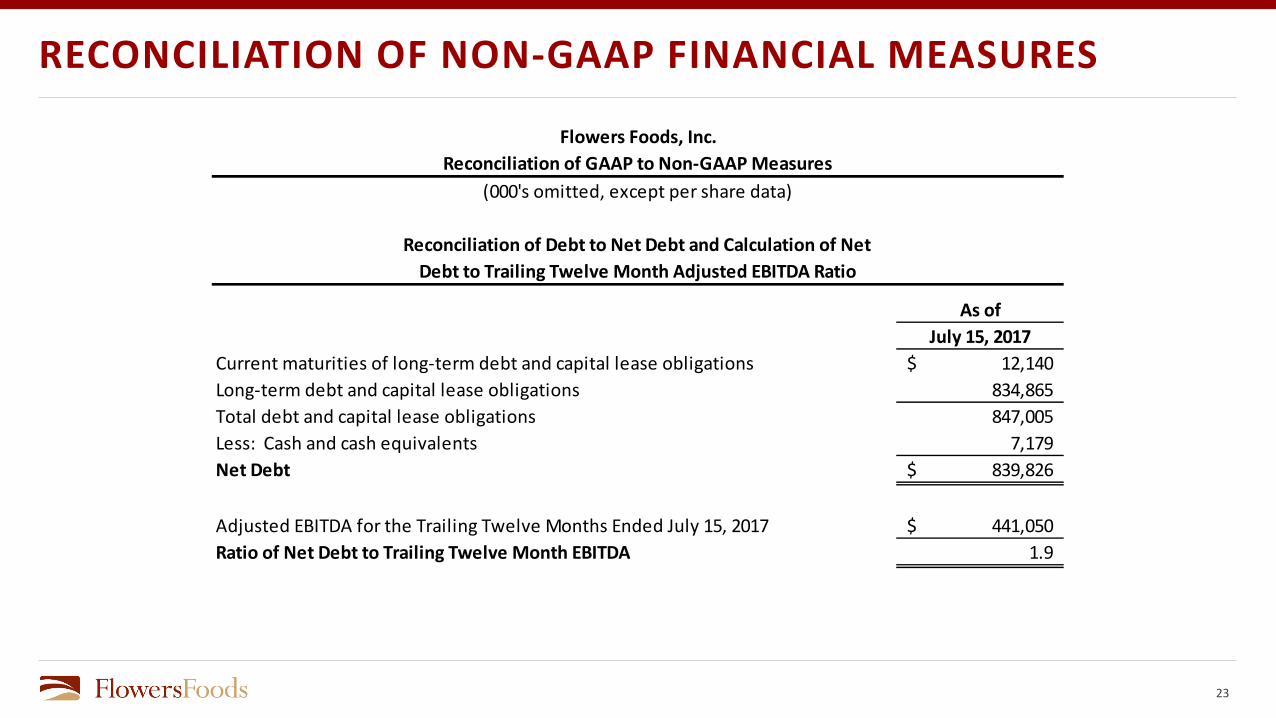
Current maturities of long-term debt and capital lease obligations 12,140$ Long-term debt and capital lease obligations 834,865 Total debt and capital lease obligations 847,005 Less: Cash and cash equivalents 7,179 Net Debt 839,826$
Adjusted EBITDA for the Trailing Twelve Months Ended July 15, 2017 441,050$ Ratio of Net Debt to Trailing Twelve Month EBITDA 1.9
Reconciliation of Debt to Net Debt and Calculation of Net Debt to Trailing Twelve Month Adjusted EBITDA Ratio
Flowers Foods, Inc.Reconciliation of GAAP to Non-GAAP Measures
(000's omitted, except per share data)

RECONCILIATION OF NON-GAAP FINANCIAL MEASURES
24
For the 12 Week Period Ended
For the 12 Week Period Ended
July 15, 2017 July 16, 2016
926,639$ 935,025$
468,152 477,955 Gross Margin excluding depreciation and amortization 458,487 457,070 Less depreciation and amortization for production activities 19,740 19,869 Gross Margin 438,747$ 437,201$
Depreciation and amortization for production activities 19,740$ 19,869$
14,388 12,729Total depreciation and amortization 34,128$ 32,598$
SalesMaterials, supplies, labor and other production costs (exclusive of depreciation and amortization)
Depreciation and amortization for selling, distribution and administrative activities
Flowers Foods, Inc.Reconciliation of GAAP to Non-GAAP Measures
(000's omitted)
Reconciliation of Gross Margin

RECONCILIATION OF NON-GAAP FINANCIAL MEASURES
25
For the 12 Week Period Ended
For the 12 Week Period Ended
July 15, 2017 July 16, 2016
354,193$ 338,396$ Project Centennial consulting costs (9,389) (1,256)
344,804$ 337,140$
Sales 926,639$ 935,025$ Adjusted SD&A as a percent of sales 37.2% 36.1%
Adjusted selling, distribution and administrative expenses
Flowers Foods, Inc.Reconciliation of GAAP to Non-GAAP Measures
(000's omitted)
Reconciliation of Selling, Distribution and Administrative Expenses to Adjusted SD&A
Selling, distribution and administrative expenses

RECONCILIATION OF NON-GAAP FINANCIAL MEASURES
26
Net income per diluted common share 0.82$ to 0.85$ Gain on sale of Specialty Blending (0.09) (0.09) Project Centennial consulting costs 0.11 0.12 Plant closure costs 0.01 0.02 Adjusted net income per diluted common share 0.85$ to 0.90$
Range Estimate
Reconciliation of Earnings per Share - Full Year Fiscal 2017 Guidance

RECONCILIATION OF NON-GAAP FINANCIAL MEASURES
27
For the 12 Week Period Ended
For the 12 Week Period Ended
July 15, 2017 July 16, 2016
66,888$ 78,425$ Project Centennial consulting costs 9,389 1,256 Pension plan settlement loss - 4,641
76,277$ 84,322$
Reconciliation of Income Before Income Taxes to Adjusted EBT
Flowers Foods, Inc.Reconciliation of GAAP to Non-GAAP Measures
(000's omitted)
Income before income taxes
Adjusted income before income taxes

RECONCILIATION OF NON-GAAP FINANCIAL MEASURES
28
For the 12 Week Period Ended
For the 12 Week Period Ended
July 15, 2017 July 16, 2016
22,148$ 27,270$
Project Centennial consulting costs 3,615 484 Pension plan settlement loss - 1,787
25,763$ 29,541$
Tax impact of:
Adjusted income tax expense
Flowers Foods, Inc.Reconciliation of GAAP to Non-GAAP Measures
(000's omitted)
Reconciliation of Income Tax Expense to Adjusted Income Tax Expense
Income tax expense

RECONCILIATION OF NON-GAAP FINANCIAL MEASURES
29
For the 12 Week Period Ended
For the 12 Week Period Ended
July 15, 2017 July 16, 2016
Net income 44,740$ 51,155$ Project Centennial consulting costs 5,774 772 Pension plan settlement loss - 2,854 Adjusted net income 50,514$ 54,781$
Reconciliation of Net Income to Adjusted Net Income
Reconciliation of GAAP to Non-GAAP MeasuresFlowers Foods, Inc.
(000's omitted, except per share data)

RECONCILIATION OF NON-GAAP FINANCIAL MEASURES
30
For the 12 Week Period Ended
For the 12 Week Period Ended
July 15, 2017 July 16, 2016
Adjusted EBITDA 113,683$ 119,930$
1,826 9,119 Changes in assets and liabilities 4,208 (16,320) Income taxes (22,148) (27,270) Interest expense, net (3,278) (3,010) Project Centennial consulting costs (9,389) (1,256) Pension plan settlement loss - (4,641) Cash Flow From Operations 84,902$ 76,552$
Reconciliation of Adjusted EBITDA to Cash Flow from Operations
Adjustments to reconcile net income to net cash provided by operating activities
Reconciliation of GAAP to Non-GAAP MeasuresFlowers Foods, Inc.
(000's omitted, except per share data)