Embed Size (px)
Citation preview
COMMONWEALTH OF VIRGINIA
Hazard Mitigation Plan
Chapter 3 Hazard Identification and Risk Assessment
(HIRA)
Section 3.15 – Flooding Due to Impoundment Failure
Commonwealth of Virginia Hazard Mitigation Plan Chapter 3 – HIRA: Section 3.15, Flooding Due to Impoundment Failure
Virginia Department of Emergency Management Section 3.15 Page i
SECTION 3.15
TABLE OF CONTENTS
Section 3.15: Flooding Due to Impoundment Failure .....................................................................1
Description .................................................................................................................................. 1 Dam Failure ............................................................................................................................ 1 Levee Failure .......................................................................................................................... 3
Historic Occurrence .................................................................................................................... 4 Risk Assessment ......................................................................................................................... 5
Probability ............................................................................................................................... 5 Impact & Vulnerability ........................................................................................................... 5 Risk ......................................................................................................................................... 6
Local Plan Risk Assessment ............................................................................................... 8 Comparison with Local Ranking .................................................................................... 8 Changes in Development ................................................................................................ 8
TABLES AND FIGURES
Table 3.15-1: Dam Classification System in Virginia .................................................................... 3 Table 3.15-2: Performance Standards for Dams ............................................................................. 5 Table 3.15-3: Virginia Department of Conservation and Recreation classification of dams in Virginia ........................................................................................................................................... 9 Table 3.15-4: EMAP Analysis ...................................................................................................... 14 Figure 3.15-1: Virginia Dam Inventory & Hazard Potential .......................................................... 7
Commonwealth of Virginia Hazard Mitigation Plan Chapter 3 – HIRA: Section 3.15, Flooding Due to Impoundment Failure
Virginia Department of Emergency Management Section 3.15 Page 1
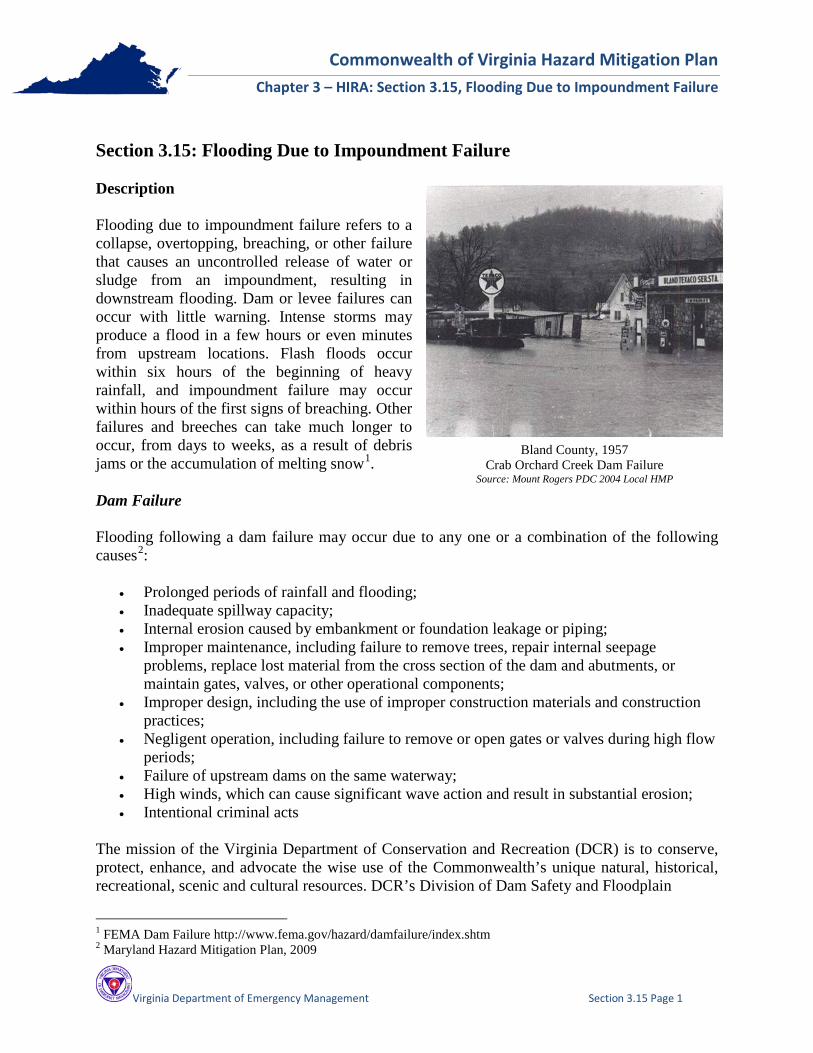
Bland County, 1957 Crab Orchard Creek Dam Failure
Source: Mount Rogers PDC 2004 Local HMP
Section 3.15: Flooding Due to Impoundment Failure Description Flooding due to impoundment failure refers to a collapse, overtopping, breaching, or other failure that causes an uncontrolled release of water or sludge from an impoundment, resulting in downstream flooding. Dam or levee failures can occur with little warning. Intense storms may produce a flood in a few hours or even minutes from upstream locations. Flash floods occur within six hours of the beginning of heavy rainfall, and impoundment failure may occur within hours of the first signs of breaching. Other failures and breeches can take much longer to occur, from days to weeks, as a result of debris jams or the accumulation of melting snow1. Dam Failure Flooding following a dam failure may occur due to any one or a combination of the following causes2:
• Prolonged periods of rainfall and flooding; • Inadequate spillway capacity; • Internal erosion caused by embankment or foundation leakage or piping; • Improper maintenance, including failure to remove trees, repair internal seepage
problems, replace lost material from the cross section of the dam and abutments, or maintain gates, valves, or other operational components;
• Improper design, including the use of improper construction materials and construction practices;
• Negligent operation, including failure to remove or open gates or valves during high flow periods;
• Failure of upstream dams on the same waterway; • High winds, which can cause significant wave action and result in substantial erosion; • Intentional criminal acts
The mission of the Virginia Department of Conservation and Recreation (DCR) is to conserve, protect, enhance, and advocate the wise use of the Commonwealth’s unique natural, historical, recreational, scenic and cultural resources. DCR’s Division of Dam Safety and Floodplain
1 FEMA Dam Failure http://www.fema.gov/hazard/damfailure/index.shtm 2 Maryland Hazard Mitigation Plan, 2009
Commonwealth of Virginia Hazard Mitigation Plan Chapter 3 – HIRA: Section 3.15, Flooding Due to Impoundment Failure
Virginia Department of Emergency Management Section 3.15 Page 2
Management administers the Virginia Dam Safety Program, under the authority of the Virginia Soil and Water Conservation Board. The dam safety division regulates impounding structures in the Commonwealth to ensure that they are “properly and safely constructed, maintained and operated.”3 The regulations promulgated to achieve these ends are recorded in the Virginia Administrative Code.4 Ongoing dam inspections and Virginia’s participation in the National Dam Safety Program maintained by FEMA and the U.S. Army Corps of Engineers serve as a preventative measure against dam failures. Disaster recovery programs include assistance to dam owners and local officials in assessing the condition of dams following a flood disaster and assuring the repairs and reconstruction of damaged structures are compliant with the National Flood Insurance Program (NFIP) regulations. In 2001, Virginia’s legislature broadened the definitions of “impounding structure” to bring more dams under regulatory oversight. On February 1, 2008, the Virginia Soil and Water Conservation Board approved major revisions to the Impounding Structure Regulations in the Virginia Administrative Code, changing the dam hazard potential classification system, modifying spillway requirements, requiring dam break inundation zone modeling, expanding emergency action plan requirements, and making a variety of other regulatory changes. Dams are classified with a hazard potential depending on the downstream losses estimated in event of failure. The recent regulatory revisions bring Virginia’s classification system into alignment with the system already used in the National Inventory of Dams maintained by the U.S. Army Corps of Engineers. Hazard potential is not related to the structural integrity of a dam but strictly to the potential for adverse downstream effects if the dam were to fail. Regulatory requirements, such as the frequency of dam inspection, the standards for spillway design, and the extent of emergency operations plans, are dependent upon the dam classification. Table 3.15-1 provides additional information on these classes and the possible effects on downstream areas if dam failure were to occur.
3 Code of Virginia §10.1-605 4 4 VAC 50-20, also known as the Impounding Structure Regulations

Commonwealth of Virginia Hazard Mitigation Plan Chapter 3 – HIRA: Section 3.15, Flooding Due to Impoundment Failure
Virginia Department of Emergency Management Section 3.15 Page 3
Table 3.15-1: Dam Classification System in Virginia
Hazard Potential Description Inspection
High Failure will cause probable loss of life or serious economic damage (to buildings, facilities, major roadways, etc.)
Annual, with inspection by a professional engineer every 2 years.
Significant Failure may cause loss of human life or appreciable economic damage (to buildings, secondary roadways, etc.)
Annual, with inspection by a professional engineer every 3 years.
Low Failure would result in no expected loss of human life, and cause no more than minimal economic damage
Annual, with inspection by a professional engineer every 6 years.
The owner of each regulated high, significant, or low hazard dam is required to apply to the board for an Operation and Maintenance Certificate. The application must include an assessment of the dam by a licensed professional, an Emergency Action Plan and the appropriate fee(s), submitted under separate cover. An executed copy of the Emergency Action Plan or Emergency Preparedness Plan must be filed with the appropriate local emergency official and the Virginia Department of Emergency Management.5 The Virginia Soil and Water Conservation Board (VSWCB) issues Regular Operation and Maintenance Certificates to the dam owner for a period of six years. If a dam has a deficiency but does not pose imminent danger, the board may issue a Conditional Operation and Maintenance Certificate, during which time the dam owner is to correct the deficiency. After a dam is certified by the board, annual inspections are required either by a professional engineer or the dam owner, and the Annual Inspection Report is submitted to the regional dam safety engineer. Levee Failure FEMA defines a levee as “a man-made structure, usually an earthen embankment, designed and constructed in accordance with sound engineering practices to contain, control, or divert the flow of water in order to reduce the risk from temporary flooding.” A levee designed for the purpose of providing flooding protection from at least the 1% annual chance flood is eligible for accreditation by FEMA. When accredited, the area located behind the levee will be mapped as a moderate risk zone instead of a high risk zone on the Flood Insurance Rate Map (FIRM).6 Before a levee can be accredited it must complete FEMA’s levee certification process which focuses exclusively on design construction standards that must be certified by a licensed engineer or related Federal agency.7 5 Virginia DCR Dam Safety and Floodplain Management http://www.dcr.virginia.gov/dam_safety_and_floodplains/ 6 FEMA. “Provisionally Accredited Levees Factsheet.” Retrieved from http://www.fema.gov/library/viewRecord.do?id=4815 on March 4, 2013. 7 FEMA. “Levee Certification vs. Levee Accreditation.” Retrieved from http://www.fema.gov/library/viewRecord.do?id=4828 on March 4, 2013.
Commonwealth of Virginia Hazard Mitigation Plan Chapter 3 – HIRA: Section 3.15, Flooding Due to Impoundment Failure
Virginia Department of Emergency Management Section 3.15 Page 4
There are 7 communities in Virginia that have record of levee coordination with FEMA through the Provisionally Accredited Levee (PAL) process. Three levee systems: James River Levee Systems (Richmond), Bridgewater Levee System (Rockingham), and Norfolk Floodwall System (Norfolk) secured accreditation in 2012. In addition, the A. Raymon Thacker Levee/Floodwall System (Albemarle) is working on certification.8 There are other levees in Virginia that have never been recognized as providing 100-year protection, or have been de-accredited. De-accreditation doesn’t necessarily mean the levee no longer can provide 100 year flood protection, but may mean that the community or levee owner did not provide the necessary documentation to prove protection. Many of the causes and effects of levee failure are similar to dam failure. Historic Occurrence There are no comprehensive databases of historical dam failures or flooding following a dam failure in Virginia. Most failures occur due to lack of maintenance of dam facilities in combination with major precipitation events, such as hurricanes and thunderstorms.
• The muck dam at Saltville broke and flooded the community of Palmertown, killing 19 people and dislodging several homes from their foundations on Christmas Eve in 1924.9
• In 1957 the Crab Orchard Creek Dam failed due to heavy rains; no one was hurt, but the estimated damage came to half a million dollars.10
• In 1969, Lake Louisa Dam failed as a result of hurricane Camille.11 • Hurricane Floyd in 1999 caused twelve unregulated dams to break in eastern Virginia,
one being the Cow Creek Dam in Gloucester County.12 • Recent failures have included the Timberlake Dam, which killed two in 1995 and cost
nearly one million dollars to rebuild, the Powhatan Lakes Dam, which failed due to a heavy storm during the summer of 2004 and caused over one million dollars in damage13, and Falling Creek Dam in Chesterfield County, which was overtopped during Tropical Storm Gaston flooding in late summer 2004.
• Several dams failed or were overtopped following Tropical Depression Ernesto in 2006.
8 R3levees. “Midterm levee inventory” PAL Tracking Spreadsheet 12/7/2012. Retrieved from http://www.r3levees.org/wiki/index.php?title=Midterm_levee_inventory on March 4, 2013. 9 From newspaper story, “Charged with Blowing Dam,” in the Marion News, January 1925. On file in the historical archives at Smyth-Bland Regional Library in Marion. 10 Mount Rogers Region Local Mitigation Plan 11 Thomas Jefferson Local Mitigation Plan 12 Middle Peninsula Local Mitigation Plan 13 Richmond Local Mitigation Plan

Commonwealth of Virginia Hazard Mitigation Plan Chapter 3 – HIRA: Section 3.15, Flooding Due to Impoundment Failure
Virginia Department of Emergency Management Section 3.15 Page 5
Risk Assessment Although flood inundation maps are a requirement of the current Impounding Structure Regulations14, Virginia DCR does not currently have this information available in a digital form for all dams. Were these maps available, they would illustrate the probable area of flooding downstream of a dam in the event of failure. Lacking such data, this plan’s risk assessment was based solely on a simple DCR database of dam location and classification.
Probability Predicting the probability of flooding due to dam failure requires a detailed, site-specific engineering analysis for each dam in question. Failure may result from hydrologic and hydraulic design limitations, or from geotechnical or operational factors. The data and time necessary to perform a probabilistic failure analysis for each dam in Virginia is beyond the scope of this plan. The probability of dam failure due to hydrologic and hydraulic design limitations is related to the regulatory standards for dam spillway design in Virginia. Dams are required to safely pass a spillway design flood (SDF) without failure, as indicated in Table 3.15-2. Table 3.15-2: Performance Standards for Dams
Hazard Potential
Spillway Design
Minimum Threshold for Incremental Damage Analysis
High PMF15 .50 PMF Significant .50 PMF 100-YR
Low 100-YR 50-YR Note that a dam may be designed to a slightly lower standard than the spillway design flood based on a detailed incremental damage analysis showing that using the higher design flood does not significantly worsen downstream flooding. Low hazard dams expected to result in no loss of human life and no economic damage to any property, except the dam owner’s, may be exempted from the spillway design standards, as well as many of the otherwise applicable regulations. Impact & Vulnerability Failure of dams may result in catastrophic localized damages. Vulnerability to dam failure is dependent on dam operations planning and the nature of downstream development. Depending on the elevation and storage volume of the impoundment, the impact of flooding due to dam failure may include loss of human life, economic losses such as property damage and
14 4 VAC 50-20-54 15 PMF is the Probable Maximum Flood, resulting from the Probable Maximum Precipitation (PMP) estimated by the National Weather Service based on the most severe combination of meteorologic and hydrologic conditions.
Commonwealth of Virginia Hazard Mitigation Plan Chapter 3 – HIRA: Section 3.15, Flooding Due to Impoundment Failure
Virginia Department of Emergency Management Section 3.15 Page 6
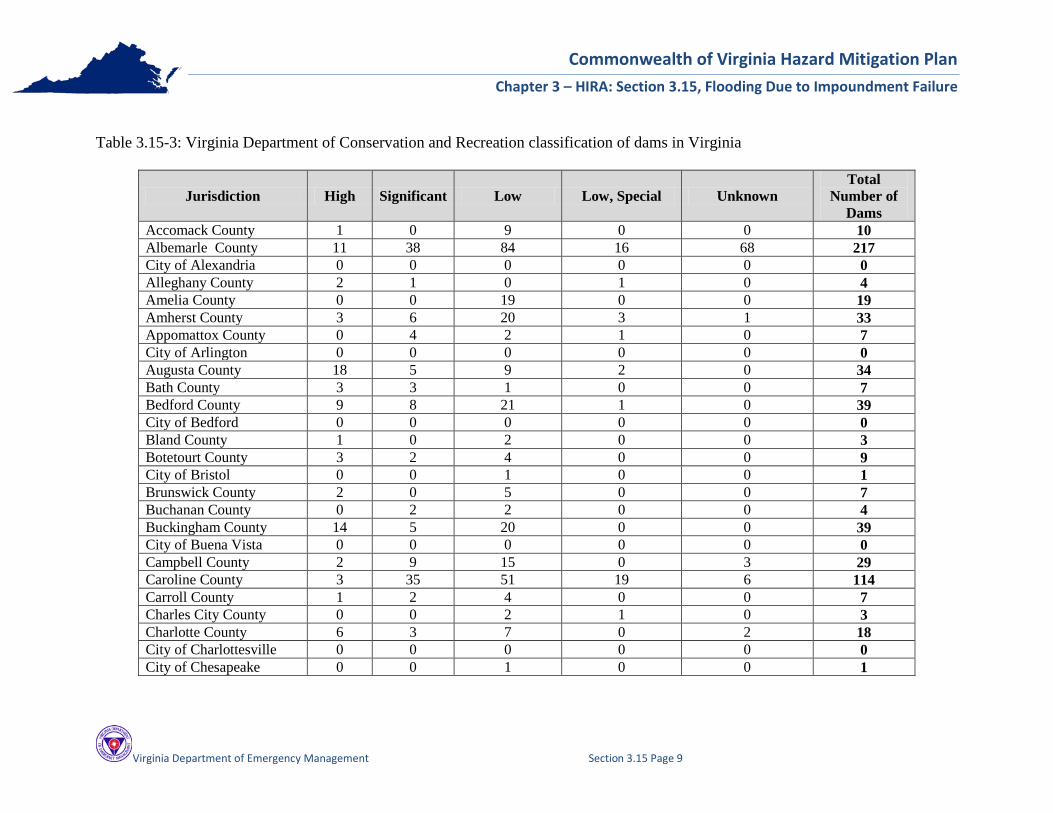
infrastructure disruption, and environmental impacts such as destruction of habitat. Evaluation of vulnerability and impact is highly dependent on site-specific conditions; no broad-brush approach can be applied at a state-wide level. Owners of impounding structures are required to have dam break inundation zone maps that meet the standards of the Virginia Impounding Structure Regulations16. These maps are filed with the Department of Conservation and Recreation (DCR). The properties that are identified within the dam break zone are recorded in the dam safety emergency action plan for that impoundment. DCR is pursuing efforts to make this information available in a digital form. Such data would greatly improve ability to identify impact and vulnerability due to dam inundation. Risk Due to the lack of specific data on dam failure probability or inundation zones, the potential risk to state facilities and critical facilities was not estimated for this revision of the plan. A detailed pseudo-inundation zone map could be developed using detailed terrain models and certain simplifying assumptions, although such an analysis would represent a significant undertaking. Given that Virginia’s new Impounding Structure Regulations require dam break inundation zone mapping, the most efficient course of action is to let DCR compile this data into a usable format. Based on data from the DCR, there are approximately 2,406 dams in the Commonwealth. A majority of the dams in Virginia are classified as Low hazard (52%). Figure 3.15-1 shows the locations of the three hazard classifications in the state. Albemarle County has 217 dams; this is the highest number of dams per jurisdiction followed by Caroline County with 114 dams, Goochland County with 111 dams, and Pittsylvania County with 101 dams. Fairfax County has the highest number of high hazard dams with 48. Table 3.15-3 summarizes the number of dams per jurisdiction by hazard type.
16 Code of Virginia, Chapter 491 Dam Safety, Flood Prevention and Protection Assistance Fund established, mapping of dam inundation zones. March 8, 2008 http://leg1.state.va.us/cgi-bin/legp504.exe?081+ful+CHAP0491

Ohio
West Virginia
Kentucky
Maryland
North CarolinaTennessee
Delaware
New Jersey
District of Columbia
Figure 3.15-1: Virginia Dam Inventory & Hazard Potential
Commonwealth of Virginia Hazard Mitigation Plan 2013
25 0 25 50 7512.5Miles
µ
DISCLAIMER: Majority of available hazard data is intended to be used at national or regional scales.The purpose of the data sets are to give general indication of areas that may be susceptible to hazards. In order to identify potential risk in the Commonwealth available data has been used beyond the original intent.
DATA SOURCES:
PROJECTION: VA Lambert Conformal Conic North American Datum 1983
VA Department of Conservation & RecreationVGIN Jurisdictional BoundariesESRI State Boundaries
Four codes have been established, by DCR, to categorize the hazard to downstream areas resulting from failure or misoperation of the dam or facilities.
HAZARD IDENTIFICATION:LEGEND:Downstream Hazard Potential
HighSignificantLowLow, Special
High: Probable loss of life and/or serious economic damage.Significant: May cause loss of human life and/or appreciable economic damage.Low: No expected loss of life and/or limited economic damage.Low,Special: Damage only to property of the dam owner expected
Commonwealth of Virginia Hazard Mitigation Plan Chapter 3 – HIRA: Section 3.15, Flooding Due to Impoundment Failure
Virginia Department of Emergency Management Section 3.15 Page 8
Local Plan Risk Assessment Local plans were reviewed for spatial data sources used, historical occurrences, hazard probabilities, vulnerability, loss estimations, and land use and development trends. When available, this information supplements the text and figures of each of the sections in this revision. Four of the twenty-five local plans estimated losses for dam failure as negligible. The other twenty-one local plans did not provide loss estimates for flooding due to dam failure. Of the plans that provided a general description of the hazard, many of them provided National Inventory of Dams statistics for dams in their region. Middle Peninsula PDC provided a dam inundation zone map for a dam in their region.
Comparison with Local Ranking West Piedmont PDC ranked dam as a high hazard for their region and Lower Peninsula PDC and Southside PDC ranked dam as a medium-high hazard. Lenowisco PDC, Mount Rogers PDC, Cumberland Plateau PDC, Middle Peninsula PDC, and Mount Rogers PDC all ranked dam failure as a medium hazard for their regions. Thomas Jefferson PDC ranked dam failure as a medium-low hazard and six additional plans ranked dam failure as a low hazard. In addition, ten local and regional plans did not assign dam failure a ranking. The local plan average for dam failure is medium-low. The 2013 statewide analysis ranked dam failure as low. Section 3.6 (Table 3.6-2) includes the complete ranking of all the local plans.
Changes in Development The majority of local plans did not specifically address changes in development for each hazard or the effects of changes in development on loss estimates. In most cases overall development patterns were discussed in general. Sixteen of the twenty-five local plans cite their comprehensive plans for current and future land use changes (section 3.2). Localities and VDEM should work with DCR for future updates to this section. Since dam inundation zone maps are required this information could be used to determine high risk areas for future development. Such data would greatly improve ability to identify impact, vulnerability and loss estimates due to dam inundation.
Commonwealth of Virginia Hazard Mitigation Plan Chapter 3 – HIRA: Section 3.15, Flooding Due to Impoundment Failure
Virginia Department of Emergency Management Section 3.15 Page 9
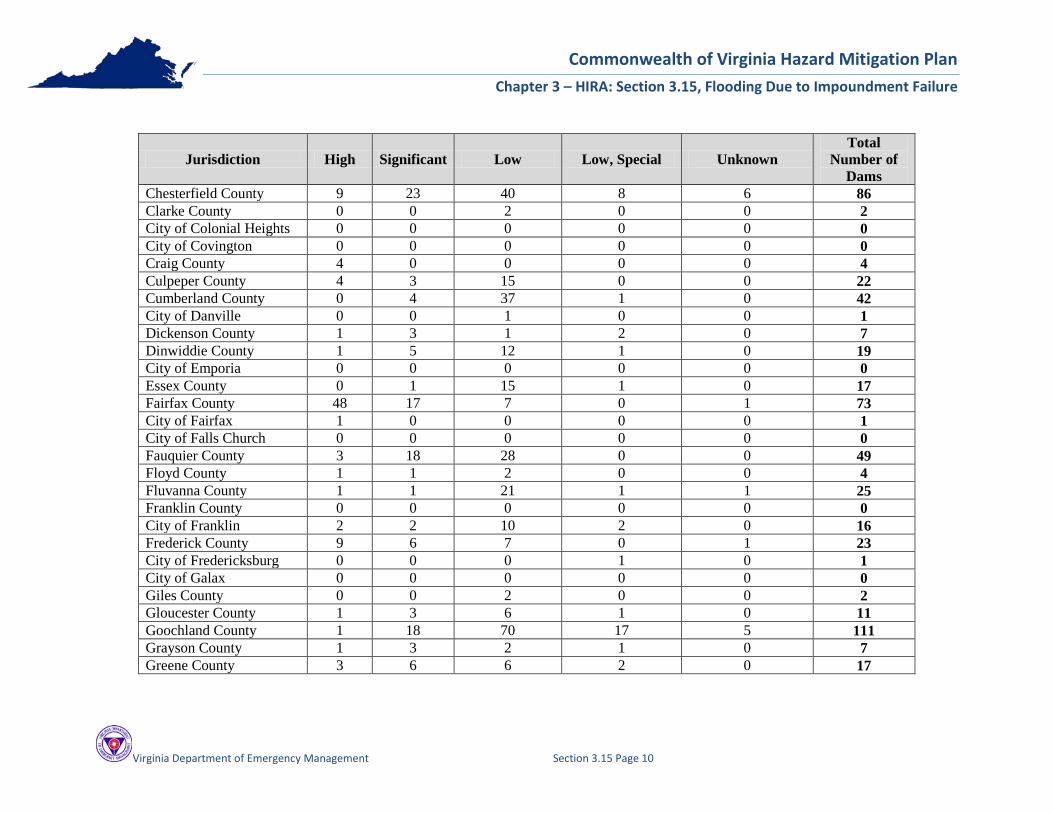
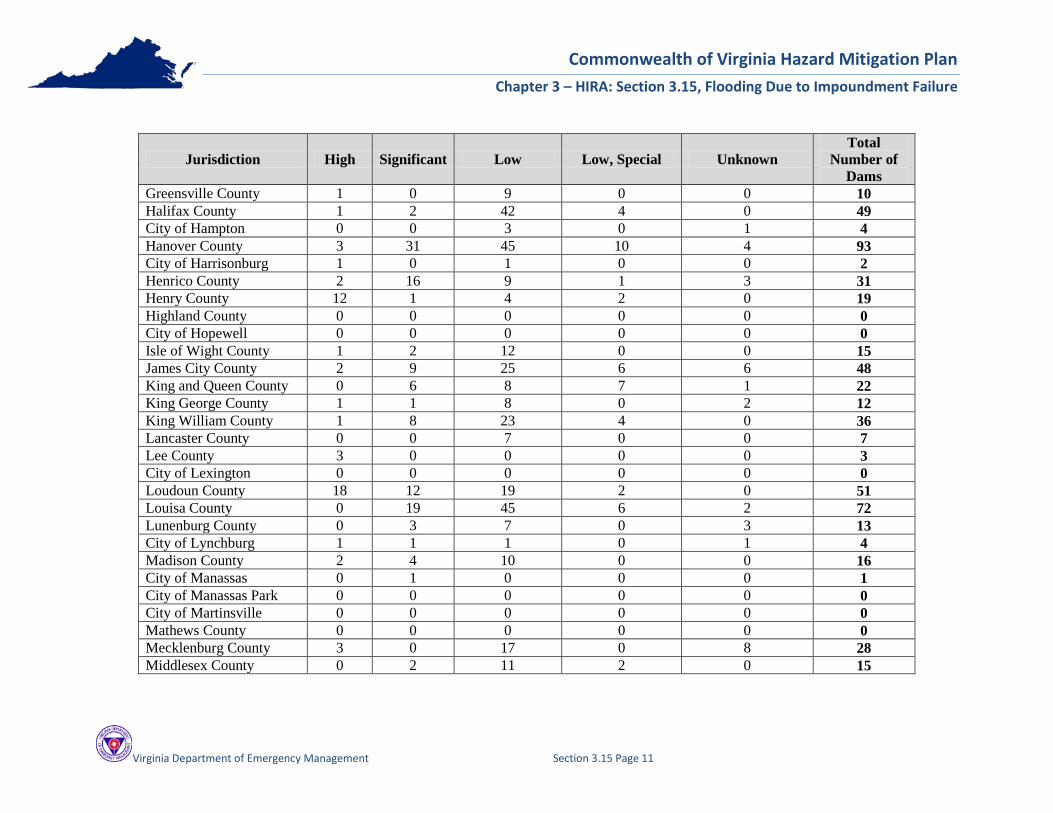
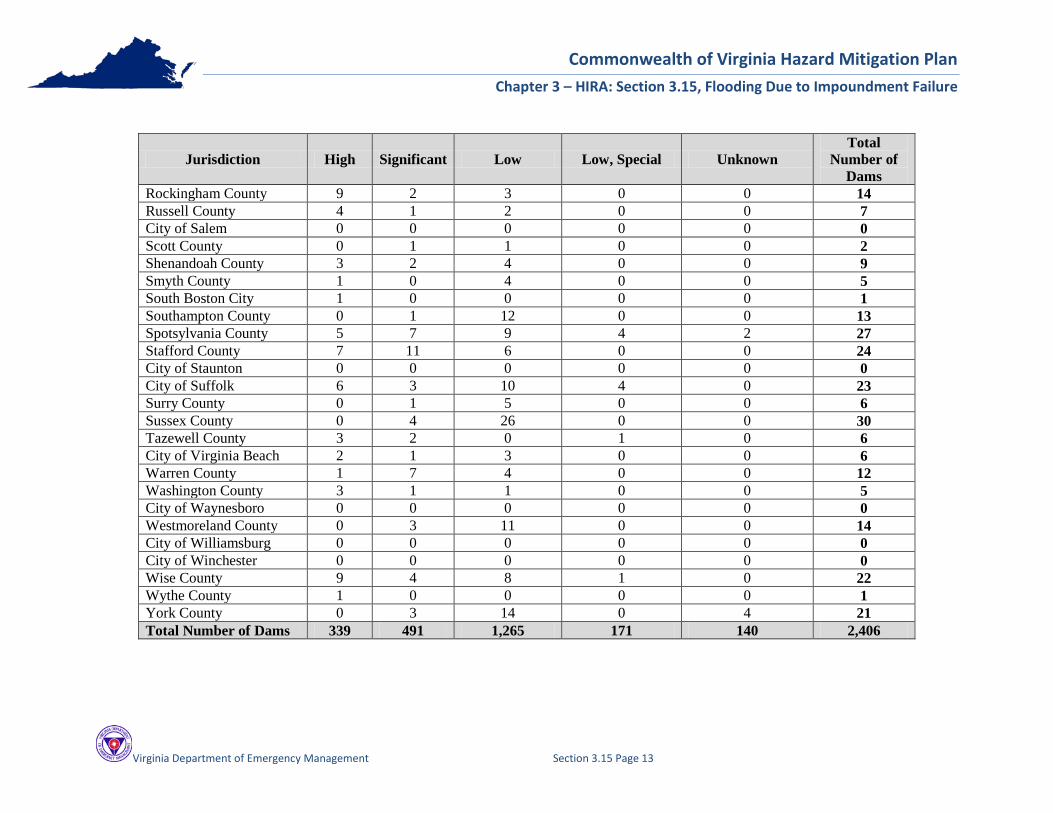
Table 3.15-3: Virginia Department of Conservation and Recreation classification of dams in Virginia
Jurisdiction High Significant Low Low, Special Unknown Total
Number of Dams
Accomack County 1 0 9 0 0 10 Albemarle County 11 38 84 16 68 217 City of Alexandria 0 0 0 0 0 0 Alleghany County 2 1 0 1 0 4 Amelia County 0 0 19 0 0 19 Amherst County 3 6 20 3 1 33 Appomattox County 0 4 2 1 0 7 City of Arlington 0 0 0 0 0 0 Augusta County 18 5 9 2 0 34 Bath County 3 3 1 0 0 7 Bedford County 9 8 21 1 0 39 City of Bedford 0 0 0 0 0 0 Bland County 1 0 2 0 0 3 Botetourt County 3 2 4 0 0 9 City of Bristol 0 0 1 0 0 1 Brunswick County 2 0 5 0 0 7 Buchanan County 0 2 2 0 0 4 Buckingham County 14 5 20 0 0 39 City of Buena Vista 0 0 0 0 0 0 Campbell County 2 9 15 0 3 29 Caroline County 3 35 51 19 6 114 Carroll County 1 2 4 0 0 7 Charles City County 0 0 2 1 0 3 Charlotte County 6 3 7 0 2 18 City of Charlottesville 0 0 0 0 0 0 City of Chesapeake 0 0 1 0 0 1
Commonwealth of Virginia Hazard Mitigation Plan Chapter 3 – HIRA: Section 3.15, Flooding Due to Impoundment Failure
Virginia Department of Emergency Management Section 3.15 Page 10
Jurisdiction High Significant Low Low, Special Unknown Total
Number of Dams
Chesterfield County 9 23 40 8 6 86 Clarke County 0 0 2 0 0 2 City of Colonial Heights 0 0 0 0 0 0 City of Covington 0 0 0 0 0 0 Craig County 4 0 0 0 0 4 Culpeper County 4 3 15 0 0 22 Cumberland County 0 4 37 1 0 42 City of Danville 0 0 1 0 0 1 Dickenson County 1 3 1 2 0 7 Dinwiddie County 1 5 12 1 0 19 City of Emporia 0 0 0 0 0 0 Essex County 0 1 15 1 0 17 Fairfax County 48 17 7 0 1 73 City of Fairfax 1 0 0 0 0 1 City of Falls Church 0 0 0 0 0 0 Fauquier County 3 18 28 0 0 49 Floyd County 1 1 2 0 0 4 Fluvanna County 1 1 21 1 1 25 Franklin County 0 0 0 0 0 0 City of Franklin 2 2 10 2 0 16 Frederick County 9 6 7 0 1 23 City of Fredericksburg 0 0 0 1 0 1 City of Galax 0 0 0 0 0 0 Giles County 0 0 2 0 0 2 Gloucester County 1 3 6 1 0 11 Goochland County 1 18 70 17 5 111 Grayson County 1 3 2 1 0 7 Greene County 3 6 6 2 0 17
Commonwealth of Virginia Hazard Mitigation Plan Chapter 3 – HIRA: Section 3.15, Flooding Due to Impoundment Failure
Virginia Department of Emergency Management Section 3.15 Page 11
Jurisdiction High Significant Low Low, Special Unknown Total
Number of Dams
Greensville County 1 0 9 0 0 10 Halifax County 1 2 42 4 0 49 City of Hampton 0 0 3 0 1 4 Hanover County 3 31 45 10 4 93 City of Harrisonburg 1 0 1 0 0 2 Henrico County 2 16 9 1 3 31 Henry County 12 1 4 2 0 19 Highland County 0 0 0 0 0 0 City of Hopewell 0 0 0 0 0 0 Isle of Wight County 1 2 12 0 0 15 James City County 2 9 25 6 6 48 King and Queen County 0 6 8 7 1 22 King George County 1 1 8 0 2 12 King William County 1 8 23 4 0 36 Lancaster County 0 0 7 0 0 7 Lee County 3 0 0 0 0 3 City of Lexington 0 0 0 0 0 0 Loudoun County 18 12 19 2 0 51 Louisa County 0 19 45 6 2 72 Lunenburg County 0 3 7 0 3 13 City of Lynchburg 1 1 1 0 1 4 Madison County 2 4 10 0 0 16 City of Manassas 0 1 0 0 0 1 City of Manassas Park 0 0 0 0 0 0 City of Martinsville 0 0 0 0 0 0 Mathews County 0 0 0 0 0 0 Mecklenburg County 3 0 17 0 8 28 Middlesex County 0 2 11 2 0 15

Commonwealth of Virginia Hazard Mitigation Plan Chapter 3 – HIRA: Section 3.15, Flooding Due to Impoundment Failure
Virginia Department of Emergency Management Section 3.15 Page 12
Jurisdiction High Significant Low Low, Special Unknown Total
Number of Dams
Montgomery County 0 1 4 1 0 6 Nelson County 1 3 7 2 1 14 New Kent County 1 7 14 3 1 26 City of Newport News 2 7 3 1 0 13 City of Norfolk 1 0 1 0 0 2 Northampton County 0 0 9 0 0 9 Northumberland County 0 2 6 1 0 9 City of Norton 2 0 0 0 0 2 Nottoway County 0 1 22 2 0 25 Orange County 3 2 10 0 0 15 Page County 2 3 3 0 0 8 Patrick County 6 1 9 3 0 19 City of Petersburg 0 0 0 0 0 0 Pittsylvania County 8 6 82 5 0 101 City of Poquoson 0 0 0 0 0 0 City of Portsmouth 0 0 0 0 0 0 Powhatan County 1 14 27 13 4 59 Prince Edward County 6 11 25 1 2 45 Prince George County 0 4 18 0 1 23 Prince William County 13 5 13 0 0 31 Pulaski County 3 2 1 0 0 6 City of Radford 0 0 0 0 0 0 Rappahannock County 1 1 6 0 0 8 Richmond County 1 5 6 1 0 13 City Richmond 0 3 5 1 0 9 Roanoke County 5 1 0 0 0 6 City of Roanoke 2 0 0 0 0 2 Rockbridge County 5 3 2 1 0 11
Commonwealth of Virginia Hazard Mitigation Plan Chapter 3 – HIRA: Section 3.15, Flooding Due to Impoundment Failure
Virginia Department of Emergency Management Section 3.15 Page 13
Jurisdiction High Significant Low Low, Special Unknown Total
Number of Dams
Rockingham County 9 2 3 0 0 14 Russell County 4 1 2 0 0 7 City of Salem 0 0 0 0 0 0 Scott County 0 1 1 0 0 2 Shenandoah County 3 2 4 0 0 9 Smyth County 1 0 4 0 0 5 South Boston City 1 0 0 0 0 1 Southampton County 0 1 12 0 0 13 Spotsylvania County 5 7 9 4 2 27 Stafford County 7 11 6 0 0 24 City of Staunton 0 0 0 0 0 0 City of Suffolk 6 3 10 4 0 23 Surry County 0 1 5 0 0 6 Sussex County 0 4 26 0 0 30 Tazewell County 3 2 0 1 0 6 City of Virginia Beach 2 1 3 0 0 6 Warren County 1 7 4 0 0 12 Washington County 3 1 1 0 0 5 City of Waynesboro 0 0 0 0 0 0 Westmoreland County 0 3 11 0 0 14 City of Williamsburg 0 0 0 0 0 0 City of Winchester 0 0 0 0 0 0 Wise County 9 4 8 1 0 22 Wythe County 1 0 0 0 0 1 York County 0 3 14 0 4 21 Total Number of Dams 339 491 1,265 171 140 2,406
Commonwealth of Virginia Hazard Mitigation Plan Chapter 3 – HIRA: Section 3.15, Flooding Due to Impoundment Failure
Virginia Department of Emergency Management Section 3.15 Page 14
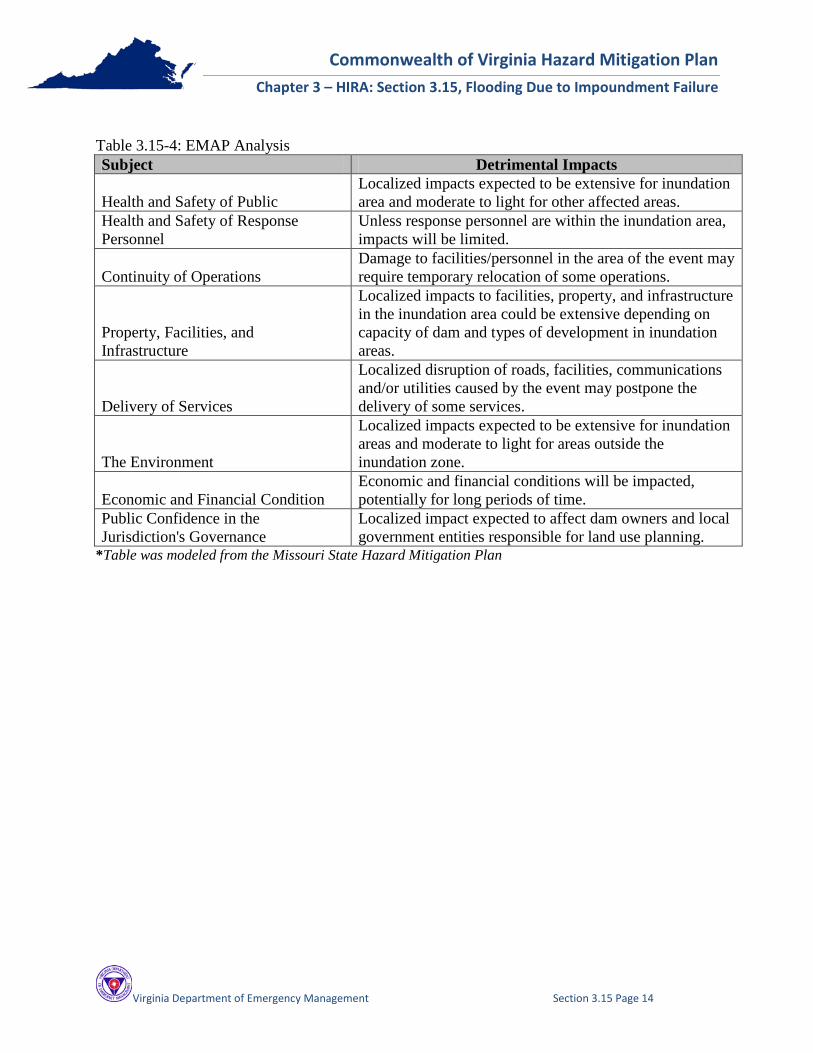
Table 3.15-4: EMAP Analysis Subject Detrimental Impacts
Health and Safety of Public Localized impacts expected to be extensive for inundation area and moderate to light for other affected areas.
Health and Safety of Response Personnel
Unless response personnel are within the inundation area, impacts will be limited.
Continuity of Operations Damage to facilities/personnel in the area of the event may require temporary relocation of some operations.
Property, Facilities, and Infrastructure
Localized impacts to facilities, property, and infrastructure in the inundation area could be extensive depending on capacity of dam and types of development in inundation areas.
Delivery of Services
Localized disruption of roads, facilities, communications and/or utilities caused by the event may postpone the delivery of some services.
The Environment
Localized impacts expected to be extensive for inundation areas and moderate to light for areas outside the inundation zone.
Economic and Financial Condition Economic and financial conditions will be impacted, potentially for long periods of time.
Public Confidence in the Jurisdiction's Governance
Localized impact expected to affect dam owners and local government entities responsible for land use planning.
*Table was modeled from the Missouri State Hazard Mitigation Plan