Embed Size (px)
Citation preview
Copyright © 2013 ARM Ltd. ARM Limited or its affiliates. All rights reserved.
Freescale Kinetis Cortex-M4 Lab with ARM® Keil™ MDK toolkit www.keil.com/freescale
1
Freescale Kinetis: K60D100M Cortex™-M4 Lab ARM® Keil™ MDK Toolkit featuring Serial Wire Viewer and ETM Trace Winter 2013 Version 1.0 for the K60D100M Board by Robert Boys, [email protected]
Introduction: The purpose of this lab is to introduce you to the Freescale Cortex™-M4 processor by using the ARM® Keil™ MDK toolkit featuring μVision® IDE. We will use the Serial Wire Viewer (SWV) and ETM™ trace on the Kinetis processor. For other labs and appnotes for other Tower or Freedom boards see www.keil.com/freescale. MDK includes example projects for many Tower, KWIKSTIK and Freedom boards. This lab can be adapted for use with many of these boards. For the Tower K60512N lab, see www.keil.com/appnotes/docs/apnt_239.asp.
Keil MDK-Lite™ is a free evaluation version that limits code size to 32 Kbytes. The addition of a license number will turn it into the full, unrestricted version. MDK-Freescale is an economical US $745 toolkit for Kinetis processors.
Linux and Android: For Linux, Android, bare metal (no OS) and other OS support on Freescale i.MX and Vybrid series processors please see DS-5™ at www.arm.com/ds5/.
Why Use Keil MDK ? MDK provides these features particularly suited for Cortex-M users:
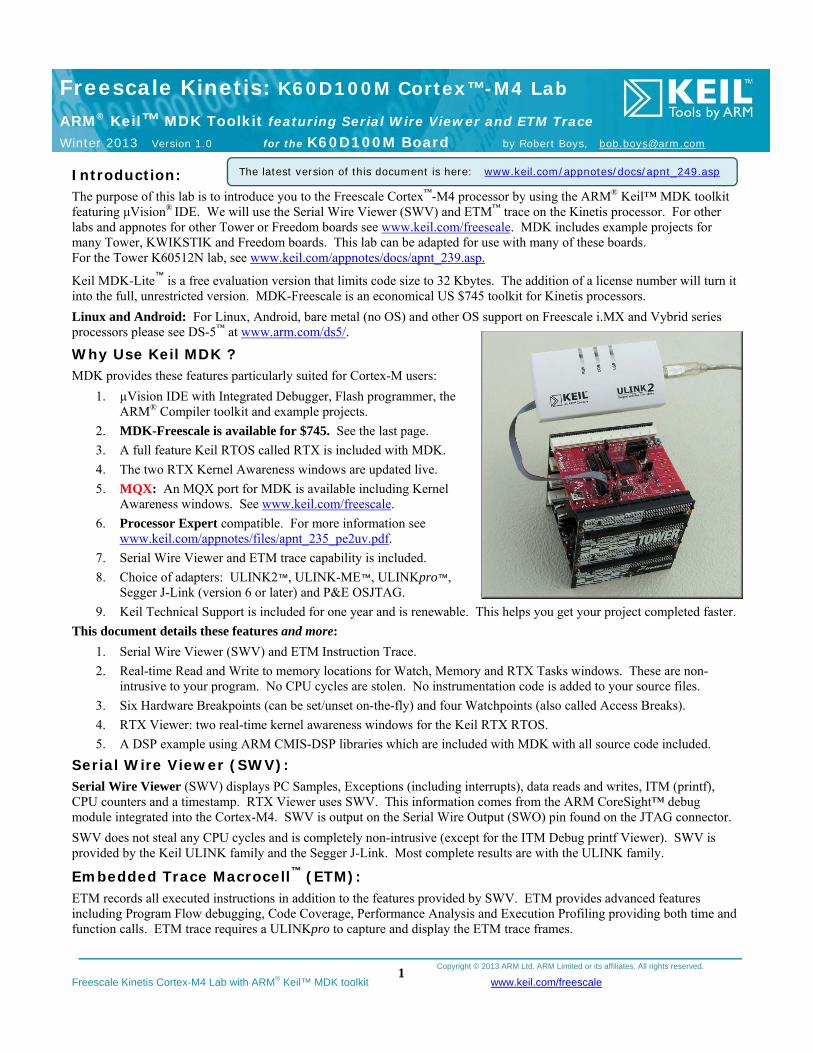
1. µVision IDE with Integrated Debugger, Flash programmer, the ARM® Compiler toolkit and example projects.
2. MDK-Freescale is available for $745. See the last page.
3. A full feature Keil RTOS called RTX is included with MDK.
4. The two RTX Kernel Awareness windows are updated live.
5. MQX: An MQX port for MDK is available including Kernel Awareness windows. See www.keil.com/freescale.
6. Processor Expert compatible. For more information see www.keil.com/appnotes/files/apnt_235_pe2uv.pdf.
7. Serial Wire Viewer and ETM trace capability is included.
8. Choice of adapters: ULINK2™, ULINK-ME™, ULINKpro™, Segger J-Link (version 6 or later) and P&E OSJTAG.
9. Keil Technical Support is included for one year and is renewable. This helps you get your project completed faster.
This document details these features and more:
1. Serial Wire Viewer (SWV) and ETM Instruction Trace.
2. Real-time Read and Write to memory locations for Watch, Memory and RTX Tasks windows. These are non-intrusive to your program. No CPU cycles are stolen. No instrumentation code is added to your source files.
3. Six Hardware Breakpoints (can be set/unset on-the-fly) and four Watchpoints (also called Access Breaks).
4. RTX Viewer: two real-time kernel awareness windows for the Keil RTX RTOS.
5. A DSP example using ARM CMIS-DSP libraries which are included with MDK with all source code included.
Serial Wire Viewer (SWV): Serial Wire Viewer (SWV) displays PC Samples, Exceptions (including interrupts), data reads and writes, ITM (printf), CPU counters and a timestamp. RTX Viewer uses SWV. This information comes from the ARM CoreSight™ debug module integrated into the Cortex-M4. SWV is output on the Serial Wire Output (SWO) pin found on the JTAG connector.
SWV does not steal any CPU cycles and is completely non-intrusive (except for the ITM Debug printf Viewer). SWV is provided by the Keil ULINK family and the Segger J-Link. Most complete results are with the ULINK family.
Embedded Trace Macrocell™ (ETM): ETM records all executed instructions in addition to the features provided by SWV. ETM provides advanced features including Program Flow debugging, Code Coverage, Performance Analysis and Execution Profiling providing both time and function calls. ETM trace requires a ULINKpro to capture and display the ETM trace frames.
The latest version of this document is here: www.keil.com/appnotes/docs/apnt_249.asp
Copyright © 2013 ARM Ltd. ARM Limited or its affiliates. All rights reserved.
Freescale Kinetis Cortex-M4 Lab with ARM® Keil™ MDK toolkit www.keil.com/freescale
2
Introduction: 1. Freescale Eval boards, Keil software install, Examples, Debug Adapters, CoreSight Definitions: 3 2. Notes for Freescale Tower CPU Boards: 4
Part A: Connecting and Configuring Debug Adapters to the Kinetis Tower board: 5 1. P&E OSJTAG Configuration for the Freescale Tower board: 5 2. Connecting ULINK2, ULINK-ME, J-Link or ULINKpro to the Freescale Tower board: 6 3. Configuring ULINK2 or ULINK-ME and µVision: 7 4. Configuring ULINKpro and µVision: 8
Part B: Example Projects: 9 1. Blinky example program using the Kinetis and ULINK2 or ULINKpro: 9 2. Hardware Breakpoints: 9 3. Call Stack + Locals Window: 10 4. Watch and Memory Windows and how to use them: 11
a. Watch window: 11 b. Memory window: 11 c. How to view Local Variables in the Watch or Memory windows: 12
5. Getting the Serial Wire Viewer (SWV) working: 13 a. For ULINK2 or ULINK-ME: 13 b. For ULINKpro: 14
6. Using the Logic Analyzer (LA) with ULINK2 or ULINK-ME: 15 7. Watchpoints: Conditional Breakpoints: 16 8. RTX_Blinky example program with Keil RTX RTOS: 17 9. RTX Kernel Awareness using Serial Wire Viewer (SWV): 18 10. Logic Analyzer Window: View variables real-time in a graphical format: 19 11. Serial Wire Viewer (SWV) and how to use it: (with ULINK2): 20
a. Data Reads and Writes: 20 b. Exceptions and Interrupts: 21 c. PC Samples: 22
12. ITM (Instruction Trace Macrocell) a printf feature: 23 13. Trace Configuration Fields (for reference): 24
Part C: DSP Example Project: 26 1. DSP Example using ARM CMSIS-DSP Libraries: 26 2. Signal Timings using Logic Analyzer: and the RTX Tasks window: 27 3. RTX Event Viewer: 28 4. Event Viewer Timing: and Changing the SysTick timer: 29
PART D: ETM Trace with the ULINKpro: 30 1. Configuring the ULINKpro ETM Trace: 30 2. Blinky Example: ETM Frames starting at RESET and beyond: 32 3. Finding the Trace Frames you are looking for: 33 4. Trace Triggers: 34 5. Code Coverage: and how to save Code Coverage: 35 6. Performance Analyzer (PA): 37 7. Execution Profiler: 38 8. In-The-Weeds Example: 39 9. Serial Wire Viewer summary: 40 10. Keil Products and contact information: 41
Copyright © 2013 ARM Ltd. ARM Limited or its affiliates. All rights reserved.
Freescale Kinetis Cortex-M4 Lab with ARM® Keil™ MDK toolkit www.keil.com/freescale
3
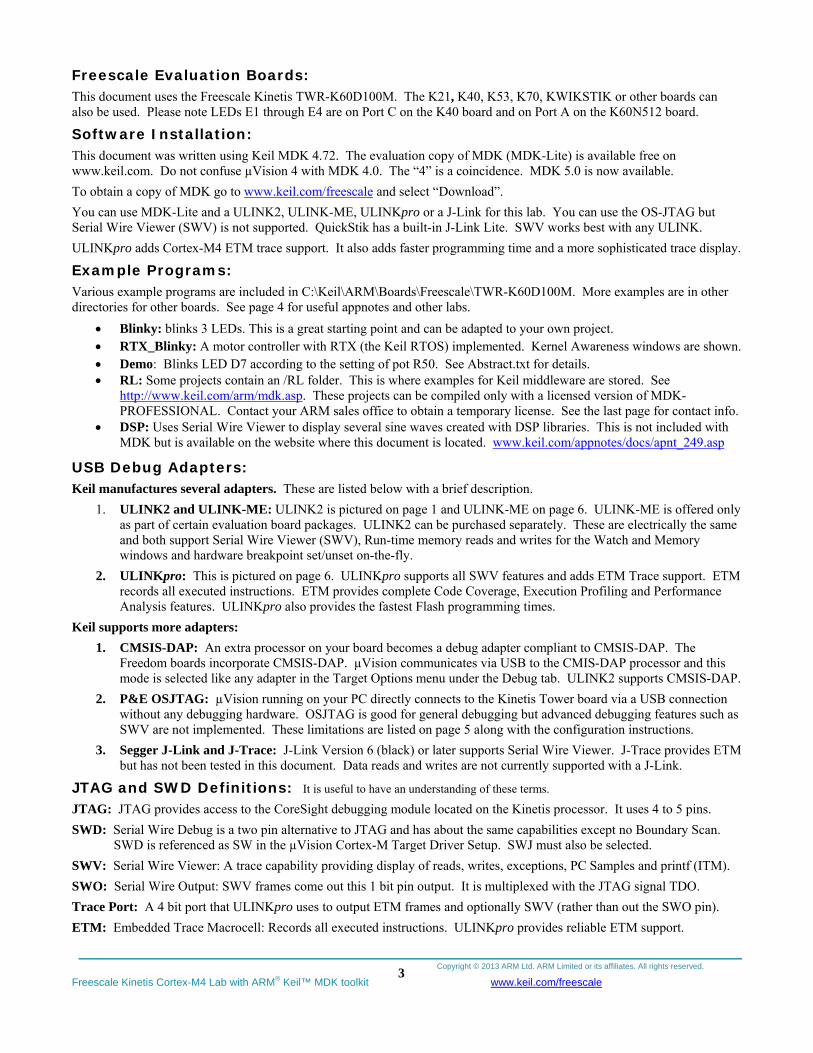
Freescale Evaluation Boards: This document uses the Freescale Kinetis TWR-K60D100M. The K21, K40, K53, K70, KWIKSTIK or other boards can also be used. Please note LEDs E1 through E4 are on Port C on the K40 board and on Port A on the K60N512 board.
Software Installation: This document was written using Keil MDK 4.72. The evaluation copy of MDK (MDK-Lite) is available free on www.keil.com. Do not confuse µVision 4 with MDK 4.0. The “4” is a coincidence. MDK 5.0 is now available.
To obtain a copy of MDK go to www.keil.com/freescale and select “Download”.
You can use MDK-Lite and a ULINK2, ULINK-ME, ULINKpro or a J-Link for this lab. You can use the OS-JTAG but Serial Wire Viewer (SWV) is not supported. QuickStik has a built-in J-Link Lite. SWV works best with any ULINK.
ULINKpro adds Cortex-M4 ETM trace support. It also adds faster programming time and a more sophisticated trace display.
Example Programs: Various example programs are included in C:\Keil\ARM\Boards\Freescale\TWR-K60D100M. More examples are in other directories for other boards. See page 4 for useful appnotes and other labs.
Blinky: blinks 3 LEDs. This is a great starting point and can be adapted to your own project. RTX_Blinky: A motor controller with RTX (the Keil RTOS) implemented. Kernel Awareness windows are shown. Demo: Blinks LED D7 according to the setting of pot R50. See Abstract.txt for details. RL: Some projects contain an /RL folder. This is where examples for Keil middleware are stored. See
http://www.keil.com/arm/mdk.asp. These projects can be compiled only with a licensed version of MDK-PROFESSIONAL. Contact your ARM sales office to obtain a temporary license. See the last page for contact info.
DSP: Uses Serial Wire Viewer to display several sine waves created with DSP libraries. This is not included with MDK but is available on the website where this document is located. www.keil.com/appnotes/docs/apnt_249.asp
USB Debug Adapters: Keil manufactures several adapters. These are listed below with a brief description.
1. ULINK2 and ULINK-ME: ULINK2 is pictured on page 1 and ULINK-ME on page 6. ULINK-ME is offered only as part of certain evaluation board packages. ULINK2 can be purchased separately. These are electrically the same and both support Serial Wire Viewer (SWV), Run-time memory reads and writes for the Watch and Memory windows and hardware breakpoint set/unset on-the-fly.
2. ULINKpro: This is pictured on page 6. ULINKpro supports all SWV features and adds ETM Trace support. ETM records all executed instructions. ETM provides complete Code Coverage, Execution Profiling and Performance Analysis features. ULINKpro also provides the fastest Flash programming times.
Keil supports more adapters:
1. CMSIS-DAP: An extra processor on your board becomes a debug adapter compliant to CMSIS-DAP. The Freedom boards incorporate CMSIS-DAP. µVision communicates via USB to the CMIS-DAP processor and this mode is selected like any adapter in the Target Options menu under the Debug tab. ULINK2 supports CMSIS-DAP.
2. P&E OSJTAG: µVision running on your PC directly connects to the Kinetis Tower board via a USB connection without any debugging hardware. OSJTAG is good for general debugging but advanced debugging features such as SWV are not implemented. These limitations are listed on page 5 along with the configuration instructions.
3. Segger J-Link and J-Trace: J-Link Version 6 (black) or later supports Serial Wire Viewer. J-Trace provides ETM but has not been tested in this document. Data reads and writes are not currently supported with a J-Link.
JTAG and SWD Definitions: It is useful to have an understanding of these terms.
JTAG: JTAG provides access to the CoreSight debugging module located on the Kinetis processor. It uses 4 to 5 pins.
SWD: Serial Wire Debug is a two pin alternative to JTAG and has about the same capabilities except no Boundary Scan. SWD is referenced as SW in the µVision Cortex-M Target Driver Setup. SWJ must also be selected.
SWV: Serial Wire Viewer: A trace capability providing display of reads, writes, exceptions, PC Samples and printf (ITM).
SWO: Serial Wire Output: SWV frames come out this 1 bit pin output. It is multiplexed with the JTAG signal TDO.
Trace Port: A 4 bit port that ULINKpro uses to output ETM frames and optionally SWV (rather than out the SWO pin).
ETM: Embedded Trace Macrocell: Records all executed instructions. ULINKpro provides reliable ETM support.
Copyright © 2013 ARM Ltd. ARM Limited or its affiliates. All rights reserved.
Freescale Kinetis Cortex-M4 Lab with ARM® Keil™ MDK toolkit www.keil.com/freescale
4
Notes for Freescale Tower CPU Boards:
Using Tower boards other than the K60D100M:
MDK has many examples for Tower boards. See C:\Keil\ARM\Boards\Freescale for the list. Some projects contain target options for various USB debug adapters. You can adapt these settings including which flash algorithms to use to your board.
You can adapt this lab to any of these boards. Here are some items you might need to adjust for:
1) Start_xxx.s and System_xxx.c CMSIS files. These are specific to the processor you are using and are important. Sample files are in the various projects.
2) Core Clock: for SWV trace. Check the file abstract.txt for this value. With the ULINK2, this value must be correct in order to collect SWV frames. ULINKpro detects this speed. It is used then to set the value of various timing displays.
3) The DSP example is designed for the K60N512 board and runs at 56.2 MHz. If you run it at a much higher speed, SWV might not be able to display all the data without dropping data frames when using a ULINK2 or a J-Link. To solve this issue, use a ULINKpro, slow the clock or select fewer SWV elements to display.
The K60N512 board DSP example runs at 96 MHz.
4) For clock differences between the K60N512 and K60D100M boards see: http://cache.freescale.com/files/32bit/doc/app_note/AN4445.pdf?fsrch=1&sr=1
For the Vybrid Tower board, see www.arm.com/ds5 for a suitable development system.
For general information: www.keil.com/freescale
KL25Z Freedom www.keil.com/appnotes/docs/apnt_232.asp
K20D50M Freedom www.keil.com/appnotes/docs/apnt_243.asp
Kinetis K60N512 Tower www.keil.com/appnotes/docs/apnt_239.asp
Kinetis K60D100M Tower www.keil.com/appnotes/docs/apnt_249.asp
Export Freescale Processor Expert Projects to µVision™ Projects www.keil.com/appnotes/docs/apnt_235.asp
FlexMemory configuration using MDK www.keil.com/appnotes/files/apnt220.pdf www.arm.com/cmsis www.keil.com/forum http://community.arm.com/groups/tools/content
Copyright © 2013 ARM Ltd. ARM Limited or its affiliates. All rights reserved.
Freescale Kinetis Cortex-M4 Lab with ARM® Keil™ MDK toolkit www.keil.com/freescale
5
Part A: Connecting and Configuring Debug Adapters to the Kinetis Tower board: 1) P&E OSJTAG configuration for the Freescale Tower board: If you are using any ULINK or J-Link: you can skip this page: µVision supports OSJTAG. This allows debugging the Kinetis Tower with a USB cable. No external adapter is required. You can use the free evaluation version of Keil MDK (MDK-Lite) with OSJTAG to evaluate programs up to 32K.
If you decide to use a ULINK2 or ULINK-ME, you will get Serial Wire Viewer (SWV). With a ULINKpro, ETM Trace is added which records all executed instructions and provides Code Coverage, Execution Profiling and Performance Analysis.
OSJTAG Limitations: (Any ULINK provides these options)
1. Hardware Breakpoints can’t be set on-the-fly while the program is running.
2. No Watchpoints.
3. No Serial Wire Viewer or ETM Trace support.
4. No on-the-fly memory read or write updates to the Watch and Memory windows.
5. No RTX Kernel Awareness window updating.
Install P&E Drivers: (you do not need to do these steps for any ULINK or J-Link adapters)
1. Download the drivers from www.keil.com/download/docs/408.asp. Filename is currently fslkinetisdriversv114.exe
2. Disconnect the Kinetis board from the USB cable and close µVision if it is running.
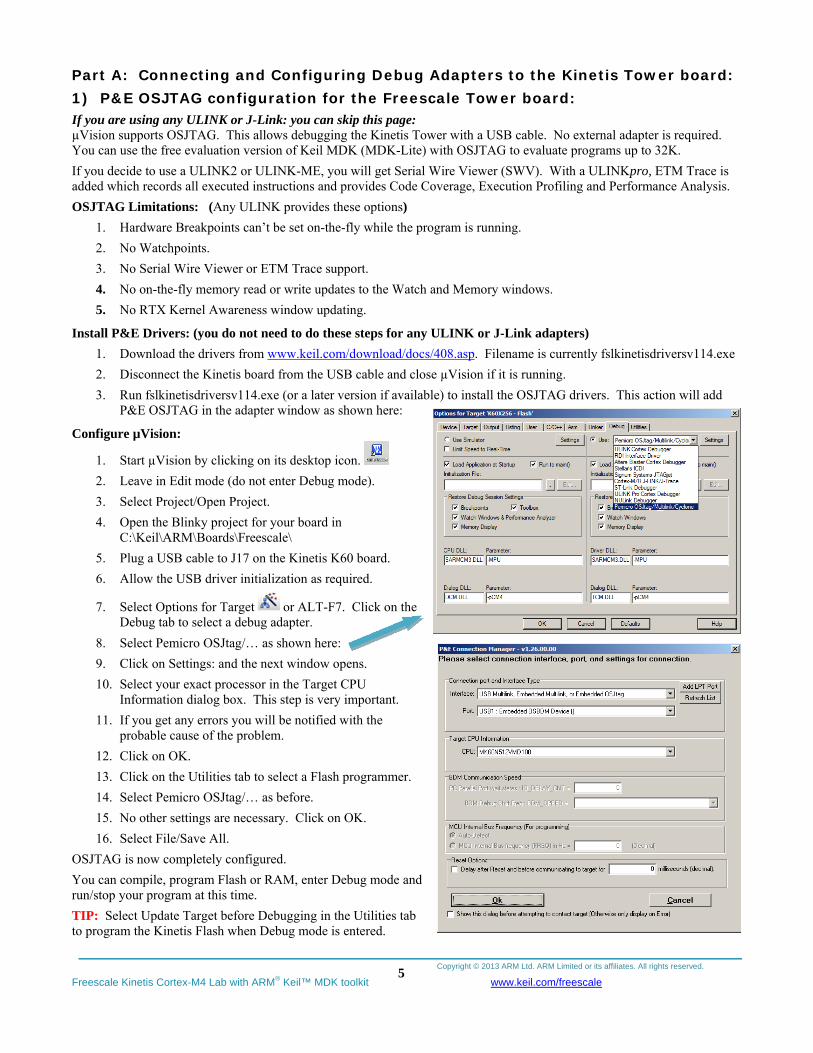
3. Run fslkinetisdriversv114.exe (or a later version if available) to install the OSJTAG drivers. This action will add P&E OSJTAG in the adapter window as shown here:
Configure µVision:
1. Start µVision by clicking on its desktop icon.
2. Leave in Edit mode (do not enter Debug mode).
3. Select Project/Open Project.
4. Open the Blinky project for your board in C:\Keil\ARM\Boards\Freescale\
5. Plug a USB cable to J17 on the Kinetis K60 board.
6. Allow the USB driver initialization as required.
7. Select Options for Target or ALT-F7. Click on the Debug tab to select a debug adapter.
8. Select Pemicro OSJtag/… as shown here:
9. Click on Settings: and the next window opens.
10. Select your exact processor in the Target CPU Information dialog box. This step is very important.
11. If you get any errors you will be notified with the probable cause of the problem.
12. Click on OK.
13. Click on the Utilities tab to select a Flash programmer.
14. Select Pemicro OSJtag/… as before.
15. No other settings are necessary. Click on OK.
16. Select File/Save All.
OSJTAG is now completely configured.
You can compile, program Flash or RAM, enter Debug mode and run/stop your program at this time.
TIP: Select Update Target before Debugging in the Utilities tab to program the Kinetis Flash when Debug mode is entered.
Copyright © 2013 ARM Ltd. ARM Limited or its affiliates. All rights reserved.
Freescale Kinetis Cortex-M4 Lab with ARM® Keil™ MDK toolkit www.keil.com/freescale
6
ULINKpro connected to a K60 Tower
2) Connecting a ULINK2, ULINK-ME or ULINKpro to the Freescale Tower board: Freescale provides the ARM standard 20 pin Cortex Debug connector for JTAG/SWD and ETM connection as shown here:
Pins 1 through 10 provide JTAG, SWD and SWO signals. Pins 11 through 20 provide the ETM trace signals.
ARM also provides a 10 pin standard connector that provides the first 10 pins of the 20 pin but this is not installed on the Kinetis board. ARM recommends that both the 10 and 20 pin connectors be placed on target boards.
Pin 7 on both the 10 and 20 pin is a key. On the male connector, pin 7 is supposed to be absent. This is not the case on the Kinetis board.
Keil cables might have pin 7 filled with a plastic plug and if so this will need to be removed before connecting to the Kinetis target. This is easily done with a sharp needle. Merely pry the pin out.
Alternatively, you can cut pin 7 off the target connector. This is more difficult to do. Cable orientation is provided by the socket itself and there is no chance for reverse orientation.
It is impossible to plug a 10 pin plug into the 20 pin socket without bending two pins on the socket.
Connecting ULINK2 or ULINK-ME:
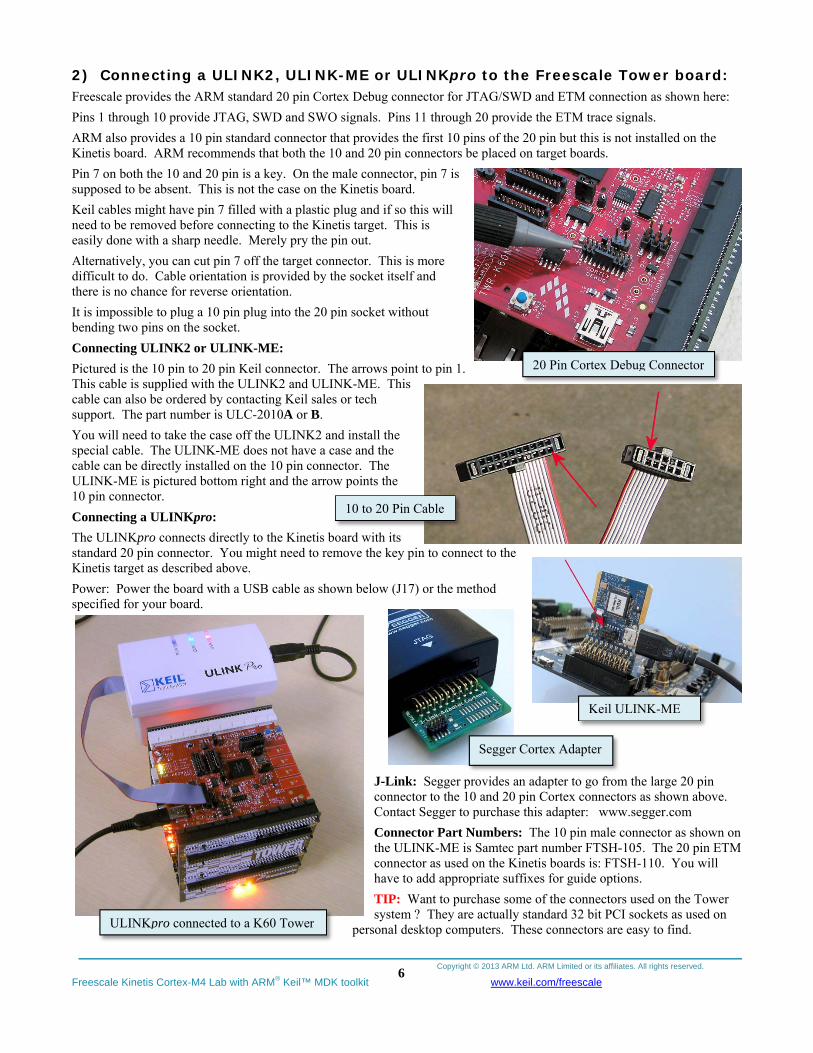
Pictured is the 10 pin to 20 pin Keil connector. The arrows point to pin 1. This cable is supplied with the ULINK2 and ULINK-ME. This cable can also be ordered by contacting Keil sales or tech support. The part number is ULC-2010A or B.
You will need to take the case off the ULINK2 and install the special cable. The ULINK-ME does not have a case and the cable can be directly installed on the 10 pin connector. The ULINK-ME is pictured bottom right and the arrow points the 10 pin connector.
Connecting a ULINKpro:
The ULINKpro connects directly to the Kinetis board with its standard 20 pin connector. You might need to remove the key pin to connect to the Kinetis target as described above.
Power: Power the board with a USB cable as shown below (J17) or the method specified for your board.
J-Link: Segger provides an adapter to go from the large 20 pin connector to the 10 and 20 pin Cortex connectors as shown above. Contact Segger to purchase this adapter: www.segger.com
Connector Part Numbers: The 10 pin male connector as shown on the ULINK-ME is Samtec part number FTSH-105. The 20 pin ETM connector as used on the Kinetis boards is: FTSH-110. You will have to add appropriate suffixes for guide options.
TIP: Want to purchase some of the connectors used on the Tower system ? They are actually standard 32 bit PCI sockets as used on
personal desktop computers. These connectors are easy to find.
Segger Cortex Adapter
Keil ULINK-ME
20 Pin Cortex Debug Connector
10 to 20 Pin Cable
Copyright © 2013 ARM Ltd. ARM Limited or its affiliates. All rights reserved.
Freescale Kinetis Cortex-M4 Lab with ARM® Keil™ MDK toolkit www.keil.com/freescale
7
3) Configuring ULINK2 or ULINK-ME and µVision: (similar instructions for J-Link) If you are using a ULINKpro or OSJTAG, you can skip this page:
It is easy to select a USB debugging adapter in µVision. You must configure the connection to both the target and to Flash programming in two separate windows as described below. They are selected using the Debug and Utilities tabs.
This document will use a ULINK2 or ULINK-ME as described. You can substitute a ULINKpro with suitable adjustments.
Serial Wire Viewer is supported by all three adapters. ULINK2 and ULINK-ME are essentially the same devices electrically and any reference to ULINK2 here includes the ME. The ULINKpro, which is a Cortex-M ETM trace adapter, can be used like a ULINK2 or ULINK-ME with the advantages of faster programming time and an enhanced instruction trace window.
1) Select the debug connection to the target:
1. Assume the ULINK2 is connected to a powered up Kinetis target board, µVision is running in Edit mode (as it is when first started – the alternative to Debug mode) and you have selected a valid project. The ULINK2 is shown connected to the Freescale K60 Tower board on page 1.
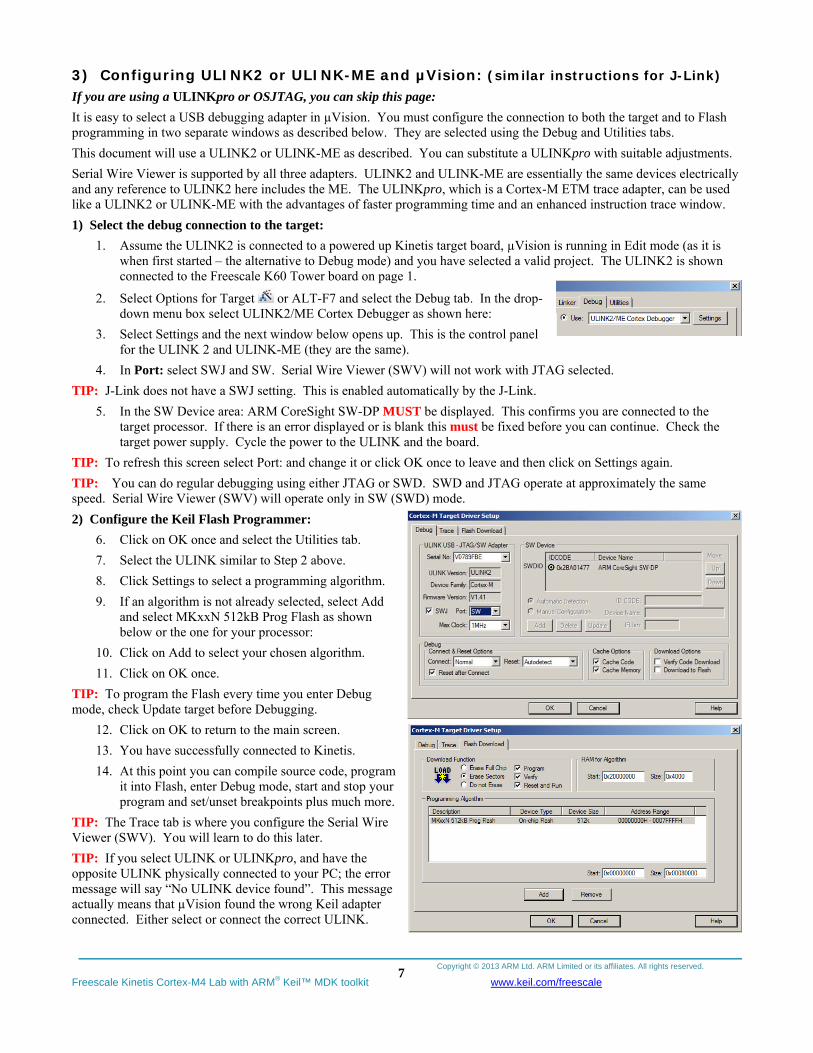
2. Select Options for Target or ALT-F7 and select the Debug tab. In the drop-down menu box select ULINK2/ME Cortex Debugger as shown here:
3. Select Settings and the next window below opens up. This is the control panel for the ULINK 2 and ULINK-ME (they are the same).
4. In Port: select SWJ and SW. Serial Wire Viewer (SWV) will not work with JTAG selected.
TIP: J-Link does not have a SWJ setting. This is enabled automatically by the J-Link.
5. In the SW Device area: ARM CoreSight SW-DP MUST be displayed. This confirms you are connected to the target processor. If there is an error displayed or is blank this must be fixed before you can continue. Check the target power supply. Cycle the power to the ULINK and the board.
TIP: To refresh this screen select Port: and change it or click OK once to leave and then click on Settings again.
TIP: You can do regular debugging using either JTAG or SWD. SWD and JTAG operate at approximately the same speed. Serial Wire Viewer (SWV) will operate only in SW (SWD) mode.
2) Configure the Keil Flash Programmer:
6. Click on OK once and select the Utilities tab.
7. Select the ULINK similar to Step 2 above.
8. Click Settings to select a programming algorithm.
9. If an algorithm is not already selected, select Add and select MKxxN 512kB Prog Flash as shown below or the one for your processor:
10. Click on Add to select your chosen algorithm.
11. Click on OK once.
TIP: To program the Flash every time you enter Debug mode, check Update target before Debugging.
12. Click on OK to return to the main screen.
13. You have successfully connected to Kinetis.
14. At this point you can compile source code, program it into Flash, enter Debug mode, start and stop your program and set/unset breakpoints plus much more.
TIP: The Trace tab is where you configure the Serial Wire Viewer (SWV). You will learn to do this later.
TIP: If you select ULINK or ULINKpro, and have the opposite ULINK physically connected to your PC; the error message will say “No ULINK device found”. This message actually means that µVision found the wrong Keil adapter connected. Either select or connect the correct ULINK.
Copyright © 2013 ARM Ltd. ARM Limited or its affiliates. All rights reserved.
Freescale Kinetis Cortex-M4 Lab with ARM® Keil™ MDK toolkit www.keil.com/freescale
8
4) Configuring ULINKpro and µVision: KN60D100M examples are configured for ULINKpro by default. These steps are included for reference.
1. Assume a ULINKpro is connected to a powered up Kinetis target board, µVision is running in Edit mode (as it is when first started – the alternative to Debug mode) and you have selected a valid project. The ULINKpro is shown connected to the Freescale K60 Tower board on page 6.
1) Select the debug connection to the target:
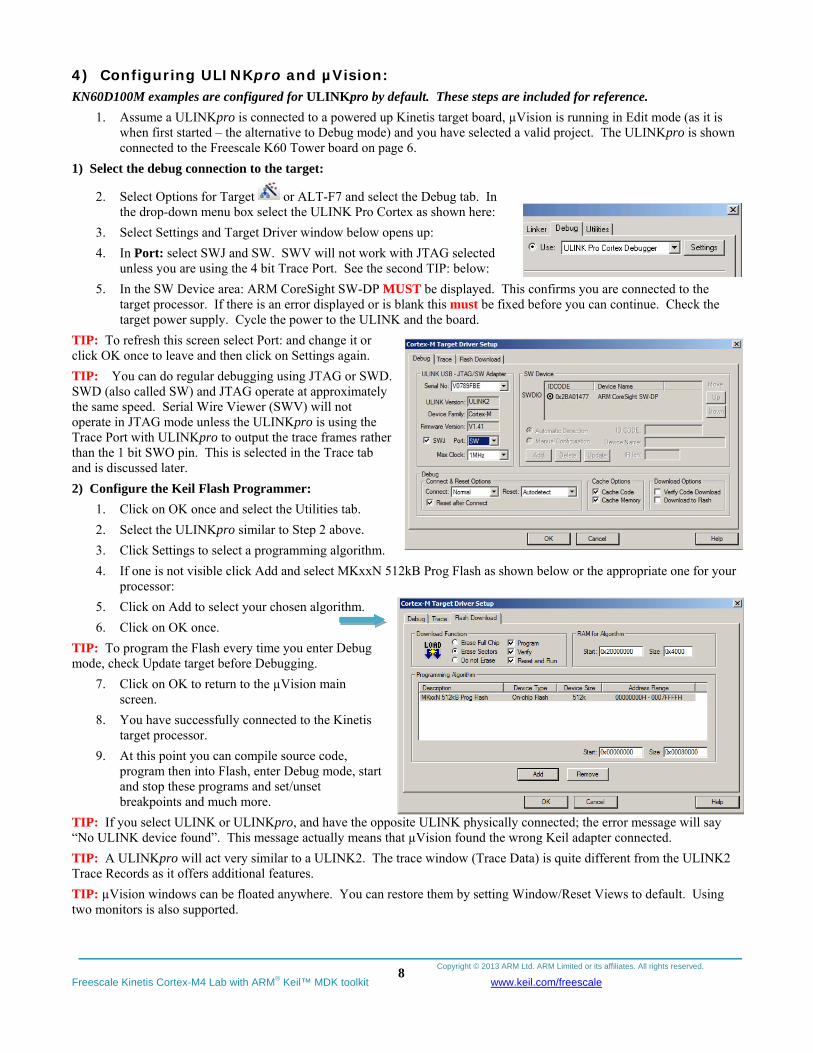
2. Select Options for Target or ALT-F7 and select the Debug tab. In the drop-down menu box select the ULINK Pro Cortex as shown here:
3. Select Settings and Target Driver window below opens up:
4. In Port: select SWJ and SW. SWV will not work with JTAG selected unless you are using the 4 bit Trace Port. See the second TIP: below:
5. In the SW Device area: ARM CoreSight SW-DP MUST be displayed. This confirms you are connected to the target processor. If there is an error displayed or is blank this must be fixed before you can continue. Check the target power supply. Cycle the power to the ULINK and the board.
TIP: To refresh this screen select Port: and change it or click OK once to leave and then click on Settings again.
TIP: You can do regular debugging using JTAG or SWD. SWD (also called SW) and JTAG operate at approximately the same speed. Serial Wire Viewer (SWV) will not operate in JTAG mode unless the ULINKpro is using the Trace Port with ULINKpro to output the trace frames rather than the 1 bit SWO pin. This is selected in the Trace tab and is discussed later.
2) Configure the Keil Flash Programmer:
1. Click on OK once and select the Utilities tab.
2. Select the ULINKpro similar to Step 2 above.
3. Click Settings to select a programming algorithm.
4. If one is not visible click Add and select MKxxN 512kB Prog Flash as shown below or the appropriate one for your processor:
5. Click on Add to select your chosen algorithm.
6. Click on OK once.
TIP: To program the Flash every time you enter Debug mode, check Update target before Debugging.
7. Click on OK to return to the µVision main screen.
8. You have successfully connected to the Kinetis target processor.
9. At this point you can compile source code, program then into Flash, enter Debug mode, start and stop these programs and set/unset breakpoints and much more.
TIP: If you select ULINK or ULINKpro, and have the opposite ULINK physically connected; the error message will say “No ULINK device found”. This message actually means that µVision found the wrong Keil adapter connected.
TIP: A ULINKpro will act very similar to a ULINK2. The trace window (Trace Data) is quite different from the ULINK2 Trace Records as it offers additional features.
TIP: µVision windows can be floated anywhere. You can restore them by setting Window/Reset Views to default. Using two monitors is also supported.
Copyright © 2013 ARM Ltd. ARM Limited or its affiliates. All rights reserved.
Freescale Kinetis Cortex-M4 Lab with ARM® Keil™ MDK toolkit www.keil.com/freescale
9
Part B: Keil Example Projects 1) Blinky example program using the Kinetis and ULINK2 or ULINK-ME: We will run the example program Blinky on a Kinetis processor using a ULINK2 or ULINK-ME. These instructions use a K60D100M Tower board. If you are using another Tower board or the Kwikstik, select the appropriate Blinky project. If you are unable to get this example working with your Kinetis Tower board, please contact the author or Keil tech support.
It is possible to use the ULINKpro or the P&E OSJTAG with this example. The Segger J-Link is also supported.
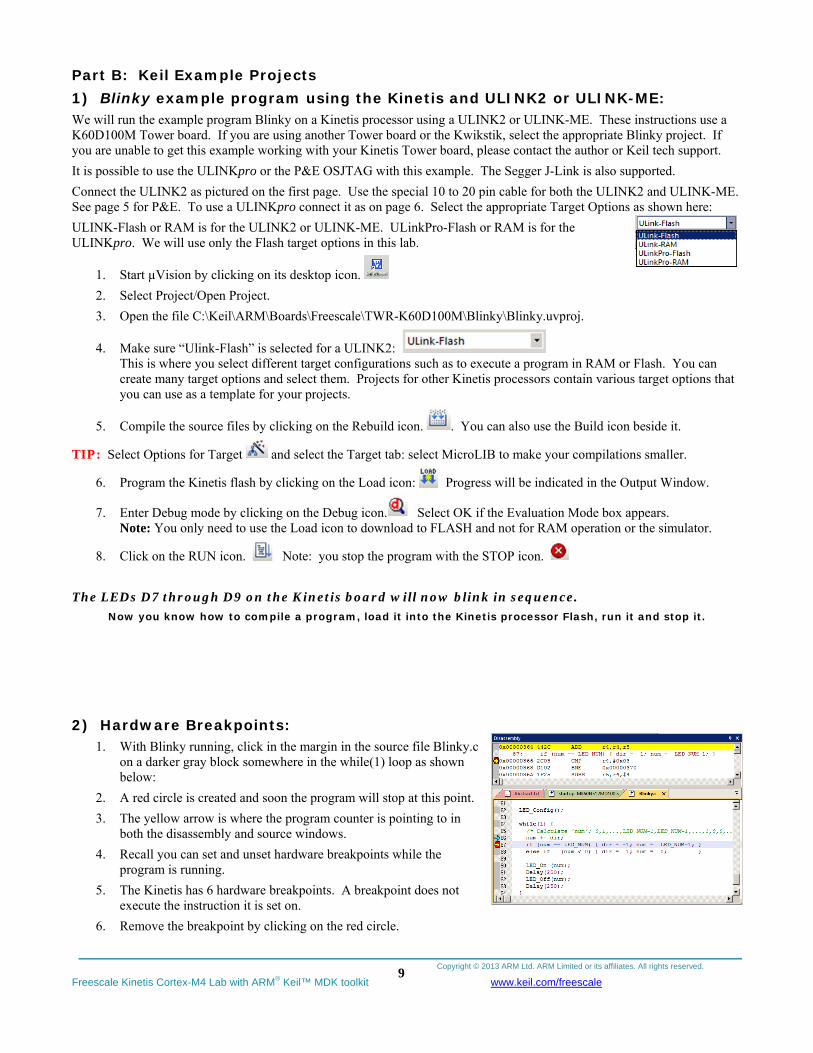
Connect the ULINK2 as pictured on the first page. Use the special 10 to 20 pin cable for both the ULINK2 and ULINK-ME. See page 5 for P&E. To use a ULINKpro connect it as on page 6. Select the appropriate Target Options as shown here:
ULINK-Flash or RAM is for the ULINK2 or ULINK-ME. ULinkPro-Flash or RAM is for the ULINKpro. We will use only the Flash target options in this lab.
1. Start µVision by clicking on its desktop icon.
2. Select Project/Open Project.
3. Open the file C:\Keil\ARM\Boards\Freescale\TWR-K60D100M\Blinky\Blinky.uvproj.
4. Make sure “Ulink-Flash” is selected for a ULINK2: This is where you select different target configurations such as to execute a program in RAM or Flash. You can create many target options and select them. Projects for other Kinetis processors contain various target options that you can use as a template for your projects.
5. Compile the source files by clicking on the Rebuild icon. . You can also use the Build icon beside it.
TIP: Select Options for Target and select the Target tab: select MicroLIB to make your compilations smaller.
6. Program the Kinetis flash by clicking on the Load icon: Progress will be indicated in the Output Window.
7. Enter Debug mode by clicking on the Debug icon. Select OK if the Evaluation Mode box appears. Note: You only need to use the Load icon to download to FLASH and not for RAM operation or the simulator.
8. Click on the RUN icon. Note: you stop the program with the STOP icon.
The LEDs D7 through D9 on the Kinetis board will now blink in sequence.
Now you know how to compile a program, load it into the Kinetis processor Flash, run it and stop it.
2) Hardware Breakpoints:
1. With Blinky running, click in the margin in the source file Blinky.c on a darker gray block somewhere in the while(1) loop as shown below:
2. A red circle is created and soon the program will stop at this point.
3. The yellow arrow is where the program counter is pointing to in both the disassembly and source windows.
4. Recall you can set and unset hardware breakpoints while the program is running.
5. The Kinetis has 6 hardware breakpoints. A breakpoint does not execute the instruction it is set on.
6. Remove the breakpoint by clicking on the red circle.
Copyright © 2013 ARM Ltd. ARM Limited or its affiliates. All rights reserved.
Freescale Kinetis Cortex-M4 Lab with ARM® Keil™ MDK toolkit www.keil.com/freescale
10
8) Call Stack + Locals Window: Local Variables: The Call Stack and Local windows are incorporated into one integrated window. Whenever the program is stopped, the Call Stack + Locals window will display call stack contents as well as any local variables belonging to the active function.
If possible, the values of the local variables will be displayed and if not the message <not in scope> will be displayed. The Call + Stack window presence or visibility can be toggled by selecting View/Call Stack window.
1. Run and Stop Blinky. Click on the Call Stack + Locals tab.
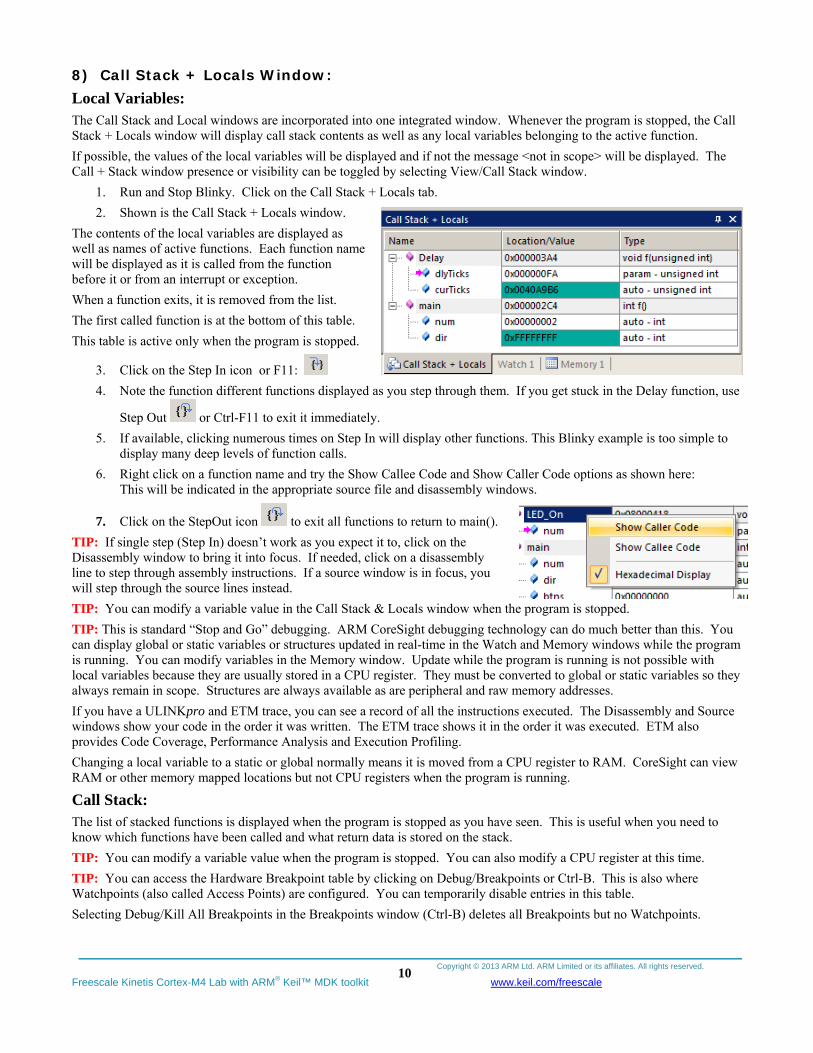
2. Shown is the Call Stack + Locals window.
The contents of the local variables are displayed as well as names of active functions. Each function name will be displayed as it is called from the function before it or from an interrupt or exception.
When a function exits, it is removed from the list.
The first called function is at the bottom of this table.
This table is active only when the program is stopped.
3. Click on the Step In icon or F11:
4. Note the function different functions displayed as you step through them. If you get stuck in the Delay function, use
Step Out or Ctrl-F11 to exit it immediately.
5. If available, clicking numerous times on Step In will display other functions. This Blinky example is too simple to display many deep levels of function calls.
6. Right click on a function name and try the Show Callee Code and Show Caller Code options as shown here: This will be indicated in the appropriate source file and disassembly windows.
7. Click on the StepOut icon to exit all functions to return to main().
TIP: If single step (Step In) doesn’t work as you expect it to, click on the Disassembly window to bring it into focus. If needed, click on a disassembly line to step through assembly instructions. If a source window is in focus, you will step through the source lines instead.
TIP: You can modify a variable value in the Call Stack & Locals window when the program is stopped.
TIP: This is standard “Stop and Go” debugging. ARM CoreSight debugging technology can do much better than this. You can display global or static variables or structures updated in real-time in the Watch and Memory windows while the program is running. You can modify variables in the Memory window. Update while the program is running is not possible with local variables because they are usually stored in a CPU register. They must be converted to global or static variables so they always remain in scope. Structures are always available as are peripheral and raw memory addresses.
If you have a ULINKpro and ETM trace, you can see a record of all the instructions executed. The Disassembly and Source windows show your code in the order it was written. The ETM trace shows it in the order it was executed. ETM also provides Code Coverage, Performance Analysis and Execution Profiling.
Changing a local variable to a static or global normally means it is moved from a CPU register to RAM. CoreSight can view RAM or other memory mapped locations but not CPU registers when the program is running.
Call Stack: The list of stacked functions is displayed when the program is stopped as you have seen. This is useful when you need to know which functions have been called and what return data is stored on the stack.
TIP: You can modify a variable value when the program is stopped. You can also modify a CPU register at this time.
TIP: You can access the Hardware Breakpoint table by clicking on Debug/Breakpoints or Ctrl-B. This is also where Watchpoints (also called Access Points) are configured. You can temporarily disable entries in this table.
Selecting Debug/Kill All Breakpoints in the Breakpoints window (Ctrl-B) deletes all Breakpoints but no Watchpoints.
Copyright © 2013 ARM Ltd. ARM Limited or its affiliates. All rights reserved.
Freescale Kinetis Cortex-M4 Lab with ARM® Keil™ MDK toolkit www.keil.com/freescale
11
4) Watch and Memory Windows and how to use them: The Watch and Memory windows will display updated variable values in real-time. It does this using ARM CoreSight debugging technology that is part of Cortex-M processors. It is also possible to “put” or insert values into memory locations using the Memory window in real-time. It is possible to “drag and drop” variables into windows or enter them manually.
a) Watch window:
1. You can do the following steps while the CPU is running. Click on RUN if desired.
2. In the file Blinky.c locate the volatile variable msTicks. It will be near line 19.
3. In Blinky.c, right click on msTicks and select Add msTicks to … and select Watch 1. msTicks will be displayed
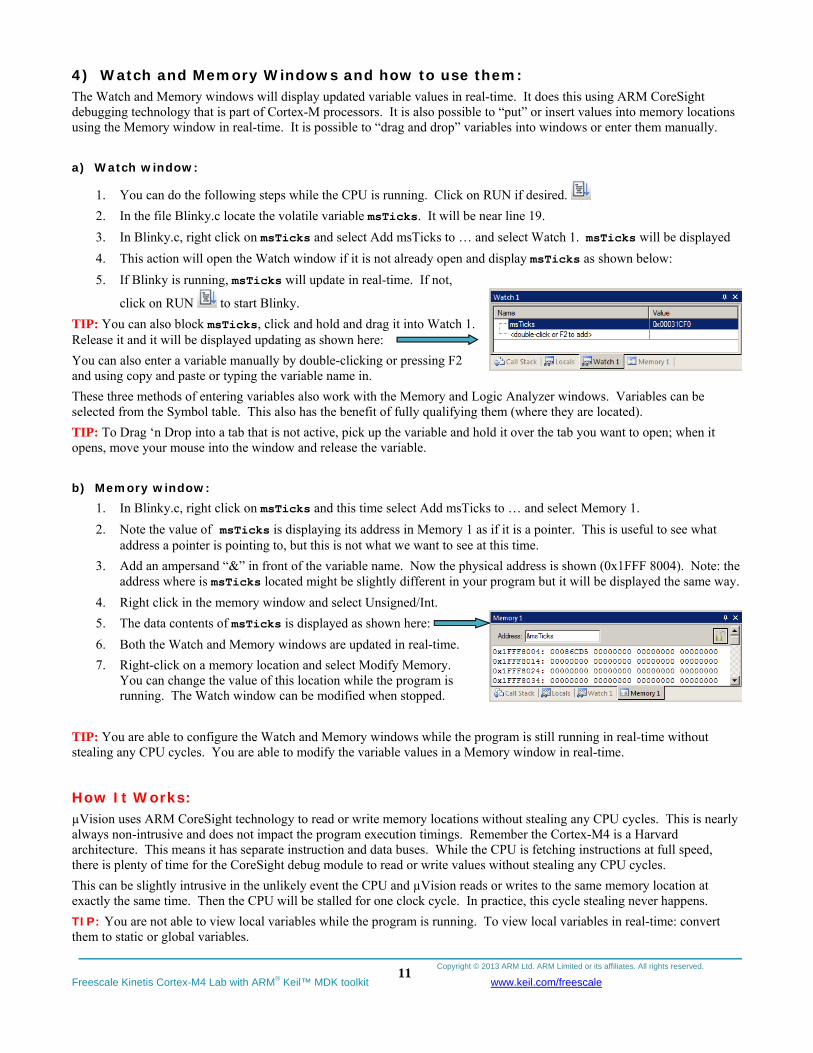
4. This action will open the Watch window if it is not already open and display msTicks as shown below:
5. If Blinky is running, msTicks will update in real-time. If not,
click on RUN to start Blinky.
TIP: You can also block msTicks, click and hold and drag it into Watch 1. Release it and it will be displayed updating as shown here:
You can also enter a variable manually by double-clicking or pressing F2 and using copy and paste or typing the variable name in.
These three methods of entering variables also work with the Memory and Logic Analyzer windows. Variables can be selected from the Symbol table. This also has the benefit of fully qualifying them (where they are located).
TIP: To Drag ‘n Drop into a tab that is not active, pick up the variable and hold it over the tab you want to open; when it opens, move your mouse into the window and release the variable.
b) Memory window:
1. In Blinky.c, right click on msTicks and this time select Add msTicks to … and select Memory 1.
2. Note the value of msTicks is displaying its address in Memory 1 as if it is a pointer. This is useful to see what address a pointer is pointing to, but this is not what we want to see at this time.
3. Add an ampersand “&” in front of the variable name. Now the physical address is shown (0x1FFF 8004). Note: the address where is msTicks located might be slightly different in your program but it will be displayed the same way.
4. Right click in the memory window and select Unsigned/Int.
5. The data contents of msTicks is displayed as shown here:
6. Both the Watch and Memory windows are updated in real-time.
7. Right-click on a memory location and select Modify Memory. You can change the value of this location while the program is running. The Watch window can be modified when stopped.
TIP: You are able to configure the Watch and Memory windows while the program is still running in real-time without stealing any CPU cycles. You are able to modify the variable values in a Memory window in real-time.
How It Works: µVision uses ARM CoreSight technology to read or write memory locations without stealing any CPU cycles. This is nearly always non-intrusive and does not impact the program execution timings. Remember the Cortex-M4 is a Harvard architecture. This means it has separate instruction and data buses. While the CPU is fetching instructions at full speed, there is plenty of time for the CoreSight debug module to read or write values without stealing any CPU cycles.
This can be slightly intrusive in the unlikely event the CPU and µVision reads or writes to the same memory location at exactly the same time. Then the CPU will be stalled for one clock cycle. In practice, this cycle stealing never happens.
TIP: You are not able to view local variables while the program is running. To view local variables in real-time: convert them to static or global variables.
Copyright © 2013 ARM Ltd. ARM Limited or its affiliates. All rights reserved.
Freescale Kinetis Cortex-M4 Lab with ARM® Keil™ MDK toolkit www.keil.com/freescale
12
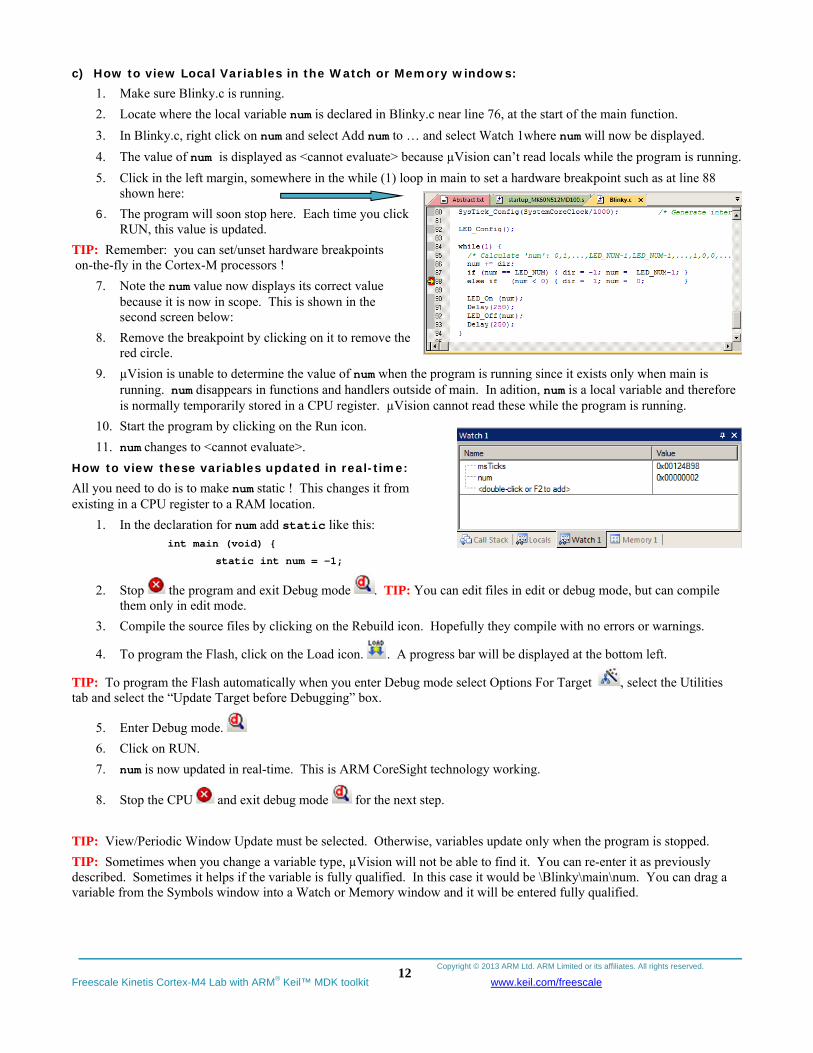
c) How to view Local Variables in the Watch or Memory windows: 1. Make sure Blinky.c is running.
2. Locate where the local variable num is declared in Blinky.c near line 76, at the start of the main function.
3. In Blinky.c, right click on num and select Add num to … and select Watch 1where num will now be displayed.
4. The value of num is displayed as <cannot evaluate> because µVision can’t read locals while the program is running.
5. Click in the left margin, somewhere in the while (1) loop in main to set a hardware breakpoint such as at line 88 shown here:
6. The program will soon stop here. Each time you click RUN, this value is updated.
TIP: Remember: you can set/unset hardware breakpoints on-the-fly in the Cortex-M processors !
7. Note the num value now displays its correct value because it is now in scope. This is shown in the second screen below:
8. Remove the breakpoint by clicking on it to remove the red circle.
9. µVision is unable to determine the value of num when the program is running since it exists only when main is running. num disappears in functions and handlers outside of main. In adition, num is a local variable and therefore is normally temporarily stored in a CPU register. µVision cannot read these while the program is running.
10. Start the program by clicking on the Run icon.
11. num changes to <cannot evaluate>.
How to view these variables updated in real-time: All you need to do is to make num static ! This changes it from existing in a CPU register to a RAM location.
1. In the declaration for num add static like this: int main (void) {
static int num = -1;
2. Stop the program and exit Debug mode . TIP: You can edit files in edit or debug mode, but can compile them only in edit mode.
3. Compile the source files by clicking on the Rebuild icon. Hopefully they compile with no errors or warnings.
4. To program the Flash, click on the Load icon. . A progress bar will be displayed at the bottom left.
TIP: To program the Flash automatically when you enter Debug mode select Options For Target , select the Utilities tab and select the “Update Target before Debugging” box.
5. Enter Debug mode.
6. Click on RUN.
7. num is now updated in real-time. This is ARM CoreSight technology working.
8. Stop the CPU and exit debug mode for the next step.
TIP: View/Periodic Window Update must be selected. Otherwise, variables update only when the program is stopped.
TIP: Sometimes when you change a variable type, µVision will not be able to find it. You can re-enter it as previously described. Sometimes it helps if the variable is fully qualified. In this case it would be \Blinky\main\num. You can drag a variable from the Symbols window into a Watch or Memory window and it will be entered fully qualified.
Copyright © 2013 ARM Ltd. ARM Limited or its affiliates. All rights reserved.
Freescale Kinetis Cortex-M4 Lab with ARM® Keil™ MDK toolkit www.keil.com/freescale
13
5) Getting the Serial Wire Viewer (SWV) working: Serial Wire Viewer provides data trace information including interrupts in real-time without any code stubs in your sources.
a) For ULINK2 or ULINK-ME: Configuration must be set as on page 7 (ULINKpro instructions are on page 8). Segger J-Link instructions are very similar to ULINK2. The differences are intuitive to work around.
Configure SWV:
1. µVision must be stopped and in edit mode (not debug mode).
2. Select Options for Target or ALT-F7 and select the Debug tab.
3. Click on Settings: beside the name of your adapter on the right side of the window.
4. Confirm Port: is set to SW and SWJ box is selected for SWD operation instead of JTAG.
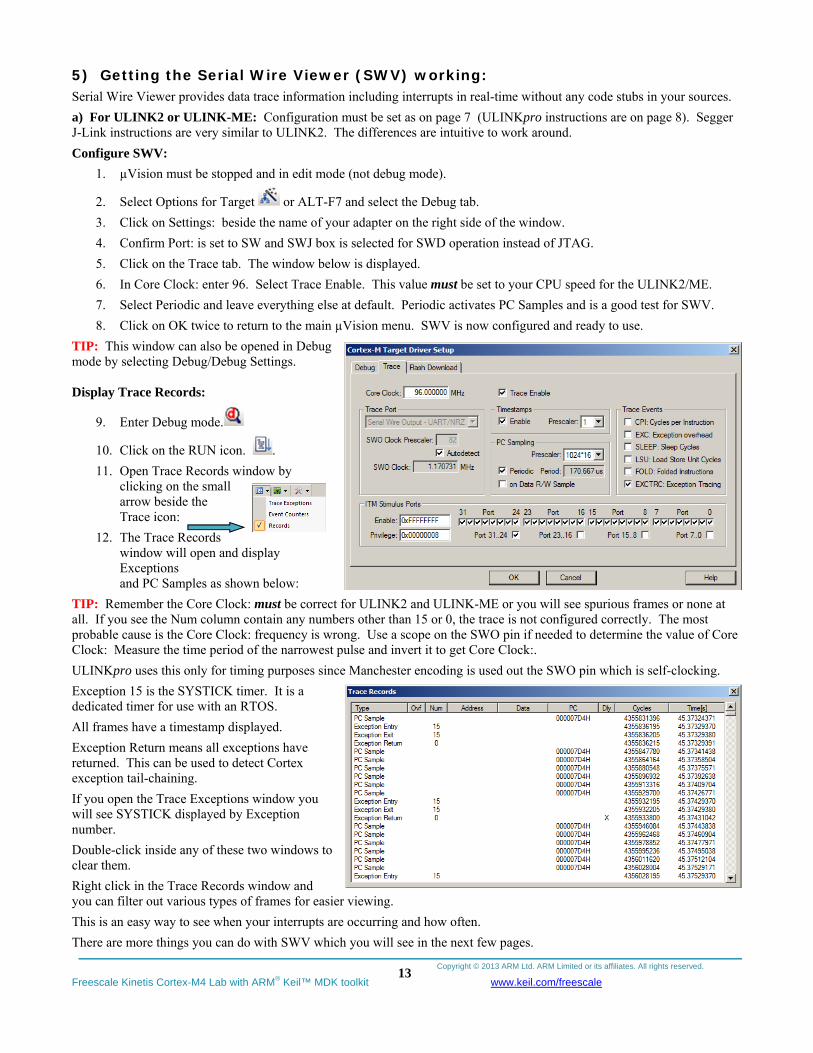
5. Click on the Trace tab. The window below is displayed.
6. In Core Clock: enter 96. Select Trace Enable. This value must be set to your CPU speed for the ULINK2/ME.
7. Select Periodic and leave everything else at default. Periodic activates PC Samples and is a good test for SWV.
8. Click on OK twice to return to the main µVision menu. SWV is now configured and ready to use.
TIP: This window can also be opened in Debug mode by selecting Debug/Debug Settings. Display Trace Records:
9. Enter Debug mode.
10. Click on the RUN icon. .
11. Open Trace Records window by clicking on the small arrow beside the Trace icon:
12. The Trace Records window will open and display Exceptions and PC Samples as shown below:
TIP: Remember the Core Clock: must be correct for ULINK2 and ULINK-ME or you will see spurious frames or none at all. If you see the Num column contain any numbers other than 15 or 0, the trace is not configured correctly. The most probable cause is the Core Clock: frequency is wrong. Use a scope on the SWO pin if needed to determine the value of Core Clock: Measure the time period of the narrowest pulse and invert it to get Core Clock:.
ULINKpro uses this only for timing purposes since Manchester encoding is used out the SWO pin which is self-clocking.
Exception 15 is the SYSTICK timer. It is a dedicated timer for use with an RTOS.
All frames have a timestamp displayed.
Exception Return means all exceptions have returned. This can be used to detect Cortex exception tail-chaining.
If you open the Trace Exceptions window you will see SYSTICK displayed by Exception number.
Double-click inside any of these two windows to clear them.
Right click in the Trace Records window and you can filter out various types of frames for easier viewing.
This is an easy way to see when your interrupts are occurring and how often.
There are more things you can do with SWV which you will see in the next few pages.
Copyright © 2013 ARM Ltd. ARM Limited or its affiliates. All rights reserved.
Freescale Kinetis Cortex-M4 Lab with ARM® Keil™ MDK toolkit www.keil.com/freescale
14
b) For ULINKpro: This is not ETM trace. See page 31 for ETM trace.
1) Configure SWV:
1. µVision must be stopped and in edit mode (not debug mode).
2. Confirm ULINKpro is configured as found on page 8: 4) Configuring ULINKpro and µVision: SW MUST be selected as well as SWJ.
3. Select Options for Target or ALT-F7 and select the Debug tab.
4. Click on Settings: beside the name of your adapter on the right side of the window.
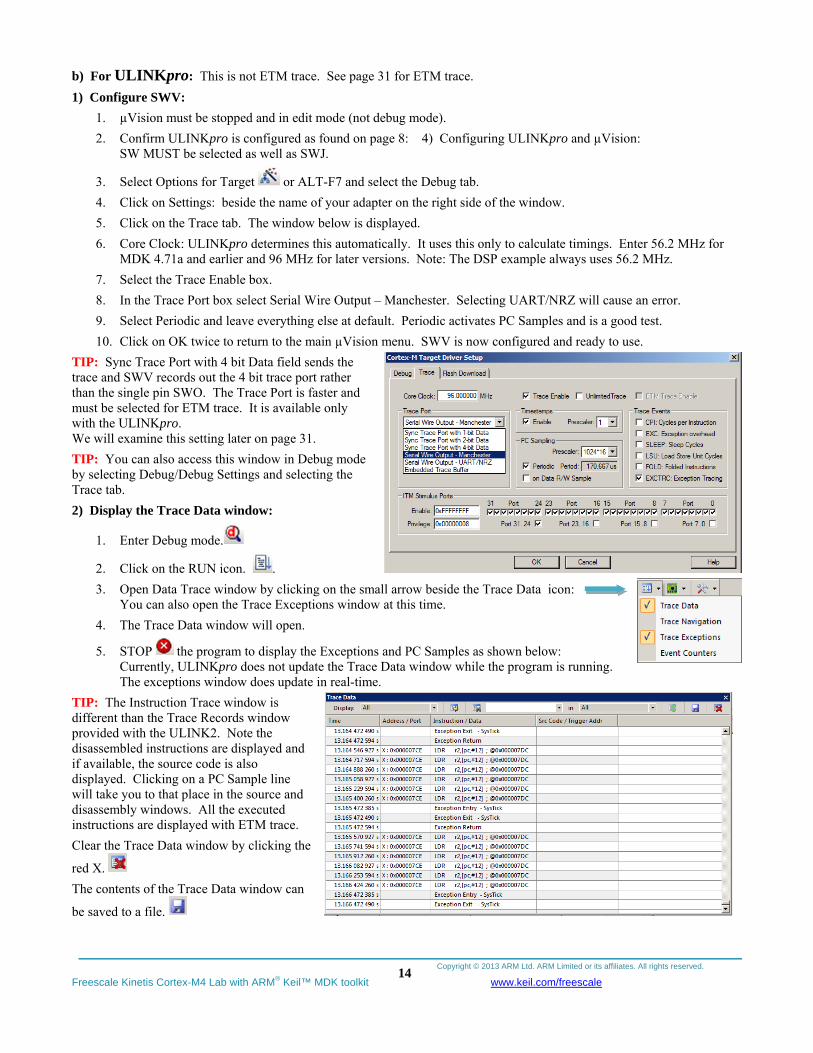
5. Click on the Trace tab. The window below is displayed.
6. Core Clock: ULINKpro determines this automatically. It uses this only to calculate timings. Enter 56.2 MHz for MDK 4.71a and earlier and 96 MHz for later versions. Note: The DSP example always uses 56.2 MHz.
7. Select the Trace Enable box.
8. In the Trace Port box select Serial Wire Output – Manchester. Selecting UART/NRZ will cause an error.
9. Select Periodic and leave everything else at default. Periodic activates PC Samples and is a good test.
10. Click on OK twice to return to the main µVision menu. SWV is now configured and ready to use.
TIP: Sync Trace Port with 4 bit Data field sends the trace and SWV records out the 4 bit trace port rather than the single pin SWO. The Trace Port is faster and must be selected for ETM trace. It is available only with the ULINKpro. We will examine this setting later on page 31.
TIP: You can also access this window in Debug mode by selecting Debug/Debug Settings and selecting the Trace tab.
2) Display the Trace Data window:
1. Enter Debug mode.
2. Click on the RUN icon. .
3. Open Data Trace window by clicking on the small arrow beside the Trace Data icon: You can also open the Trace Exceptions window at this time.
4. The Trace Data window will open.
5. STOP the program to display the Exceptions and PC Samples as shown below: Currently, ULINKpro does not update the Trace Data window while the program is running. The exceptions window does update in real-time.
TIP: The Instruction Trace window is different than the Trace Records window provided with the ULINK2. Note the disassembled instructions are displayed and if available, the source code is also displayed. Clicking on a PC Sample line will take you to that place in the source and disassembly windows. All the executed instructions are displayed with ETM trace.
Clear the Trace Data window by clicking the
red X.
The contents of the Trace Data window can
be saved to a file.
Copyright © 2013 ARM Ltd. ARM Limited or its affiliates. All rights reserved.
Freescale Kinetis Cortex-M4 Lab with ARM® Keil™ MDK toolkit www.keil.com/freescale
15
6) Using the Logic Analyzer (LA) with ULINK2 or ULINK-ME: This example will use the ULINK2 with the Blinky example. Please connect a ULINK2 or ULINK-ME to your Kinetis board and configure it for Serial Wire Viewer (SWV) trace. If you want to use a ULINKpro you will have to make appropriate modifications to the configuration instructions. This exercise does not require ETM configuration.
µVision has a graphical Logic Analyzer (LA) window. Up to four variables can be displayed in real-time using the Serial Wire Viewer as implemented in the Kinetis. This is shared with the Watchpoints.
1. SWV must be configured as found on page 13 or page 14 for ULINKpro Exit debug mode if not already.
2. Select Ulink-Flash: Or ULINKPro-Flash as appropriate.
3. In Blinky.c, near line 32, add the line: msTicks=0; just after uint32_t curTicks; and before curTicks = msTicks;
4. Compile the source files by clicking on the Rebuild icon. .
5. Program the Kinetis flash by clicking on the Load icon: Progress will be indicated in the Output Window.
6. Enter Debug mode by clicking on the Debug icon. Select OK if the Evaluation Mode box appears.
7. Select Debug/Debug Settings and select the Trace tab.
8. Unselect Periodic and EXCTRC. This is to prevent SWV overrun. Click OK twice to return to the main menu.
9. Run the program. . TIP: Recall you can configure the LA while the program is running or stopped.
10. Open View/Analysis Windows and select Logic Analyzer or select the LA window on the toolbar.
11. Locate the volatile variable msTicks in Blinky.c. It is declared near line 19.
12. Right click on msTicks and select Add msTicks to… and select Logic Analyzer.
13. Click on Setup and set Max: in Display Range to 0xFF. Click on close. The LA is completely configured now.
14. msTicks should still be in the Watch and Memory windows. It should be incrementing if the program is running.
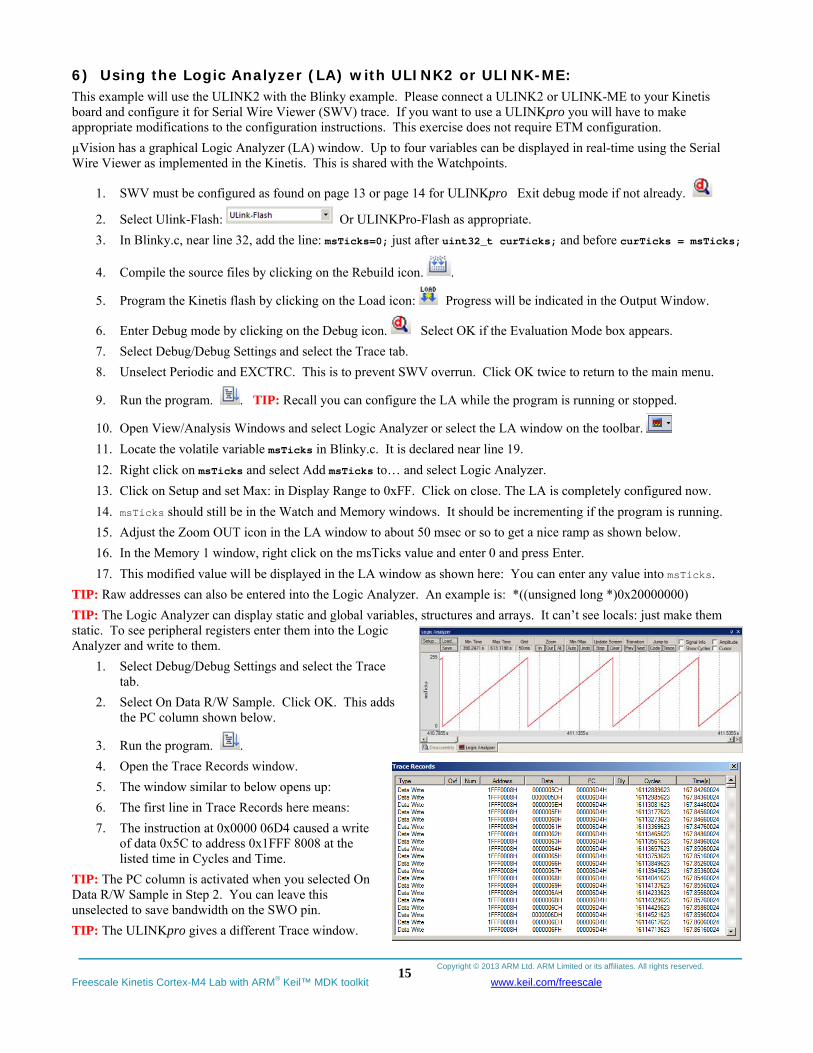
15. Adjust the Zoom OUT icon in the LA window to about 50 msec or so to get a nice ramp as shown below.
16. In the Memory 1 window, right click on the msTicks value and enter 0 and press Enter.
17. This modified value will be displayed in the LA window as shown here: You can enter any value into msTicks.
TIP: Raw addresses can also be entered into the Logic Analyzer. An example is: *((unsigned long *)0x20000000)
TIP: The Logic Analyzer can display static and global variables, structures and arrays. It can’t see locals: just make them static. To see peripheral registers enter them into the Logic Analyzer and write to them.
1. Select Debug/Debug Settings and select the Trace tab.
2. Select On Data R/W Sample. Click OK. This adds the PC column shown below.
3. Run the program. .
4. Open the Trace Records window.
5. The window similar to below opens up:
6. The first line in Trace Records here means:
7. The instruction at 0x0000 06D4 caused a write of data 0x5C to address 0x1FFF 8008 at the listed time in Cycles and Time.
TIP: The PC column is activated when you selected On Data R/W Sample in Step 2. You can leave this unselected to save bandwidth on the SWO pin.
TIP: The ULINKpro gives a different Trace window.
Copyright © 2013 ARM Ltd. ARM Limited or its affiliates. All rights reserved.
Freescale Kinetis Cortex-M4 Lab with ARM® Keil™ MDK toolkit www.keil.com/freescale
16
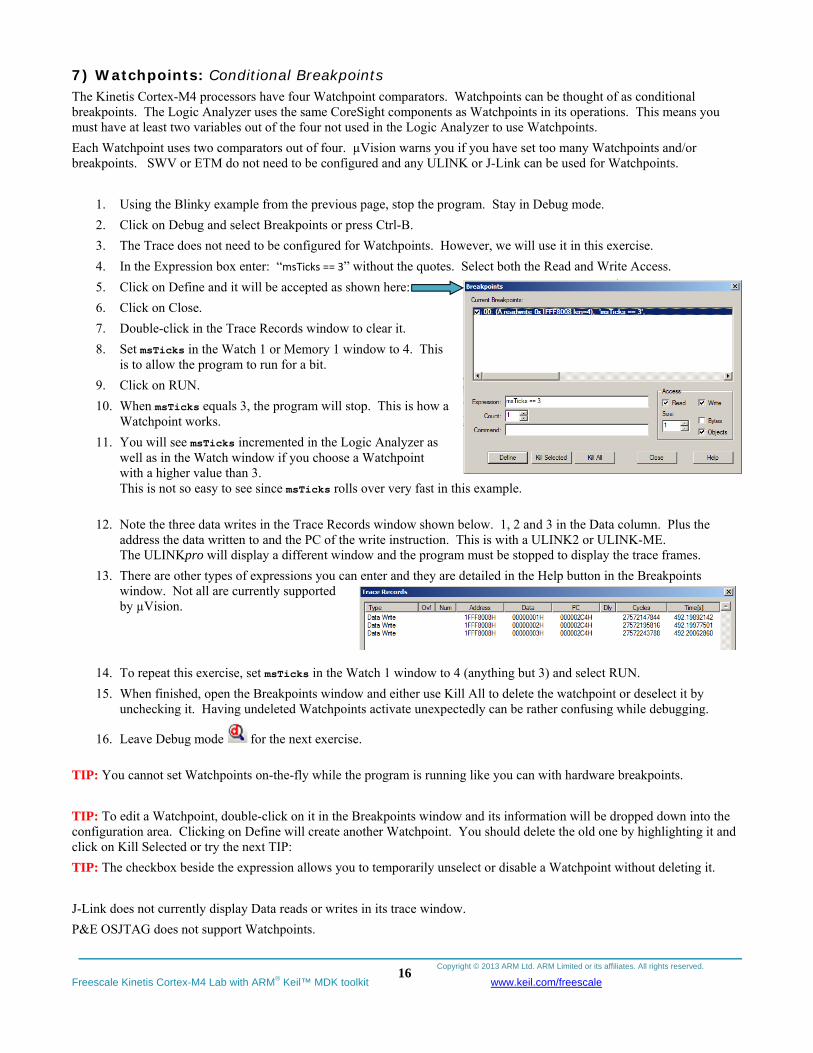
7) Watchpoints: Conditional Breakpoints The Kinetis Cortex-M4 processors have four Watchpoint comparators. Watchpoints can be thought of as conditional breakpoints. The Logic Analyzer uses the same CoreSight components as Watchpoints in its operations. This means you must have at least two variables out of the four not used in the Logic Analyzer to use Watchpoints.
Each Watchpoint uses two comparators out of four. µVision warns you if you have set too many Watchpoints and/or breakpoints. SWV or ETM do not need to be configured and any ULINK or J-Link can be used for Watchpoints.
1. Using the Blinky example from the previous page, stop the program. Stay in Debug mode.
2. Click on Debug and select Breakpoints or press Ctrl-B.
3. The Trace does not need to be configured for Watchpoints. However, we will use it in this exercise.
4. In the Expression box enter: “msTicks == 3” without the quotes. Select both the Read and Write Access.
5. Click on Define and it will be accepted as shown here:
6. Click on Close.
7. Double-click in the Trace Records window to clear it.
8. Set msTicks in the Watch 1 or Memory 1 window to 4. This is to allow the program to run for a bit.
9. Click on RUN.
10. When msTicks equals 3, the program will stop. This is how a Watchpoint works.
11. You will see msTicks incremented in the Logic Analyzer as well as in the Watch window if you choose a Watchpoint with a higher value than 3. This is not so easy to see since msTicks rolls over very fast in this example.
12. Note the three data writes in the Trace Records window shown below. 1, 2 and 3 in the Data column. Plus the address the data written to and the PC of the write instruction. This is with a ULINK2 or ULINK-ME. The ULINKpro will display a different window and the program must be stopped to display the trace frames.
13. There are other types of expressions you can enter and they are detailed in the Help button in the Breakpoints window. Not all are currently supported by µVision.
14. To repeat this exercise, set msTicks in the Watch 1 window to 4 (anything but 3) and select RUN.
15. When finished, open the Breakpoints window and either use Kill All to delete the watchpoint or deselect it by unchecking it. Having undeleted Watchpoints activate unexpectedly can be rather confusing while debugging.
16. Leave Debug mode for the next exercise.
TIP: You cannot set Watchpoints on-the-fly while the program is running like you can with hardware breakpoints.
TIP: To edit a Watchpoint, double-click on it in the Breakpoints window and its information will be dropped down into the configuration area. Clicking on Define will create another Watchpoint. You should delete the old one by highlighting it and click on Kill Selected or try the next TIP:
TIP: The checkbox beside the expression allows you to temporarily unselect or disable a Watchpoint without deleting it.
J-Link does not currently display Data reads or writes in its trace window.
P&E OSJTAG does not support Watchpoints.
Copyright © 2013 ARM Ltd. ARM Limited or its affiliates. All rights reserved.
Freescale Kinetis Cortex-M4 Lab with ARM® Keil™ MDK toolkit www.keil.com/freescale
17
8) RTX_Blinky Example Program with Keil RTX RTOS: A Stepper Motor example Keil provides RTX, a full feature RTOS is a component of MDK.
RTX now comes with a BSD license and is incorporated in MDK or is available from www.keil.com/demo/eval/rtx.htm.
RTX_Blinky uses a ULINKpro as default. If you are using a ULINK2 or J-Link please configure it in steps 5 through 10. We will add a Target Option for the ULINK2. You could also just modify the existing target option.
1. Connect the ULINK2 as pictured on the first page. Use the special 10 to 20 pin cable for both the ULINK2 and ULINK-ME. See pages 5 for P&E. ULINKpro is configured with this Blinky project. Connect it as on page 6.
2. With uVision in Edit mode Select Project/Open Project.
3. Open C:\Keil\ARM\Boards\Freescale\TWR-K60D100M\RTX_Blinky\Blinky.uvproj.
4. Select Ulink-Flash: Or ULINKPro-Flash as appropriate.
5. This is where you select different target configurations such as to execute a program in RAM or Flash.
6. Compile the source files by clicking on the Rebuild icon. . They will compile with no errors or warnings.
7. To program the Flash manually, click on the Load icon. . A progress bar will be at the bottom left.
8. Enter the Debug mode by clicking on the debug icon and click on the RUN icon.
9. Three LEDs will blink indicating the three of the four waveforms of a stepper motor driver changing.
10. Click on STOP .
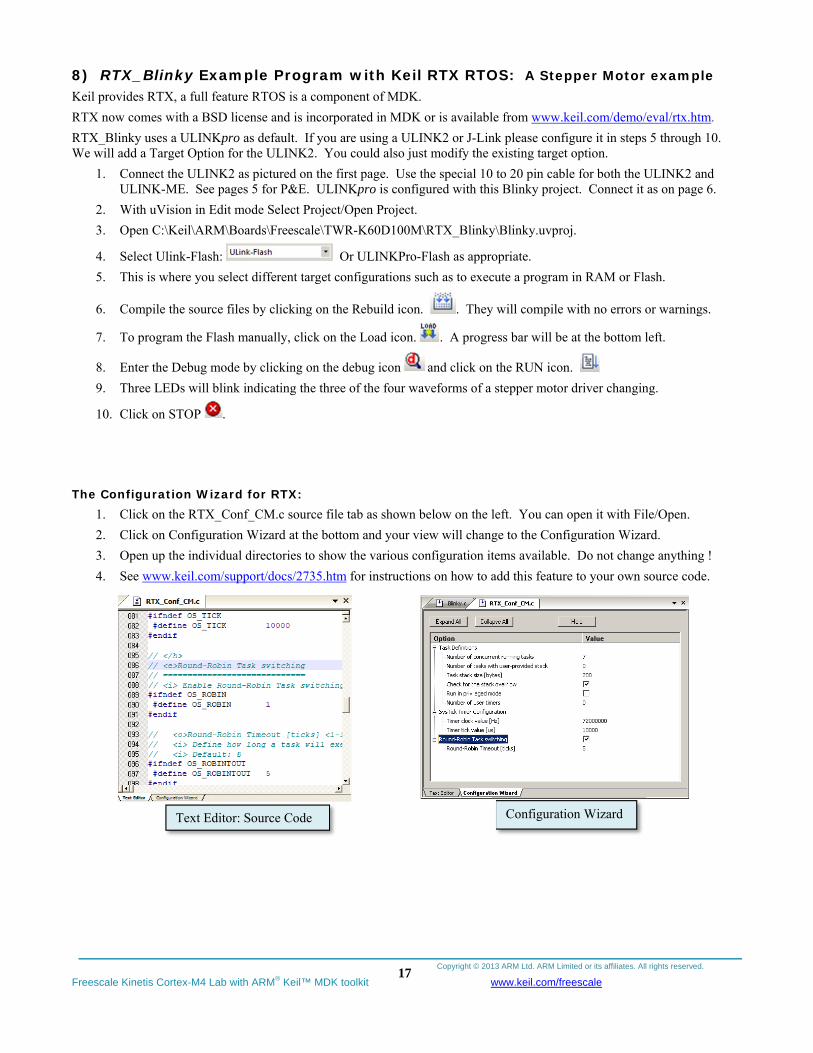
The Configuration Wizard for RTX:
1. Click on the RTX_Conf_CM.c source file tab as shown below on the left. You can open it with File/Open.
2. Click on Configuration Wizard at the bottom and your view will change to the Configuration Wizard.
3. Open up the individual directories to show the various configuration items available. Do not change anything !
4. See www.keil.com/support/docs/2735.htm for instructions on how to add this feature to your own source code.
Text Editor: Source Code Configuration Wizard
Copyright © 2013 ARM Ltd. ARM Limited or its affiliates. All rights reserved.
Freescale Kinetis Cortex-M4 Lab with ARM® Keil™ MDK toolkit www.keil.com/freescale
18
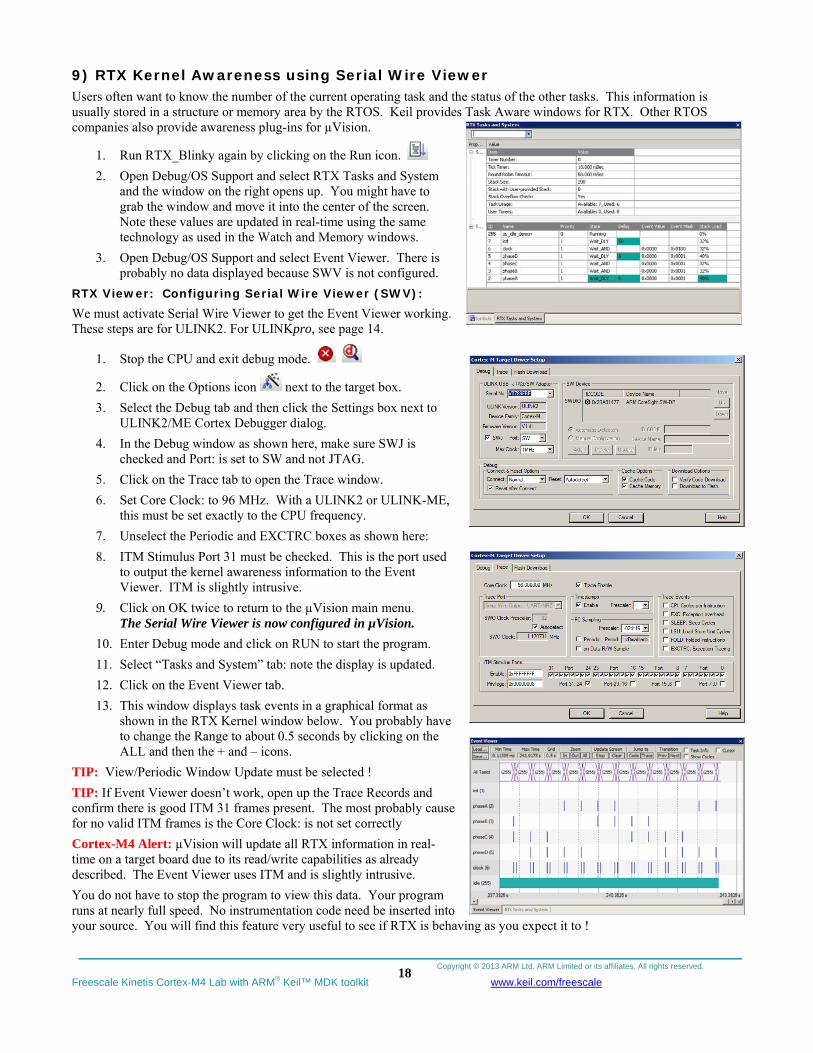
9) RTX Kernel Awareness using Serial Wire Viewer Users often want to know the number of the current operating task and the status of the other tasks. This information is usually stored in a structure or memory area by the RTOS. Keil provides Task Aware windows for RTX. Other RTOS companies also provide awareness plug-ins for µVision.
1. Run RTX_Blinky again by clicking on the Run icon.
2. Open Debug/OS Support and select RTX Tasks and System and the window on the right opens up. You might have to grab the window and move it into the center of the screen. Note these values are updated in real-time using the same technology as used in the Watch and Memory windows.
3. Open Debug/OS Support and select Event Viewer. There is probably no data displayed because SWV is not configured.
RTX Viewer: Configuring Serial Wire Viewer (SWV): We must activate Serial Wire Viewer to get the Event Viewer working. These steps are for ULINK2. For ULINKpro, see page 14.
1. Stop the CPU and exit debug mode.
2. Click on the Options icon next to the target box.
3. Select the Debug tab and then click the Settings box next to ULINK2/ME Cortex Debugger dialog.
4. In the Debug window as shown here, make sure SWJ is checked and Port: is set to SW and not JTAG.
5. Click on the Trace tab to open the Trace window.
6. Set Core Clock: to 96 MHz. With a ULINK2 or ULINK-ME, this must be set exactly to the CPU frequency.
7. Unselect the Periodic and EXCTRC boxes as shown here:
8. ITM Stimulus Port 31 must be checked. This is the port used to output the kernel awareness information to the Event Viewer. ITM is slightly intrusive.
9. Click on OK twice to return to the µVision main menu. The Serial Wire Viewer is now configured in µVision.
10. Enter Debug mode and click on RUN to start the program.
11. Select “Tasks and System” tab: note the display is updated.
12. Click on the Event Viewer tab.
13. This window displays task events in a graphical format as shown in the RTX Kernel window below. You probably have to change the Range to about 0.5 seconds by clicking on the ALL and then the + and – icons.
TIP: View/Periodic Window Update must be selected !
TIP: If Event Viewer doesn’t work, open up the Trace Records and confirm there is good ITM 31 frames present. The most probably cause for no valid ITM frames is the Core Clock: is not set correctly
Cortex-M4 Alert: µVision will update all RTX information in real-time on a target board due to its read/write capabilities as already described. The Event Viewer uses ITM and is slightly intrusive.
You do not have to stop the program to view this data. Your program runs at nearly full speed. No instrumentation code need be inserted into your source. You will find this feature very useful to see if RTX is behaving as you expect it to !
Copyright © 2013 ARM Ltd. ARM Limited or its affiliates. All rights reserved.
Freescale Kinetis Cortex-M4 Lab with ARM® Keil™ MDK toolkit www.keil.com/freescale
19
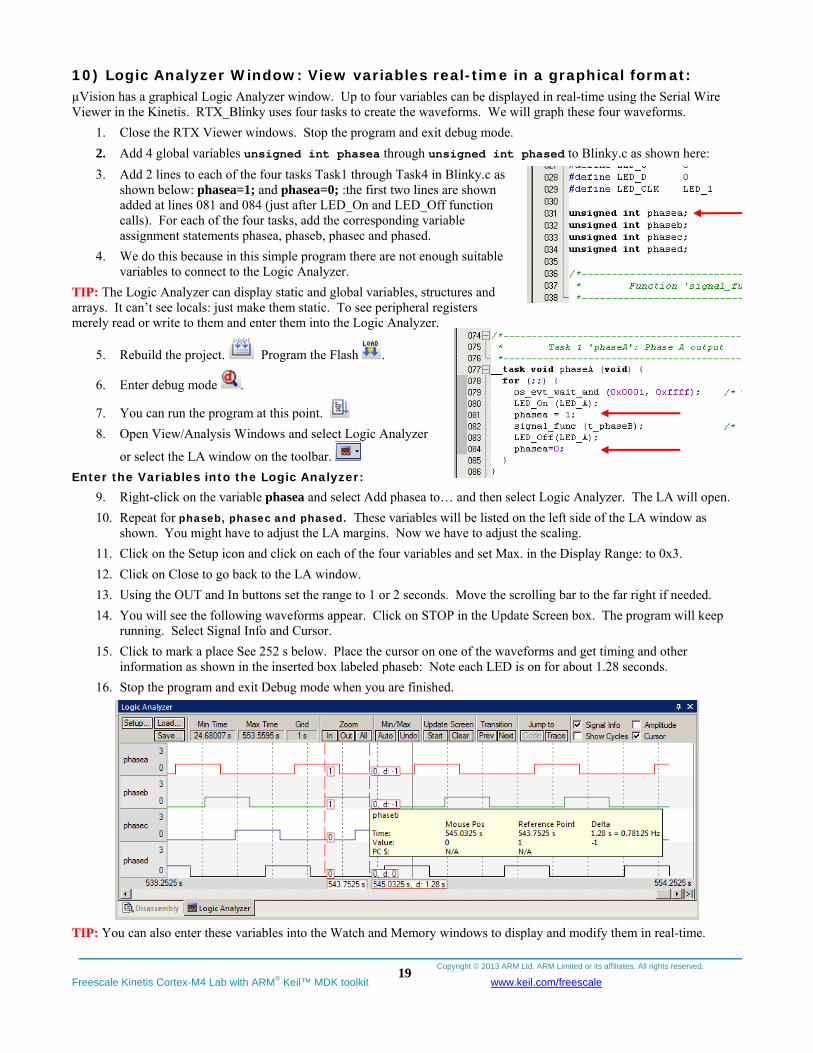
10) Logic Analyzer Window: View variables real-time in a graphical format: µVision has a graphical Logic Analyzer window. Up to four variables can be displayed in real-time using the Serial Wire Viewer in the Kinetis. RTX_Blinky uses four tasks to create the waveforms. We will graph these four waveforms.
1. Close the RTX Viewer windows. Stop the program and exit debug mode.
2. Add 4 global variables unsigned int phasea through unsigned int phased to Blinky.c as shown here:
3. Add 2 lines to each of the four tasks Task1 through Task4 in Blinky.c as shown below: phasea=1; and phasea=0; :the first two lines are shown added at lines 081 and 084 (just after LED_On and LED_Off function calls). For each of the four tasks, add the corresponding variable assignment statements phasea, phaseb, phasec and phased.
4. We do this because in this simple program there are not enough suitable variables to connect to the Logic Analyzer.
TIP: The Logic Analyzer can display static and global variables, structures and arrays. It can’t see locals: just make them static. To see peripheral registers merely read or write to them and enter them into the Logic Analyzer.
5. Rebuild the project. Program the Flash .
6. Enter debug mode .
7. You can run the program at this point.
8. Open View/Analysis Windows and select Logic Analyzer
or select the LA window on the toolbar.
Enter the Variables into the Logic Analyzer: 9. Right-click on the variable phasea and select Add phasea to… and then select Logic Analyzer. The LA will open.
10. Repeat for phaseb, phasec and phased. These variables will be listed on the left side of the LA window as shown. You might have to adjust the LA margins. Now we have to adjust the scaling.
11. Click on the Setup icon and click on each of the four variables and set Max. in the Display Range: to 0x3.
12. Click on Close to go back to the LA window.
13. Using the OUT and In buttons set the range to 1 or 2 seconds. Move the scrolling bar to the far right if needed.
14. You will see the following waveforms appear. Click on STOP in the Update Screen box. The program will keep running. Select Signal Info and Cursor.
15. Click to mark a place See 252 s below. Place the cursor on one of the waveforms and get timing and other information as shown in the inserted box labeled phaseb: Note each LED is on for about 1.28 seconds.
16. Stop the program and exit Debug mode when you are finished.
TIP: You can also enter these variables into the Watch and Memory windows to display and modify them in real-time.
Copyright © 2013 ARM Ltd. ARM Limited or its affiliates. All rights reserved.
Freescale Kinetis Cortex-M4 Lab with ARM® Keil™ MDK toolkit www.keil.com/freescale
20
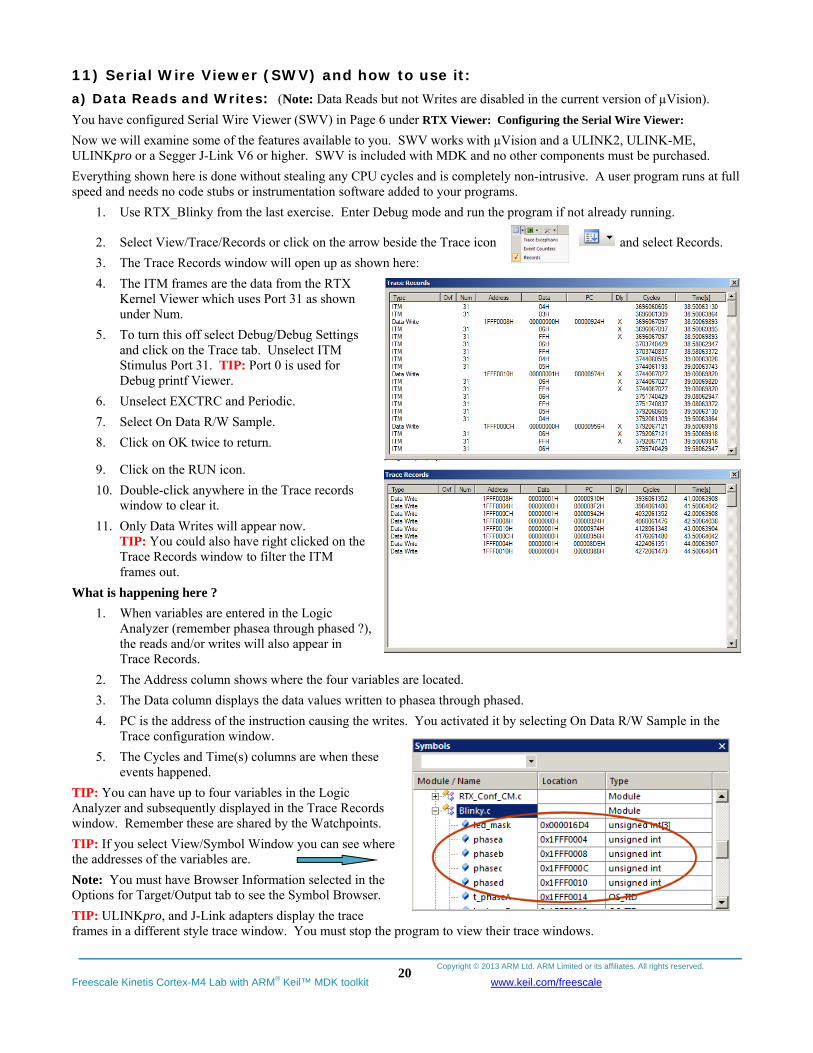
11) Serial Wire Viewer (SWV) and how to use it: a) Data Reads and Writes: (Note: Data Reads but not Writes are disabled in the current version of µVision). You have configured Serial Wire Viewer (SWV) in Page 6 under RTX Viewer: Configuring the Serial Wire Viewer:
Now we will examine some of the features available to you. SWV works with µVision and a ULINK2, ULINK-ME, ULINKpro or a Segger J-Link V6 or higher. SWV is included with MDK and no other components must be purchased.
Everything shown here is done without stealing any CPU cycles and is completely non-intrusive. A user program runs at full speed and needs no code stubs or instrumentation software added to your programs.
1. Use RTX_Blinky from the last exercise. Enter Debug mode and run the program if not already running.
and select Records. 2. Select View/Trace/Records or click on the arrow beside the Trace icon
3. The Trace Records window will open up as shown here:
4. The ITM frames are the data from the RTX Kernel Viewer which uses Port 31 as shown under Num.
5. To turn this off select Debug/Debug Settings and click on the Trace tab. Unselect ITM Stimulus Port 31. TIP: Port 0 is used for Debug printf Viewer.
6. Unselect EXCTRC and Periodic.
7. Select On Data R/W Sample.
8. Click on OK twice to return.
9. Click on the RUN icon.
10. Double-click anywhere in the Trace records window to clear it.
11. Only Data Writes will appear now. TIP: You could also have right clicked on the Trace Records window to filter the ITM frames out.
What is happening here ?
1. When variables are entered in the Logic Analyzer (remember phasea through phased ?), the reads and/or writes will also appear in Trace Records.
2. The Address column shows where the four variables are located.
3. The Data column displays the data values written to phasea through phased.
4. PC is the address of the instruction causing the writes. You activated it by selecting On Data R/W Sample in the Trace configuration window.
5. The Cycles and Time(s) columns are when these events happened.
TIP: You can have up to four variables in the Logic Analyzer and subsequently displayed in the Trace Records window. Remember these are shared by the Watchpoints.
TIP: If you select View/Symbol Window you can see where the addresses of the variables are.
Note: You must have Browser Information selected in the Options for Target/Output tab to see the Symbol Browser.
TIP: ULINKpro, and J-Link adapters display the trace frames in a different style trace window. You must stop the program to view their trace windows.
Copyright © 2013 ARM Ltd. ARM Limited or its affiliates. All rights reserved.
Freescale Kinetis Cortex-M4 Lab with ARM® Keil™ MDK toolkit www.keil.com/freescale
21
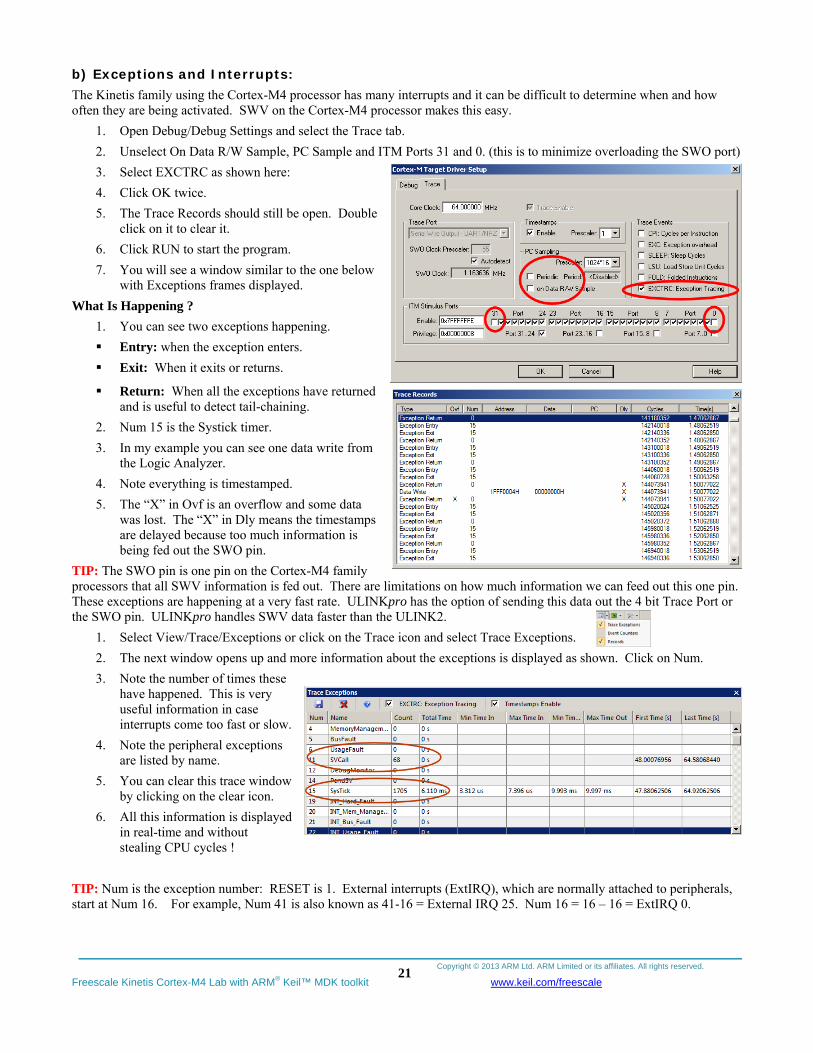
b) Exceptions and Interrupts: The Kinetis family using the Cortex-M4 processor has many interrupts and it can be difficult to determine when and how often they are being activated. SWV on the Cortex-M4 processor makes this easy.
1. Open Debug/Debug Settings and select the Trace tab.
2. Unselect On Data R/W Sample, PC Sample and ITM Ports 31 and 0. (this is to minimize overloading the SWO port)
3. Select EXCTRC as shown here:
4. Click OK twice.
5. The Trace Records should still be open. Double click on it to clear it.
6. Click RUN to start the program.
7. You will see a window similar to the one below with Exceptions frames displayed.
What Is Happening ?
1. You can see two exceptions happening.
Entry: when the exception enters.
Exit: When it exits or returns.
Return: When all the exceptions have returned and is useful to detect tail-chaining.
2. Num 15 is the Systick timer.
3. In my example you can see one data write from the Logic Analyzer.
4. Note everything is timestamped.
5. The “X” in Ovf is an overflow and some data was lost. The “X” in Dly means the timestamps are delayed because too much information is being fed out the SWO pin.
TIP: The SWO pin is one pin on the Cortex-M4 family processors that all SWV information is fed out. There are limitations on how much information we can feed out this one pin. These exceptions are happening at a very fast rate. ULINKpro has the option of sending this data out the 4 bit Trace Port or the SWO pin. ULINKpro handles SWV data faster than the ULINK2.
1. Select View/Trace/Exceptions or click on the Trace icon and select Trace Exceptions.
2. The next window opens up and more information about the exceptions is displayed as shown. Click on Num.
3. Note the number of times these have happened. This is very useful information in case interrupts come too fast or slow.
4. Note the peripheral exceptions are listed by name.
5. You can clear this trace window by clicking on the clear icon.
6. All this information is displayed in real-time and without stealing CPU cycles !
TIP: Num is the exception number: RESET is 1. External interrupts (ExtIRQ), which are normally attached to peripherals, start at Num 16. For example, Num 41 is also known as 41-16 = External IRQ 25. Num 16 = 16 – 16 = ExtIRQ 0.
Copyright © 2013 ARM Ltd. ARM Limited or its affiliates. All rights reserved.
Freescale Kinetis Cortex-M4 Lab with ARM® Keil™ MDK toolkit www.keil.com/freescale
22
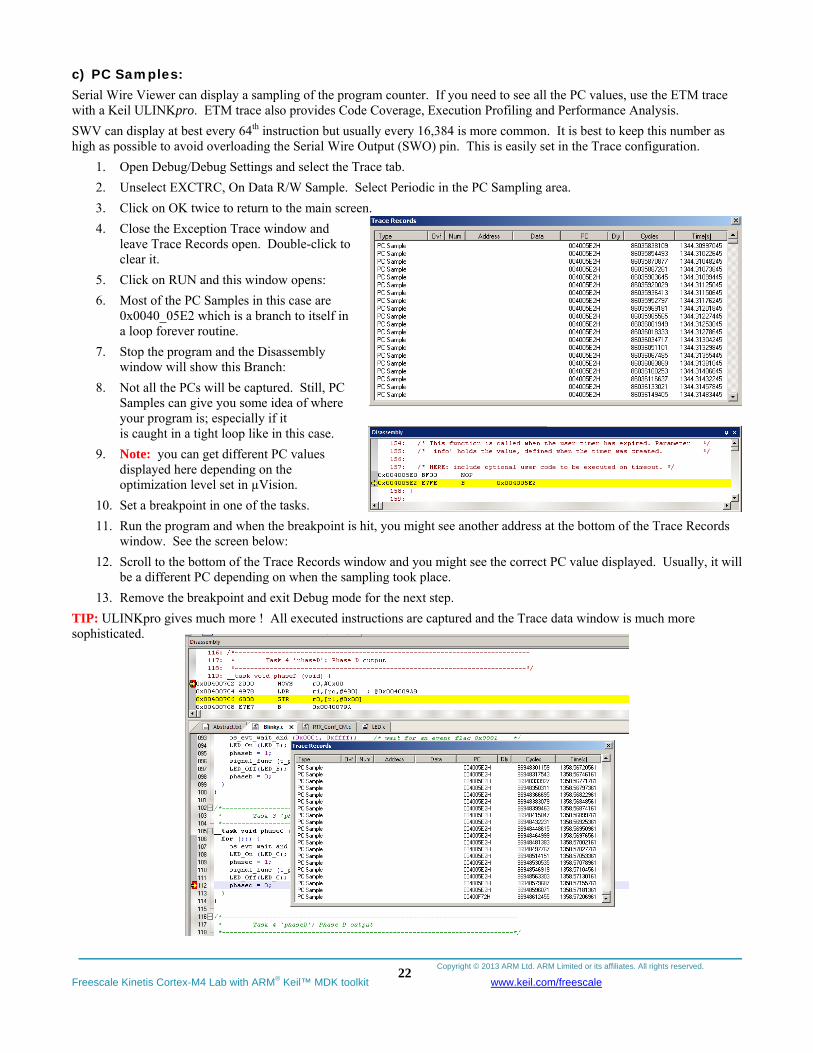
c) PC Samples: Serial Wire Viewer can display a sampling of the program counter. If you need to see all the PC values, use the ETM trace with a Keil ULINKpro. ETM trace also provides Code Coverage, Execution Profiling and Performance Analysis.
SWV can display at best every 64th instruction but usually every 16,384 is more common. It is best to keep this number as high as possible to avoid overloading the Serial Wire Output (SWO) pin. This is easily set in the Trace configuration.
1. Open Debug/Debug Settings and select the Trace tab.
2. Unselect EXCTRC, On Data R/W Sample. Select Periodic in the PC Sampling area.
3. Click on OK twice to return to the main screen.
4. Close the Exception Trace window and leave Trace Records open. Double-click to clear it.
5. Click on RUN and this window opens:
6. Most of the PC Samples in this case are 0x0040_05E2 which is a branch to itself in a loop forever routine.
7. Stop the program and the Disassembly window will show this Branch:
8. Not all the PCs will be captured. Still, PC Samples can give you some idea of where your program is; especially if it is caught in a tight loop like in this case.
9. Note: you can get different PC values displayed here depending on the optimization level set in µVision.
10. Set a breakpoint in one of the tasks.
11. Run the program and when the breakpoint is hit, you might see another address at the bottom of the Trace Records window. See the screen below:
12. Scroll to the bottom of the Trace Records window and you might see the correct PC value displayed. Usually, it will be a different PC depending on when the sampling took place.
13. Remove the breakpoint and exit Debug mode for the next step.
TIP: ULINKpro gives much more ! All executed instructions are captured and the Trace data window is much more sophisticated.
Copyright © 2013 ARM Ltd. ARM Limited or its affiliates. All rights reserved.
Freescale Kinetis Cortex-M4 Lab with ARM® Keil™ MDK toolkit www.keil.com/freescale
23
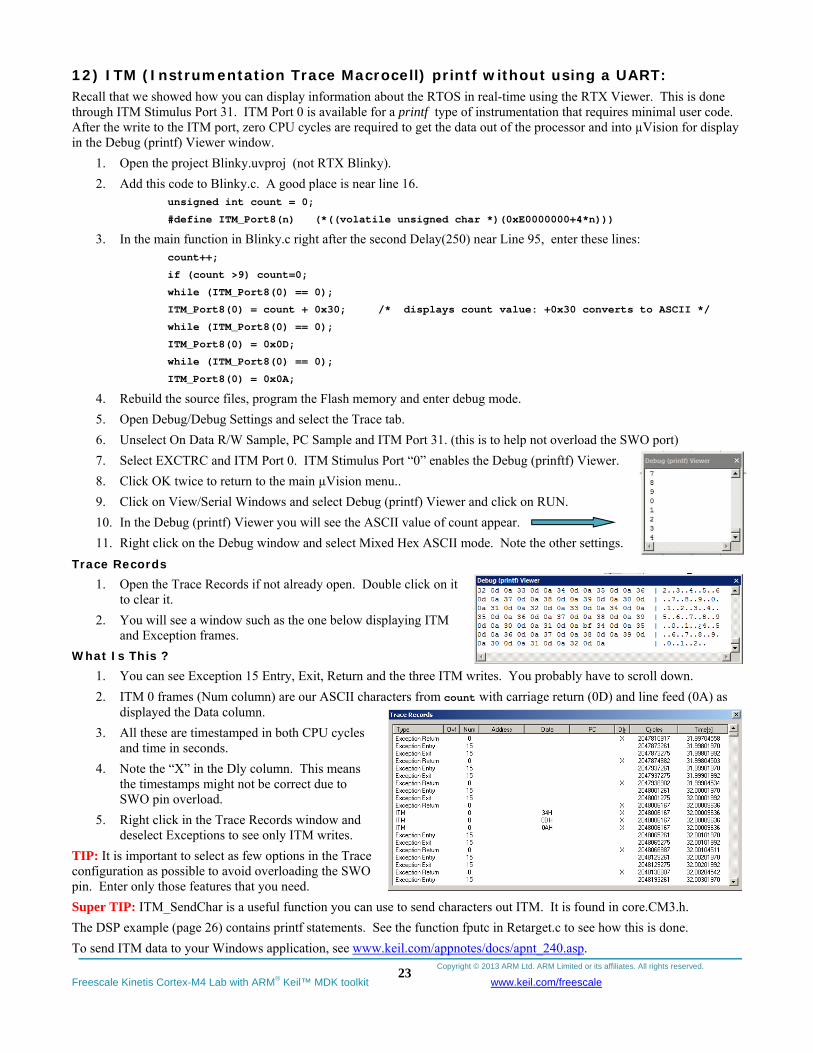
12) ITM (Instrumentation Trace Macrocell) printf without using a UART: Recall that we showed how you can display information about the RTOS in real-time using the RTX Viewer. This is done through ITM Stimulus Port 31. ITM Port 0 is available for a printf type of instrumentation that requires minimal user code. After the write to the ITM port, zero CPU cycles are required to get the data out of the processor and into µVision for display in the Debug (printf) Viewer window.
1. Open the project Blinky.uvproj (not RTX Blinky).
2. Add this code to Blinky.c. A good place is near line 16. unsigned int count = 0;
#define ITM_Port8(n) (*((volatile unsigned char *)(0xE0000000+4*n)))
3. In the main function in Blinky.c right after the second Delay(250) near Line 95, enter these lines: count++;
if (count >9) count=0;
while (ITM_Port8(0) == 0);
ITM_Port8(0) = count + 0x30; /* displays count value: +0x30 converts to ASCII */
while (ITM_Port8(0) == 0);
ITM_Port8(0) = 0x0D;
while (ITM_Port8(0) == 0);
ITM_Port8(0) = 0x0A;
4. Rebuild the source files, program the Flash memory and enter debug mode.
5. Open Debug/Debug Settings and select the Trace tab.
6. Unselect On Data R/W Sample, PC Sample and ITM Port 31. (this is to help not overload the SWO port)
7. Select EXCTRC and ITM Port 0. ITM Stimulus Port “0” enables the Debug (prinftf) Viewer.
8. Click OK twice to return to the main µVision menu..
9. Click on View/Serial Windows and select Debug (printf) Viewer and click on RUN.
10. In the Debug (printf) Viewer you will see the ASCII value of count appear.
11. Right click on the Debug window and select Mixed Hex ASCII mode. Note the other settings.
Trace Records 1. Open the Trace Records if not already open. Double click on it
to clear it.
2. You will see a window such as the one below displaying ITM and Exception frames.
What Is This ? 1. You can see Exception 15 Entry, Exit, Return and the three ITM writes. You probably have to scroll down.
2. ITM 0 frames (Num column) are our ASCII characters from count with carriage return (0D) and line feed (0A) as displayed the Data column.
3. All these are timestamped in both CPU cycles and time in seconds.
4. Note the “X” in the Dly column. This means the timestamps might not be correct due to SWO pin overload.
5. Right click in the Trace Records window and deselect Exceptions to see only ITM writes.
TIP: It is important to select as few options in the Trace configuration as possible to avoid overloading the SWO pin. Enter only those features that you need.
Super TIP: ITM_SendChar is a useful function you can use to send characters out ITM. It is found in core.CM3.h.
The DSP example (page 26) contains printf statements. See the function fputc in Retarget.c to see how this is done.
To send ITM data to your Windows application, see www.keil.com/appnotes/docs/apnt_240.asp.
Copyright © 2013 ARM Ltd. ARM Limited or its affiliates. All rights reserved.
Freescale Kinetis Cortex-M4 Lab with ARM® Keil™ MDK toolkit www.keil.com/freescale
24
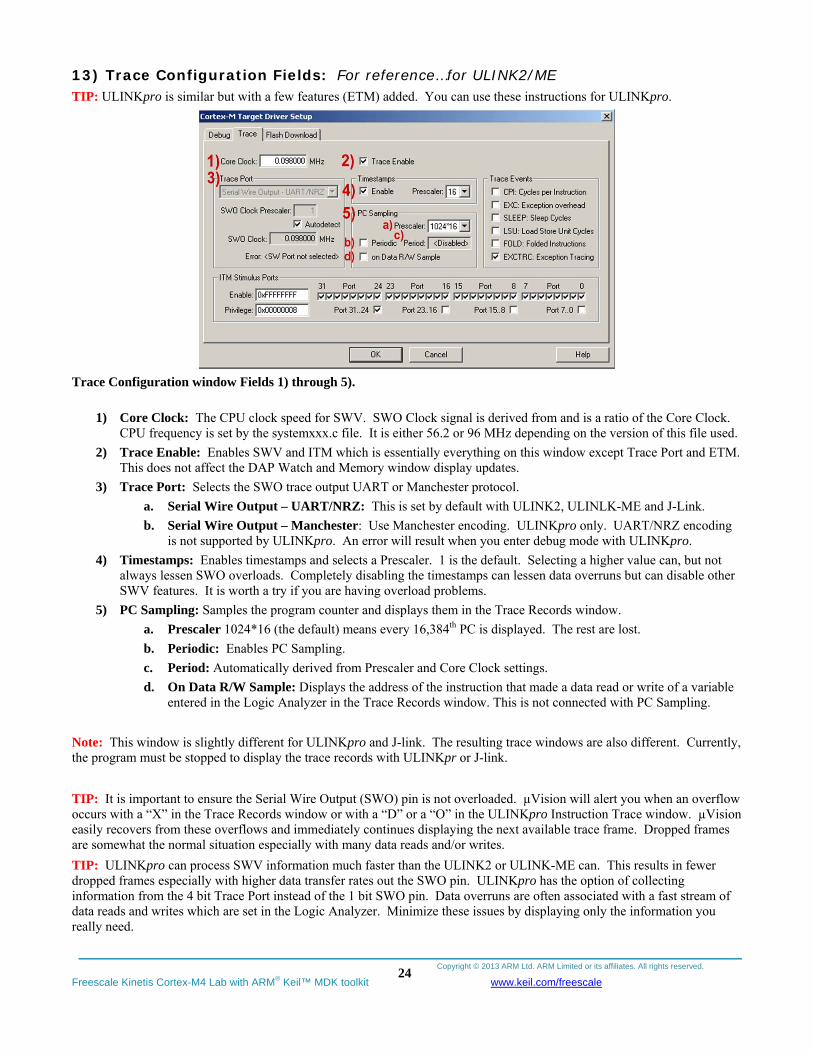
13) Trace Configuration Fields: For reference…for ULINK2/ME TIP: ULINKpro is similar but with a few features (ETM) added. You can use these instructions for ULINKpro.
Trace Configuration window Fields 1) through 5).
1) Core Clock: The CPU clock speed for SWV. SWO Clock signal is derived from and is a ratio of the Core Clock. CPU frequency is set by the systemxxx.c file. It is either 56.2 or 96 MHz depending on the version of this file used.
2) Trace Enable: Enables SWV and ITM which is essentially everything on this window except Trace Port and ETM. This does not affect the DAP Watch and Memory window display updates.
3) Trace Port: Selects the SWO trace output UART or Manchester protocol.
a. Serial Wire Output – UART/NRZ: This is set by default with ULINK2, ULINLK-ME and J-Link.
b. Serial Wire Output – Manchester: Use Manchester encoding. ULINKpro only. UART/NRZ encoding is not supported by ULINKpro. An error will result when you enter debug mode with ULINKpro.
4) Timestamps: Enables timestamps and selects a Prescaler. 1 is the default. Selecting a higher value can, but not always lessen SWO overloads. Completely disabling the timestamps can lessen data overruns but can disable other SWV features. It is worth a try if you are having overload problems.
5) PC Sampling: Samples the program counter and displays them in the Trace Records window.
a. Prescaler 1024*16 (the default) means every 16,384th PC is displayed. The rest are lost.
b. Periodic: Enables PC Sampling.
c. Period: Automatically derived from Prescaler and Core Clock settings.
d. On Data R/W Sample: Displays the address of the instruction that made a data read or write of a variable entered in the Logic Analyzer in the Trace Records window. This is not connected with PC Sampling.
Note: This window is slightly different for ULINKpro and J-link. The resulting trace windows are also different. Currently, the program must be stopped to display the trace records with ULINKpr or J-link.
TIP: It is important to ensure the Serial Wire Output (SWO) pin is not overloaded. µVision will alert you when an overflow occurs with a “X” in the Trace Records window or with a “D” or a “O” in the ULINKpro Instruction Trace window. µVision easily recovers from these overflows and immediately continues displaying the next available trace frame. Dropped frames are somewhat the normal situation especially with many data reads and/or writes.
TIP: ULINKpro can process SWV information much faster than the ULINK2 or ULINK-ME can. This results in fewer dropped frames especially with higher data transfer rates out the SWO pin. ULINKpro has the option of collecting information from the 4 bit Trace Port instead of the 1 bit SWO pin. Data overruns are often associated with a fast stream of data reads and writes which are set in the Logic Analyzer. Minimize these issues by displaying only the information you really need.
Copyright © 2013 ARM Ltd. ARM Limited or its affiliates. All rights reserved.
Freescale Kinetis Cortex-M4 Lab with ARM® Keil™ MDK toolkit www.keil.com/freescale
25
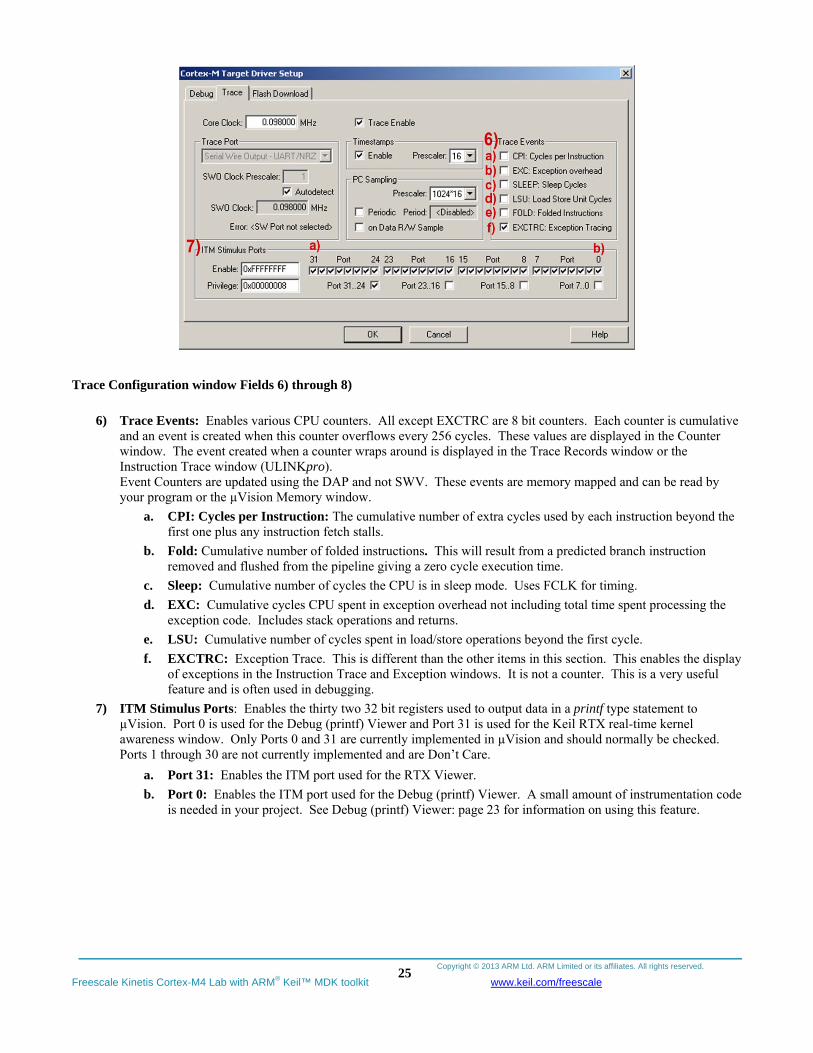
Trace Configuration window Fields 6) through 8)
6) Trace Events: Enables various CPU counters. All except EXCTRC are 8 bit counters. Each counter is cumulative and an event is created when this counter overflows every 256 cycles. These values are displayed in the Counter window. The event created when a counter wraps around is displayed in the Trace Records window or the Instruction Trace window (ULINKpro). Event Counters are updated using the DAP and not SWV. These events are memory mapped and can be read by your program or the µVision Memory window.
a. CPI: Cycles per Instruction: The cumulative number of extra cycles used by each instruction beyond the first one plus any instruction fetch stalls.
b. Fold: Cumulative number of folded instructions. This will result from a predicted branch instruction removed and flushed from the pipeline giving a zero cycle execution time.
c. Sleep: Cumulative number of cycles the CPU is in sleep mode. Uses FCLK for timing.
d. EXC: Cumulative cycles CPU spent in exception overhead not including total time spent processing the exception code. Includes stack operations and returns.
e. LSU: Cumulative number of cycles spent in load/store operations beyond the first cycle.
f. EXCTRC: Exception Trace. This is different than the other items in this section. This enables the display of exceptions in the Instruction Trace and Exception windows. It is not a counter. This is a very useful feature and is often used in debugging.
7) ITM Stimulus Ports: Enables the thirty two 32 bit registers used to output data in a printf type statement to µVision. Port 0 is used for the Debug (printf) Viewer and Port 31 is used for the Keil RTX real-time kernel awareness window. Only Ports 0 and 31 are currently implemented in µVision and should normally be checked. Ports 1 through 30 are not currently implemented and are Don’t Care.
a. Port 31: Enables the ITM port used for the RTX Viewer.
b. Port 0: Enables the ITM port used for the Debug (printf) Viewer. A small amount of instrumentation code is needed in your project. See Debug (printf) Viewer: page 23 for information on using this feature.
Copyright © 2013 ARM Ltd. ARM Limited or its affiliates. All rights reserved.
Freescale Kinetis Cortex-M4 Lab with ARM® Keil™ MDK toolkit www.keil.com/freescale
26
PART C): DSP Example using ARM CMSIS-DSP Libraries: 1) DSP SINE example: ARM CMSIS-DSP libraries are offered for ARM Cortex-M0, Cortex-M3 and Cortex-M4 processors. DSP libraries are provided in MDK in C:\Keil\ARM\CMSIS. README.txt describes the location of various CMSIS components. See www.arm.com/cmsis and http://community.arm.com/groups/tools/content for more information.
You can use this example with other Kinetis boards. You might need to make some changes to the startup and system files.
This example creates a sine wave, then creates a second to act as noise, which are then added together (disturbed), and then the noise is filtered out (filtered). The waveform in each step is displayed in the Logic Analyzer using Serial Wire Viewer.
This example incorporates the Keil RTOS RTX. RTX is available free with a BSD type license. Source code is provided.
To obtain this DSP example project, go to www.keil.com/appnotes/docs/apnt_249.asp
1. Extract DSP.zip to C:\Keil\ARM\Boards\Freescale\TWR-K60D100M\ to create the folder \DSP.
1. Open the project file sine.uvproj with µVision. Connect a ULINK2 or ULINKpro to the K60 board.
2. If you are using a ULINK2 or ME, select ULINK2 SWV from the target drop menu: If using a ULINKpro, select either ULINKpro SWV to send SWV data out the SWO pin or ULINKpro ETM Trace to send it out the 4 bit Trace port. Either works with this example.
3. Compile the source files by clicking on the Rebuild icon. .
4. Program the K60 flash by clicking on the Load icon: Progress is indicated in bottom left corner.
5. Enter Debug mode by clicking on the Debug icon. Select OK if the Evaluation Mode notice appears.
TIP: The default Core Clock: is 56.2 MHz for use by the Serial Wire Viewer configuration window in the Trace tab.
6. Click on the RUN icon. Open the Logic Analyzer window.
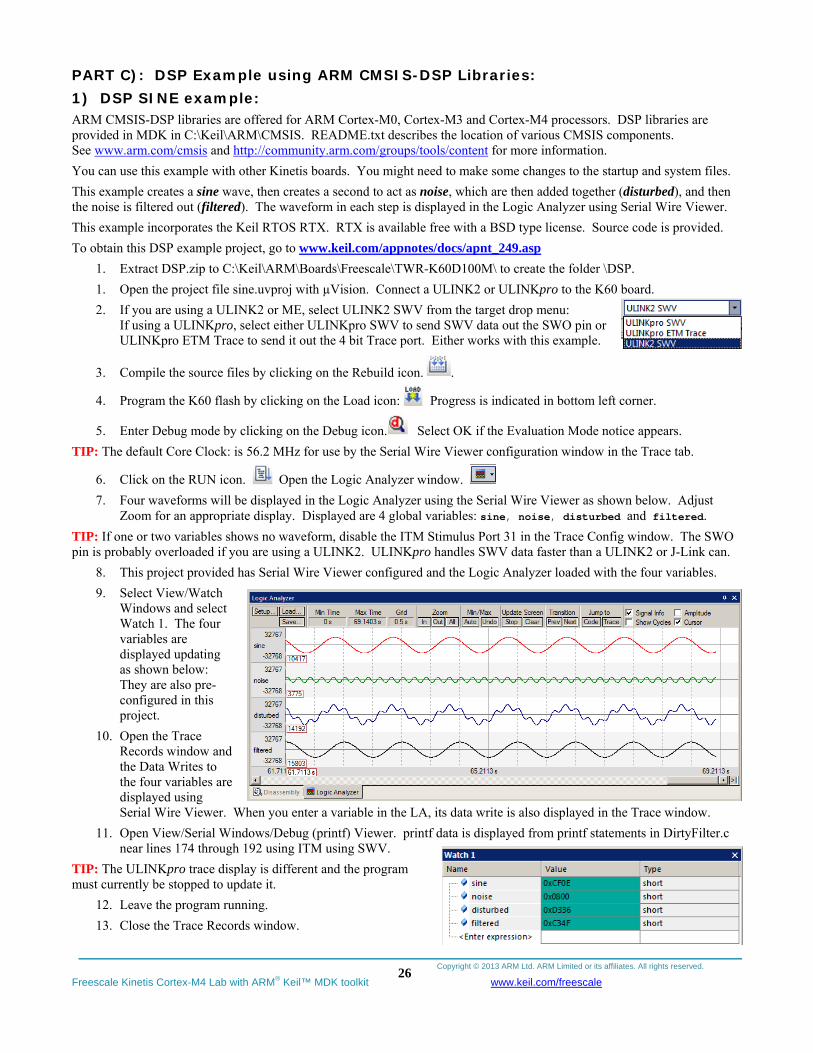
7. Four waveforms will be displayed in the Logic Analyzer using the Serial Wire Viewer as shown below. Adjust Zoom for an appropriate display. Displayed are 4 global variables: sine, noise, disturbed and filtered.
TIP: If one or two variables shows no waveform, disable the ITM Stimulus Port 31 in the Trace Config window. The SWO pin is probably overloaded if you are using a ULINK2. ULINKpro handles SWV data faster than a ULINK2 or J-Link can.
8. This project provided has Serial Wire Viewer configured and the Logic Analyzer loaded with the four variables.
9. Select View/Watch Windows and select Watch 1. The four variables are displayed updating as shown below: They are also pre-configured in this project.
10. Open the Trace Records window and the Data Writes to the four variables are displayed using Serial Wire Viewer. When you enter a variable in the LA, its data write is also displayed in the Trace window.
11. Open View/Serial Windows/Debug (printf) Viewer. printf data is displayed from printf statements in DirtyFilter.c near lines 174 through 192 using ITM using SWV.
TIP: The ULINKpro trace display is different and the program must currently be stopped to update it.
12. Leave the program running.
13. Close the Trace Records window.
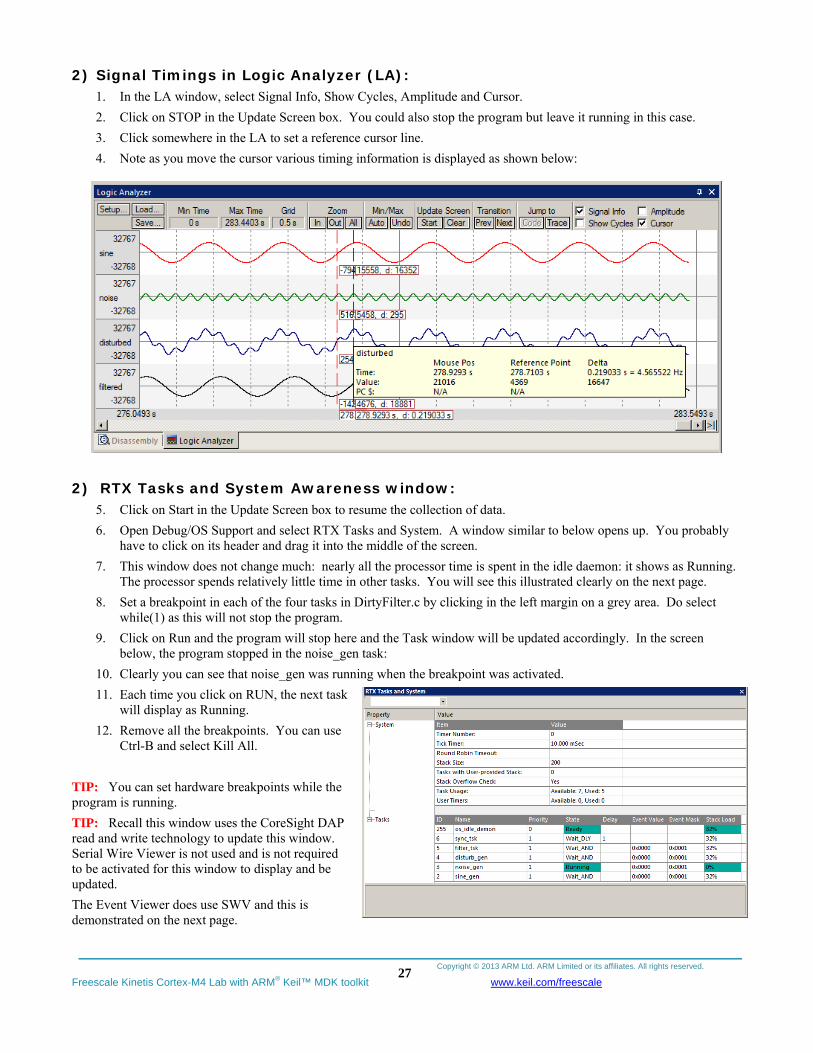
Copyright © 2013 ARM Ltd. ARM Limited or its affiliates. All rights reserved.
Freescale Kinetis Cortex-M4 Lab with ARM® Keil™ MDK toolkit www.keil.com/freescale
27
2) Signal Timings in Logic Analyzer (LA):
1. In the LA window, select Signal Info, Show Cycles, Amplitude and Cursor.
2. Click on STOP in the Update Screen box. You could also stop the program but leave it running in this case.
3. Click somewhere in the LA to set a reference cursor line.
4. Note as you move the cursor various timing information is displayed as shown below:
2) RTX Tasks and System Awareness window:
5. Click on Start in the Update Screen box to resume the collection of data.
6. Open Debug/OS Support and select RTX Tasks and System. A window similar to below opens up. You probably have to click on its header and drag it into the middle of the screen.
7. This window does not change much: nearly all the processor time is spent in the idle daemon: it shows as Running. The processor spends relatively little time in other tasks. You will see this illustrated clearly on the next page.
8. Set a breakpoint in each of the four tasks in DirtyFilter.c by clicking in the left margin on a grey area. Do select while(1) as this will not stop the program.
9. Click on Run and the program will stop here and the Task window will be updated accordingly. In the screen below, the program stopped in the noise_gen task:
10. Clearly you can see that noise_gen was running when the breakpoint was activated.
11. Each time you click on RUN, the next task will display as Running.
12. Remove all the breakpoints. You can use Ctrl-B and select Kill All.
TIP: You can set hardware breakpoints while the program is running.
TIP: Recall this window uses the CoreSight DAP read and write technology to update this window. Serial Wire Viewer is not used and is not required to be activated for this window to display and be updated.
The Event Viewer does use SWV and this is demonstrated on the next page.
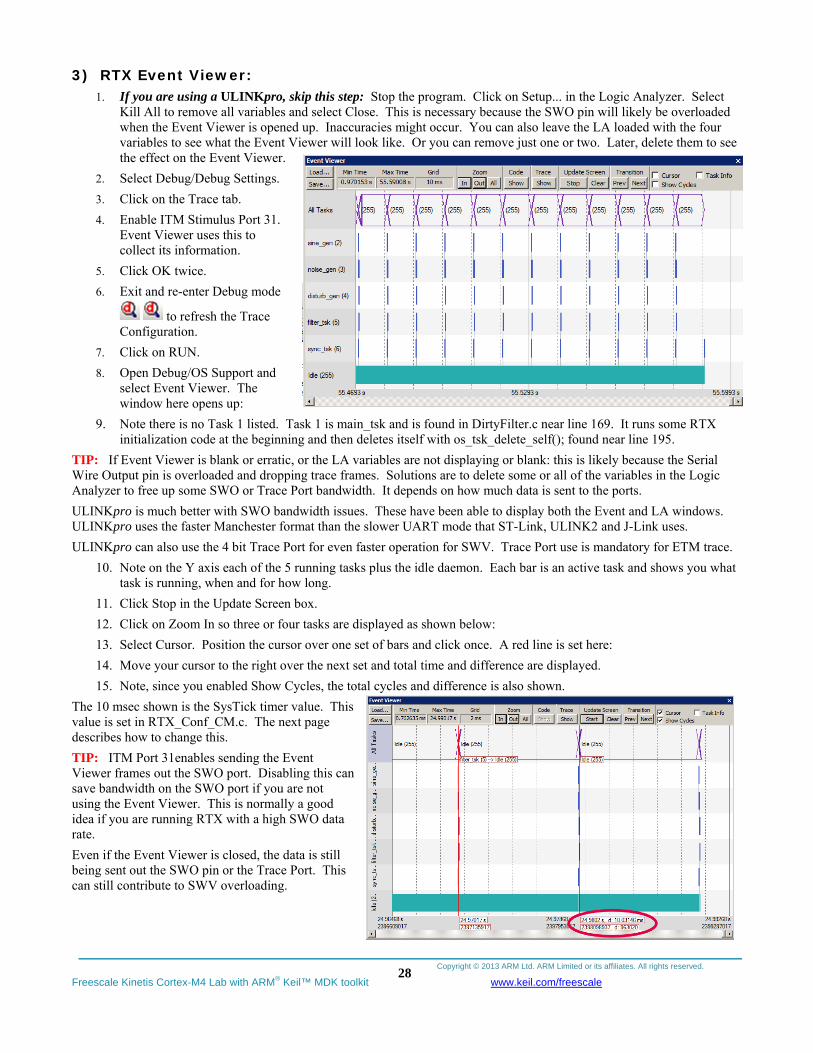
Copyright © 2013 ARM Ltd. ARM Limited or its affiliates. All rights reserved.
Freescale Kinetis Cortex-M4 Lab with ARM® Keil™ MDK toolkit www.keil.com/freescale
28
3) RTX Event Viewer: 1. If you are using a ULINKpro, skip this step: Stop the program. Click on Setup... in the Logic Analyzer. Select
Kill All to remove all variables and select Close. This is necessary because the SWO pin will likely be overloaded when the Event Viewer is opened up. Inaccuracies might occur. You can also leave the LA loaded with the four variables to see what the Event Viewer will look like. Or you can remove just one or two. Later, delete them to see the effect on the Event Viewer.
2. Select Debug/Debug Settings.
3. Click on the Trace tab.
4. Enable ITM Stimulus Port 31. Event Viewer uses this to collect its information.
5. Click OK twice.
6. Exit and re-enter Debug mode
to refresh the Trace Configuration.
7. Click on RUN.
8. Open Debug/OS Support and select Event Viewer. The window here opens up:
9. Note there is no Task 1 listed. Task 1 is main_tsk and is found in DirtyFilter.c near line 169. It runs some RTX initialization code at the beginning and then deletes itself with os_tsk_delete_self(); found near line 195.
TIP: If Event Viewer is blank or erratic, or the LA variables are not displaying or blank: this is likely because the Serial Wire Output pin is overloaded and dropping trace frames. Solutions are to delete some or all of the variables in the Logic Analyzer to free up some SWO or Trace Port bandwidth. It depends on how much data is sent to the ports.
ULINKpro is much better with SWO bandwidth issues. These have been able to display both the Event and LA windows. ULINKpro uses the faster Manchester format than the slower UART mode that ST-Link, ULINK2 and J-Link uses.
ULINKpro can also use the 4 bit Trace Port for even faster operation for SWV. Trace Port use is mandatory for ETM trace.
10. Note on the Y axis each of the 5 running tasks plus the idle daemon. Each bar is an active task and shows you what task is running, when and for how long.
11. Click Stop in the Update Screen box.
12. Click on Zoom In so three or four tasks are displayed as shown below:
13. Select Cursor. Position the cursor over one set of bars and click once. A red line is set here:
14. Move your cursor to the right over the next set and total time and difference are displayed.
15. Note, since you enabled Show Cycles, the total cycles and difference is also shown.
The 10 msec shown is the SysTick timer value. This value is set in RTX_Conf_CM.c. The next page describes how to change this.
TIP: ITM Port 31enables sending the Event Viewer frames out the SWO port. Disabling this can save bandwidth on the SWO port if you are not using the Event Viewer. This is normally a good idea if you are running RTX with a high SWO data rate.
Even if the Event Viewer is closed, the data is still being sent out the SWO pin or the Trace Port. This can still contribute to SWV overloading.
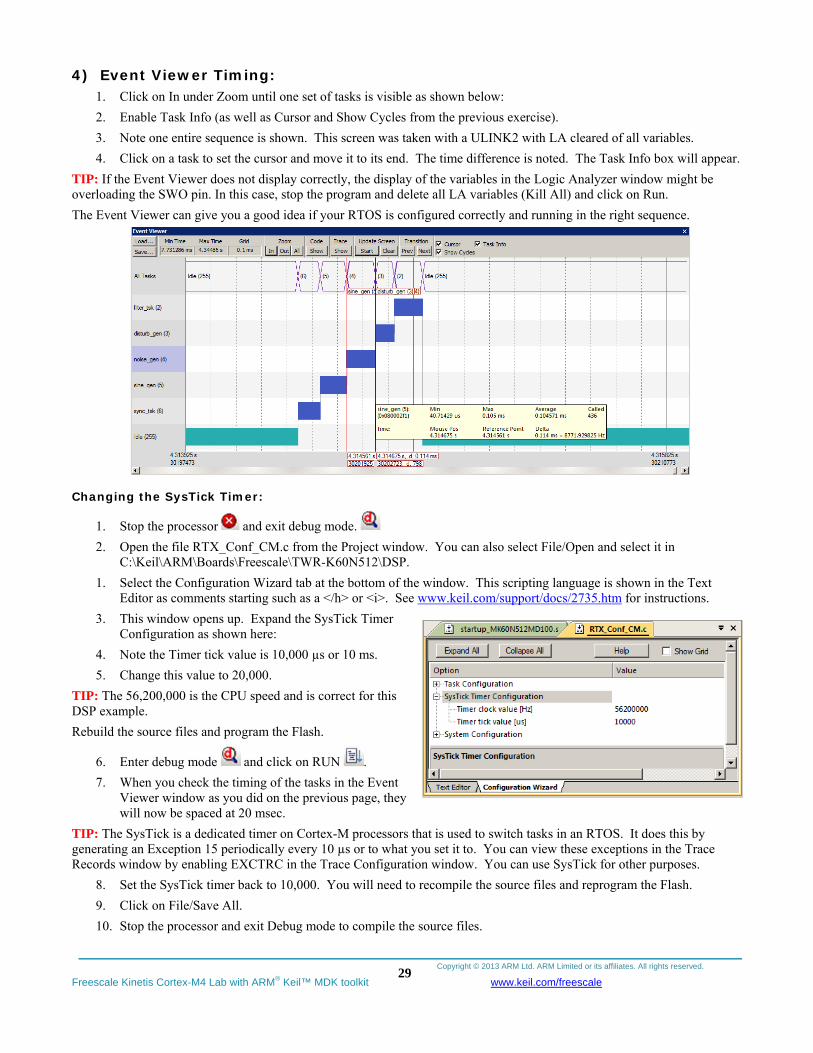
Copyright © 2013 ARM Ltd. ARM Limited or its affiliates. All rights reserved.
Freescale Kinetis Cortex-M4 Lab with ARM® Keil™ MDK toolkit www.keil.com/freescale
29
4) Event Viewer Timing:
1. Click on In under Zoom until one set of tasks is visible as shown below:
2. Enable Task Info (as well as Cursor and Show Cycles from the previous exercise).
3. Note one entire sequence is shown. This screen was taken with a ULINK2 with LA cleared of all variables.
4. Click on a task to set the cursor and move it to its end. The time difference is noted. The Task Info box will appear.
TIP: If the Event Viewer does not display correctly, the display of the variables in the Logic Analyzer window might be overloading the SWO pin. In this case, stop the program and delete all LA variables (Kill All) and click on Run.
The Event Viewer can give you a good idea if your RTOS is configured correctly and running in the right sequence.
Changing the SysTick Timer:
1. Stop the processor and exit debug mode.
2. Open the file RTX_Conf_CM.c from the Project window. You can also select File/Open and select it in C:\Keil\ARM\Boards\Freescale\TWR-K60N512\DSP.
1. Select the Configuration Wizard tab at the bottom of the window. This scripting language is shown in the Text Editor as comments starting such as a </h> or <i>. See www.keil.com/support/docs/2735.htm for instructions.
3. This window opens up. Expand the SysTick Timer Configuration as shown here:
4. Note the Timer tick value is 10,000 µs or 10 ms.
5. Change this value to 20,000.
TIP: The 56,200,000 is the CPU speed and is correct for this DSP example.
Rebuild the source files and program the Flash.
6. Enter debug mode and click on RUN .
7. When you check the timing of the tasks in the Event Viewer window as you did on the previous page, they will now be spaced at 20 msec.
TIP: The SysTick is a dedicated timer on Cortex-M processors that is used to switch tasks in an RTOS. It does this by generating an Exception 15 periodically every 10 µs or to what you set it to. You can view these exceptions in the Trace Records window by enabling EXCTRC in the Trace Configuration window. You can use SysTick for other purposes.
8. Set the SysTick timer back to 10,000. You will need to recompile the source files and reprogram the Flash.
9. Click on File/Save All.
10. Stop the processor and exit Debug mode to compile the source files.
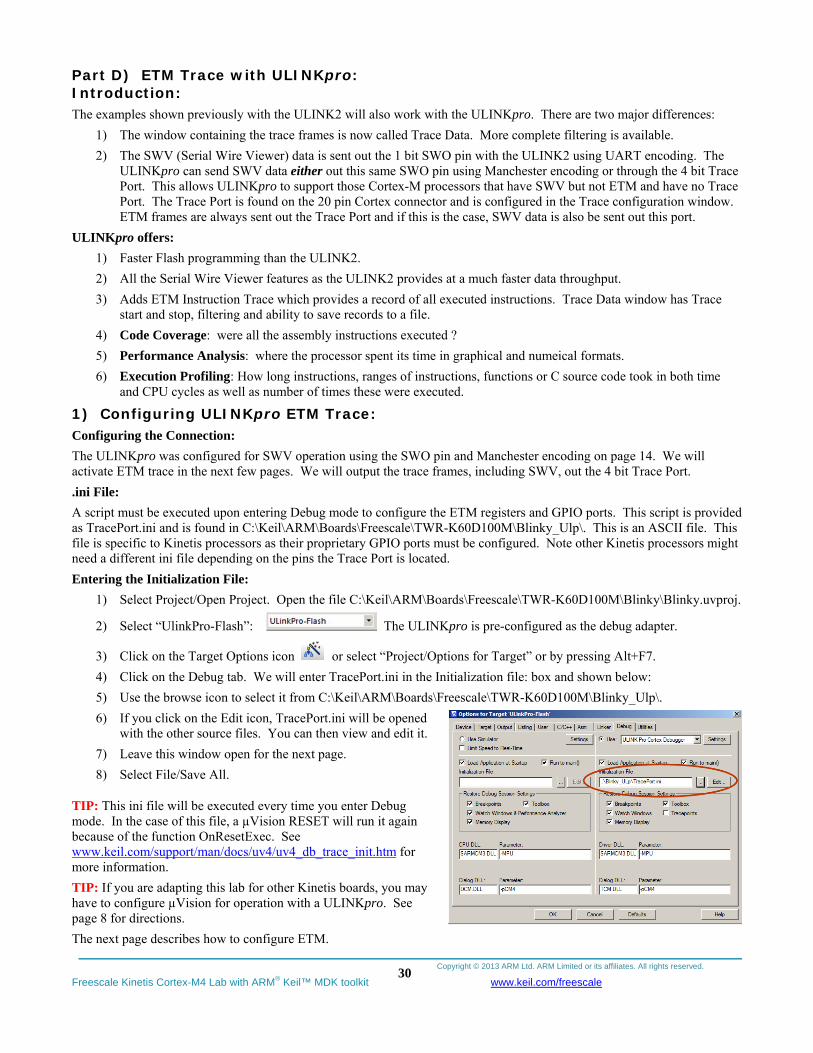
Copyright © 2013 ARM Ltd. ARM Limited or its affiliates. All rights reserved.
Freescale Kinetis Cortex-M4 Lab with ARM® Keil™ MDK toolkit www.keil.com/freescale
30
Part D) ETM Trace with ULINKpro: Introduction: The examples shown previously with the ULINK2 will also work with the ULINKpro. There are two major differences:
1) The window containing the trace frames is now called Trace Data. More complete filtering is available.
2) The SWV (Serial Wire Viewer) data is sent out the 1 bit SWO pin with the ULINK2 using UART encoding. The ULINKpro can send SWV data either out this same SWO pin using Manchester encoding or through the 4 bit Trace Port. This allows ULINKpro to support those Cortex-M processors that have SWV but not ETM and have no Trace Port. The Trace Port is found on the 20 pin Cortex connector and is configured in the Trace configuration window. ETM frames are always sent out the Trace Port and if this is the case, SWV data is also be sent out this port.
ULINKpro offers:
1) Faster Flash programming than the ULINK2.
2) All the Serial Wire Viewer features as the ULINK2 provides at a much faster data throughput.
3) Adds ETM Instruction Trace which provides a record of all executed instructions. Trace Data window has Trace start and stop, filtering and ability to save records to a file.
4) Code Coverage: were all the assembly instructions executed ?
5) Performance Analysis: where the processor spent its time in graphical and numeical formats.
6) Execution Profiling: How long instructions, ranges of instructions, functions or C source code took in both time and CPU cycles as well as number of times these were executed.
1) Configuring ULINKpro ETM Trace: Configuring the Connection:
The ULINKpro was configured for SWV operation using the SWO pin and Manchester encoding on page 14. We will activate ETM trace in the next few pages. We will output the trace frames, including SWV, out the 4 bit Trace Port.
.ini File:
A script must be executed upon entering Debug mode to configure the ETM registers and GPIO ports. This script is provided as TracePort.ini and is found in C:\Keil\ARM\Boards\Freescale\TWR-K60D100M\Blinky_Ulp\. This is an ASCII file. This file is specific to Kinetis processors as their proprietary GPIO ports must be configured. Note other Kinetis processors might need a different ini file depending on the pins the Trace Port is located.
Entering the Initialization File:
1) Select Project/Open Project. Open the file C:\Keil\ARM\Boards\Freescale\TWR-K60D100M\Blinky\Blinky.uvproj.
2) Select “UlinkPro-Flash”: The ULINKpro is pre-configured as the debug adapter.
3) Click on the Target Options icon or select “Project/Options for Target” or by pressing Alt+F7.
4) Click on the Debug tab. We will enter TracePort.ini in the Initialization file: box and shown below:
5) Use the browse icon to select it from C:\Keil\ARM\Boards\Freescale\TWR-K60D100M\Blinky_Ulp\.
6) If you click on the Edit icon, TracePort.ini will be opened with the other source files. You can then view and edit it.
7) Leave this window open for the next page.
8) Select File/Save All.
TIP: This ini file will be executed every time you enter Debug mode. In the case of this file, a µVision RESET will run it again because of the function OnResetExec. See www.keil.com/support/man/docs/uv4/uv4_db_trace_init.htm for more information.
TIP: If you are adapting this lab for other Kinetis boards, you may have to configure µVision for operation with a ULINKpro. See page 8 for directions.
The next page describes how to configure ETM.
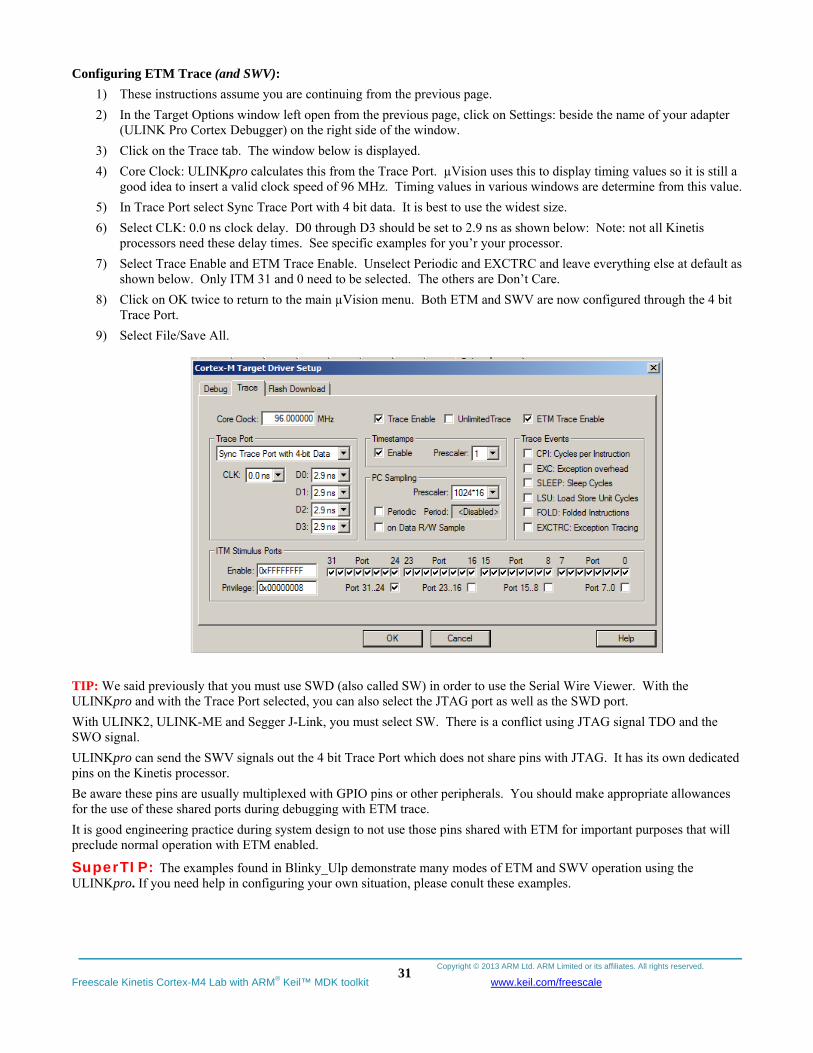
Copyright © 2013 ARM Ltd. ARM Limited or its affiliates. All rights reserved.
Freescale Kinetis Cortex-M4 Lab with ARM® Keil™ MDK toolkit www.keil.com/freescale
31
Configuring ETM Trace (and SWV):
1) These instructions assume you are continuing from the previous page.
2) In the Target Options window left open from the previous page, click on Settings: beside the name of your adapter (ULINK Pro Cortex Debugger) on the right side of the window.
3) Click on the Trace tab. The window below is displayed.
4) Core Clock: ULINKpro calculates this from the Trace Port. µVision uses this to display timing values so it is still a good idea to insert a valid clock speed of 96 MHz. Timing values in various windows are determine from this value.
5) In Trace Port select Sync Trace Port with 4 bit data. It is best to use the widest size.
6) Select CLK: 0.0 ns clock delay. D0 through D3 should be set to 2.9 ns as shown below: Note: not all Kinetis processors need these delay times. See specific examples for you’r your processor.
7) Select Trace Enable and ETM Trace Enable. Unselect Periodic and EXCTRC and leave everything else at default as shown below. Only ITM 31 and 0 need to be selected. The others are Don’t Care.
8) Click on OK twice to return to the main µVision menu. Both ETM and SWV are now configured through the 4 bit Trace Port.
9) Select File/Save All.
TIP: We said previously that you must use SWD (also called SW) in order to use the Serial Wire Viewer. With the ULINKpro and with the Trace Port selected, you can also select the JTAG port as well as the SWD port.
With ULINK2, ULINK-ME and Segger J-Link, you must select SW. There is a conflict using JTAG signal TDO and the SWO signal.
ULINKpro can send the SWV signals out the 4 bit Trace Port which does not share pins with JTAG. It has its own dedicated pins on the Kinetis processor.
Be aware these pins are usually multiplexed with GPIO pins or other peripherals. You should make appropriate allowances for the use of these shared ports during debugging with ETM trace.
It is good engineering practice during system design to not use those pins shared with ETM for important purposes that will preclude normal operation with ETM enabled.
SuperTIP: The examples found in Blinky_Ulp demonstrate many modes of ETM and SWV operation using the ULINKpro. If you need help in configuring your own situation, please conult these examples.
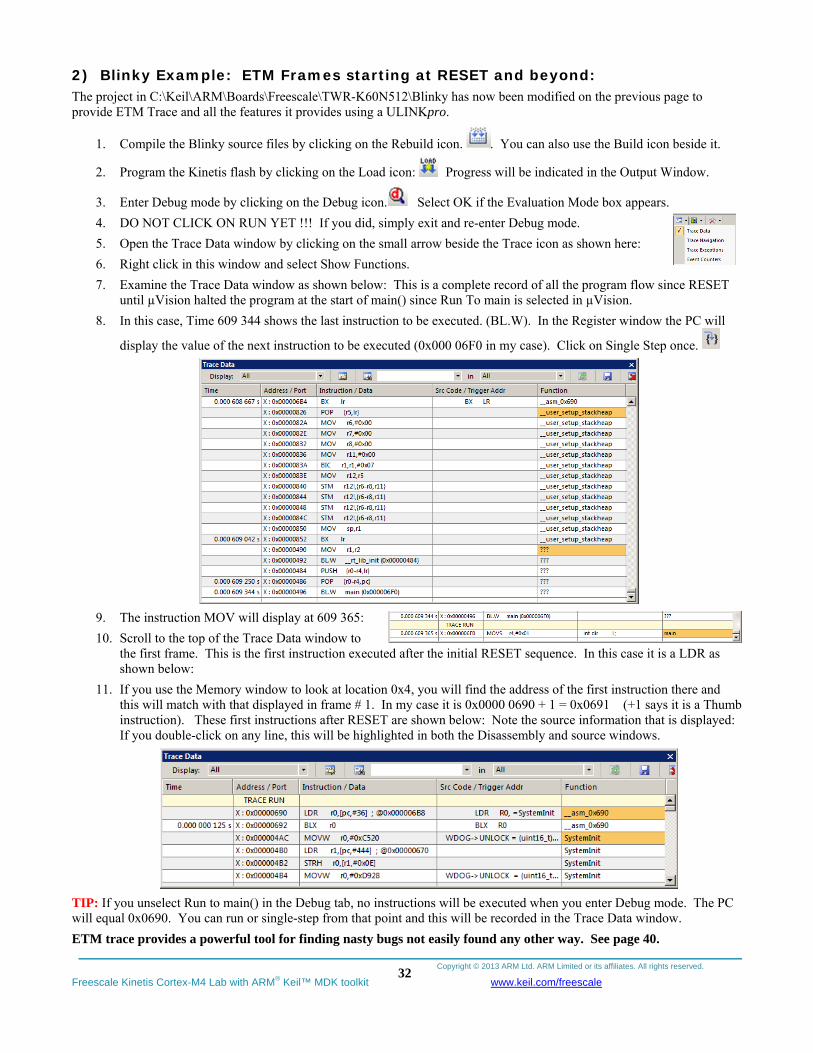
Copyright © 2013 ARM Ltd. ARM Limited or its affiliates. All rights reserved.
Freescale Kinetis Cortex-M4 Lab with ARM® Keil™ MDK toolkit www.keil.com/freescale
32
2) Blinky Example: ETM Frames starting at RESET and beyond: The project in C:\Keil\ARM\Boards\Freescale\TWR-K60N512\Blinky has now been modified on the previous page to provide ETM Trace and all the features it provides using a ULINKpro.
1. Compile the Blinky source files by clicking on the Rebuild icon. . You can also use the Build icon beside it.
2. Program the Kinetis flash by clicking on the Load icon: Progress will be indicated in the Output Window.
3. Enter Debug mode by clicking on the Debug icon. Select OK if the Evaluation Mode box appears.
4. DO NOT CLICK ON RUN YET !!! If you did, simply exit and re-enter Debug mode.
5. Open the Trace Data window by clicking on the small arrow beside the Trace icon as shown here:
6. Right click in this window and select Show Functions.
7. Examine the Trace Data window as shown below: This is a complete record of all the program flow since RESET until µVision halted the program at the start of main() since Run To main is selected in µVision.
8. In this case, Time 609 344 shows the last instruction to be executed. (BL.W). In the Register window the PC will
display the value of the next instruction to be executed (0x000 06F0 in my case). Click on Single Step once.
9. The instruction MOV will display at 609 365:
10. Scroll to the top of the Trace Data window to the first frame. This is the first instruction executed after the initial RESET sequence. In this case it is a LDR as shown below:
11. If you use the Memory window to look at location 0x4, you will find the address of the first instruction there and this will match with that displayed in frame # 1. In my case it is 0x0000 0690 + 1 = 0x0691 (+1 says it is a Thumb instruction). These first instructions after RESET are shown below: Note the source information that is displayed: If you double-click on any line, this will be highlighted in both the Disassembly and source windows.
TIP: If you unselect Run to main() in the Debug tab, no instructions will be executed when you enter Debug mode. The PC will equal 0x0690. You can run or single-step from that point and this will be recorded in the Trace Data window.
ETM trace provides a powerful tool for finding nasty bugs not easily found any other way. See page 40.
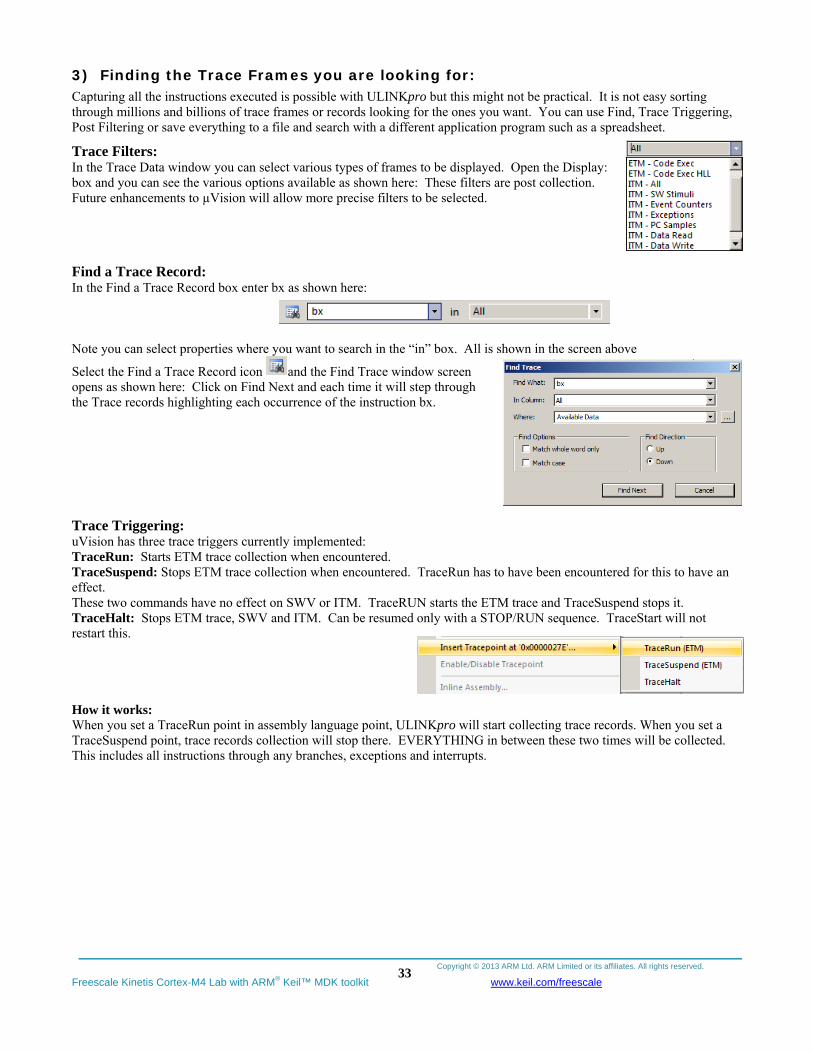
Copyright © 2013 ARM Ltd. ARM Limited or its affiliates. All rights reserved.
Freescale Kinetis Cortex-M4 Lab with ARM® Keil™ MDK toolkit www.keil.com/freescale
33
3) Finding the Trace Frames you are looking for: Capturing all the instructions executed is possible with ULINKpro but this might not be practical. It is not easy sorting through millions and billions of trace frames or records looking for the ones you want. You can use Find, Trace Triggering, Post Filtering or save everything to a file and search with a different application program such as a spreadsheet. Trace Filters: In the Trace Data window you can select various types of frames to be displayed. Open the Display: box and you can see the various options available as shown here: These filters are post collection. Future enhancements to µVision will allow more precise filters to be selected.
Find a Trace Record: In the Find a Trace Record box enter bx as shown here: Note you can select properties where you want to search in the “in” box. All is shown in the screen above
Select the Find a Trace Record icon and the Find Trace window screen opens as shown here: Click on Find Next and each time it will step through the Trace records highlighting each occurrence of the instruction bx.
Trace Triggering: uVision has three trace triggers currently implemented: TraceRun: Starts ETM trace collection when encountered. TraceSuspend: Stops ETM trace collection when encountered. TraceRun has to have been encountered for this to have an effect. These two commands have no effect on SWV or ITM. TraceRUN starts the ETM trace and TraceSuspend stops it. TraceHalt: Stops ETM trace, SWV and ITM. Can be resumed only with a STOP/RUN sequence. TraceStart will not restart this. How it works: When you set a TraceRun point in assembly language point, ULINKpro will start collecting trace records. When you set a TraceSuspend point, trace records collection will stop there. EVERYTHING in between these two times will be collected. This includes all instructions through any branches, exceptions and interrupts.
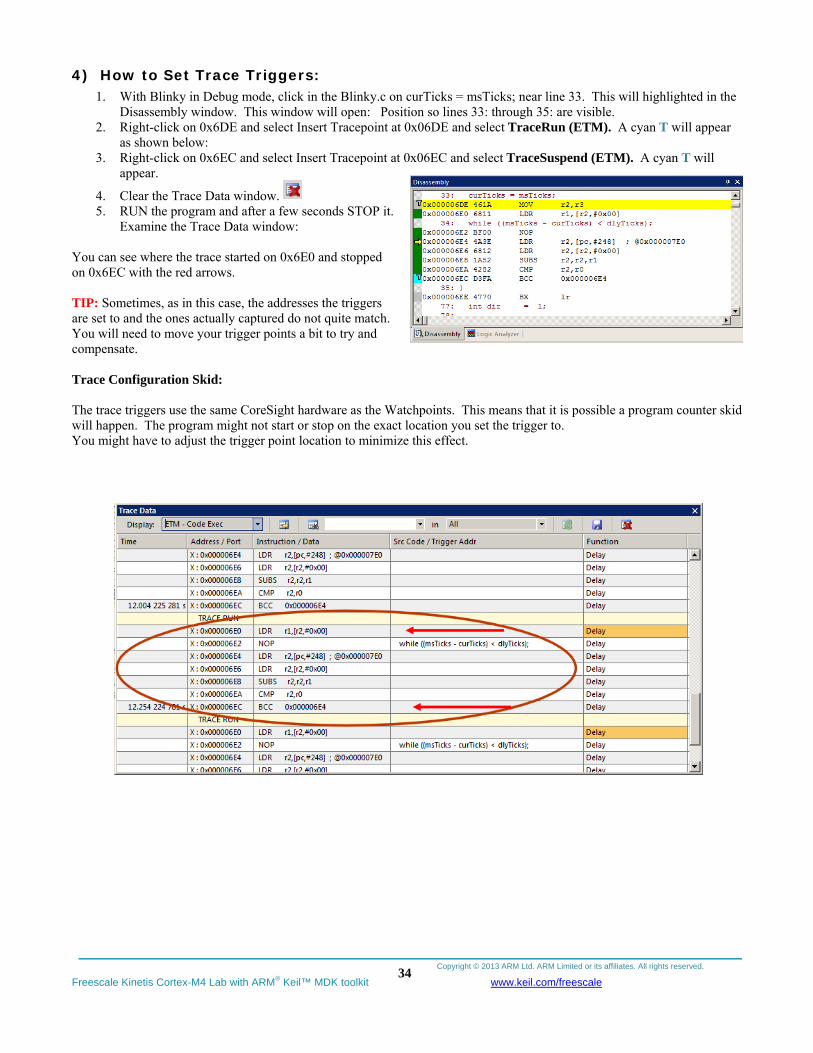
Copyright © 2013 ARM Ltd. ARM Limited or its affiliates. All rights reserved.
Freescale Kinetis Cortex-M4 Lab with ARM® Keil™ MDK toolkit www.keil.com/freescale
34
4) How to Set Trace Triggers: 1. With Blinky in Debug mode, click in the Blinky.c on curTicks = msTicks; near line 33. This will highlighted in the
Disassembly window. This window will open: Position so lines 33: through 35: are visible. 2. Right-click on 0x6DE and select Insert Tracepoint at 0x06DE and select TraceRun (ETM). A cyan T will appear
as shown below: 3. Right-click on 0x6EC and select Insert Tracepoint at 0x06EC and select TraceSuspend (ETM). A cyan T will
appear.
4. Clear the Trace Data window. 5. RUN the program and after a few seconds STOP it.
Examine the Trace Data window: You can see where the trace started on 0x6E0 and stopped on 0x6EC with the red arrows. TIP: Sometimes, as in this case, the addresses the triggers are set to and the ones actually captured do not quite match. You will need to move your trigger points a bit to try and compensate. Trace Configuration Skid: The trace triggers use the same CoreSight hardware as the Watchpoints. This means that it is possible a program counter skid will happen. The program might not start or stop on the exact location you set the trigger to. You might have to adjust the trigger point location to minimize this effect.
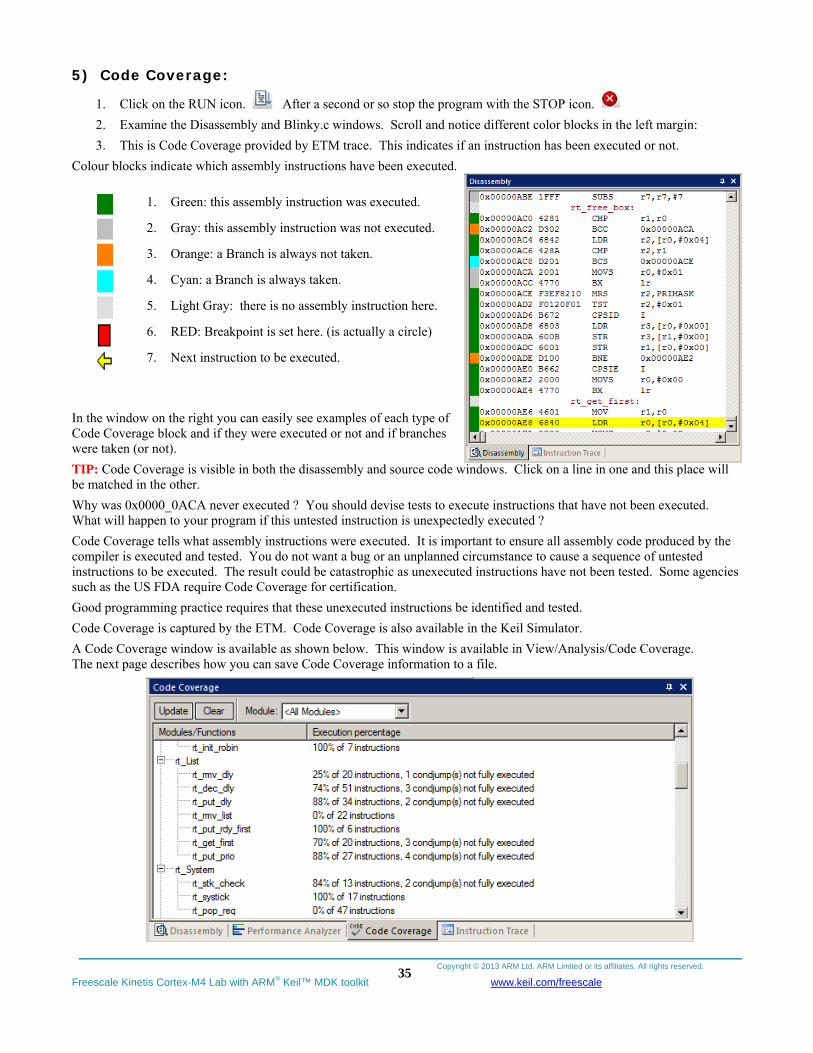
Copyright © 2013 ARM Ltd. ARM Limited or its affiliates. All rights reserved.
Freescale Kinetis Cortex-M4 Lab with ARM® Keil™ MDK toolkit www.keil.com/freescale
35
5) Code Coverage:
1. Click on the RUN icon. After a second or so stop the program with the STOP icon.
2. Examine the Disassembly and Blinky.c windows. Scroll and notice different color blocks in the left margin:
3. This is Code Coverage provided by ETM trace. This indicates if an instruction has been executed or not.
Colour blocks indicate which assembly instructions have been executed.
1. Green: this assembly instruction was executed.
2. Gray: this assembly instruction was not executed.
3. Orange: a Branch is always not taken.
4. Cyan: a Branch is always taken.
5. Light Gray: there is no assembly instruction here.
6. RED: Breakpoint is set here. (is actually a circle)
7. Next instruction to be executed.
In the window on the right you can easily see examples of each type of Code Coverage block and if they were executed or not and if branches were taken (or not).
TIP: Code Coverage is visible in both the disassembly and source code windows. Click on a line in one and this place will be matched in the other.
Why was 0x0000_0ACA never executed ? You should devise tests to execute instructions that have not been executed. What will happen to your program if this untested instruction is unexpectedly executed ?
Code Coverage tells what assembly instructions were executed. It is important to ensure all assembly code produced by the compiler is executed and tested. You do not want a bug or an unplanned circumstance to cause a sequence of untested instructions to be executed. The result could be catastrophic as unexecuted instructions have not been tested. Some agencies such as the US FDA require Code Coverage for certification.
Good programming practice requires that these unexecuted instructions be identified and tested.
Code Coverage is captured by the ETM. Code Coverage is also available in the Keil Simulator.
A Code Coverage window is available as shown below. This window is available in View/Analysis/Code Coverage. The next page describes how you can save Code Coverage information to a file.
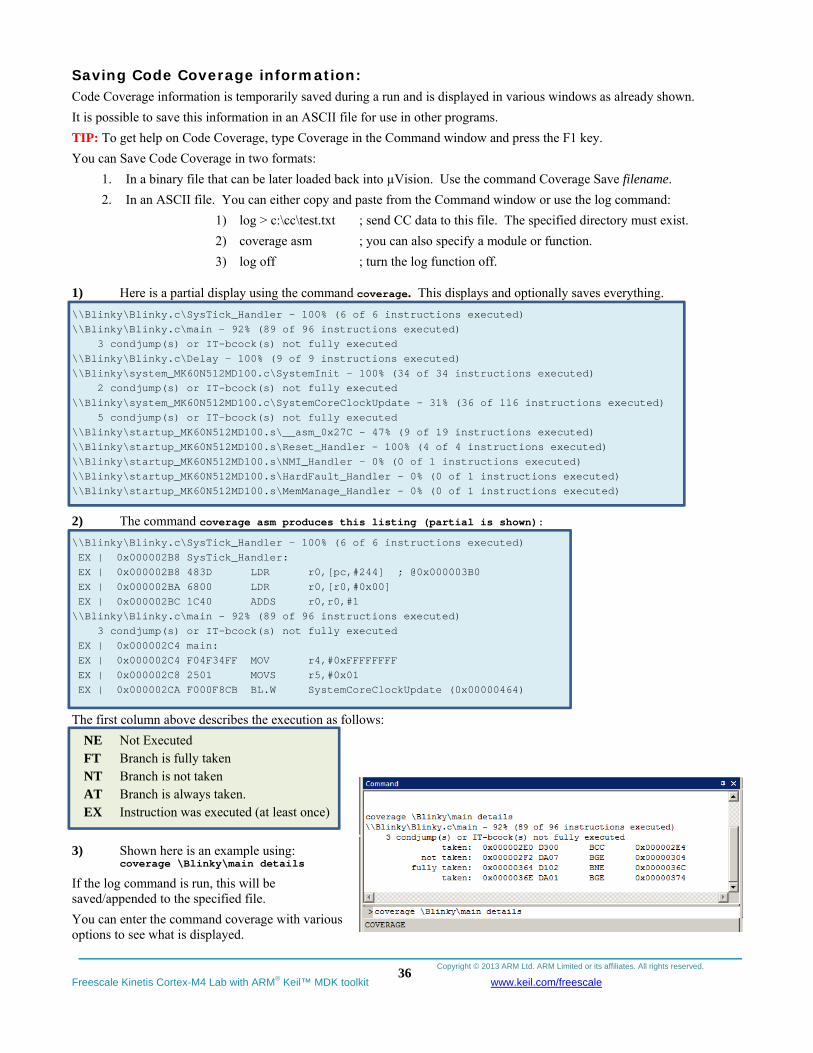
Copyright © 2013 ARM Ltd. ARM Limited or its affiliates. All rights reserved.
Freescale Kinetis Cortex-M4 Lab with ARM® Keil™ MDK toolkit www.keil.com/freescale
36
Saving Code Coverage information: Code Coverage information is temporarily saved during a run and is displayed in various windows as already shown.
It is possible to save this information in an ASCII file for use in other programs.
TIP: To get help on Code Coverage, type Coverage in the Command window and press the F1 key.
You can Save Code Coverage in two formats:
1. In a binary file that can be later loaded back into µVision. Use the command Coverage Save filename.
2. In an ASCII file. You can either copy and paste from the Command window or use the log command:
1) log > c:\cc\test.txt ; send CC data to this file. The specified directory must exist.
2) coverage asm ; you can also specify a module or function.
3) log off ; turn the log function off.
1) Here is a partial display using the command coverage. This displays and optionally saves everything.
\\Blinky\Blinky.c\SysTick_Handler - 100% (6 of 6 instructions executed) \\Blinky\Blinky.c\main - 92% (89 of 96 instructions executed) 3 condjump(s) or IT-bcock(s) not fully executed \\Blinky\Blinky.c\Delay - 100% (9 of 9 instructions executed) \\Blinky\system_MK60N512MD100.c\SystemInit - 100% (34 of 34 instructions executed) 2 condjump(s) or IT-bcock(s) not fully executed \\Blinky\system_MK60N512MD100.c\SystemCoreClockUpdate - 31% (36 of 116 instructions executed) 5 condjump(s) or IT-bcock(s) not fully executed \\Blinky\startup_MK60N512MD100.s\__asm_0x27C - 47% (9 of 19 instructions executed) \\Blinky\startup_MK60N512MD100.s\Reset_Handler - 100% (4 of 4 instructions executed) \\Blinky\startup_MK60N512MD100.s\NMI_Handler - 0% (0 of 1 instructions executed) \\Blinky\startup_MK60N512MD100.s\HardFault_Handler - 0% (0 of 1 instructions executed) \\Blinky\startup_MK60N512MD100.s\MemManage_Handler - 0% (0 of 1 instructions executed)
2) The command coverage asm produces this listing (partial is shown):
\\Blinky\Blinky.c\SysTick_Handler - 100% (6 of 6 instructions executed) EX | 0x000002B8 SysTick_Handler: EX | 0x000002B8 483D LDR r0,[pc,#244] ; @0x000003B0 EX | 0x000002BA 6800 LDR r0,[r0,#0x00] EX | 0x000002BC 1C40 ADDS r0,r0,#1 \\Blinky\Blinky.c\main - 92% (89 of 96 instructions executed) 3 condjump(s) or IT-bcock(s) not fully executed EX | 0x000002C4 main: EX | 0x000002C4 F04F34FF MOV r4,#0xFFFFFFFF EX | 0x000002C8 2501 MOVS r5,#0x01 EX | 0x000002CA F000F8CB BL.W SystemCoreClockUpdate (0x00000464)
The first column above describes the execution as follows:
NE Not Executed FT Branch is fully taken NT Branch is not taken AT Branch is always taken. EX Instruction was executed (at least once)
3) Shown here is an example using: coverage \Blinky\main details
If the log command is run, this will be saved/appended to the specified file.
You can enter the command coverage with various options to see what is displayed.
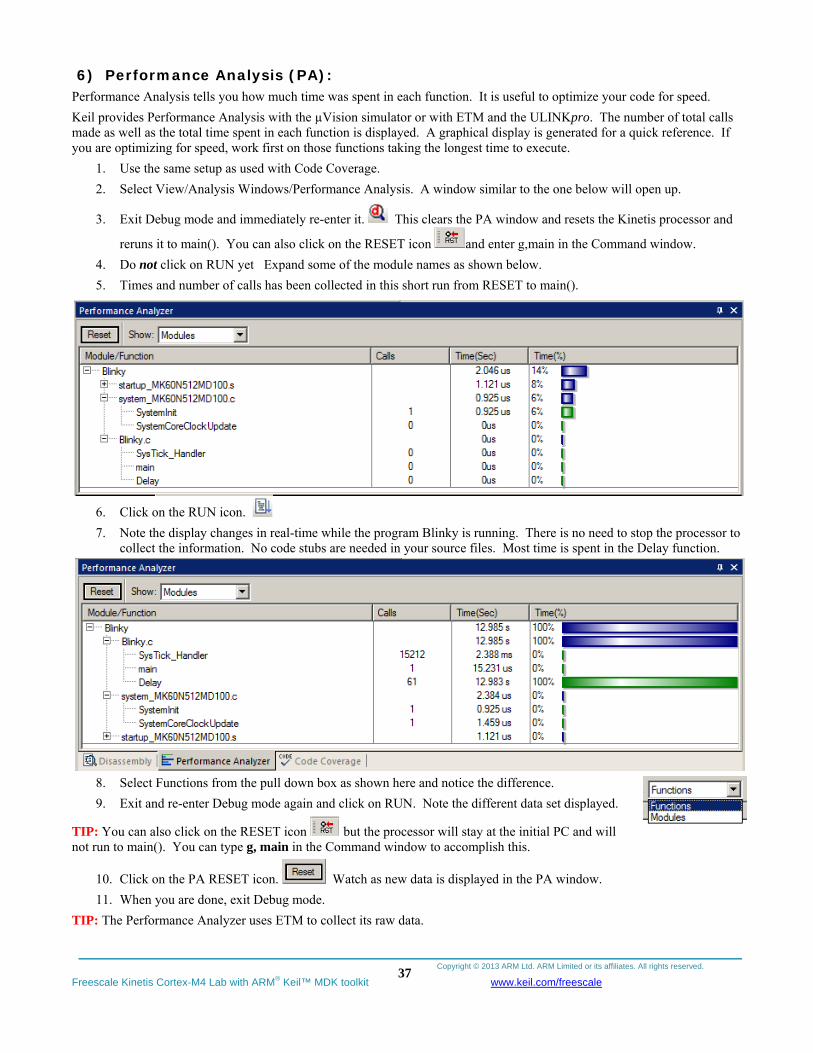
Copyright © 2013 ARM Ltd. ARM Limited or its affiliates. All rights reserved.
Freescale Kinetis Cortex-M4 Lab with ARM® Keil™ MDK toolkit www.keil.com/freescale
37
6) Performance Analysis (PA): Performance Analysis tells you how much time was spent in each function. It is useful to optimize your code for speed.
Keil provides Performance Analysis with the µVision simulator or with ETM and the ULINKpro. The number of total calls made as well as the total time spent in each function is displayed. A graphical display is generated for a quick reference. If you are optimizing for speed, work first on those functions taking the longest time to execute.
1. Use the same setup as used with Code Coverage.
2. Select View/Analysis Windows/Performance Analysis. A window similar to the one below will open up.
3. Exit Debug mode and immediately re-enter it. This clears the PA window and resets the Kinetis processor and
reruns it to main(). You can also click on the RESET icon and enter g,main in the Command window.
4. Do not click on RUN yet Expand some of the module names as shown below.
5. Times and number of calls has been collected in this short run from RESET to main().
6. Click on the RUN icon.
7. Note the display changes in real-time while the program Blinky is running. There is no need to stop the processor to collect the information. No code stubs are needed in your source files. Most time is spent in the Delay function.
8. Select Functions from the pull down box as shown here and notice the difference.
9. Exit and re-enter Debug mode again and click on RUN. Note the different data set displayed.
TIP: You can also click on the RESET icon but the processor will stay at the initial PC and will not run to main(). You can type g, main in the Command window to accomplish this.
10. Click on the PA RESET icon. Watch as new data is displayed in the PA window.
11. When you are done, exit Debug mode.
TIP: The Performance Analyzer uses ETM to collect its raw data.
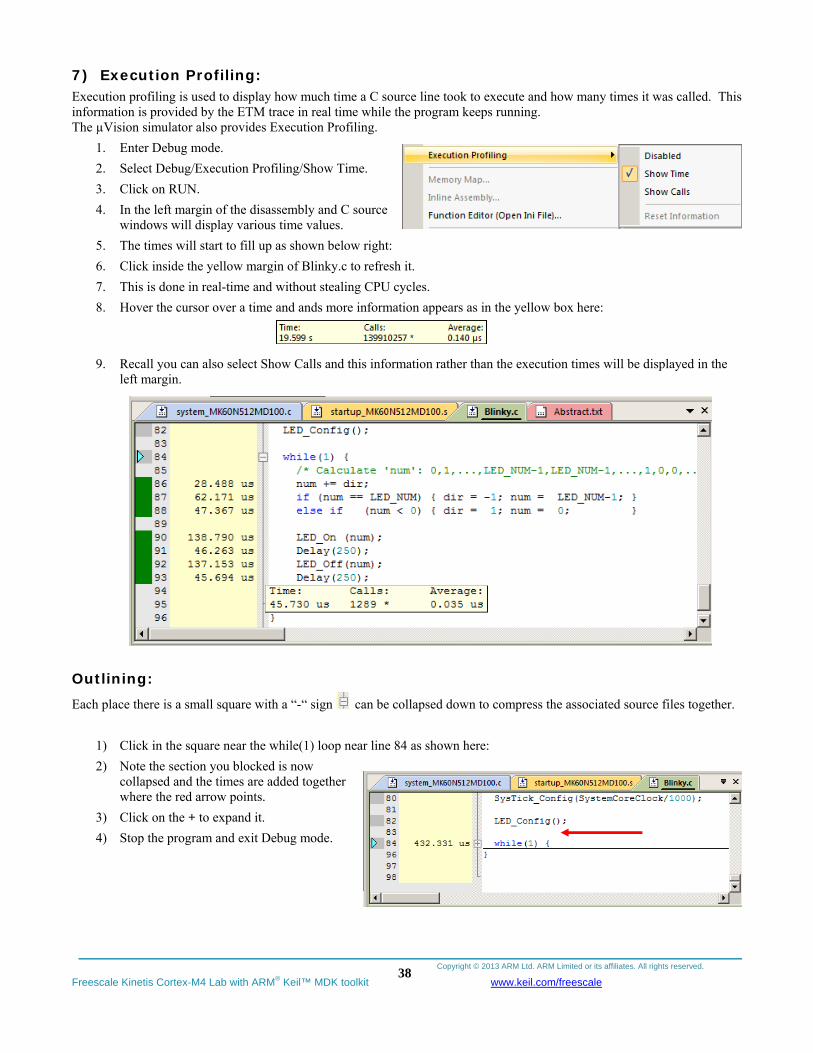
Copyright © 2013 ARM Ltd. ARM Limited or its affiliates. All rights reserved.
Freescale Kinetis Cortex-M4 Lab with ARM® Keil™ MDK toolkit www.keil.com/freescale
38
7) Execution Profiling: Execution profiling is used to display how much time a C source line took to execute and how many times it was called. This information is provided by the ETM trace in real time while the program keeps running. The µVision simulator also provides Execution Profiling.
1. Enter Debug mode.
2. Select Debug/Execution Profiling/Show Time.
3. Click on RUN.
4. In the left margin of the disassembly and C source windows will display various time values.
5. The times will start to fill up as shown below right:
6. Click inside the yellow margin of Blinky.c to refresh it.
7. This is done in real-time and without stealing CPU cycles.
8. Hover the cursor over a time and ands more information appears as in the yellow box here:
9. Recall you can also select Show Calls and this information rather than the execution times will be displayed in the left margin.
Outlining: Each place there is a small square with a “-“ sign can be collapsed down to compress the associated source files together.
1) Click in the square near the while(1) loop near line 84 as shown here:
2) Note the section you blocked is now collapsed and the times are added together where the red arrow points.
3) Click on the + to expand it.
4) Stop the program and exit Debug mode.
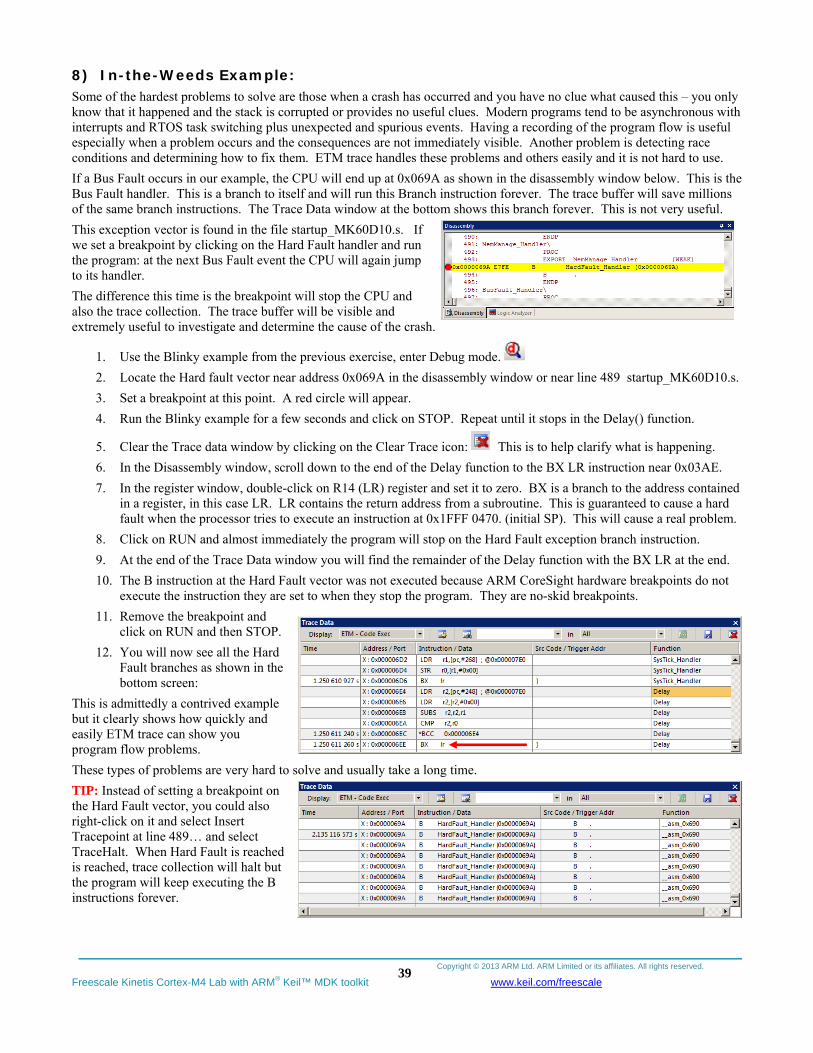
Copyright © 2013 ARM Ltd. ARM Limited or its affiliates. All rights reserved.
Freescale Kinetis Cortex-M4 Lab with ARM® Keil™ MDK toolkit www.keil.com/freescale
39
8) In-the-Weeds Example: Some of the hardest problems to solve are those when a crash has occurred and you have no clue what caused this – you only know that it happened and the stack is corrupted or provides no useful clues. Modern programs tend to be asynchronous with interrupts and RTOS task switching plus unexpected and spurious events. Having a recording of the program flow is useful especially when a problem occurs and the consequences are not immediately visible. Another problem is detecting race conditions and determining how to fix them. ETM trace handles these problems and others easily and it is not hard to use.
If a Bus Fault occurs in our example, the CPU will end up at 0x069A as shown in the disassembly window below. This is the Bus Fault handler. This is a branch to itself and will run this Branch instruction forever. The trace buffer will save millions of the same branch instructions. The Trace Data window at the bottom shows this branch forever. This is not very useful.
This exception vector is found in the file startup_MK60D10.s. If we set a breakpoint by clicking on the Hard Fault handler and run the program: at the next Bus Fault event the CPU will again jump to its handler.
The difference this time is the breakpoint will stop the CPU and also the trace collection. The trace buffer will be visible and extremely useful to investigate and determine the cause of the crash.
1. Use the Blinky example from the previous exercise, enter Debug mode.
2. Locate the Hard fault vector near address 0x069A in the disassembly window or near line 489 startup_MK60D10.s.
3. Set a breakpoint at this point. A red circle will appear.
4. Run the Blinky example for a few seconds and click on STOP. Repeat until it stops in the Delay() function.
5. Clear the Trace data window by clicking on the Clear Trace icon: This is to help clarify what is happening.
6. In the Disassembly window, scroll down to the end of the Delay function to the BX LR instruction near 0x03AE.
7. In the register window, double-click on R14 (LR) register and set it to zero. BX is a branch to the address contained in a register, in this case LR. LR contains the return address from a subroutine. This is guaranteed to cause a hard fault when the processor tries to execute an instruction at 0x1FFF 0470. (initial SP). This will cause a real problem.
8. Click on RUN and almost immediately the program will stop on the Hard Fault exception branch instruction.
9. At the end of the Trace Data window you will find the remainder of the Delay function with the BX LR at the end.
10. The B instruction at the Hard Fault vector was not executed because ARM CoreSight hardware breakpoints do not execute the instruction they are set to when they stop the program. They are no-skid breakpoints.
11. Remove the breakpoint and click on RUN and then STOP.
12. You will now see all the Hard Fault branches as shown in the bottom screen:
This is admittedly a contrived example but it clearly shows how quickly and easily ETM trace can show you program flow problems.
These types of problems are very hard to solve and usually take a long time.
TIP: Instead of setting a breakpoint on the Hard Fault vector, you could also right-click on it and select Insert Tracepoint at line 489… and select TraceHalt. When Hard Fault is reached is reached, trace collection will halt but the program will keep executing the B instructions forever.

Copyright © 2013 ARM Ltd. ARM Limited or its affiliates. All rights reserved.
Freescale Kinetis Cortex-M4 Lab with ARM® Keil™ MDK toolkit www.keil.com/freescale
40
9) Serial Wire and ETM Trace Summary: We have several basic debug systems as implemented in Kinetis Cortex-M4 devices:
1. SWV and ITM data output on the SWO pin located on the JTAG/SWD debug connector.
2. ITM is a printf type viewer. ASCII characters are displayed in the Debug printf Viewer in µVision.
3. Memory Reads and Writes in/out the JTAG/SWD ports. The Memory and Watch windows use this technology.
4. Breakpoints and Watchpoints are set/unset through the JTAG/SWD ports.
5. ETM provides a record of all instructions executed.
These are all completely controlled through µVision via a ULINK.
These are the types of problems that can be found with a quality trace: SWV Trace adds significant power to debugging efforts. Problems which may take hours, days or even weeks in big projects can often be found in a fraction of these times with a trace. Especially useful is where the bug occurs a long time before the consequences are seen or where the state of the system disappears with a change in scope(s) or RTOS task switches.
Usually, these techniques allow finding bugs without stopping the program. These are the types of problems that can be found with a quality trace: Some of these items need ETM trace.
1) Pointer problems.
2) Illegal instructions and data aborts (such as misaligned writes). How I did I get to this Fault vector ?
3) Code overwrites – writes to Flash, unexpected writes to peripheral registers (SFRs). How did I get here ?
4) A corrupted stack.
5) Out of bounds data. Uninitialized variables and arrays.
6) Stack overflows. What causes the stack to grow bigger than it should ?
7) Runaway programs: your program has gone off into the weeds and you need to know what instruction caused this. This is probably the most important use of trace. Needs ETM to be most useful.
8) Communication protocol and timing issues. System timing problems.
Trace adds significant power to debugging efforts. Tells you where the program has been.
Weeks or months can be replaced by minutes.
Especially where the bug occurs a long time before any consequences are seen.
Or where the state of the system disappears with a change in scope(s).
Plus - don’t have to stop the program. Crucial to some.
A recorded history of the program execution in the order it happened.
Trace can often find nasty problems very quickly.
Profile Analysis and Code Coverage is provided. Available only with ETM trace.
What kind of data can the Serial Wire Viewer display ? 1. Global variables.
2. Static variables.
3. Structures.
4. Can see Peripheral registers – just read or write to them. The same is true for memory locations.
5. Can see executed instructions. SWV only samples them.
6. CPU counters. Folded instructions, extra cycles and interrupt overhead.
What Kind of Data the Serial Wire Viewer can’t display… 1. Can’t see local variables. (just make them global or static).
2. Can’t see register operations. PC Samples records some of the instructions but not the data values.
3. SWV can’t see DMA transfers. This is because by definition these transfers bypass the CPU. SWV and ETM can only see CPU actions.
Copyright © 2013 ARM Ltd. ARM Limited or its affiliates. All rights reserved.
Freescale Kinetis Cortex-M4 Lab with ARM® Keil™ MDK toolkit www.keil.com/freescale
41
10) Keil Products and contact information: See www.keil.com/freescale Keil Microcontroller Development Kit (MDK-ARM™) for Kinetis processors:
MDK-Lite™ (Evaluation version) 32K Code and Data Limit - $0 MDK-Freescale™ For all Kinetis Cortex-M3/4, 1 year renewable term license - $745
NEW !! MDK-ARM-CM™ (for Cortex-M series processors only – unlimited code limit) - $3,200 MDK-Standard™ (with included RTX RTOS with source code) - $4,895 MDK-Professional (Includes Flash File, TCP/IP, CAN and USB driver libraries) $9,500
USB-JTAG adapter (for Flash programming too) ULINK2 - $395 (ULINK2 and ME - SWV only – no ETM) ULINK-ME – sold only with a board by Keil or OEM. ULINKpro - $1,250 – Cortex-Mx SWV & ETM trace
A Keil ULINK must be purchased or you can use the OS-JTAG on the Kinetis Tower board. For Serial Wire Viewer (SWV), a ULINK2, ULINK-ME or a J-Link is needed. For ETM support, a ULINKpro is needed. OS-JTAG does not support either SWV or ETM debug technology.
Note: USA prices. Contact [email protected] for pricing in other countries.
Call Keil Sales for more details on current pricing. All products are available.
For the ARM University program: go to www.arm.com and search for university. Email: [email protected]
All products include Technical Support for 1 year. This can be renewed.
Keil RTX™ Real Time Operating System
RTX is provided free as part of Keil MDK. It is the full version of RTX – it is not restricted or crippled. No royalties are required and is very easy to use. It has a BSD license. RTX source code is included with all versions of MDK. Kernel Awareness visibility integral to µVision.
MQX: See www.keil.com/freescale for a descriptive movie.
Prices are for reference only and are subject to change without notice.
For the entire Keil catalog see www.keil.com or contact Keil or your local distributor.
For Linux, Android, bare metal (no OS) and other OS support on Freescale i.MX and Vybrid series processors please see DS-5 at www.arm.com/ds5/.
For more information: Keil Sales In North and South America: [email protected] or 800-348-8051. Outside the US: [email protected]
Keil Technical Support in USA: [email protected] or 800-348-8051. Outside the US: [email protected].
For comments or corrections please email [email protected].
For the latest version of this document, contact the author, Keil Technical support or www.keil.com/freescale.
For more information: www.arm.com/cmsis, www.keil.com/forum and http://community.arm.com/groups/tools/content