Embed Size (px)
Citation preview

Fuel Poverty and Disability: a statistical analysis of the English Housing Survey
Version 2
Annex B
Harriet Thomson
Carolyn Snell
Mark Bevan

2
Contents
Introduction........................................................................................................................................ 3
Executive summary ............................................................................................................................ 4
Methodology ...................................................................................................................................... 5
Measurement of disability .............................................................................................................. 5
Fuel poverty definitions used ......................................................................................................... 5
Classification of Disability Living Allowance as income .................................................................. 6
Limitations of the data ................................................................................................................... 7
Findings .............................................................................................................................................. 9
Headline results .............................................................................................................................. 9
Fuel poverty rates by EHS category of disability ........................................................................ 134
Region ........................................................................................................................................... 21
Poverty………………………………………………………………………………………………………………………………..….22
Household composition ................................................................................................................ 27
Tenure type................................................................................................................................... 29
Payment type .............................................................................................................................. 310
Case studies: the impact of DLA on definitions of fuel poverty..................................................... 343
Summary and conclusion………………………………………………………………………………………..………………….36
References ...................................................................................................................................... 377
Appendix 1: EHS Variable descriptions and transformations ......................................................... 39
Appendix 2: Variable routing and frequencies.............................................................................. 444
Appendix 3: Sample sizes .............................................................................................................. 455
Appendix 4: Full results tables.........................................................................................................50

3
Introduction
The Department of Social Policy and Social Work and the Centre for Housing Policy at the University of York have been awarded a grant by Eaga Charitable Trust to investigate the relationship between fuel poverty and disability. This first project deliverable considers the relationship between different indicators of disability and long term illness (self reported, ‘officially’ defined, and types of reported disability and illness), different measures of fuel poverty (the ‘official’ full income version, and the often used basic income version), and a range of other factors typically associated with the prevalence of fuel poverty. The results presented are taken from the 2010 to 2011 year of the English Housing Survey (EHS). Household level data have been used to consider two key variables based on the presence of at least one household member with a disability or illness and the two definitions of fuel poverty described above. These results are then analysed against a number of other factors often associated with fuel poverty; household composition, tenure type, and measures of low income (see for example Fahmy et al 2011, DECC 2012, Walker and Day 2012, Baker et al 2003). Region has also been considered as fuel poverty rates have been found to vary significantly across England (DECC 2012), as do numbers of disability related benefit claims such as incapacity benefit (Beatty and Fothergill 2011). In addition to this analysis, household and individual level data have been combined in order to examine the extent of fuel poverty in households that contain one or more individuals with a particular type of disability (for example, a visual impairment). Payment methods have also been considered as a result of feedback on the first draft of this report.
Within the field of disability studies there are many debates about terminology (see for example Barnes and Mercer 2010 or Campbell and Oliver 1996). The authors wish to stress that one of the limitations of secondary analysis is that variables, categories and descriptors are set by those developing the original survey and dataset. For purposes of clarity and replicability, we use the original EHS terminology throughout this analysis, whilst recognising that these descriptions and categories may be narrow in focus, and at times use a ‘medicalised’1 model of disability.
There are a number of limitations to this analysis. Firstly, there are limitations associated with the three definitions of fuel poverty used within this report, and it is likely that the application of alternative definitions of fuel poverty such as the Minimum Income Standard based fuel poverty proposed by Moore (2012) will lead to different results. Secondly, there are arguments for ‘uprating’ the dataset by increasing benefits and tax allowances to current rates in order to simulate a more up to date dataset. Thirdly, and most importantly, as repeatedly discussed in the literature (for example Hills 2011, Baker 2011) the current calculation of fuel poverty classifies disability benefits such as Disability Living Allowance (DLA) and Attendance Allowance (AA) as income. As such it is highly likely that our findings underestimate fuel poverty amongst disabled people. In order to counter this as a first step we have calculated fuel poverty rates where DLA and AA are excluded from the calculation of income. Additionally, we have created a number of case study scenarios based on the data in the EHS to demonstrate the effects of excluding DLA from the analysis of fuel poverty.
1 Where disability is regarded as an ‘individualised medical problem’ and disregards ways in which society restricts
participation in mainstream economic and social activities (Oliver and Barnes 2012: 22).

4
Executive summary
This deliverable reports analysis that has been carried out on the 2010 to 2011 English Housing Survey (EHS).
A greater proportion of households containing disabled people are fuel poor compared with households that do not contain someone who disabled. When Disability Living Allowance (DLA) and Attendance Allowance (AA) are removed from the calculation of income, fuel poverty rates tend to increase, although this varies by the measure of fuel poverty used, and other factors such as type of disability, region, tenure and household composition. Typically fuel poverty rates are lower under the Low Income High Costs (LIHC) measure.
Fuel poverty rates vary by type of disability and by the measure of fuel poverty. Key findings are:
18 per cent of households containing at least one member with a mental health issue are classified as being fuel poor under the LIHC definition, compared to 20 per cent under the 10% full income definition and 33.3 per cent under the 10% basic income definition.
12.5 per cent of households containing a member with heart disease are classified as fuel poor under the LIHC definition compared to 22.2 per cent of households under the full income definition and 24.4 per cent under the basic income definition. Of all the fuel poor, 22.1 per cent (full income) or 20.6 per cent (basic income) of households contain a person with heart disease.
Of all the fuel poor, 23 per cent (full income) or 24.3 per cent (basic income) of households contain a person with a breathing difficulty.
Of all the fuel poor, 44.1 per cent (full income) or 43 per cent (basic income) of households contain a person with a mobility disability.
Fuel poverty rates are highest amongst households containing someone with a disability or illness in the East and West Midlands, North West, North East and Yorkshire and the Humber.
Fuel poverty rates vary by household composition type (combined with the presence of a disability). The impact of the LIHC definition is more varied than in previous analyses, the levels of fuel poverty are highest for lone parents with dependent children under a LIHC measure, whereas single households have the highest fuel poverty rates under the 10% measures. This is most likely a consequence of the equivalisation of income that occurs under the LIHC definition, whereby incomes are adjusted to reflect household size. In the case of both indicators of disability the fuel poverty rates in the private rented sector are the highest
Fuel poverty rates are high amongst all households that pay energy bills using prepayment methods, and are highest amongst households containing someone who is sick or disabled. The application of the LIHC definition results in substantially lower rates of fuel poverty across all payment methods when compared to the two 10% measures. For example, under a LIHC definition fuel poverty rates are 19 per cent lower for pre-payment electricity customers in households containing someone with a disability when compared to the estimate produced by the 10% basic income indicator.
5
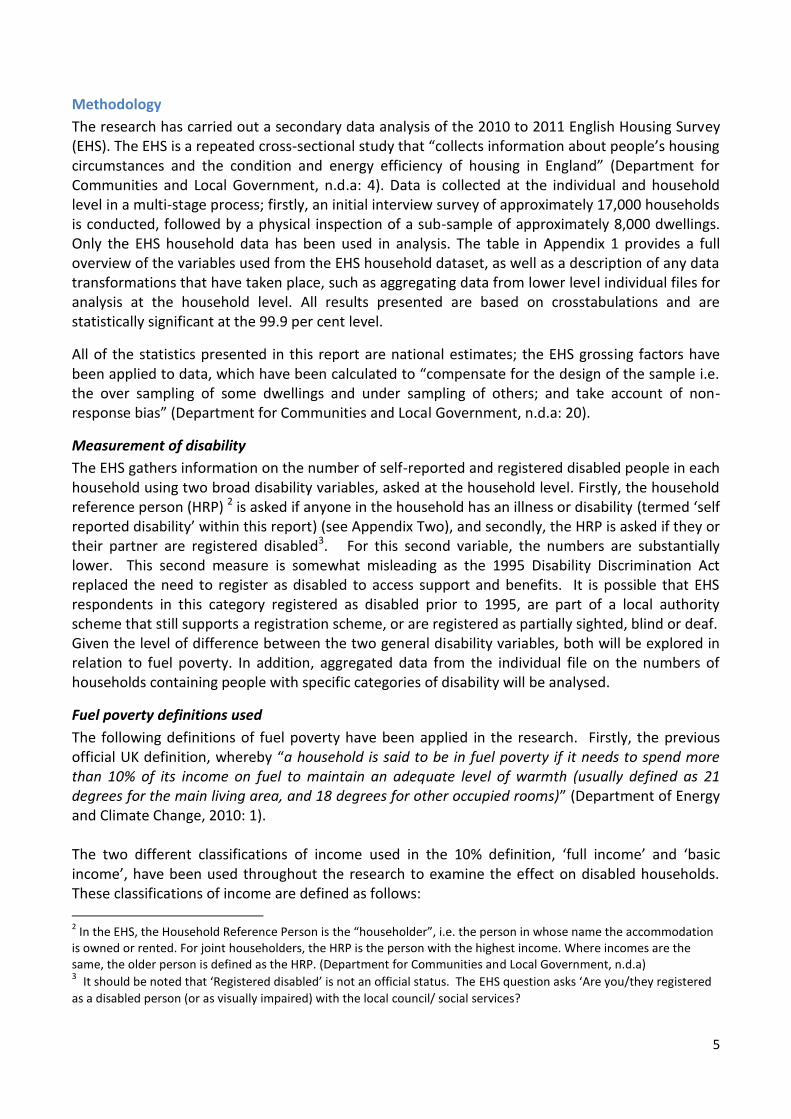
Methodology
The research has carried out a secondary data analysis of the 2010 to 2011 English Housing Survey (EHS). The EHS is a repeated cross-sectional study that “collects information about people’s housing circumstances and the condition and energy efficiency of housing in England” (Department for Communities and Local Government, n.d.a: 4). Data is collected at the individual and household level in a multi-stage process; firstly, an initial interview survey of approximately 17,000 households is conducted, followed by a physical inspection of a sub-sample of approximately 8,000 dwellings. Only the EHS household data has been used in analysis. The table in Appendix 1 provides a full overview of the variables used from the EHS household dataset, as well as a description of any data transformations that have taken place, such as aggregating data from lower level individual files for analysis at the household level. All results presented are based on crosstabulations and are statistically significant at the 99.9 per cent level.
All of the statistics presented in this report are national estimates; the EHS grossing factors have been applied to data, which have been calculated to “compensate for the design of the sample i.e. the over sampling of some dwellings and under sampling of others; and take account of non-response bias” (Department for Communities and Local Government, n.d.a: 20).
Measurement of disability
The EHS gathers information on the number of self-reported and registered disabled people in each household using two broad disability variables, asked at the household level. Firstly, the household reference person (HRP) 2 is asked if anyone in the household has an illness or disability (termed ‘self reported disability’ within this report) (see Appendix Two), and secondly, the HRP is asked if they or their partner are registered disabled3. For this second variable, the numbers are substantially lower. This second measure is somewhat misleading as the 1995 Disability Discrimination Act replaced the need to register as disabled to access support and benefits. It is possible that EHS respondents in this category registered as disabled prior to 1995, are part of a local authority scheme that still supports a registration scheme, or are registered as partially sighted, blind or deaf. Given the level of difference between the two general disability variables, both will be explored in relation to fuel poverty. In addition, aggregated data from the individual file on the numbers of households containing people with specific categories of disability will be analysed.
Fuel poverty definitions used
The following definitions of fuel poverty have been applied in the research. Firstly, the previous official UK definition, whereby “a household is said to be in fuel poverty if it needs to spend more than 10% of its income on fuel to maintain an adequate level of warmth (usually defined as 21 degrees for the main living area, and 18 degrees for other occupied rooms)” (Department of Energy and Climate Change, 2010: 1). The two different classifications of income used in the 10% definition, ‘full income’ and ‘basic income’, have been used throughout the research to examine the effect on disabled households. These classifications of income are defined as follows:
2 In the EHS, the Household Reference Person is the “householder”, i.e. the person in whose name the accommodation
is owned or rented. For joint householders, the HRP is the person with the highest income. Where incomes are the same, the older person is defined as the HRP. (Department for Communities and Local Government, n.d.a) 3 It should be noted that ‘Registered disabled’ is not an official status. The EHS question asks ‘Are you/they registered
as a disabled person (or as visually impaired) with the local council/ social services?

6
The ‘basic income’ definition is a measure of household income and is calculated by adding the personal incomes of every member of the household together plus any benefit payments that the household receives (from private source, state benefits and savings) but excludes income related directly to housing (Department of Energy and Climate Change, 2010:11).
The ‘full income’ definition is the official headline figure. In addition to the basic income measure, it includes income related directly to housing (i.e. Housing benefit, Income Support for Mortgage Interest (ISMI), Mortgage Payment Protection Insurance (MPPI) and Council Tax Benefit (CTB) (Department of Energy and Climate Change, 2010: 11).
Secondly, the newly adopted Low Income High Costs (LIHC) indicator of fuel poverty has been used. Under the LIHC framework, a household is considered to be fuel poor where:
they have required fuel costs that are above average (the national median level)
were they to spend that amount, they would be left with a residual income below the official poverty line (Department of Energy and Climate Change, 2013: 3).
Classification of DLA and AA as income
Treating benefits such as Disability Living Allowance (DLA) and Attendance Allowance (AA) as income for the purposes of poverty calculations is controversial as it is argued that this exaggerates disabled people’s incomes, artificially pushing some above the poverty threshold (e.g. see Parckar 2008, Bevan Foundation 2009). The main criticism is that benefits such as DLA are not disposable income, but are in fact specifically there to ‘help with the extra costs caused by a disability’ (DWP 2013). Arguably then, as with the treatment of housing benefit under the full income definition of fuel poverty, disability benefits such as DLA are likely to be spent on specific goods and services, rather than being available to pay for energy costs. However, at present, benefits such as DLA and AA are included in household income calculations in the fuel poverty methodology. In the fuel poverty review Hills argues that “classifying DLA as general income for measuring fuel poverty implicitly assumes that its recipients are better off than those who do not receive it” (Hills, 2012: 92). Hills further states “removing DLA from the income calculation would be appropriate, reflecting more general arguments about the way in which its inclusion leads to understatement of the proportion of disabled people who have low incomes” (2012: 92), a position which Baker (2011) also supports, stating that fuel poverty would increase considerably for people with disabilities if disability benefits were not treated as income.
Given this, this report explores disability in relation to the conventional calculations of fuel poverty, with DLA and AA treated as income, but additionally, in relation to a modified fuel poverty definition that excludes DLA and AA. The exclusion of these two benefits is consistent with additional statistical work conducted by DECC (2013: 17).
A set of new basic and full household income variables, and new fuel poverty flags and indexes were created with DLA and AA payments subtracted, enabling the analysis to be re-run with a modified measurement of income. The results of this analysis are not reported in full as with the analysis of the conventional calculation of fuel poverty, instead comparisons are drawn within each section of the report. This is just a first step, and further disability related benefits could also be removed. However, the purpose of removing DLA and AA is to indicate how the inclusion of such benefits in fuel poverty calculations alters fuel poverty rates. It may also indicate where fuel

7
poverty levels may rise under the transition from DLA to Personal Independence Payments (PIP) given the likely reduction in PIP caseload (see for example Kaye et al 2012, Scope 2012).
Limitations of the data
There are a number of limitations with the EHS data, including the method for calculating fuel costs, which Moore (2012) has stated is too generalised. In addition, Moore criticises the use of average fuel prices, which he states is likely to significantly underestimate fuel poverty as the fuel poor tend to be on higher than average tariffs for their region and payment type. In relation to the disability variables, there are discrepancies between the aggregated lower level disability variables and the household variables, as displayed in Table 1. In addition, the aggregated categories of disability are limited in sample size (see Appendix Two), and so some caution should be applied to the disaggregated analysis. These data issues will require further investigation in order to ascertain the validity of the disability variables.
Table 1: Variation in disability variable counts
Variable name
Hhold contains person(s) registered disabled
HRP or Partner registered disabled
Hhold contains person(s) with long-stndg illness, disab/infirmity
Anyone in hhold have illness or disability?
Level of data
Aggregated person level data
Household level data
Aggregated person level data
Household level data
Count 2202657 1874723 10116937 6319900
Percent 10.20 8.68 46.8 29.3
In addition to this the way in which households that contain members with multiple disabilities (or multiple members with disabilities) are treated within this data analysis must be described. There are several ways in which the responses of disabled people can be counted more than once in the calculation of fuel poverty rates, thus potentially artificially increasing levels of fuel poverty. Firstly, this could occur if a household contains more than one person with the same type of disability. However, due to the aggregation method used, if multiple people in a household report having the same type of disability, their household will only be counted once. Whilst this avoids artificially increasing the occurrence of fuel poverty, it may also mask subtle differences between households containing only one person with a mobility disability, for instance, compared with a household containing three people with mobility disabilities. Table 2 presents information on the percentage of people within a household reporting each disability category. As can be seen, within households that contain someone with a disability, the majority contain only one person reporting a certain disability category.

8
Table 2: Percentage of people within each household reporting each type of disability
Number of people in HH
Valid percentage (missing values excluded) of people reporting that they have each disability
Vision (%)
Hearing (%)
Learning difficulty (%)
Mobility (%)
Breathing (%)
Heart disease (%)
Mental health (%)
Other (%)
0 92 93 96 59 75 81 90 55
1 7 7 3 35 22 17 9 37
2 1 1 0 5 2 2 1 7
3 0 0 0 1 1 0 0 1
4 0 0 0 0 0 0 0 0
5 0 0 0 0 0 0 0 0
6 0 0 0 0 0 0 0 0
7 0 0 0 0 0 0 0 0
A second and third way in which a household may be counted multiple times in fuel poverty statistics, in relation to categories of disability, is if a) a household contains multiple disabled people, reporting different types of disability, and/or b) a household contains someone with more than one reported category of disability. These are weaknesses of the aggregation method used. Nevertheless, over fifty per cent of households containing a disabled person are single person households reporting one category of disability.
9
Findings
Headline results
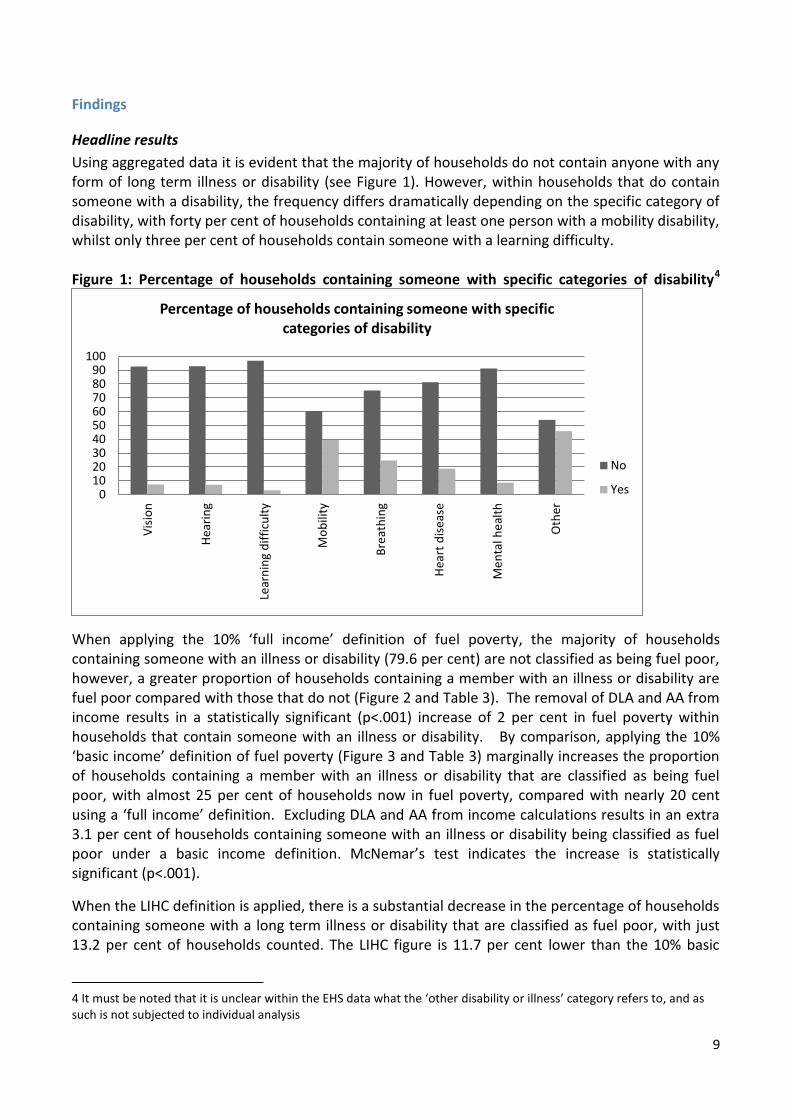
Using aggregated data it is evident that the majority of households do not contain anyone with any form of long term illness or disability (see Figure 1). However, within households that do contain someone with a disability, the frequency differs dramatically depending on the specific category of disability, with forty per cent of households containing at least one person with a mobility disability, whilst only three per cent of households contain someone with a learning difficulty. Figure 1: Percentage of households containing someone with specific categories of disability4
When applying the 10% ‘full income’ definition of fuel poverty, the majority of households containing someone with an illness or disability (79.6 per cent) are not classified as being fuel poor, however, a greater proportion of households containing a member with an illness or disability are fuel poor compared with those that do not (Figure 2 and Table 3). The removal of DLA and AA from income results in a statistically significant (p<.001) increase of 2 per cent in fuel poverty within households that contain someone with an illness or disability. By comparison, applying the 10% ‘basic income’ definition of fuel poverty (Figure 3 and Table 3) marginally increases the proportion of households containing a member with an illness or disability that are classified as being fuel poor, with almost 25 per cent of households now in fuel poverty, compared with nearly 20 cent using a ‘full income’ definition. Excluding DLA and AA from income calculations results in an extra 3.1 per cent of households containing someone with an illness or disability being classified as fuel poor under a basic income definition. McNemar’s test indicates the increase is statistically significant (p<.001).
When the LIHC definition is applied, there is a substantial decrease in the percentage of households containing someone with a long term illness or disability that are classified as fuel poor, with just 13.2 per cent of households counted. The LIHC figure is 11.7 per cent lower than the 10% basic
4 It must be noted that it is unclear within the EHS data what the ‘other disability or illness’ category refers to, and as such is not subjected to individual analysis
0102030405060708090
100
Vis
ion
Hea
rin
g
Lear
nin
g d
iffi
cult
y
Mo
bili
ty
Bre
ath
ing
Hea
rt d
isea
se
Me
nta
l he
alth
Oth
er
Percentage of households containing someone with specific categories of disability
No
Yes

10
income figure, and 7.2 per cent lower than the 10% full income figure (Figure 4 and Table 3). When DLA and AA are removed from income, there is a marginal increase in LIHC fuel poverty rates in households that contain someone with a long-term illness or disability of 1.1 per cent.
Table 3: Fuel poverty rates and disability
10% full income 10% basic income LIHC
HH contains someone with illness or disability
No one in HH has illness or disability
HH contains someone with illness or disability
No one in HH has illness or disability
HH contains someone with illness or disability
No one in HH has illness or disability
Percentage of population in fuel poverty (percentage)
20.4 14.6 24.9 16.0 13.2 10.5
Number of households in fuel poverty (millions)
1.29 2.21 1.57 2.42 0.84 1.60
Increase in fuel poverty after removing DLA & AA (percentage)
+ 2.0 - + 3.1 - + 1.2 -
Increase in number of fuel poor households after removing DLA & AA (thousands)
+ 413 - + 189 - + 72 -

11
Figure 2: Fuel poverty and households containing someone with an illness or disability (full income)
Figure 3: Fuel poverty and households containing someone with an illness or disability (basic income)
Figure 4: Fuel poverty (LIHC definition) within households that contain someone with illness or disability
79.6%
20.4%
85.4%
14.6%
Not in FP - full income definition In FP - full income definition
Fuel poverty (full income definition) within households that contain someone with illness or disability
Someone has illness or disability No one has illness or disability
75.1%
24.9%
84.0%
16.0%
Not in FP - basic income definition In FP - basic income definition
Fuel poverty (basic income definition) within households that contain someone with illness or disability
Someone has illness or disability No one has illness or disability
86.8%
13.2%
89.5%
10.5%
Not in fuel poverty In fuel poverty - LIHC
Fuel poverty (LIHC definition) within households that contain someone with illness or disability
Someone has illness or disability No one has illness or disability
12
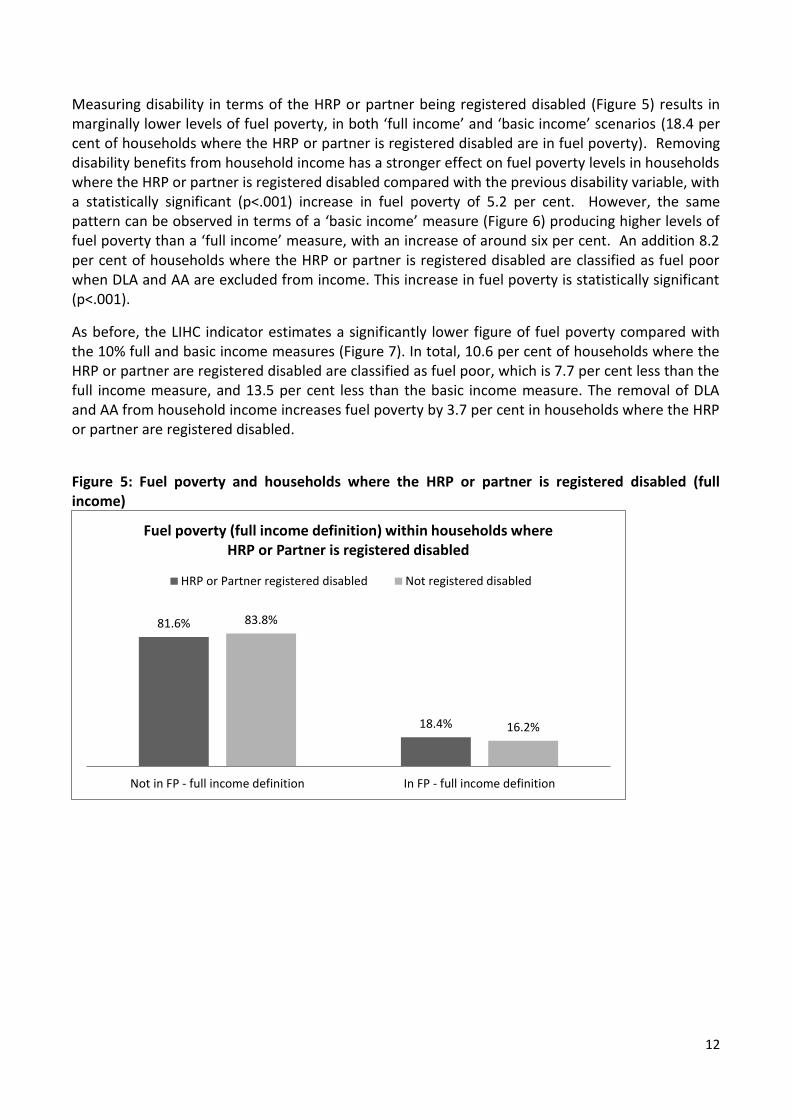
Measuring disability in terms of the HRP or partner being registered disabled (Figure 5) results in marginally lower levels of fuel poverty, in both ‘full income’ and ‘basic income’ scenarios (18.4 per cent of households where the HRP or partner is registered disabled are in fuel poverty). Removing disability benefits from household income has a stronger effect on fuel poverty levels in households where the HRP or partner is registered disabled compared with the previous disability variable, with a statistically significant (p<.001) increase in fuel poverty of 5.2 per cent. However, the same pattern can be observed in terms of a ‘basic income’ measure (Figure 6) producing higher levels of fuel poverty than a ‘full income’ measure, with an increase of around six per cent. An addition 8.2 per cent of households where the HRP or partner is registered disabled are classified as fuel poor when DLA and AA are excluded from income. This increase in fuel poverty is statistically significant (p<.001).
As before, the LIHC indicator estimates a significantly lower figure of fuel poverty compared with the 10% full and basic income measures (Figure 7). In total, 10.6 per cent of households where the HRP or partner are registered disabled are classified as fuel poor, which is 7.7 per cent less than the full income measure, and 13.5 per cent less than the basic income measure. The removal of DLA and AA from household income increases fuel poverty by 3.7 per cent in households where the HRP or partner are registered disabled.
Figure 5: Fuel poverty and households where the HRP or partner is registered disabled (full income)
81.6%
18.4%
83.8%
16.2%
Not in FP - full income definition In FP - full income definition
Fuel poverty (full income definition) within households where HRP or Partner is registered disabled
HRP or Partner registered disabled Not registered disabled

13
Figure 6: Fuel poverty and households where the HRP or partner is registered disabled (basic income)
Figure 7: Fuel poverty (LIHC definition) within households where HRP or Partner is registered disabled
Fuel poverty rates by EHS category of disability5 Figure 8 presents an overview of fuel poverty amongst households with at least one member with any of the EHS categories of disability. As noted in the introduction some of the terminology here may be both dated and ‘medicalised’, however, for replicability purposes we have continued to use the EHS categories and definitions. It is immediately apparent that fuel poverty rates vary by category of disability and by definition applied. The most notable difference here is in the mental health category where 18 per cent of households containing at least one member with a mental
5 Some categories of disability have limited samples (see Appendix Two), and so some caution should be applied to the
disaggregated analysis.
75.9%
24.1%
81.9%
18.1%
Not in FP - basic income definition In FP - basic income definition
Fuel poverty (basic income definition) within households where HRP or Partner is registered disabled
HRP or Partner registered disabled Not registered disabled
89.4%
10.6%
88.5%
11.5%
Not in fuel poverty In fuel poverty - LIHC
Fuel poverty (LIHC definition) within households where HRP or Partner is registered disabled
HRP or Partner registered disabled Not registered disabled

14
health issue are classified as being fuel poor under the LIHC definition, compared to 20 per cent under the 10% full income definition and 33.3 per cent under the basic income definition. With the exception of households containing at least one member with learning difficulties, the LIHC definition produces lower estimates of fuel poverty across all categories when compared to the basic and full income 10% definitions. The exclusion of DLA and AA from income increases fuel poverty rates across each category of disability, with increases of between 0.3 and 4.8 per cent. The lowest increase is found in the other and mental health categories, with an increase of 0.3 and 0.5 per cent respectively under a LIHC definition. By contrast, the highest increase occurs within the vision category, with fuel poverty increasing by 3.6 per cent under a full income definition, and 4.8 per cent under a basic income definition. Figure 8: Fuel Poverty (10% and LIHC definitions) by EHS category of disability
These figures can be broken down by the two definitions of fuel poverty, and by the EHS categories of disability.
0% 5% 10% 15% 20% 25% 30% 35%
Other
Mentalhealth
Heartdisease
Breathing
Mobility
Learning
Hearing
Vision
Fuel poverty (10% and LIHC definitions) by EHS category of disability
In FP - LIHC definition
In FP - 10% basic incomedefinition
In FP - 10% full incomedefinition

15
Figure 9 shows the comparison of fuel poverty rates amongst households that contain at least one member with a mental health issue compared against those that do not. Once again, the results are very different for households containing a person with a mental health issue when the basic income measure is applied, with a figure of 33.3 per cent compared with 18 per cent under the LIHC definition and 20 per cent under the full income 10% definition. Of all the fuel poor, 9.3 per cent (full income) or 13.1 per cent (basic income) of households contain a person with a mental health issue. Figure 9: Fuel poverty (10% and LIHC definitions) in households containing a person with a mental health issue
18.7% 21.1%
11.9%
20.0%
33.3%
18.0%
In FP - 10% full incomedefinition
In FP - 10% basic incomedefinition
In FP - LIHC definition
Fuel poverty (10% and LIHC definitions) in households containing a person with a mental health issue
No one in household has a mental health issue
Someone in household has a mental health issue

16
Figure 10 presents the same results for households containing at least one person with heart disease. The differences between the full income and basic income definitions still exist, but are not as noticeable as the mental health category. By comparison, the differences between the LIHC definition and the two 10% measures is more noticeable, with just 12.5 of households containing a member with heart disease classified as fuel poor under the LIHC definition compared to 22.2 per cent of household under the full income definition and 24.4 per cent under the basic income definition. Additionally, of all the fuel poor, 22.1 per cent (full income) or 20.6 per cent (basic income) of households contain a person with heart disease. Figure 10: Fuel poverty (10% and LIHC definitions) in households containing a person with heart disease
18.0%
21.7%
12.4%
22.2% 24.4%
12.5%
In FP - 10% full incomedefinition
In FP - 10% basic incomedefinition
In FP - LIHC definition
Fuel poverty (10% and LIHC definitions) in households containing a person with heart disease
No one in household has heart disease
Someone in household has heart disease

17
Figure 11 presents the results for households containing at least one person with ‘breathing difficulties’. Here, under both definitions there is a slightly lower proportion of households containing a person with a breathing difficulty in fuel poverty than those not containing one. However, these relatively modest results should not be taken to mean that this is not an important finding; of all the fuel poor, 23 per cent (full income) or 24.3 per cent (basic income) of households contain a person with a breathing difficulty. When the LIHC definition is applied, the same proportion of households containing a person with a breathing difficulty are fuel poor as households not containing someone with a breathing difficulty. As with previous analyses, the LIHC indicator produces a much lower estimate of fuel poverty.
Figure 11 Fuel poverty (10% and LIHC definitions) in households containing a person with breathing difficulties
19.2%
22.3%
12.4%
17.6%
21.9%
12.4%
In FP - 10% full incomedefinition
In FP - 10% basic incomedefinition
In FP - LIHC definition
Fuel poverty (10% and LIHC definitions) in households containing a person with a breathing difficulty
No one in household has a breathing difficulty
Someone in household has a breathing difficulty

18
Figure 12 presents the results for households containing at least one person with a ‘mobility disability’. Once again, a slightly higher proportion of households (24.2 per cent compared to 21 per cent) containing a person with a mobility disability and in fuel poverty is evident when the basic income definition is used. In addition to this of all the fuel poor, 44.1 per cent (full income) or 43 per cent (basic income) of households contain a person with a mobility disability. Under the LIHC measure, a slightly lower proportion of households containing a person with a mobility disability is fuel poor (12.3 per cent) compared with households not containing a person with a mobility disability, and overall, the LIHC estimates are significantly lower than the full and basic income 10% measure.
Figure 12 Fuel poverty (10% and LIHC definitions) in households containing a person with a mobility disability
17.4%
20.9%
12.5%
21.0% 24.2%
12.3%
In FP - 10% full incomedefinition
In FP - 10% basic incomedefinition
In FP - LIHC definition
Fuel poverty (10% and LIHC definitions) in households containing a person with a mobility disability
No one in household has a mobility disability
Someone in household has a mobility disability

19
Figure 13 presents the results for households containing at least one person with a learning disability. The results from this figure and Figure 8 suggest that under the previous 10% measures and definitions this is the EHS category with the lowest levels of fuel poverty. Of all fuel poor households 1.8 per cent (full income) and 2.3 per cent (basic income) contain a person with a learning disability (as demonstrated in Figure 1, the proportions in this category are relatively low compared to other EHS groups). However, these findings should not be taken to mean that fuel poverty is not an issue amongst this group. Even under the full income measure over one in ten households containing a person with a learning disability are in fuel poverty, and the LIHC indicator classifies 13.5 per cent of households containing a person with a learning disability as fuel poor. Figure 13 Fuel poverty (10% and LIHC definitions) in households containing a person with a learning disability
19.1%
22.4%
12.4% 11.2%
16.8%
13.5%
In FP - 10% full income definition In FP - 10% basic incomedefinition
In FP - LIHC definition
Fuel poverty (10% and LIHC definitions) in households containing a person with a learning disability
No one in household has a learning disability
Someone in household has a learning disability

20
Figure 14 presents the results for households containing at least one person with a hearing ‘disability’. The findings repeat the trend of many of the other EHS disability categories, with very slightly higher levels of fuel poverty under the basic income definition (23 per cent for households containing a person with a hearing disability), and much lower levels of fuel poverty under a LIHC definition (11.6 per cent). Of all the fuel poor households 8 per cent (full income) and 7.3 per cent (basic income) contain a person with a hearing ‘disability’.
Figure 14 Fuel poverty (10% and LIHC definitions) in households containing a person with a hearing disability
Figure 15 presents the results for households containing at least one person with a ‘vision disability’6. These results a very similar to the results in Figure 14, in terms of overall proportions of fuel poverty amongst this group, and the difference between the full and basic income 10% measures and the LIHC indicator. Of all fuel poor households 8 per cent (full income) and 7.6 per cent (basic income) contain a person with a vision ‘disability’. Figure 15 Fuel poverty (10% and LIHC definitions) in households containing a person with a vision disability
6 It is unclear whether this refers to people who are partially sighted, blind, or both.
18.6% 22.1%
12.5% 21.3% 23.0%
11.6%
In FP - 10% full incomedefinition
In FP - 10% basic incomedefinition
In FP - LIHC definition
Fuel poverty (10% and LIHC definitions) in households containing a person with a hearing disability
No one in household has a hearing disability
Someone in household has a hearing disability
18.7% 22.1%
12.4%
20.6% 23.1%
12.6%
In FP - 10% full incomedefinition
In FP - 10% basic incomedefinition
In FP - LIHC definition
Fuel poverty (10% and LIHC definitions) in households containing a person with a vision disability
No one in household has a vision disability
Someone in household has a vision disability

21
Region
The two household level EHS variables of disability were used to analyse the relationship between fuel poverty and region using the three measures of fuel poverty (Figures 16 and 17). As with other studies there are notable differences in fuel poverty across different regions under the different definitions. The trends identified below are broadly consistent with existing research (e.g. DECC 2012). Taking the broader category of long term illness or disability, the fuel poverty rates amongst households containing someone with an illness or disability are substantially higher than households without, especially when the basic income definition is applied. Using all three measures of fuel poverty, rates are the highest amongst households containing someone with a disability or illness in the East and West Midlands, North West, North East and Yorkshire and the Humber. London is particularly interesting, with a difference of ten per cent in fuel poverty rates amongst households containing someone with a disability or illness when the basic income definition is applied. Following the trend established previously, the LIHC definition produces lower rates of fuel poverty across all regions, compared to the full and basic income 10% measures, particularly in the West Midlands where fuel poverty rates are 12.8 per cent lower under a LIHC definition.
Excluding DLA and AA payment from household income increases fuel poverty rates across all regions of England. The highest increases under a full income definition are found in the North East and South West, with a rise in fuel poverty of 3.4 and 3.1 per cent respectively. Similarly, the highest increases under a basic income definition are found in the South West and North East, with a rise of 5.6 and 4.6 per cent respectively. The increases in fuel poverty are more modest under a LIHC definition, with increases of between just 0.4 and 1.9 per cent. The highest increases are found in the North East (+1.9 per cent) and North West (+ 1.7 per cent), whilst the lowest increases occur in the South East (+ 0.4 per cent) and West Midlands (+ 0.8 per cent).
Figure 16 Fuel poverty (10% and LIHC definitions) by region in households containing someone with a disability or illness
0% 10% 20% 30% 40%
North East
Yorkshire & Humber
North West
East Midlands
West Midlands
South West
East England
South East
London
Fuel poverty (10% and LIHC definitions) by region in households containing someone with a disability or illness
In FP LIHC - have illness or disability
In FP 10% full income - have illnessor disability
In FP 10% basic income - have illnessor disability

22
The more narrowly defined ‘households where the reference person or partner is registered disabled’ variable produces similar trends, with the highest fuel poverty levels being observed within households containing someone with a registered disability in the East and West Midlands Yorkshire and the Humber, and the North West. The differences between the LIHC and 10% measures is more noticeable under this indicator, with a decrease in fuel poverty rates of 15.4 per cent in Yorkshire and the Humber, and 15.1 per cent in the West Midlands. The results for the North East are interesting as the proportion of households in fuel poverty where the reference person or their partner is registered disabled is notably low, and requires further investigation.
Fuel poverty levels increase across all regions of England when DLA and AA are excluded from household income. The largest increases in fuel poverty under a full income definition occur in the North East and South West, with increases of 8.6 and 7.8 respectively, whilst the largest increases in fuel poverty under a basic income definition occur in the South West and North East, with increases of 14.9 and 10.7 respectively.
Figure 17 fuel poverty, households where HRP or partner is registered disabled and region
0% 5% 10% 15% 20% 25% 30% 35%
North East
Yorkshire & Humber
North West
East Midlands
West Midlands
South West
East England
South East
London
Fuel poverty (10% and LIHC definitions) by region in households where HRP or partner is registered disabled
In FP LIHC - registered disabled
In FP 10% full income - registereddisabled
In FP 10% basic income -registered disabled
23
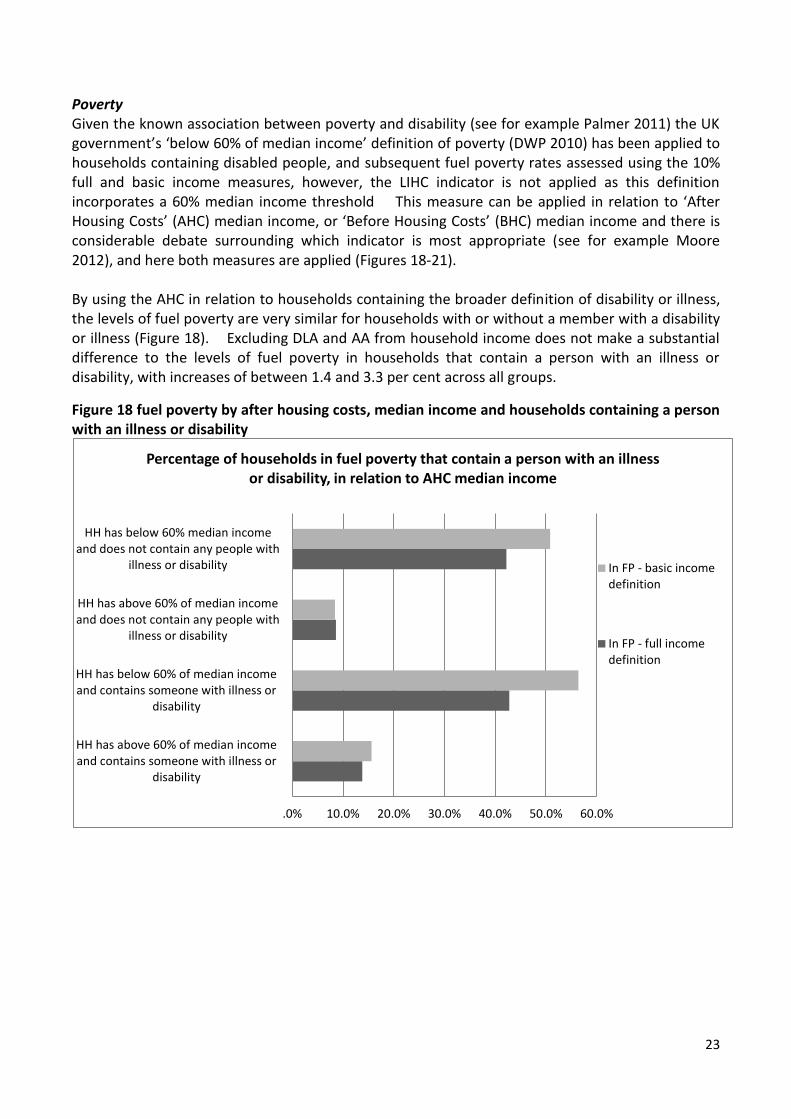
Poverty Given the known association between poverty and disability (see for example Palmer 2011) the UK government’s ‘below 60% of median income’ definition of poverty (DWP 2010) has been applied to households containing disabled people, and subsequent fuel poverty rates assessed using the 10% full and basic income measures, however, the LIHC indicator is not applied as this definition incorporates a 60% median income threshold This measure can be applied in relation to ‘After Housing Costs’ (AHC) median income, or ‘Before Housing Costs’ (BHC) median income and there is considerable debate surrounding which indicator is most appropriate (see for example Moore 2012), and here both measures are applied (Figures 18-21). By using the AHC in relation to households containing the broader definition of disability or illness, the levels of fuel poverty are very similar for households with or without a member with a disability or illness (Figure 18). Excluding DLA and AA from household income does not make a substantial difference to the levels of fuel poverty in households that contain a person with an illness or disability, with increases of between 1.4 and 3.3 per cent across all groups.
Figure 18 fuel poverty by after housing costs, median income and households containing a person with an illness or disability
.0% 10.0% 20.0% 30.0% 40.0% 50.0% 60.0%
HH has above 60% of median incomeand contains someone with illness or
disability
HH has below 60% of median incomeand contains someone with illness or
disability
HH has above 60% of median incomeand does not contain any people with
illness or disability
HH has below 60% median incomeand does not contain any people with
illness or disability
Percentage of households in fuel poverty that contain a person with an illness or disability, in relation to AHC median income
In FP - basic incomedefinition
In FP - full incomedefinition

24
The results for the narrower measure of disability follow a similar trend to Figure 18. The high levels of fuel poverty amongst those below the poverty line demonstrate the relationship between low income and fuel poverty (and also the role that household income plays in calculations of fuel poverty). However, in both Figures 16 and 17 it is interesting to note that there is a higher level of fuel poverty amongst households with a disabled member that are above the poverty line (15.6 and 17.9 per cent for the basic income measures in Figures 18 and 19 respectively) than those that do not contain a disabled member. The increase in fuel poverty after DLA and AA is excluded from income is more noticeable in households where the HRP or partner is registered disabled. For households below the median income threshold there is an increase in fuel poverty of 4.7 under a full income measure and 8.6 per cent under a basic income measure, whilst for households above the threshold, fuel poverty increases by 5.4 per cent under a full income measure, and by 8.1 per cent under a basic income measure.
Figure 19 fuel poverty by after housing costs median income and households where the HRP or their partner is registered disabled
.0% 10.0% 20.0% 30.0% 40.0% 50.0% 60.0%
HH has above 60% of median incomeand HRP or Partner are registered
disabled
HH has below 60% of median incomeand HRP or Partner are registered
disabled
HH has above 60% of median incomeand HRP or Partner are not registered
disabled
HH has below 60% median income andHRP or Partner are not registered
disabled
Percentage of households in fuel poverty with HRP or Partner registered disabled, in relation to AHC median income
In FP - basicincomedefinition
In FP - fullincomedefinition

25
Figures 20 and 21 present the results for the Before Housing Costs measure of poverty and the presence of a household member with a disability or illness. By using this measure the proportion of households in fuel poverty that are below the 60 per cent median income containing someone with an illness or disability is higher than the AHC measure at around 58 per cent when the full income measure is applied. Once again, this highlights some of the issues associated with the way in which such threshold indicators are developed, and the types of income included within them. As with the After Housing Costs analysis of households containing a person with an illness or disability, the removal of DLA and AA from income only results in marginal increases in fuel poverty levels of between 1.9 and 3.3 per cent.
By comparison, the removal of DLA and AA has a large impact on households where the HRP or partner is registered disabled. Under a full income measure, fuel poverty increases by 5 per cent for households above the median income threshold, and by 6.4 per cent for households below the threshold. Under a basic income definition, there is an increase in fuel poverty of 8.2 per cent for households above the threshold, and by 8 per cent for households below the threshold.
Figure 20 fuel poverty by before housing costs median income and households containing a person with an illness or disability
.0% 10.0% 20.0% 30.0% 40.0% 50.0% 60.0% 70.0%
HH has above 60% of median income and containssomeone with illness or disability
HH has below 60% of median income and containssomeone with illness or disability
HH has above 60% of median income and does notcontain any people with illness or disability
HH has below 60% median income and does notcontain any people with illness or disability
Households in fuel poverty, the presence of disability in relation to BHC median income
In FP - full incomedefinition
In FP - basic incomedefinition

26
Figure 21 fuel poverty by before housing costs median income and households where the HRP or their partner is registered disabled
.0% 10.0% 20.0% 30.0% 40.0% 50.0% 60.0% 70.0%
HH has above 60% of median income and HRP orPartner are registered disabled
HH has below 60% of median income and HRP orPartner are registered disabled
HH has above 60% of median income and HRP orPartner are not registered disabled
HH has below 60% median income and HRP orPartner are not registered disabled
Households in fuel poverty with HRP or Partner registered disabled, in relation to BHC median income
In FP - basic income definition
In FP - full income definition

27
Household composition
Figure 22 demonstrates fuel poverty levels amongst different household types, and whether or not the household contains someone with a disability or illness. In some households, for example, couples aged under 60 with no dependent children, the fuel poverty levels are relatively similar regardless of whether the occupant has an illness or disability, and the three measures of fuel poverty. The high levels of fuel poverty found in single adult households aged 60 or over correspond with previous research (e.g. DECC 2012) regarding the prevalence of fuel poverty in single pensioner households. The results are more varied in other types of households, for example, in a single household containing someone who is under 60, 36.6 per cent of those containing someone with an illness or disability are in fuel poverty under the full income definition, and 53.5 per cent under the basic income definition (compared with 21.4 and 24.4 per cent respectively for households that do not contain someone with a disability or illness). Similarly, where the householder has a registered disability the rate is 50 per cent using the basic income definition, but only 26 per cent using the full income definition. Figure 22 Fuel poverty (10% and LIHC definitions) by household composition using both disability indicators
0% 10% 20% 30% 40% 50% 60%
Couple, no dependent child(ren) <60
Couple, no dependent child(ren)aged 60+
Couple with dependent child(ren)
Lone parent with dependentchild(ren)
Other multi-person households
One person <60
One person aged 60+
Fuel poverty (10% and LIHC definitions) by household composition using both disability indicators
In FP LIHC - registered disabled
In FP 10% full income - registereddisabled
In FP 10% basic income - registereddisabled
In FP LIHC - have illness or disability
In FP 10% full income - have illness ordisability
In FP 10% basic income - have illnessor disability
28
The impact of the LIHC definition is more varied than in previous analyses. On the whole it does produce much lower estimates of fuel poverty than the two 10% measures, for example in single households containing someone over 60 who has a long term illness or disability, the LIHC estimate is 28.4 per cent lower than the basic income measure, and 23.6 per cent lower than the full income measure. However, across both indicators of disability, the levels of fuel poverty are highest for lone parents with dependent children under a LIHC measure. This is most likely a consequence of the equivalisation of income that occurs under the LIHC definition, whereby incomes are adjusted to reflect household size. In most household types, where someone has an illness or disability the removal of disability benefits from income only results in a marginal increase in fuel poverty of around 1.5 per cent or less, under both full and basic income definitions. The exceptions are single adult households and households containing a couple aged 60 or over with no dependent children. For household containing one person under 60, fuel poverty increases by 3.7 per cent under a full income measure, and by 6.3 per cent under a basic income measure. Similarly, fuel poverty increases by 3.8 per cent for single adults aged 60 or over under a full income measure, and by 5.4 per cent under a basic income measure. The increase in fuel poverty is slightly less for a household containing a couple aged 60 or over, increasing by 2.2 per cent in a full income calculation, and by 3.4 per cent in a basic income calculation.
By comparison, the exclusion of DLA and AA results in significant increases in fuel poverty across all household types where the HRP or partner is registered disabled. As before, the highest increases occur within the single adult households and households containing a couple aged 60 or over with no dependent children, with a rise in fuel poverty of 8.3 per cent (full income) and 15.6 per cent (basic income) for single adults under 60, and a rise of 6.4 per cent (full income) and 9.5 per cent (basic income) for single adults aged 60 or over. In households containing a couple aged 60 or over, fuel poverty increased by 5.6 per cent (full income) and 7.6 per cent (basic income).

29
Tenure type
Figures 23 and 24 demonstrate the levels of fuel poverty amongst different tenure types and according to the two indicators of disability. Across both indicators of disability and all three fuel poverty indicators, the fuel poverty rates in the private rented sector are consistently high, ranging from 18.7 per cent (10% full income measure in households where HRP or partner are registered disabled) through to 36.1 per cent (10% basic income measure in household containing someone with illness or disability). Equally, within owner occupiers rates of fuel poverty are higher amongst households containing a member who is disabled or ill or registered disabled compared to households with no disabled or ill members. This trend cannot be observed in the social rented sector or within local authority housing where the differences are less apparent. As observed previously, the LIHC fuel poverty rates are much lower than the full and basic income 10% fuel poverty rates across the majority of tenure categories. For instance, the LIHC estimate of fuel poverty in local authority housing where someone has an illness or disability is 22.4 per cent lower than the 10% basic income estimate. Similarly, in households where the HRP or partner are registered disabled, the LIHC fuel poverty estimate for owner occupiers is 13.8 per cent lower than the 10% full income rates. Figure 23 Tenure, fuel poverty and the presence of a household member with an illness or disability
0% 10% 20% 30% 40%
Owneroccupied
Private rented
Local authority
Social landlord
Fuel poverty (10% and LIHC definitions) by tenure type and presence of household member with an illness or disability
In FP LIHC - have illness or disability
In FP 10% full income - have illness ordisability
In FP 10% basic income - have illnessor disability
In FP LIHC - no illness or disability
In FP 10% full income - no illness ordisability
In FP 10% basic income - no illness ordisability

30
Figure 24 Tenure, fuel poverty and HRP or partner have a registered disability
In households where someone has an illness or disability, the exclusion of DLA and AA from income calculations marginally increase fuel poverty levels across all tenure types. Under a full income definition, fuel poverty increases by between 1.9 and 2.2 per cent across the groups, whilst under a basic income definition, fuel poverty increases by between 2.3 and 4.6 per cent. The change in fuel poverty is more modest under a LIHC definition, with increases of between 0.8 and 2.1 per cent. Under the two 10% measures, the largest increases are observed for local authority and social housing tenants, whilst for the LIHC indicator, the largest increases occur for private sector tenants and owner occupiers. As observed previously in the report, the effect of DLA and AA removal is more noticeable in households where the HRP or partner is registered disabled, with increases in fuel poverty of around 1.6 to 12 per cent. Under a full income definition, the largest increases occur within private rented housing (8.0 per cent) and owner occupied housing (5.4 per cent). Under a basic income definition, the largest increases occur within private rented housing (12.3 per cent) and local authority housing (10.2 per cent), whilst under a LIHC definition the largest increases occur within private rented housing (9.1 per cent) and owner occupied housing (4.1 per cent).
0% 10% 20% 30% 40%
Owner occupied
Private rented
Local authority
Social landlord
Fuel poverty (10% and LIHC definitions) by tenure type and whether HRP or partner are registered disabled
In FP LIHC - registered disabled
In FP 10% full income -registered disabled
In FP 10% basic income -registered disabled
In FP LIHC - not registereddisabled
In FP 10% full income - notregistered disabled
In FP 10% basic income - notregistered disabled

31
Payment type
Table 4 and Figure 25 and 26 explore the relationship between the two indicators of disability, payment type, and levels of fuel poverty. Table 4 demonstrates the proportions of each household type paying by a particular method. For electricity payments a much higher proportion of households containing disabled people use prepayment meters. This trend is also notable amongst gas customers, but is less pronounced.
Table 4: Energy payment type by the two indicators of disability
7 Not all households are connected to the gas network, often because they are in a rural location or in flats. The fuel
poverty figures for those not on the gas network can still be calculated, as they rely on other forms of energy (largely electricity).
Disability measure Direct debit (%)
Standard Credit (%)
Pre Payment (%)
Not on gas (%)7
Electricity Household contains someone who is sick or disabled 56.2
24.6 19.2 N/A
Household does not contain someone who is sick or disabled 65.1
22.9 12.1
HRP or partner is registered disabled 52.9
26 21.1
Household does not contain HRP or partner who is registered disabled 63.4
23.2 13.5
Gas Household contains someone who is sick or disabled 50.4
21.4 14.7 13.5
Household does not contain someone who is sick or disabled 58.7
19.7 9 12.6
HRP or partner is registered disabled 48.5
22 15.9 13.7
Household does not contain HRP or partner who is registered disabled 57
20.1 10.2 12.7

32
Figure 25: fuel poverty rates by payment type and the presence of a household member with an illness or disability
Figure 26: fuel poverty rates by payment type where the HRP or partner is registered disabled

33
Considering Figures 25 and 26 fuel poverty rates do not change significantly when a basic income measure is applied to those paying by direct debit. One explanation for this is that lower income households may be less likely to pay by direct debit, so the figures presented here may represent households that are not in receipt of the types of benefits/payments excluded under the basic income definition. On the other hand, for those using prepayment meters8 the figures differ substantially between the three fuel poverty measures, and according to the presence of a household member with an illness or disability. For instance 41 per cent of households containing a disabled person and using a prepayment meter to pay electricity charges are defined as being in fuel poor under the basic income measure, compared to 34.5 per cent of households in fuel poverty not containing a disabled member. The gas figures are very similar, although there are notably high levels of fuel poverty amongst all groups, especially under the 10% fuel poverty definitions where a household does not have a gas supply.
The application of the LIHC definition results in substantially lower rates of fuel poverty across all payment methods when compared to the two 10% measures. For example, under a LIHC definition fuel poverty rates are 19 per cent lower for pre-payment electricity customers in households containing someone with a disability when compared to the estimate produced by the 10% basic income indicator. When DLA and AA are removed from calculations, fuel poverty rates increase by between 0.8 and 5.5 per cent for both gas and electricity users under the full and basic income 10% definitions and the LIHC definition for households containing someone with an illness or disability. Under a basic income definition, the largest increase occurs within the prepayment group for both gas and electricity, whilst under a full income definition and the LIHC definition, the largest increase occurs within the standard credit group for gas and electricity customers.
Fuel poverty increases by between 1.5 and 12.3 per cent when DLA and AA are excluded from income for households where the HRP or partner is registered disabled. Under the basic and full income 10% definitions, the largest increases occur within the prepayment group for both gas and electricity users, whilst for the LIHC definition the largest increases occur within the standard credit group for both gas and electricity users.
8 Prepayment meters (especially in the case of electricity) have been associated with debt management and an
alternative to disconnection (see DECC 2011)

34
Case studies: the impact of DLA on definitions of fuel poverty
Seven case studies have been developed in order to demonstrate the impact of the current fuel poverty definition on levels of fuel poverty amongst disabled people. The case studies have been taken from the EHS, and all information is based on household data, although each household has been given a pseudonym in order to preserve anonymity. These particular households have been chosen for the following reasons:
1. They are all in receipt of DLA, which means that the effects of its removal from the fuel poverty calculation can be observed (not just in terms of the 10 per cent threshold, but also in terms of the extent of fuel poverty).
2. They have certain socio-economic, demographic or other features that have been identified within this report as having higher levels of fuel poverty. These features include:
a. Region (East and West Midlands, North West, North East and Yorkshire and the Humber, South West)
b. Disability type (particularly mobility related and heart disease) c. Tenure type (the households are located in the private rented sector) d. They are from a range of household composition types as these are likely to fare very
differently under welfare and fuel poverty policy changes 3. Additional information such as payment method, whether the household was treated as a
CERT priority group has also been included These case studies clearly provide no generalisable data. However, the intention is that they highlight some of the difficulties associated with the measurement of fuel poverty amongst disabled people.

35
Household Description
Jean – a single adult aged 60 or over
Jean is a 68-year old single adult living in a one bedroom flat. She occupies her home during the day and so requires a full heating regime. She pays for her gas and electricity by prepayment meter. Jean has a long-standing disability, and receives a combined care and mobility DLA payment of £135 per week.
Jean is eligible for the CERT priority and super priority groups, but is not classified as being fuel poor under the official fuel poverty definitions, with a fuel expenditure of 7.27% under a full income model, and 9.81% under a basic income model. However, once DLA payments are removed from the calculations, Jean becomes classified as fuel poor under both the full income and basic income models, with fuel expenditure of 11.70% and 20% respectively.
Mary - a single adult aged 60 or over
Mary, 64, is a single adult living in a detached property. Mary pays for the electricity in her home by standard credit. She is registered disabled and receives a combined care and mobility DLA payment of £98.20 per week. Mary is also eligible for the CERT priority and super priority groups. As Mary is under-occupying her home, fuel poverty is calculated using a partial full heating regime. With DLA included as income, Mary is not classified as being fuel poor under a full income model as her fuel expenditure is 8.83%, however, she is classified as fuel poor under a basic income model, with fuel expenditure representing 14.11% of income. When DLA is excluded from income, Mary is in fuel poverty under both income models, with fuel expenditure representing 12.68% of full income, and 27.30% of basic income.
Kath and John - a couple aged 60 or over
Kath and John are a married couple living in a semi-detached house. Kath, 60, is registered disabled and suffers from heart disease, whilst John, 63, has a long-standing illness. They receive a weekly mobility DLA payment of £49.75. Kath and John pay for their gas and electricity by prepayment meter, and require a full heating regime as they occupy their home during the day. Kath and John qualify for the CERT priority and super priority groups. Using the current definition of fuel poverty, with DLA included, Kath and John are close to the full income fuel poverty threshold, with fuel expenditure of 9.40%, and under a basic income, they are in fuel poverty, with fuel expenditure representing 14.71% of income. The removal of DLA as income causes Kath and John to be classified as fuel poor under both income models, with fuel expenditure now representing 11.74% of full income and 21.37% of basic income.
Sybil and David – a couple aged 60 or over
Sybil, 71, and David, 75, are a married couple living in a terraced house. They pay for their gas and electricity by prepayment meter, and require a full heating regime as they occupy their home during the day. Sybil and David are eligible for the CERT priority and super priority groups. Sybil and David are both registered disabled, and have mobility and respiratory impairments. They receive the mobility component of DLA, at a rate of £121.25 per week. With DLA counted towards household income, Sybil and David are not classified as fuel poor, with fuel expenditure representing 6.67% of income (both basic and full). However, when DLA is excluded from household income, Sybil and David’s fuel expenditure increases to 12.62% of income, and they are now in fuel poverty.
Roger and Penny - a couple with
Roger and Penny live in a semi-detached property with three children. Roger is 38, and does not suffer from any long standing illness or disability, whilst Penny, also 38, is registered disabled and has vision, mobility and breathing difficulties, as well as heart disease. Roger and Penny have two daughters, aged 17 and 9, both of whom have learning difficulties, as well as a 12 year old son, who also has

36
dependent children
learning difficulties. Roger and Penny pay for their electricity by direct debit, and require a full heating regime. Roger and Penny qualify for the CERT priority and super priority groups. When the combined care and mobility DLA payments of £100 a week are included as household income, Roger and Penny are in fuel poverty under a basic income model, with fuel expenditure of 12.72%, and are close to the full income model threshold, with fuel expenditure of 9.94%. When DLA payments are excluded from income, Roger and Penny are in fuel poverty under both income models, needing to spend 15.28% of basic income and 11.44% of full income.
Ruth and Michael - a couple with dependent children
Ruth and Michael live in a detached property with their two children. Michael, 49, and their 17 year old son and 22 year old daughter do not suffer from any long standing illness or disability, whilst Ruth, 45, has long standing hearing and mobility disabilities. Ruth qualifies for the mobility and care components of DLA, at a rate of £93.50 a week. Ruth and Michael qualify for the CERT priority group, but not the super priority group. Ruth and Michael require a full heating regime as the home is occupied during the day, and they pay for their electricity by direct debit. The family are not classified as under-occupying their home. With DLA included as income, Ruth and Michael are in fuel poverty under a full income model, needing to spend 10.26% of their income on fuel, and under a basic income model they are close to the fuel poverty threshold, with fuel expenditure of 9.83%. The removal of DLA as income moves Ruth and Michael into fuel poverty under both income models as they would need to spend 12.22% of full household income and 11.61% of basic income.
Jim - a lone parent
Jim is 39, and lives in a privately rented terraced house with his 15-year old registered disabled son. His son qualifies for the highest care component rate of the Disability Living Allowance, receiving £90 per week. Jim pays for his gas and electricity by prepayment meter, and qualifies for the CERT priority and super priority groups. Jim and his son are classified as under-occupying their property and so heating demand is modelled using a partial standard heating regime. Under the official full income definition of fuel poverty, with DLA included as income, Jim’s household is not counted as being fuel poor, with fuel expenditure representing 6.94% of total household income. When DLA is removed from household income, Jim’s household is still not classified as fuel poor, but fuel expenditure increases to 9.14%. However, under a basic income definition, Jim does move into the fuel poor category with the removal of DLA as income, with fuel expenditure representing 11.85% of household income.

37
Summary and conclusion
The statistical analysis of the EHS has given a breakdown of the extent of fuel poverty amongst households containing disabled people in different circumstances (such as household composition, region and payment type). Since the publication of Deliverable 1 (the original statistical analysis for this project released in May 2013) the analysis has been undertaken a second time to account for the new LIHC measure of fuel poverty. The main findings remain consistent with those presented in Deliverable 1. Firstly, a greater proportion of households containing disabled people are fuel poor compared with households that do not contain someone who disabled. Additionally, when DLA and AA are removed from the calculation of income, fuel poverty rates increase (although this varies by the measure of fuel poverty used, and other factors such as type of disability, region, tenure and household composition). Secondly, fuel poverty levels vary by household composition type, the presence of a disability and the measure of fuel poverty used. For example, in a single household containing someone who is over 60, 36.6 per cent of those containing someone with an illness or disability are in fuel poverty under the full income definition, and 53.5 per cent under the basic income definition (compared with 21.4 and 24.4 per cent respectively for households that do not contain someone with a disability or illness). However, these findings are not mirrored in the LIHC measure, where lone parents with dependent children (with no illness or disability) have the highest fuel poverty rates. Thirdly, fuel poverty rates are highest in the private rented sector across all measures, and the fuel poverty rates amongst households containing disabled people are higher under the LIHC measure than the 10 % measure (which is unusual compared to the rest of the dataset). Fourthly, fuel poverty rates tend to be highest amongst all households that pay energy bills using prepayment methods across all three measures of fuel poverty, and are generally higher amongst households containing someone who is sick or disabled. Additionally fuel poverty rates amongst households containing disabled people that use standard credit are also comparatively high. It is evident from this updated analysis that the LIHC indicator of fuel poverty results in lower levels of fuel poverty amongst households containing disabled people. Whilst there are many flaws in the 10 percent definition, it should not be assumed that the situation for disabled people has improved simply because rates of fuel poverty have reduced. Indeed, the new measure continues to neglect the higher energy needs identified in the final project report and literature review (Annex A), and continues to treat DLA and AA as general income.

38
References
Baker, W., Starling, W. Gordon, D. (2003) ‘Predicting fuel poverty at the local level: final report on
the development of the Fuel Poverty Indicator’ Centre for Sustainable Energy
Baker, W. (2011) ‘Reaching the fuel poor: Making the Warm Home Discount work’ Consumer Focus
Barnes, C. and Mercer, G. (2010) Exploring Disability Polity Press, Cambridge
Beatty, C., and Fothergill, S. (2011) Incapacity benefit reform: the local, regional and national
impact Centre for Regional Economic and Social Research, Sheffield Hallam University
Bevan Foundation (2009) Paying the Price of Being Poor accessed online at
http://www.bevanfoundation.org/publications/paying-the-price-of-being-poor on 23rd March 2013
Campbell, J. and Oliver, M. (1996) Disability Politics: Understanding our past, changing our future
Routledge, London
Department for Communities and Local Government, English Housing Survey, 2010-2011:
Household Data [computer file]. Colchester, Essex: UK Data Archive [distributor], July 2012. SN:
7040 , http://dx.doi.org/10.5255/UKDA-SN-7040-1
Department for Communities and Local Government. (n.d.a) ‘English Housing Survey: Household
Dataset User Guide 2010/11’ HMSO: London
Department for Communities and Local Government. (n.d.b) ‘EHS 2010-2011 Interview
Questionnaire’ HMSO: London
Department of Energy and Climate Change (2013) Fuel Poverty Report – Updated. HMSO: London
Department of Energy and Climate Change (2012) Annual Report on Fuel Poverty Statistics 2012
National Statistics
Department of Energy and Climate Change (2011) Annual Report on Fuel Poverty Statistics 2011:
Annex to the Fuel Poverty Statistics 2011 accessed online at
https://www.gov.uk/government/uploads/system/uploads/attachment_data/file/48139/2184-fuel-
poverty-monitoring-indicators-2011.pdf on 10th April 2013
Department of Energy and Climate Change (2010) ‘Fuel Poverty Methodology Handbook’ HMSO:
London
Department for Work and Pensions (2013) Disability Living Allowance accessed online at
http://www.dwp.gov.uk/healthcare-professional/benefits-and-services/disability-living-allowance/
on 10th April 2013
Department for Work and Pensions (2010) Households Below Average Income: An Analysis of the
Income Distribution DWP, London

39
Fahmy, E., Gordon, D., Patsios, D. (2011) ‘Predicting fuel poverty at a small-area level in England’
Energy Policy 39: 4370-4377
Hills, J. (2012) Getting the measure of fuel poverty: Final Report of the Fuel Poverty Review CASE
Report 72
Kaye, A., Jordan, H., and Baker, M. (2012) The Tipping Point: The human and economic cost of
cutting disabled people’s support. A report from the Hardest Hit coalition bringing together over 90
disabled people’s organisations and charities that are members of the UK Disabled People’s Council
and the Disability Benefits Consortium UK Disabled People’s Council and the Disability Benefits
Consortium
Monteith, M., et al. (2009) ‘Taking a closer look: Child Poverty and Disability’ Save the Children and
Family Fund, Northern Ireland
Moore, R. (2012) ‘Definitions of fuel poverty: Implications for policy’ Energy Policy 49: 19-26
Palmer, M. (2011) ‘Disability and Poverty: A conceptual Review’ Journal of Disability Policy
Studies 21: 210
Parckar, G. (2008) ‘Disability poverty in the UK’ Leonard Cheshire Disability
Scope (2012) DLA Reform accessed online at www.scope.org.uk/news/dla-reform on 31st October
2012
Walker, G., and Day. R. (2012) ‘Fuel poverty as injustice: Integrating distribution, recognition and
procedure in the struggle for affordable warmth’ Energy Policy 49: 69-75

40
Appendix 1 - EHS Variable descriptions and transformations
Category Variable name Data transformations Reason for inclusion
Disability
Anyone in hhold have < illness or disability?
A key variable for identifying if at least one person in the household has a disability or has been diagnosed with a long term illness
HRP or Partner registered disabled with local council/social service?
A key variable identifying households where the HRP or Partner are registered disabled
Hhold contains person(s) with vision disability
Aggregated from lower level data using count function, followed by construction of a binary variable
Allows for analysis of specific categories of disability
Hhold contains person(s) with hearing disability
Aggregated from lower level data using count function, followed by construction of a binary variable
Allows for analysis of specific categories of disability
Hhold contains person(s) with learning disability
Aggregated from lower level data using count function, followed by construction of a binary variable
Allows for analysis of specific categories of disability
Hhold contains person(s) with mobility disability
Aggregated from lower level data using count function, followed by construction of a binary variable
Allows for analysis of specific categories of disability
Hhold contains person(s) with breathing disability
Aggregated from lower level data using count function, followed by construction of a binary variable
Allows for analysis of specific categories of disability
Hhold contains person(s) with heart disease disability
Aggregated from lower level data using count function, followed by construction of a binary variable
Allows for analysis of specific categories of disability
Hhold contains person(s) with mental health disability
Aggregated from lower level data using count function, followed by construction of a binary variable
Allows for analysis of specific categories of disability
Hhold contains person(s) with other type of disability
Aggregated from lower level data using count function, followed by construction of a binary variable
Allows for analysis of specific categories of disability
Hhold contains person(s) with long-stndg illness, disab/infirmity
Aggregated from lower level data using count function, followed by construction of a binary variable
Allows for analysis of specific categories of disability

41
Hhold contains person(s) registered disabled with local council/social service
Aggregated from lower level data using count function, followed by construction of a binary variable
Allows for analysis of specific categories of disability
Household income
Full household income
Required for LIHC indicator and subtracting DLA & AA from income
DLA Care weekly amount
Required to calculate annual DLA payments
DLA Mob weekly amount
Required to calculate annual DLA payments
DLA Care Annual Multiplied DLA Care weekly to create annual sum
Calculates annual household DLA payments (care component)
DLA Mob Annual Multiplied DLA Mob weekly to create annual sum
Calculates annual household DLA payments (mobility component)
Total Annual DLA Sum of DLA Care Annual and DLA Mob Annual
Calculates annual household DLA payments (care and mobility)
AA weekly amount Required to calculate annual AA payments
AA annual amount Multiplied AA weekly to create annual sum
Calculates annual household AA payments
Basic HH income – DLA & AA
Provides annual (basic) HH income, with DLA and AA excluded
Full HH income – DLA & AA
Provides annual (full) HH income, with DLA and AA excluded
Equivalised AHC income
Created by subtracting annual mortgage payments (mortwkx x 52) and annual rent payments (rentExS x 52) from full household income. The AHC income was then divided by the equivalisation factors outlined in the Department of Energy and Climate Change (2013: 41), using the difference between two household size variables (hhsizex and DVHsize).
Provides the equivalised AHC income for each household.
Equivalised AHC income – DLA & AA
Annual DLA & AA were subtracted from the new equivalised AHC income variable.
Provides annual equivalised AHC income, with DLA & AA excluded.
Fuel poverty
Fuel expenditure States the total fuel costs (£)
Fuel poverty index – full income definition
Contains the formula for calculating fuel poverty (full income definition)

42
Fuel poverty index – basic income definition
Contains the formula for calculating fuel poverty (basic income definition)
Fuel poverty flag - full income definition
Flags whether a household is fuel poor according to fuel poverty index – full income definition
Fuel poverty flag - basic income definition
Flags whether a household is fuel poor according to fuel poverty index – basic income definition
Fuel poverty index: full income – DLA & AA
Created using fuel expenditure and full HH income – DLA & AA
Calculates fuel poverty (full income) with DLA and AA excluded from income
Fuel poverty flag: full income – DLA & AA
Flags whether a household is fuel poor (full income) with DLA and AA excluded from income
Fuel poverty index: basic income – DLA & AA
Created using fuel expenditure and basic HH income – DLA & AA
Calculates fuel poverty (basic income) with DLA and AA excluded from income
Fuel poverty flag: basic income – DLA & AA
Flags whether a household is fuel poor (basic income) with DLA and AA excluded from income
Equivalised fuel expenditure
Created by dividing fuel expenditure (fuelexpn) by the equivalisation factors outlined by the Department of Energy and Climate Change (2013: 40)
Provides the equivalised required fuel expenditure for each household.
Low Income High Costs indicator
Created using median equivalised fuel expenditure and 60% of median equivalised AHC income.
Flags whether a household is LIHC fuel poor.
Low Income High Costs indicator – DLA & AA
Created using equivalised AHC income – AA & DLA.
Flags whether a household is LIHC fuel poor, with DLA & AA excluded from income.
Income poverty
AHC: below 60% of median income
There is a known association between poverty and disability (see for example Palmer 2011), but considerable debate concerning whether an AHC or BHC measure would be most appropriate.
BHC: below 60% of median income
There is a known association between poverty and disability (see for example Palmer 2011), but considerable debate concerning whether an AHC or BHC measure would be most

43
appropriate.
Other
Region Regional variations have previously been observed with fuel poverty rates (DECC 2012), as well as the numbers of disability related benefit claims such as incapacity benefit (Beatty and Fothergill 2011).
Household composition
A factor often associated with fuel poverty (Fahmny et al 2011)
Tenure A factor often association with fuel poverty (Fahmny et al 2011)
Household weight The grossing factor compensates for the design of the sample and non-response bias, and allows for national estimates (Department for Communities and Local Government, n.d.)
Household size Calculated using two variables, hhsizex and DVHsize. The former excludes people living away in halls of residence, whereas the latter includes them.
Used to equivalise household income for the new LIHC indicator.

44
Appendix 2 – Variable routing and frequencies
Disability variable routing in the EHS

45
Appendix 3: sample sizes
Aggregated disability category variables frequencies
Unweighted Weighted (household weight)
Variable Valid sample (N) Missing cases (N) Valid sample (N) Missing cases (N)
Vision 11417 27136 10042567 11557359
Hearing 11417 27136 10042567 11557359
Learning difficulty 11417 27136 10042567 11557359
Mobility 11417 27136 10042567 11557359
Breathing 11417 27136 10042567 11557359
Heart disease 11417 27136 10042567 11557359
Mental health 11417 27136 10042567 11557359
Other 11417 27136 10042567 11557359
Don’t know 11498 27055 10111511 11488415
Unweighted frequencies for vision variable
Vision
Frequency Percent Valid Percent
Cumulative Percent
Valid No 10712 27.8 93.8 93.8
Yes 705 1.8 6.2 100.0
Total 11417 29.6 100.0 Missing Does not apply 26864 69.7
No answer 272 .7 Total 27136 70.4
Total 38553 100.0

46
Unweighted frequencies for hearing variable
Hearing
Frequency Percent Valid Percent
Cumulative Percent
Valid No 10746 27.9 94.1 94.1
Yes 671 1.7 5.9 100.0
Total 11417 29.6 100.0 Missing Does not apply 26864 69.7
No answer 272 .7 Total 27136 70.4
Total 38553 100.0
Unweighted frequencies for learning difficulty variable
Learning difficulty
Frequency Percent Valid Percent
Cumulative Percent
Valid No 11073 28.7 97.0 97.0
Yes 344 .9 3.0 100.0
Total 11417 29.6 100.0 Missing Does not apply 26864 69.7
No answer 272 .7 Total 27136 70.4
Total 38553 100.0
Unweighted frequencies for mobility variable
Mobility
Frequency Percent Valid Percent Cumulative
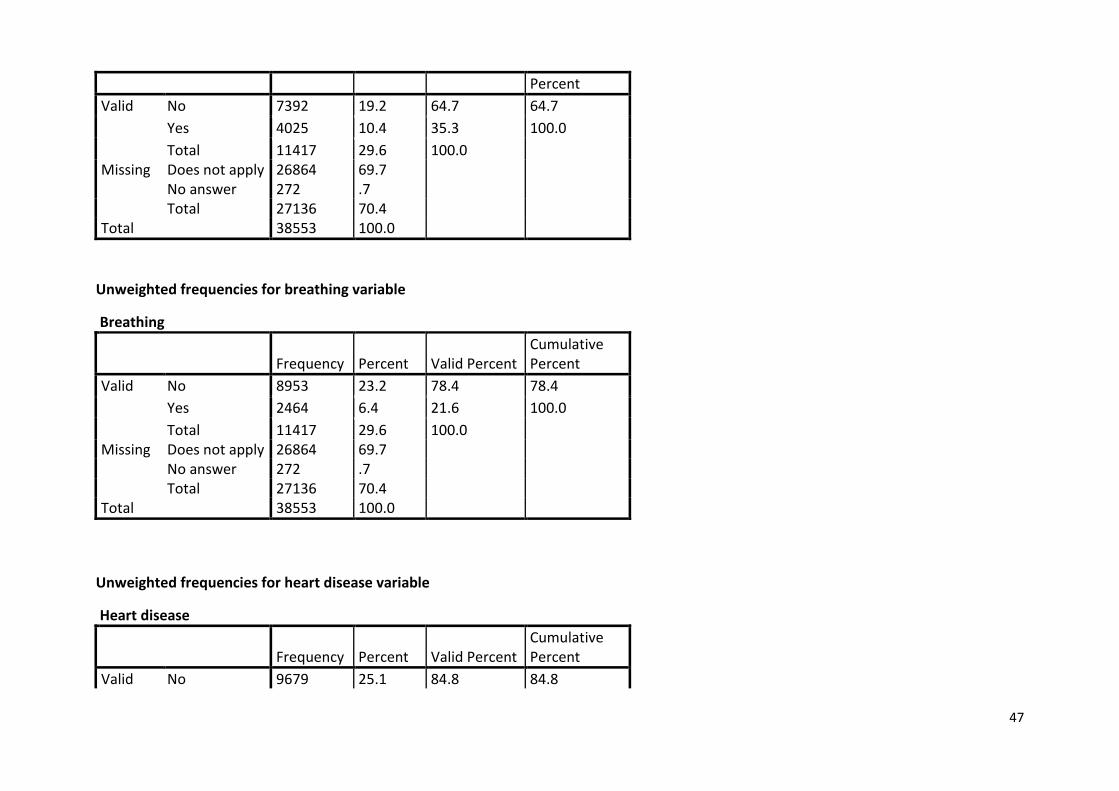
47
Percent
Valid No 7392 19.2 64.7 64.7
Yes 4025 10.4 35.3 100.0
Total 11417 29.6 100.0 Missing Does not apply 26864 69.7
No answer 272 .7 Total 27136 70.4
Total 38553 100.0
Unweighted frequencies for breathing variable
Breathing
Frequency Percent Valid Percent
Cumulative Percent
Valid No 8953 23.2 78.4 78.4
Yes 2464 6.4 21.6 100.0
Total 11417 29.6 100.0 Missing Does not apply 26864 69.7
No answer 272 .7 Total 27136 70.4
Total 38553 100.0
Unweighted frequencies for heart disease variable
Heart disease
Frequency Percent Valid Percent
Cumulative Percent
Valid No 9679 25.1 84.8 84.8
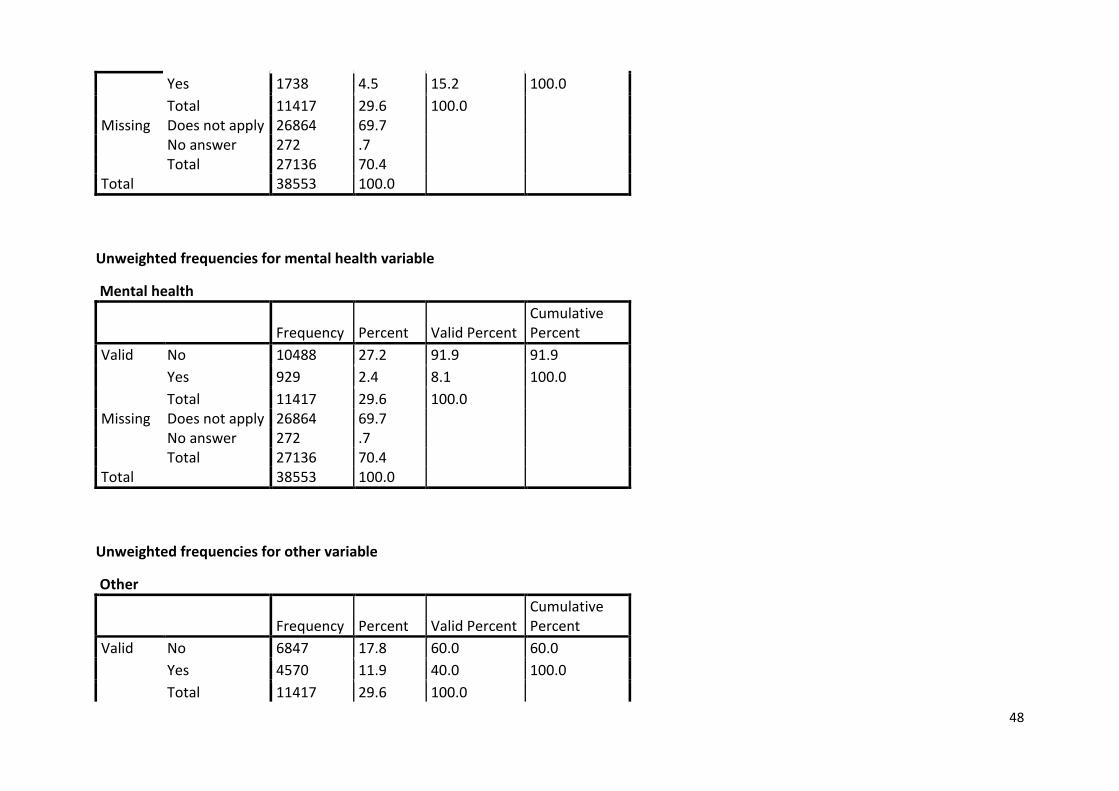
48
Yes 1738 4.5 15.2 100.0
Total 11417 29.6 100.0 Missing Does not apply 26864 69.7
No answer 272 .7 Total 27136 70.4
Total 38553 100.0
Unweighted frequencies for mental health variable
Mental health
Frequency Percent Valid Percent
Cumulative Percent
Valid No 10488 27.2 91.9 91.9
Yes 929 2.4 8.1 100.0
Total 11417 29.6 100.0 Missing Does not apply 26864 69.7
No answer 272 .7 Total 27136 70.4
Total 38553 100.0
Unweighted frequencies for other variable
Other
Frequency Percent Valid Percent
Cumulative Percent
Valid No 6847 17.8 60.0 60.0
Yes 4570 11.9 40.0 100.0
Total 11417 29.6 100.0

49
Missing Does not apply 26864 69.7 No answer 272 .7 Total 27136 70.4
Total 38553 100.0
Unweighted frequencies for don't know variable
Don't know
Frequency Percent Valid Percent
Cumulative Percent
Valid No 11417 29.6 99.3 99.3
Yes 81 .2 .7 100.0
Total 11498 29.8 100.0 Missing Does not apply 26864 69.7
No answer 191 .5 Total 27055 70.2
Total 38553 100.0

50
Appendix 4: full results tables
Propensity of households containing someone with a long-term illness or disability to fuel poverty Including DLA & AA Excluding DLA & AA Basic income Full income LIHC Basic income Full income LIHC HH contains someone with illness or disability
No. in FP (millions)
% of group in FP
% of total FP in group
No. in FP (millions)
% of group in FP
% of total FP in group
No. in FP (millions)
% of group in FP
% of total FP in group
No. in FP (millions)
% of group in FP
% of total FP in group
No. in FP (millions)
% of group in FP
% of total FP in group
No. in FP (millions)
% of group in FP
% of total FP in group
Yes 1.57 24.9%
39.5%
1.29 20.4%
36.9%
0.84 13.2%
34.4%
1.76 28.0%
42.2%
1.42 22.4%
39.3%
0.91 14.4%
36.7%
No 2.42 16.0%
60.5%
2.21 14.6%
63.1%
1.59 10.5%
65.6%
2.41 15.9%
57.8%
2.18 14.4%
60.7%
1.57 10.4%
63.3%
Propensity of households where HRP or partner are registered disabled to fuel poverty
Including DLA & AA Excluding DLA & AA
Basic income Full income LIHC Basic income Full income LIHC HRP or partner registered disabled
No. in FP (millions)
% of group in FP
% of total FP in group
No. in FP (millions)
% of group in FP
% of total FP in group
No. in FP (millions)
% of group in FP
% of total FP in group
No. in FP (millions)
% of group in FP
% of total FP in group
No. in FP (millions)
% of group in FP
% of total FP in group
No. in FP (millions)
% of group in FP
% of total FP in group
Yes 0.45 24.1%
11.2%
0.34 18.4%
9.8% 0.20 10.6%
8.1% 0.60 32.3%
14.3%
0.44 23.6%
12.2%
0.27 14.4%
10.7%
No 3.57 11.2%
88.8%
3.19 16.2%
90.2%
2.27 11.5%
91.9%
3.61 18.3%
85.7%
3.19 16.2%
87.8%
2.24 11.4%
89.3%

51
Fuel poverty rates by EHS category of disability
Including DLA & AA Excluding DLA & AA
Basic income Full income LIHC Basic income Full income LIHC EHS disability types
No. in FP (millions)
% of group in FP
% of total FP in group
No. in FP (millions)
% of group in FP
% of total FP in group
No. in FP (millions)
% of group in FP
% of total FP in group
No. in FP (millions)
% of group in FP
% of total FP in group
No. in FP (millions)
% of group in FP
% of total FP in group
No. in FP (millions)
% of group in FP
% of total FP in group
Vision 0.17 23.1
% 7.6% 0.15 20.6
% 8.0% 0.09 12.6
% 7.4% 0.20 27.9
% 8.4% 0.18 24.2
% 8.8% 0.10 14.1
% 7.9%
Hearing 0.16 23.0
% 7.3% 0.15 21.3
% 8.0% 0.08 11.6
% 6.6% 0.19 26.5
% 7.8% 0.17 23.4
% 8.3% 0.09 13.1
% 7.1%
Learning difficulty
0.05 16.8%
2.3% 0.03 11.2%
1.8% 0.04 13.5%
3.4% 0.06 20.4%
2.6% 0.04 13.0%
2.0% 0.05 15.0%
3.6%
Mobility 0.96 24.2
% 43.0%
0.83 21.0%
44.1%
0.49 12.3%
39.2%
1.11 28.0%
45.7%
0.93 23.5%
46.3%
0.55 13.9%
42.3%
Breathing
0.54 21.9%
24.3%
0.44 17.6%
23.0%
0.31 12.4%
24.8%
0.59 23.9%
24.4%
0.47 19.0%
23.4%
0.33 13.3%
25.2%
Heart disease
0.46 24.4%
20.6%
0.42 22.2%
22.1%
0.24 12.5%
18.9%
0.50 26.6%
20.6%
0.44 23.5%
22.0%
0.25 13.5%
19.4%
Mental health
0.29 33.3%
13.1%
0.18 20.0%
9.3% 0.16 18.0%
12.6%
0.32 37.0%
13.3%
0.19 21.9%
9.5% 0.16 18.5%
12.3%
Other 0.91 19.6
% 40.7%
0.79 17.0%
41.6%
0.57 12.4%
46.1%
0.97 21.0%
40.0%
0.83 18.0%
41.2%
0.59 12.8%
45.1%

52
Fuel poverty rates by region in households containing someone with a long-term illness or disability
Including DLA & AA Excluding DLA & AA
Basic income Full income LIHC Basic income Full income LIHC HH contains someone with illness or disability
Region No. in FP (millions)
% of group in FP
% of total FP in group
No. in FP (millions)
% of group in FP
% of total FP in group
No. in FP (millions)
% of group in FP
% of total FP in group
No. in FP (millions)
% of group in FP
% of total FP in group
No. in FP (millions)
% of group in FP
% of total FP in group
No. in FP (millions)
% of group in FP
% of total FP in group
Yes
North East
0.10
25.9%
6.5% 0.09 21.9%
6.7% 0.06 14.0%
6.6% 0.12 30.5%
6.8% 0.09 25.3%
7.0% 0.06 14.0%
6.9%
Yorkshire and the Humber
0.18
25.0%
11.4%
0.16 22.2%
12.3% 0.09 12.9%
11.1%
0.20 28.0%
11.3%
0.17 23.4%
11.8%
0.10 12.9%
11.1%
North West
0.29
30.8%
18.2%
0.24 25.4%
18.3% 0.14 15.6%
17.3%
0.31 33.8%
17.7%
0.26 27.9%
18.2%
0.16 15.6%
17.7%
East Midlands
0.16
27.2%
10.0%
0.14 23.7%
10.7% 0.09 15.9%
11.0%
0.17 28.7%
9.4% 0.15 25.7%
10.5%
0.10 15.9%
11.1%
West Midlands
0.21
31.1%
13.3%
0.19 27.9%
14.6% 0.10 15.1%
12.1%
0.23 33.9%
12.9%
0.21 30.7%
14.6%
0.11 15.1%
11.8%
South West
0.14
20.2%
8.9% 0.11 15.3%
8.2% 0.09 13.1%
10.8%
0.18 25.8%
10.1%
0.13 18.4%
9.0% 0.10 13.1%
10.8%
East England
0.15
23.4%
9.8% 0.13 20.5%
10.4% 0.07 11.2%
8.8% 0.17 26.1%
9.7% 0.14 21.3%
9.9% 0.08 11.2%
8.8%
South East
0.16
17.2%
10.5%
0.14 14.3%
10.6% 0.09 9.5% 10.9%
0.19 19.7%
10.7%
0.15 16.2%
10.9%
0.95 9.5% 10.5%
London 0.18
25.2%
11.6%
0.11 14.6%
8.2% 0.09 13.1%
11.3%
0.20 27.7%
11.3%
0.11 15.7%
8.0% 0.10 13.1%
11.3%
No
North East
0.17
23.5%
7.0% 0.15 21.0%
6.9% 0.11 14.8%
6.7% 0.17 23.4%
7.0% 0.15 20.7%
6.8% 0.10 14.4%
6.6%
Yorkshire and the
0.28
18.6%
11.5%
0.25 16.7%
11.3% 0.15 10.0%
9.4% 0.28 18.6%
11.5%
0.25 16.7%
11.4%
0.15 10.0%
9.6%

53
Humber
North West
0.40
19.9%
16.7%
0.36 18.0%
16.5% 0.23 11.5%
14.6%
0.40 20.0%
16.8%
0.36 18.0%
16.7%
0.23 11.2%
14.5%
East Midlands
0.20
15.2%
8.1% 0.20 15.6%
9.2% 0.16 12.0%
9.7% 0.19 15.0%
8.1% 0.20 15.4%
9.1% 0.15 11.9%
9.8%
West Midlands
0.30
19.2%
12.5%
0.30 18.8%
13.4% 0.20 12.7%
12.5%
0.30 19.2%
12.5%
0.29 18.5%
13.3%
0.20 12.6%
12.6%
South West
0.23
14.7%
9.4% 0.23 14.9%
10.4% 0.16 10.2%
9.8% 0.23 14.8%
9.4% 0.23 14.8%
10.4%
0.15 9.8% 9.6%
East England
0.24
14.0%
10.0%
0.25 14.2%
11.1% 0.20 11.5%
12.4%
0.24 14.0%
10.1%
0.24 14.1%
11.2%
0.20 11.5%
12.7%
South East
0.29
11.5%
11.9%
0.26 10.4%
11.8% 0.19 7.4% 11.6%
0.29 11.4%
11.8%
0.26 10.2%
11.7%
0.18 7.1% 11.3%
London 0.31
13.8%
12.9%
0.21 9.2% 9.4% 0.21 9.4% 13.3%
0.31 13.7%
12.8%
0.20 9.1% 9.4% 0.21 9.2% 13.2%
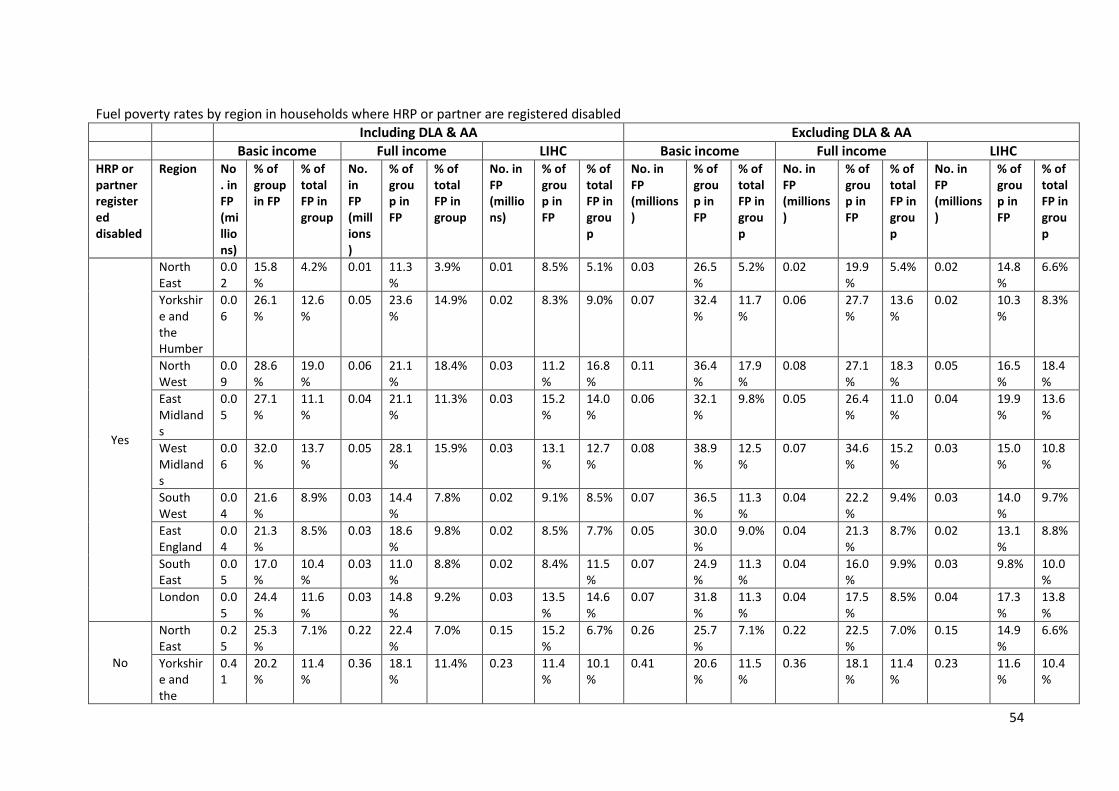
54
Fuel poverty rates by region in households where HRP or partner are registered disabled
Including DLA & AA Excluding DLA & AA
Basic income Full income LIHC Basic income Full income LIHC HRP or partner registered disabled
Region No. in FP (millions)
% of group in FP
% of total FP in group
No. in FP (millions)
% of group in FP
% of total FP in group
No. in FP (millions)
% of group in FP
% of total FP in group
No. in FP (millions)
% of group in FP
% of total FP in group
No. in FP (millions)
% of group in FP
% of total FP in group
No. in FP (millions)
% of group in FP
% of total FP in group
Yes
North East
0.02
15.8%
4.2% 0.01 11.3%
3.9% 0.01 8.5% 5.1% 0.03 26.5%
5.2% 0.02 19.9%
5.4% 0.02 14.8%
6.6%
Yorkshire and the Humber
0.06
26.1%
12.6%
0.05 23.6%
14.9% 0.02 8.3% 9.0% 0.07 32.4%
11.7%
0.06 27.7%
13.6%
0.02 10.3%
8.3%
North West
0.09
28.6%
19.0%
0.06 21.1%
18.4% 0.03 11.2%
16.8%
0.11 36.4%
17.9%
0.08 27.1%
18.3%
0.05 16.5%
18.4%
East Midlands
0.05
27.1%
11.1%
0.04 21.1%
11.3% 0.03 15.2%
14.0%
0.06 32.1%
9.8% 0.05 26.4%
11.0%
0.04 19.9%
13.6%
West Midlands
0.06
32.0%
13.7%
0.05 28.1%
15.9% 0.03 13.1%
12.7%
0.08 38.9%
12.5%
0.07 34.6%
15.2%
0.03 15.0%
10.8%
South West
0.04
21.6%
8.9% 0.03 14.4%
7.8% 0.02 9.1% 8.5% 0.07 36.5%
11.3%
0.04 22.2%
9.4% 0.03 14.0%
9.7%
East England
0.04
21.3%
8.5% 0.03 18.6%
9.8% 0.02 8.5% 7.7% 0.05 30.0%
9.0% 0.04 21.3%
8.7% 0.02 13.1%
8.8%
South East
0.05
17.0%
10.4%
0.03 11.0%
8.8% 0.02 8.4% 11.5%
0.07 24.9%
11.3%
0.04 16.0%
9.9% 0.03 9.8% 10.0%
London 0.05
24.4%
11.6%
0.03 14.8%
9.2% 0.03 13.5%
14.6%
0.07 31.8%
11.3%
0.04 17.5%
8.5% 0.04 17.3%
13.8%
No
North East
0.25
25.3%
7.1% 0.22 22.4%
7.0% 0.15 15.2%
6.7% 0.26 25.7%
7.1% 0.22 22.5%
7.0% 0.15 14.9%
6.6%
Yorkshire and the
0.41
20.2%
11.4%
0.36 18.1%
11.4% 0.23 11.4%
10.1%
0.41 20.6%
11.5%
0.36 18.1%
11.4%
0.23 11.6%
10.4%

55
Humber
North West
0.60
22.7%
16.9%
0.54 20.2%
16.9% 0.34 12.9%
15.2%
0.61 22.9%
16.9%
0.54 20.4%
17.0%
0.34 12.7%
15.1%
East Midlands
0.30
18.0%
8.5% 0.30 17.9%
9.5% 0.22 13.0%
9.7% 0.30 17.9%
8.4% 0.30 17.8%
9.4% 0.22 12.9%
9.8%
West Midlands
0.45
21.8%
12.5%
0.43 20.9%
13.4% 0.27 13.4%
12.1%
0.45 22.1%
12.5%
0.43 20.9%
13.4%
0.28 13.5%
12.3%
South West
0.34
16.3%
9.4% 0.32 15.3%
9.9% 0.24 11.6%
10.5%
0.35 16.9%
9.6% 0.32 15.6%
10.0%
0.23 11.2%
10.3%
East England
0.36
16.2%
10.0%
0.35 15.8%
10.9% 0.26 11.7%
11.4%
0.36 16.4%
10.0%
0.35 15.7%
10.8%
0.26 11.6%
11.4%
South East
0.41
12.8%
11.4%
0.37 11.6%
11.6% 0.26 8.0% 11.3%
0.41 12.8%
11.4%
0.37 11.6%
11.6%
0.25 7.8% 11.1%
London 0.46
16.2%
12.8%
0.30 10.6%
9.4% 0.30 10.5%
13.1%
0.46 16.2%
12.7%
0.30 10.5%
9.3% 0.29 10.3%
13.0%

56
Fuel poverty in households containing someone with a long-term illness or disability, with below 60% median income (AHC)
Including DLA & AA Excluding DLA & AA
Basic income Full income Basic income Full income
HH contains someone with illness or disability
AHC: Below 60% of median income
No. in FP
% of group in FP
% of total FP in group
No. in FP
% of group in FP
% of total FP in group
No. in FP
% of group in FP
% of total FP in group
No. in FP
% of group in FP
% of total FP in group
Yes
Above threshold
0.76 15.6% 48.4% 0.67 13.8% 52.2% 0.92 18.9% 52.2% 0.78 16.0% 55.1%
Below threshold
0.81 56.4% 51.6% 0.62 42.8% 47.8% 0.84 58.7% 47.8% 0.64 44.2% 44.9%
No
Above threshold
1.05 8.4% 43.3% 1.07 8.6% 48.4% 1.05 8.4% 43.6% 1.06 8.5% 48.5%
Below threshold
1.37 50.8% 56.7% 1.14 42.2% 51.6% 1.36 50.7% 56.4% 1.12 41.9% 51.5%

57
Fuel poverty in households where HRP or partner are registered disabled, with below 60% median income (AHC)
Including DLA & AA Excluding DLA & AA
Basic income Full income Basic income Full income
HRP or partner registered disabled
AHC: Below 60% of median income
No. in FP
% of group in FP
% of total FP in group
No. in FP
% of group in FP
% of total FP in group
No. in FP
% of group in FP
% of total FP in group
No. in FP
% of group in FP
% of total FP in group
Yes
Above threshold
0.27 17.9% 60.1% 0.21 13.8% 60.6% 0.39 26.0% 65.2% 0.29 19.2% 65.6%
Below threshold
0.18 50.7% 39.9% 0.14 38.1% 39.4% 0.21 59.3% 34.8% 0.15 42.8% 34.4%
No
Above threshold
1.54 9.7% 43.0% 1.53 9.7% 48.1% 1.58 10.0% 43.7% 1.55 9.8% 48.6%
Below threshold
2.04 52.9% 57.0% 1.65 42.9% 51.9% 2.03 52.9% 56.3% 1.64 42.8% 51.4%

58
Fuel poverty in households containing someone with a long-term illness or disability, with below 60% median income (BHC)
Including DLA & AA Excluding DLA & AA
Basic income Full income Basic income Full income
HH contains someone with illness or disability
BHC: Below 60% of median income
No. in FP
% of group in FP
% of total FP in group
No. in FP
% of group in FP
% of total FP in group
No. in FP
% of group in FP
% of total FP in group
No. in FP
% of group in FP
% of total FP in group
Yes
Above threshold
0.70 14.1% 44.4% 0.49 9.8% 37.8% 0.86 17.4% 48.7% 0.59 11.9% 41.7%
Below threshold
0.87 63.8% 55.6% 0.80 58.5% 62.2% 0.90 66.2% 51.3% 0.83 60.4% 58.3%
No
Above threshold
1.05 8.1% 43.3% 0.90 6.9% 40.8% 1.05 8.1% 43.7% 0.90 6.9% 41.1%
Below threshold
1.37 63.2% 56.7% 1.31 60.3% 59.2% 1.36 63.0% 56.3% 1.29 59.9% 58.9%

59
Fuel poverty in households where HRP or partner are registered disabled, with below 60% median income (BHC)
Including DLA & AA Excluding DLA & AA
Basic income Full income Basic income Full income
HRP or partner registered disabled
BHC: Below 60% of median income
No. in FP
% of group in FP
% of total FP in group
No. in FP
% of group in FP
% of total FP in group
No. in FP
% of group in FP
% of total FP in group
No. in FP
% of group in FP
% of total FP in group
Yes
Above threshold
0.24 16.0% 53.2% 0.14 9.6% 41.9% 0.36 24.2% 60.1% 0.22 14.6% 49.5%
Below threshold
0.21 56.7% 46.8% 0.20 53.6% 58.1% 0.24 64.7% 39.9% 0.22 60.0% 50.5%
No
Above threshold
1.51 9.1% 42.2% 1.25 7.6% 39.1% 1.55 9.4% 43.0% 1.27 7.7% 39.8%
Below threshold
2.07 64.3% 57.8% 1.94 60.4% 60.9% 2.06 64.2% 57.0% 1.92 60.2% 60.2%

60
Fuel poverty rates by household composition, in households containing someone with a long-term illness or disability
Including DLA & AA Excluding DLA & AA
Basic income Full income LIHC Basic income Full income LIHC HH contains someone with illness or disability
Household type
No. in FP (millions)
% of group in FP
% of total FP in group
No. in FP (millions)
% of group in FP
% of total FP in group
No. in FP (millions)
% of group in FP
% of total FP in group
No. in FP (millions)
% of group in FP
% of total FP in group
No. in FP (millions)
% of group in FP
% of total FP in group
No. in FP (millions)
% of group in FP
% of total FP in group
Yes
Couple, no dependent child(ren) under 60
0.11
13.4%
7.3% 0.11 12.6%
8.4% 0.09 10.3%
10.5%
0.12 13.6%
6.6% 0.11 12.8%
7.7% 0.09 10.4%
9.9%
Couple, no dependent child(ren) aged 60 or over
0.28
17.1%
18.1%
0.31 18.6%
24.0% 0.20 11.9%
23.8%
0.34 20.5%
19.3%
0.35 20.8%
24.5%
0.22 13.5%
24.8%
Couple with dependent child(ren)
0.09
10.0%
5.8% 0.06 6.9% 4.9% 0.14 14.9%
16.5%
0.10 11.2%
5.8% 0.07 7.6% 4.9% 0.14 15.0%
15.3%
Lone parent with dependent child(re
0.14
34.5%
8.9% 0.06 15.6%
4.9% 0.08 18.8%
9.1% 0.15 36.2%
8.4% 0.06 16.0%
4.6% 0.08 20.1%
9.0%

61
n)
Other multi-person households
0.12
22.0%
7.4% 0.09 17.2%
7.0% 0.08 16.0%
10.1%
0.13 23.8%
7.1% 0.09 18.6%
6.9% 0.09 16.8%
9.8%
One person under 60
0.35
53.5%
22.0%
0.24 36.6%
18.4% 0.14 21.1%
16.4%
0.38 59.8%
21.7%
0.26 40.3%
18.4%
0.14 21.5%
15.4%
One person aged 60 or over
0.48
37.2%
30.5%
0.42 32.4%
32.4% 0.11 8.8% 13.6%
0.55 42.6%
31.1%
0.47 36.2%
32.9%
0.14 11.2%
15.9%
No
Couple, no dependent child(ren) under 60
0.10
3.4% 4.2% 0.12 3.9% 5.2% 0.13 4.4% 8.1% 0.10 3.4% 4.2% 0.11 3.8% 5.2% 0.12 4.0% 7.6%
Couple, no dependent child(ren) aged 60 or over
0.30
14.3%
12.5%
0.35 16.9%
16.1% 0.20 9.5% 12.6%
0.30 14.3%
12.5%
0.35 16.8%
16.2%
0.20 9.4% 12.6%
Couple with dependent child(ren)
0.24
6.3% 10.0%
0.23 5.9% 10.3% 0.43 11.2%
26.9%
0.24 6.3% 10.1%
0.23 5.9% 10.4%
0.42 11.0%
26.9%
Lone parent with
0.44
33.8%
18.3%
0.25 19.0%
11.3% 0.28 21.7%
17.7%
0.44 33.9%
18.4%
0.25 19.1%
11.5%
0.28 21.4%
17.8%

62
dependent child(ren)
Other multi-person households
0.12
12.2%
4.8% 0.12 13.1%
5.6% 0.12 12.3%
7.3% 0.11 12.1%
4.7% 0.12 12.7%
5.5% 0.11 12.1%
7.3%
One person under 60
0.52
24.4%
21.5%
0.46 21.4%
20.7% 0.25 11.7%
15.6%
0.51 24.2%
21.3%
0.44 20.8%
20.1%
0.25 11.7%
15.9%
One person aged 60 or over
0.69
37.4%
28.7%
0.68 36.7%
30.8% 0.19 10.2%
11.8%
0.70 37.5%
28.8%
0.68 36.7%
31.2%
0.19 10.0%
11.9%
Fuel poverty rates by household composition, in households where HRP or partner are registered disabled
Including DLA & AA Excluding DLA & AA
Basic income Full income LIHC Basic income Full income LIHC HRP or partner registered disabled
Household type
No. in FP (millions)
% of group in FP
% of total FP in group
No. in FP (millions)
% of group in FP
% of total FP in group
No. in FP (millions)
% of group in FP
% of total FP in group
No. in FP (millions)
% of group in FP
% of total FP in group
No. in FP (millions)
% of group in FP
% of total FP in group
No. in FP (millions)
% of group in FP
% of total FP in group
Yes
Couple, no dependent child(ren) under 60
0.03
15.1%
5.9% 0.02 11.8%
6.1% 0.02 12.2%
10.7%
0.03 17.9%
5.1% 0.02 13.5%
5.3% 0.02 14.0%
9.2%
Couple, no depend
0.11
16.6%
23.9%
0.11 17.0%
32.2% 0.08 11.6%
38.0%
0.16 24.2%
26.1%
0.15 22.6%
33.2%
0.10 15.3%
37.1%

63
ent child(ren) aged 60 or over
Couple with dependent child(ren)
0.01
6.2% 2.2% 0.00 2.0% .9% 0.02 10.3%
8.2% 0.02 11.8%
3.1% 0.01 5.0% 1.8% 0.02 11.6%
6.8%
Lone parent with dependent child(ren)
0.02
36.0%
4.0% 0.01 17.5%
2.6% 0.01 14.0%
3.6% 0.02 42.8%
3.6% 0.01 20.5%
2.4% 0.01 19.2%
3.6%
Other multi-person households
0.02
19.4%
5.1% 0.01 12.4%
4.3% 0.02 13.8%
8.1% 0.03 24.5%
4.8% 0.02 15.5%
4.1% 0.02 16.8%
7.4%
One person under 60
0.11
50.0%
23.6%
0.06 26.1%
16.2% 0.04 17.7%
18.9%
0.14 65.6%
23.0%
0.07 34.4%
16.6%
0.04 19.2%
15.2%
One person aged 60 or over
0.16
31.5%
35.3%
0.13 25.7%
37.8% 0.02 4.9% 12.4%
0.21 41.0%
34.3%
0.16 32.1%
36.6%
0.06 11.1%
20.7%
No
Couple, no dependent child(ren) under 60
0.19
5.2% 5.3% 0.20 5.5% 6.4% 0.20 5.4% 8.8% 0.19 5.1% 5.2% 0.20 5.4% 6.3% 0.19 5.1% 8.4%

64
Couple, no dependent child(ren) aged 60 or over
0.48
15.4%
13.4%
0.56 17.8%
17.4% 0.33 10.5%
14.4%
0.49 15.6%
13.5%
0.56 17.8%
17.4%
0.33 10.5%
14.5%
Couple with dependent child(ren)
0.33
7.2% 9.3% 0.30 6.4% 9.3% 0.55 12.0%
24.4%
0.34 7.3% 9.3% 0.30 6.5% 9.4% 0.54 11.8%
24.3%
Lone parent with dependent child(ren)
0.57
33.9%
15.9%
0.31 18.3%
9.6% 0.36 21.3%
15.7%
0.57 34.2%
15.9%
0.31 18.4%
9.7% 0.35 21.2%
15.8%
Other multi-person households
0.23
16.1%
6.4% 0.22 15.4%
6.8% 0.21 14.6%
9.1% 0.23 16.3%
6.4% 0.22 15.4%
6.8% 0.20 14.5%
9.1%
One person under 60
0.76
29.6%
21.3%
0.64 24.9%
20.0% 0.35 13.6%
15.4%
0.76 29.7%
21.0%
0.63 24.6%
19.6%
0.35 13.6%
15.5%
One person aged 60 or over
1.01
38.5%
28.4%
0.97 36.7%
30.4% 0.28 10.5%
12.2%
1.04 39.4%
28.8%
0.98 37.3%
30.9%
0.28 10.4%
12.3%

65
Fuel poverty rates by tenure type, in households containing someone with a long-term illness or disability
Including DLA & AA Excluding DLA & AA
Basic income Full income LIHC Basic income Full income LIHC HH contains someone with illness or disability
Tenure type
No. in FP (millions)
% of group in FP
% of total FP in group
No. in FP (millions)
% of group in FP
% of total FP in group
No. in FP (millions)
% of group in FP
% of total FP in group
No. in FP (millions)
% of group in FP
% of total FP in group
No. in FP (millions)
% of group in FP
% of total FP in group
No. in FP (millions)
% of group in FP
% of total FP in group
Yes
Owner occupied
0.75
19.4%
47.4%
0.84 21.8%
65.0% 0.43 11.2%
51.4%
0.83 21.7%
47.3%
0.91 23.8%
64.5%
0.47 12.3%
52.0%
Private rented
0.25
36.1%
15.8%
0.16 23.5%
12.5% 0.20 29.5%
24.2%
0.27 39.7%
15.4%
0.17 25.4%
12.3%
0.22 31.6%
23.9%
Local authority
0.30
35.2%
19.4%
0.17 19.6%
13.2% 0.11 12.8%
13.3%
0.34 39.8%
19.4%
0.19 21.8%
13.3%
0.12 13.7%
13.0%
Social landlord
0.27
29.8%
17.5%
0.12 13.1%
9.4% 0.09 10.0%
11.1%
0.32 34.3%
17.9%
0.14 15.3%
9.9% 0.10 10.9%
11.1%
No
Owner occupied
1.27
12.0%
52.8%
1.45 13.7%
65.7% 0.88 8.3% 55.3%
1.28 12.0%
52.9%
1.44 13.6%
65.9%
0.87 8.2% 55.5%
Private rented
0.57
21.6%
23.8%
0.45 17.0%
20.4% 0.47 17.9%
29.7%
0.57 21.4%
23.5%
0.44 16.7%
20.2%
0.46 17.5%
29.5%
Local authority
0.30
33.2%
12.2%
0.16 18.1%
7.3% 0.12 13.7%
7.6% 0.30 33.5%
12.4%
0.16 18.1%
7.4% 0.12 13.5%
7.7%
Social landlord
0.27
27.3%
11.3%
0.14 14.4%
6.5% 0.12 11.8%
7.4% 0.27 27.3%
11.3%
0.14 14.4%
6.6% 0.12 11.5%
7.3%

66
Fuel poverty rates by tenure type, in households where the HRP or partner are registered disabled
Including DLA & AA Excluding DLA & AA
Basic income Full income LIHC Basic income Full income LIHC HRP or partner registered disabled
Tenure type
No. in FP (millions)
% of group in FP
% of total FP in group
No. in FP (millions)
% of group in FP
% of total FP in group
No. in FP (millions)
% of group in FP
% of total FP in group
No. in FP (millions)
% of group in FP
% of total FP in group
No. in FP (millions)
% of group in FP
% of total FP in group
No. in FP (millions)
% of group in FP
% of total FP in group
Yes
Owner occupied
0.22
21.2%
48.6%
0.24 23.5%
70.7% 0.10 9.7% 50.5%
0.28 27.5%
47.1%
0.30 28.9%
67.6%
0.14 13.8%
53.1%
Private rented
0.05
34.7%
11.0%
0.03 18.7%
7.8% 0.04 28.6%
20.7%
0.07 47.0%
11.2%
0.04 26.7%
8.7% 0.05 37.7%
20.1%
Local authority
0.10
28.8%
21.2%
0.05 13.9%
13.4% 0.03 9.7% 16.2%
0.13 39.0%
21.4%
0.06 17.9%
13.4%
0.04 11.3%
13.9%
Social landlord
0.09
24.0%
19.2%
0.03 7.7% 8.0% 0.03 6.9% 12.6%
0.12 34.1%
20.3%
0.05 12.6%
10.3%
0.03 9.6% 12.9%
No
Owner occupied
1.82
13.5%
50.9%
2.06 15.3%
64.7% 1.22 9.1% 53.9%
1.84 13.7%
51.1%
2.07 15.4%
64.9%
1.21 9.0% 54.0%
Private rented
0.79
24.2%
22.1%
0.60 18.4%
18.8% 0.66 20.2%
29.0%
0.79 24.3%
21.8%
0.59 18.2%
18.5%
0.65 19.9%
28.9%
Local authority
0.50
35.5%
14.1%
0.28 20.0%
8.9% 0.20 14.0%
8.8% 0.51 36.1%
14.2%
0.29 20.4%
9.1% 0.20 14.1%
8.9%
Social landlord
0.46
29.6%
13.0%
0.24 15.3%
7.5% 0.19 12.0%
8.3% 0.47 29.9%
13.0%
0.24 15.4%
7.6% 0.18 11.7%
8.2%

67
Fuel poverty rates by electricity payment method, in households containing someone with a long-term illness or disability
Including DLA & AA Excluding DLA & AA
Basic income Full income LIHC Basic income Full income LIHC HH contains someone with illness or disability
Electricity payment method
No. in FP (millions)
% of group in FP
% of total FP in group
No. in FP (millions)
% of group in FP
% of total FP in group
No. in FP (millions)
% of group in FP
% of total FP in group
No. in FP (millions)
% of group in FP
% of total FP in group
No. in FP (millions)
% of group in FP
% of total FP in group
No. in FP (millions)
% of group in FP
% of total FP in group
Yes
Direct debit
0.58
16.4%
36.9%
0.57 16.20%
44.60% 0.33 9.2% 39.1%
0.66 18.6%
37.4%
0.63 17.8%
44.7%
0.36 10.2%
39.9%
Standard credit
0.50
31.9%
31.5%
0.43 27.30%
33.00% 0.24 15.6%
29.0%
0.54 35.0%
30.8%
0.46 29.9%
32.8%
0.26 17.0%
29.1%
Pre payment
0.50
41.0%
31.6%
0.29 23.90%
22.50% 0.27 22.0%
32.0%
0.56 46.3%
31.7%
0.32 26.3%
22.5%
0.28 23.2%
31.0%
No
Direct debit
1.05
10.7%
43.5%
1.09 11.10%
49.50% 0.72 7.3% 44.9%
1.05 10.7%
43.5%
1.08 10.9%
49.3%
0.71 7.2% 45.0%
Standard credit
0.73
21.2%
30.4%
0.70 20.20%
31.70% 0.49 14.1%
30.6%
0.73 21.2%
30.3%
0.69 20.0%
31.6%
0.47 13.7%
30.2%
Pre payment
0.63
34.5%
26.1%
0.42 22.80%
18.90% 0.39 21.5%
24.5%
0.63 34.6%
26.2%
0.42 22.8%
19.0%
0.39 21.3%
24.8%

68
Fuel poverty rates by electricity payment method, in households where the HRP or partner are registered disabled
Including DLA & AA Excluding DLA & AA
Basic income Full income LIHC Basic income Full income LIHC HRP or partner registered disabled
Electricity payment method
No. in FP (millions)
% of group in FP
% of total FP in group
No. in FP (millions)
% of group in FP
% of total FP in group
No. in FP (millions)
% of group in FP
% of total FP in group
No. in FP (millions)
% of group in FP
% of total FP in group
No. in FP (millions)
% of group in FP
% of total FP in group
No. in FP (millions)
% of group in FP
% of total FP in group
Yes
Direct debit
0.17
16.8%
36.9%
0.16 16.20%
46.70% 0.08 8.0% 39.7%
0.23 23.4%
38.2%
0.21 20.8%
46.4%
0.11 11.5%
42.4%
Standard credit
0.15
29.9%
32.2%
0.11 22.60%
31.90% 0.05 11.0%
26.8%
0.19 38.3%
30.8%
0.14 28.6%
31.4%
0.08 15.7%
28.4%
Pre payment
0.14
35.3%
30.9%
0.07 18.60%
21.40% 0.07 16.9%
33.5%
0.19 47.2%
31.0%
0.10 24.8%
22.2%
0.08 19.8%
29.2%
No
Direct debit
1.48
11.9%
41.4%
1.52 12.20%
47.70% 0.98 7.8% 43.2%
1.49 12.0%
41.4%
1.52 12.2%
47.5%
0.97 7.8% 43.2%
Standard credit
1.10
24.0%
30.7%
1.03 22.50%
32.20% 0.69 15.1%
30.4%
1.10 24.2%
30.5%
1.03 22.6%
32.3%
0.67 14.7%
30.0%
Pre payment
0.99
37.5%
27.9%
0.64 24.20%
20.10% 0.60 22.6%
26.5%
1.01 38.2%
28.1%
0.64 24.3%
20.2%
0.60 22.6%
26.8%

69
Fuel poverty rates by gas payment method, in households containing someone with a long-term illness or disability
Including DLA & AA Excluding DLA & AA
Basic income Full income LIHC Basic income Full income LIHC HH contains someone with illness or disability
Gas payment method
No. in FP (millions)
% of group in FP
% of total FP in group
No. in FP (millions)
% of group in FP
% of total FP in group
No. in FP (millions)
% of group in FP
% of total FP in group
No. in FP (millions)
% of group in FP
% of total FP in group
No. in FP (millions)
% of group in FP
% of total FP in group
No. in FP (millions)
% of group in FP
% of total FP in group
Yes
Direct debit
0.50
15.7%
31.8%
0.48 15.10%
37.20% 0.28 8.9% 34.0%
0.57 18.0%
32.5%
0.54 17.0%
38.1%
0.31 9.8% 34.3%
Standard credit
0.39
29.0%
24.9%
0.33 24.30%
25.50% 0.21 15.5%
25.1%
0.43 31.9%
24.4%
0.36 26.9%
25.7%
0.23 17.0%
25.3%
Pre payment
0.37
39.7%
23.4%
0.21 23.10%
16.60% 0.21 22.1%
24.5%
0.42 45.2%
23.8%
0.24 25.4%
16.7%
0.21 22.8%
23.4%
No
Direct debit
0.83
9.4% 34.4%
0.86 9.60%
38.80% 0.60 6.7% 37.5%
0.83 9.3% 34.4%
0.84 9.5% 38.7%
0.59 6.6% 37.6%
Standard credit
0.60
20.2%
24.9%
0.56 18.70%
25.30% 0.43 14.5%
27.2%
0.60 20.0%
24.7%
0.55 18.4%
25.1%
0.42 14.1%
26.7%
Pre payment
0.48
35.4%
20.0%
0.31 22.60%
14.00% 0.31 23.0%
19.7%
0.49 35.6%
20.2%
0.31 22.6%
14.2%
0.31 22.9%
20.0%
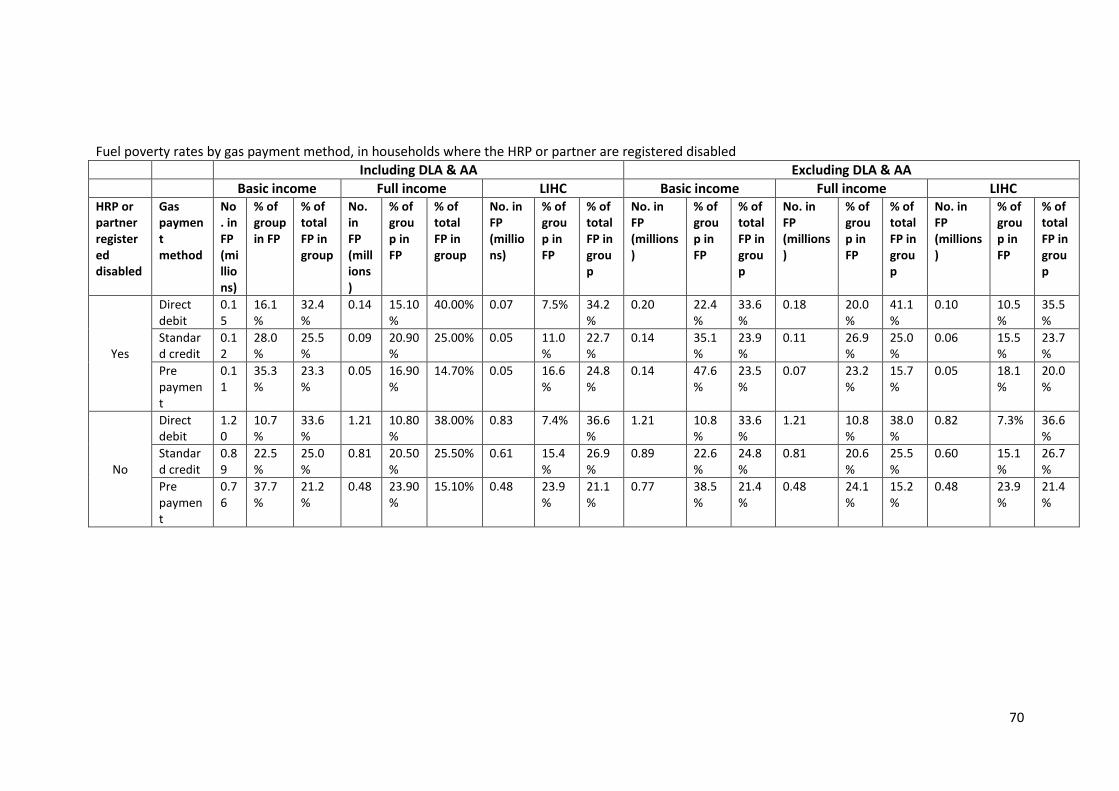
70
Fuel poverty rates by gas payment method, in households where the HRP or partner are registered disabled Including DLA & AA Excluding DLA & AA
Basic income Full income LIHC Basic income Full income LIHC HRP or partner registered disabled
Gas payment method
No. in FP (millions)
% of group in FP
% of total FP in group
No. in FP (millions)
% of group in FP
% of total FP in group
No. in FP (millions)
% of group in FP
% of total FP in group
No. in FP (millions)
% of group in FP
% of total FP in group
No. in FP (millions)
% of group in FP
% of total FP in group
No. in FP (millions)
% of group in FP
% of total FP in group
Yes
Direct debit
0.15
16.1%
32.4%
0.14 15.10%
40.00%
0.07 7.5% 34.2%
0.20 22.4%
33.6%
0.18 20.0%
41.1%
0.10 10.5%
35.5%
Standard credit
0.12
28.0%
25.5%
0.09 20.90%
25.00% 0.05 11.0%
22.7%
0.14 35.1%
23.9%
0.11 26.9%
25.0%
0.06 15.5%
23.7%
Pre payment
0.11
35.3%
23.3%
0.05 16.90%
14.70% 0.05 16.6%
24.8%
0.14 47.6%
23.5%
0.07 23.2%
15.7%
0.05 18.1%
20.0%
No
Direct debit
1.20
10.7%
33.6%
1.21 10.80%
38.00% 0.83 7.4% 36.6%
1.21 10.8%
33.6%
1.21 10.8%
38.0%
0.82 7.3% 36.6%
Standard credit
0.89
22.5%
25.0%
0.81 20.50%
25.50% 0.61 15.4%
26.9%
0.89 22.6%
24.8%
0.81 20.6%
25.5%
0.60 15.1%
26.7%
Pre payment
0.76
37.7%
21.2%
0.48 23.90%
15.10% 0.48 23.9%
21.1%
0.77 38.5%
21.4%
0.48 24.1%
15.2%
0.48 23.9%
21.4%


![Are current approaches to poverty measurement disability … · 2020. 8. 5. · Disability and poverty are intimately linked, with the one reinforcing the other [1-3]. Given this](https://img.pdfslide.net/doc/110x75/6029ba2c5a88886eda425574/are-current-approaches-to-poverty-measurement-disability-2020-8-5-disability.jpg)


![Disability and Poverty[1]](https://img.pdfslide.net/doc/110x75/53fcc47fdab5ca94038b48fc/disability-and-poverty1.jpg)