Embed Size (px)
Citation preview

EXECUTIVE SUMMARY
According to recently released documents, the OECD is
considering several options to reform global corporate
tax systems, one of which is to introduce a new formula
for allocating the corporate tax base based on marketing
intangibles. In essence, it will create a new concept of
“residual corporate income” which consists, essentially,
of what is deemed as non-routine returns on business
assets – i.e. returns that exceed a certain “normal” re-
turn. This tax base will then be allocated to the countries
in which the company is selling, based on the allocation
of the company’s marketing intangibles.
The marketing intangibles approach is a compromise
between the current transfer pricing system and desti-
nation-based income tax. The marketing intangibles ap-
proach implies that more corporate income tax revenue
is moved from the country of the entrepreneurial risk-
taker to the destination of the consumer. The impact on
specific businesses will depend largely on the precise
details of the final proposal. At this point, there is no in-
ternational consensus on how to address these chal-
lenges.
We conclude that small, open countries with high-inten-
sity R&D in exporting sectors will lose net revenues. The
Nordic countries, with their higher than average share
of the life science and ICT industries, clearly fall into
this category, as does Germany. This is linked to the fact
that industries with a high share of marketing intangi-
bles relative to enterprise value also have high-intensity
R&D: in fact, the distinction between the different kinds
of intangibles is not clear cut. A high value of marketing
intangibles is often the result of previous heavy invest-
ment in R&D, which creates market and brand value.
A conservative approximation suggests that 18-21% of
the current corporate tax base in the Nordics came from
foreign residual profits in 2017. For Germany the share
is approximately 17%. If the marketing intangibles ap-
proach is introduced, the bulk of this corporate tax rev-
enue would be allocated to other countries.
We also find that the discussions of alternative new
ways of reforming the global corporate tax regime are
taking place in the absence of a clear discussion of what
problems they are intended to solve. The BEPS efforts
in conjunction with national tax reforms, notably the
latest US tax reform, have markedly reduced incentives
and options to shift mobile tax bases to low-tax jurisdic-
tions. Formal tax rates in the OECD area are increas-
ingly converging in the range of 20-25%. The overall tax
revenue from corporate taxes has remained stable for
decades as reductions in rates have to a large extent also
been followed by base broadening. In conclusion, it is
Authors:
Sigurd Næss-Schmidt, Palle Sørensen, Benjamin Barner
Christiansen, Vincenzo Zurzolo, Charlotta Zienau, Jonas
Juul Henriksen and Joshua Brown 19 February 2019
FUTURE TAXATION OF
COMPANY PROFITS: WHAT TO DO
WITH INTANGIBLES?
COMMISSIONED BY SVENSKT NÄRINGSLIV
2
difficult to see a burning platform for radical changes to
the global tax system.
Moreover, the new options on the table are problematic
in several ways. They may reduce member states’ incen-
tives to invest in high-growth, high-risk and R&D-inten-
sive industries: the high returns of successful firms
would be shared globally according to the residual in-
come concept, while the losses of unsuccessful firms
would be absorbed by the local economy. Moreover, the
compliance challenges would be massive.
Looking at all the measures, we suggest that the
measures that ensure minimum effective tax rates for
firms trading globally have the most merit. While in no
way being a walk in the park, such an approach is closely
linked to the aim of the BEPS process and likely to pre-
sent less of a challenge from a compliance perspective.

3
INTRODUCTION
The discussions addressing the tax challenges of the dig-
ital economy in BEPS action 1 are progressing, the aim
being to achieve an international consensus by 2020.
The discussions are in part a continuation of two mile-
stone reports:
• the final report, Addressing the Tax Challenges of the
Digital Economy, from 2015, which concludes that
because the digital economy is increasingly becoming
the economy itself, it would not be feasible to ring-
fence the digital economy from the rest of the econ-
omy for tax purposes,1 and
• the interim report, Tax Challenges Arising from Dig-
italisation, from 2018, which sets out the Inclusive
Framework’s agreed direction of work on digitalisa-
tion and the international tax rules through to 2020.2
This process should be seen in the context of recent uni-
lateral – e.g. UK, French, Austrian and Spanish – and
EU proposals aimed at the digital economy, most nota-
bly the EU Digital Services Tax (DST) proposal. How-
ever, no proposals have been adopted at the EU level as
of the writing of this report.
According to a recent policy note by the OECD, the dis-
cussions are already progressing in respect of three pro-
posals:3
• a digital-only solution aimed at specific digital ser-
vices
• a marketing intangibles approach aimed at all MNEs
in all industries with a destination-based allocation
mechanism
• a minimum tax solution (e.g. denial of deduction on
outbound payments if a certain effective tax rate
(ETR) threshold of the payee is not met)
In this context, we have been asked by Svenskt
Näringsliv (Confederation of Swedish Enterprise) to
1 See OECD (2015), Addressing the Tax Challenges of the Digital
Economy, Action 1 - 2015 Final Report, OECD/G20 Base Erosion
and Profit Shifting Project, OECD Publishing, Paris,
https://doi.org/10.1787/9789264241046-en
2 See OECD (2018), Tax Challenges Arising from Digitalisation – In-
terim Report 2018: Inclusive Framework on BEPS, OECD/G20 Base
Erosion and Profit Shifting Project, OECD Publishing,
Paris, https://doi.org/10.1787/9789264293083-en
conduct a study of one of the three proposals: the mar-
keting intangibles approach. Specifically, we have been
asked to analyse the likely consequences of the proposal
on tax revenues and effective tax rates in the Nordics,
the US and Germany.
1 WHAT IS BEING PROPOSED?
The study starts by explaining the marketing intangibles
approach (section 1.1). Next, some key features of the
approach are explained in a stilised example (section
1.2), emphasising that many of the key details of the pro-
posal are yet to be determined. The final part of section
1 briefly discusses the business models targeted by the
proposal (section 1.3).
1.1 THE MARKETING INTANGIBLES
APPROACH IS A COMPROMISE BETWEEN
THE CURRENT TRANSFER PRICING SYSTEM
AND DESTINATION-BASED TAX
Today, the corporate income tax (CIT) base of multina-
tional enterprises (MNEs) is allocated to group affiliates
according to the so-called transfer pricing system.
Broadly speaking, the system is designed to ensure that
MNEs do not obtain an inappropriate tax advantage by
pricing within-group transactions differently than inde-
pendent businesses would, according to the so-called
arm’s length principle.4
The arm’s length principle dictates that MNEs should
allocate their taxable corporate income among affiliates
in different countries in which they do business, in a way
that imitates the outcome of transactions that occur be-
tween independent businesses.5
A key feature of the current transfer pricing system is
that corporate income beyond what is allocated accord-
ing to the cost-plus or return-on-asset basis using the
arm’s length principle is allocated to the entrepreneurial
risk-taker(s) in the MNE group. Specifically, these are
defined as affiliates of the group that own the non-rou-
tine intangibles, carry non-routine risks and perform
3 See OECD (2019), Addressing the Tax Challenges of the Digitali-
sation of the Economy – Policy Note. As approved by the Inclu-
sive Framework on BEPS on 23 January 2019.
4 Note that more than half of world trade is intra-firm and hence
subject to transfer pricing (cf. World Bank (2017) Arm’s-Length
Trade: A Source of Post-Crisis Trade Weakness).
5 See OECD (2015), Aligning Transfer Pricing Outcomes with
Value Creation, Actions 8-10, Final Report.
4
the DEMPE (Development, Enhancement, Mainte-
nance, Protection and Exploitation) functions. Thus, in
practice this is often the headquarters (HQ) of the MNE.
This additional corporate income is often referred to as
excess or residual profits.
The marketing intangibles (MI) approach starts by de-
fining a split between routine and residual income.6
This implies that affiliates of the MNE group are com-
pensated for their routine functions on a cost-plus or re-
turn-on-asset basis according to the arm’s length prin-
ciple (current transfer pricing rules). However, instead
of allocating all the residual income to the entrepre-
neurial risk-taker(s) in the MNE group, the residual in-
come is further divided between income arising from
marketing intangibles and income arising from other
intangibles.7
The share of residual income deemed to arise from mar-
keting intangibles is then allocated to the market of des-
tination for the good or service, while the residual in-
come deemed to arise from other intangibles is still al-
located according to current transfer pricing principles.
In that sense, the MI approach is a compromise between
6 The MI approach is related to the Destination-based Residual
Profit Allocation – see e.g. Andrus and Oosterhuis (2017) Transfer
Pricing After BEPS: Where Are We and Where Should We Be Go-
ing. Also note that routine and residual profits are often referred
to as normal and excess profits, respectively.
7 Cf. Grinberg (2018), International Taxation in an Era of Digital
Disruption: Analyzing the Current Debate, it is not clear whether
the term “marketing intangibles” covers both marketing and
consumer-related intangibles: “There may very well be a sub-
the current transfer pricing system and a destination-
based income tax.
1.2 KEY FEATURES IN A STYLISED
EXAMPLE
In general, the MI approach consists of moving taxable profits from HQ/IP principals that carry non-routine risks, perform non-routine functions (DEMPE func-tions) and hold non-routine intangibles to destination markets where consumers are located. This feature is shared with many contemporaneous proposals for in-ternational corporate tax reform.8 However, the extent to which this is the case for the MI approach depends crucially on a range of details in which - according to the best of our understanding - no consensus exists at the OECD level at the time of writing this report. Specifi-cally, among others, these details include:
• whether definitions of “permanent establishment” (PE) are revised or not, and if so, how;
• how, in defining residual and routine profits, a nor-
mal return to physical/tangible assets and other in-
tangibles is to be defined; and
• how to value marketing intangibles relative to other
intangibles.
stantive distinction between marketing intangibles and cus-
tomer-based Intangibles.” Note that some of the issues in both
valuing and defining marketing intangibles are discussed further
in section 3.
8 The user contribution proposals (e.g. the EU Digital Services Tax
(DST) and similar unilateral proposals) and the formula appor-
tionment proposals (e.g. the EU Common Consolidated Corpo-
rate Tax Base (CCCTB)) all tend to move more taxable profits to
destination markets.
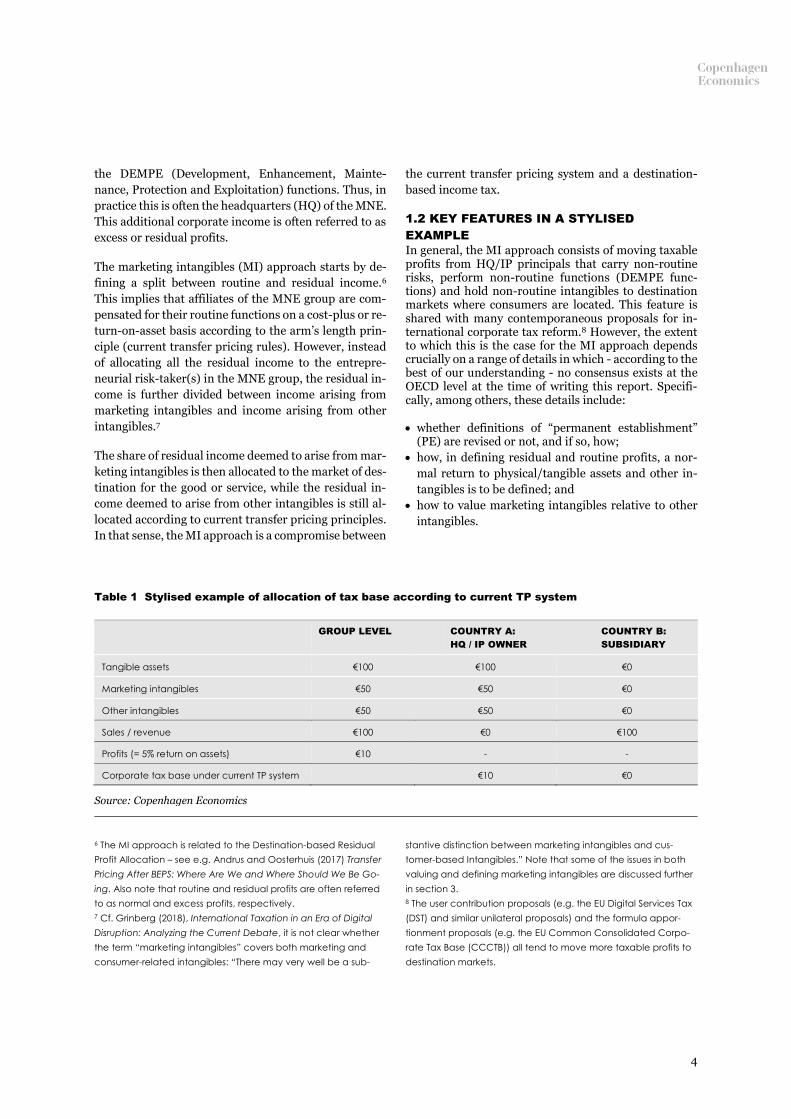
Table 1 Stylised example of allocation of tax base according to current TP system
GROUP LEVEL COUNTRY A:
HQ / IP OWNER
COUNTRY B:
SUBSIDIARY
Tangible assets €100 €100 €0
Marketing intangibles €50 €50 €0
Other intangibles €50 €50 €0
Sales / revenue €100 €0 €100
Profits (= 5% return on assets) €10 - -
Corporate tax base under current TP system €10 €0
Source: Copenhagen Economics

5
To understand this, consider the following stylised ex-
ample (see table 1 for reference): Consider an MNE with
its HQ / IP principal in country A, which holds all non-
routine assets (both tangible and intangible), carries all
non-routine risks and performs all non-routine func-
tions, and with a subsidiary in country B, which has no
assets. However, all sales are generated in country B.
Specifically, at the group level the MNE has profits of
€10, sales of €100 and assets of €200.9
Under the current TP system, the whole corporate tax
base is allocated to country A, as all non-routine func-
tions, assets and entrepreneurial risks are located in
country A and there are no assets in country B.
Developing this example further, assume now that the
normal return to tangible assets and hence routine func-
tions is 5%, that the normal return is 5% for intangibles
9 The split between tangibles, marketing intangibles and other in-
tangibles is set by assumption.
and that the MI approach is introduced. In this case, the
subsidiary in country B is allocated only part of the cor-
porate tax base if it constitutes a PE. If this is not the
case, the whole tax base remains in country A, as coun-
try B has no taxing rights.10 However, if the subsidiary
in country B constitutes a PE, €2.5 of the corporate tax
base are allocated to country B – see also table 2 (left
side). This allocation arises as residual profits are equal
to total profits minus profits arising from routine func-
tions (in this example tangible assets), i.e. €10 minus €5
(€100*5% in normal return). The residual profits are
then evenly split between profits arising from marketing
intangibles and other intangibles, i.e. €2.5 arising from
marketing intangibles and €2.5 from other intangibles.
Profits arising from other intangibles are allocated ac-
cording to existing TP rules and are therefore allocated
10 Note that a limited physical presence is often the case in
highly digitalised business models.
Table 2 Stylised example of allocation of tax base according to MI approach with varying definitions of
normal returns
WITH 5% NORMAL RETURN WITH 10% NORMAL RETURN
Group
level
Country A:
HQ / IP owner
Country B:
Subsidiary
Group
level
Country A:
HQ / IP owner
Country
B: Sub-
sidiary
Tangible assets €100 €100 €0 €100 €100 €0
Marketing intangibles €50 €0 €50 €50 €0 €50
Other intangibles €50 €50 €0 €50 €50 €0
Sales / revenue €100 €0 €100 €100 €0 €100
Profits (= 5% return on assets) €10 - - €10 - -
Routine profits €5 €10
Residual profits €5 - - €0 - -
Residual profits arising from other
intangibles
- €2.5 - - €0 -
Residual profits arising from MI - - €2.5 - - €0
Corporate tax base under MI ap-
proach
€7.5 €2.5 €10 €0
Source: Copenhagen Economics
6
to country A. However, all profits arising from market-
ing intangibles are allocated to country B, as all sales
and hence consumers are located in country B.
As illustrated in the example above, the distinction be-
tween routine and residual profits plays a key role in de-
termining the impact of introducing the MI approach.11
If the normal return is instead set at 10%, the group gen-
erates no residual profits (routine profits equal €10, i.e.
all profits) to be allocated according to the MI approach
– see table 2 (right side). In conclusion, if the normal
return is set at a high level, the impact of the MI ap-
proach is relatively less pronounced.
11 Note that the distinction between routine and residual profits
for taxation purposes is highly controversial – cf. OECD (2016),
Distinguishing between “normal” and “excess” returns in tax pol-
icy. We discuss this in further detail in section 3.
12 Neither marketing intangibles nor other intangibles are cur-
rently valued in annual accounts, as intangibles are generally
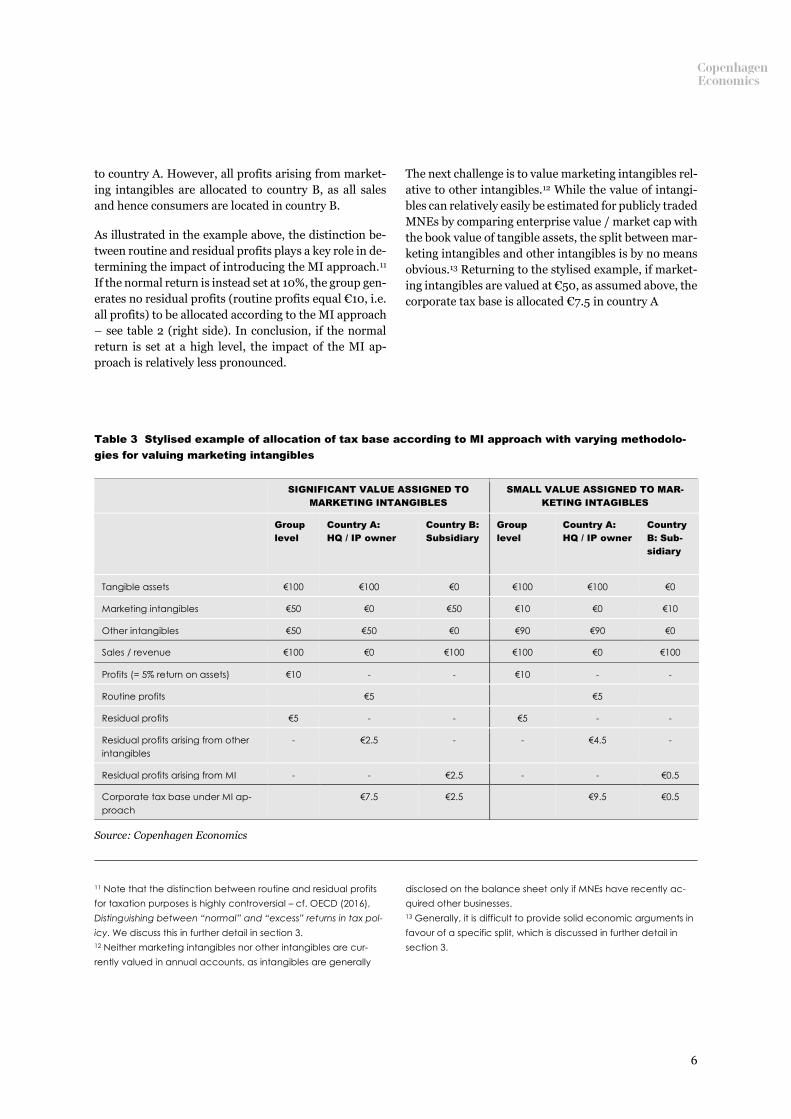
The next challenge is to value marketing intangibles rel-
ative to other intangibles.12 While the value of intangi-
bles can relatively easily be estimated for publicly traded
MNEs by comparing enterprise value / market cap with
the book value of tangible assets, the split between mar-
keting intangibles and other intangibles is by no means
obvious.13 Returning to the stylised example, if market-
ing intangibles are valued at €50, as assumed above, the
corporate tax base is allocated €7.5 in country A
disclosed on the balance sheet only if MNEs have recently ac-
quired other businesses.
13 Generally, it is difficult to provide solid economic arguments in
favour of a specific split, which is discussed in further detail in
section 3.
Table 3 Stylised example of allocation of tax base according to MI approach with varying methodolo-
gies for valuing marketing intangibles
SIGNIFICANT VALUE ASSIGNED TO
MARKETING INTANGIBLES
SMALL VALUE ASSIGNED TO MAR-
KETING INTAGIBLES
Group
level
Country A:
HQ / IP owner
Country B:
Subsidiary
Group
level
Country A:
HQ / IP owner
Country
B: Sub-
sidiary
Tangible assets €100 €100 €0 €100 €100 €0
Marketing intangibles €50 €0 €50 €10 €0 €10
Other intangibles €50 €50 €0 €90 €90 €0
Sales / revenue €100 €0 €100 €100 €0 €100
Profits (= 5% return on assets) €10 - - €10 - -
Routine profits €5 €5
Residual profits €5 - - €5 - -
Residual profits arising from other
intangibles
- €2.5 - - €4.5 -
Residual profits arising from MI - - €2.5 - - €0.5
Corporate tax base under MI ap-
proach
€7.5 €2.5 €9.5 €0.5
Source: Copenhagen Economics
7
and €2.5 in country B – see also table 3. However, if a
different methodology is used that assigns a lower value
to marketing intangibles relative to other intangibles,
the tax base in country A is €9.5 and in country B it is
only €0.5. This is the case as residual profits are still €5,
but now the residual profits are split with 90% to other
intangibles and only 10% to marketing intangibles
(equal to €5*10%). The inherent uncertainty over the
exact valuation methodology used for marketing intan-
gibles will impact the results.
1.3 THE MARKETING INTANGIBLES
APPROACH NOT AFFECTS NOT ONLY TECH
COMPANIES BUT ALSO OTHER
KNOWLEDGE-INTENSIVE INDUSTRIES
While the marketing intangibles proposal is part of the
discussions on addressing the tax challenges of the dig-
ital economy in BEPS action 1, the MI approach affects
most industries and not just large digital companies.
This contrasts with e.g. the EU Digital Services Tax and
the user contribution approach which are specifically
aimed at a range of digital services and hence seek to
ring-fence specific digital services for tax purposes.14
The MI approach broadly affects all industries that:
• have high returns relative to tangible/physical assets;
• rely heavily on intangibles;
• are internationally focused (have affiliates in multiple
countries); and
• have an international customer base.
This is indeed the case for tech MNEs but also, as argued
in more detail in section 2, for MNEs in e.g. pharmaceu-
ticals and car manufacturing and, in general, for all
R&D-intensive business models.
14 Note that such ring-fencing of specific services is generally
controversial. For example, OECD (2015) Addressing the Tax
Challenges of the Digital Economy, Action 1 - Final Report notes:
“[… The report] notes that because the digital economy is in-
creasingly becoming the economy itself, it would not be feasible
2 SMALL, INNOVATIVE, OPEN
ECONOMIES LIKELY TO LOSE TAX
REVENUE
In this section, we start by reviewing recent estimates of
the role of marketing intangibles across sectors (section
2.1). Next, we explain why the Nordics in particular are
likely to lose a substantial share of their current corpo-
rate income tax revenue if the marketing approach is
adopted (section 2.2). Furthermore, the Nordics are not
likely to be compensated by new incoming tax revenue
(section 2.3). Also, other countries relying on
knowledge-intensive sectors – such as Germany and the
US - are for some of the same reasons also likely to lose
revenue but to a smaller extent (section 2.4). The final
part of section 2 discusses the impact of the MI ap-
proach on effective tax rates (ETR) on specific busi-
nesses (section 2.5).
to ring-fence the digital economy from the rest of the economy
for tax purposes.” A more thorough discussion of this specific
challenge is, however, beyond the scope of this study.
Key learning points from section 1
• The marketing intangibles approach is a
compromise between the current transfer
pricing system and destination-based in-
come tax.
• The marketing intangibles approach implies
that more corporate income tax revenue is
moved from the entrepreneurial risk-taker to
the destination of the consumer relative to
the status quo.
• The impact on specific businesses will de-
pend largely on the precise details of the fi-
nal proposal. At this point, there is no inter-
national consensus on how to address these
challenges.
• The marketing intangibles approach is not
just a tax on tech MNEs but will likely affect
most industries and R&D-intensive industries
in particular.
8
2.1 MARKETING INTANGIBLES MAKE UP A
SIGNIFICANT SHARE OF ASSETS ACROSS
SECTORS
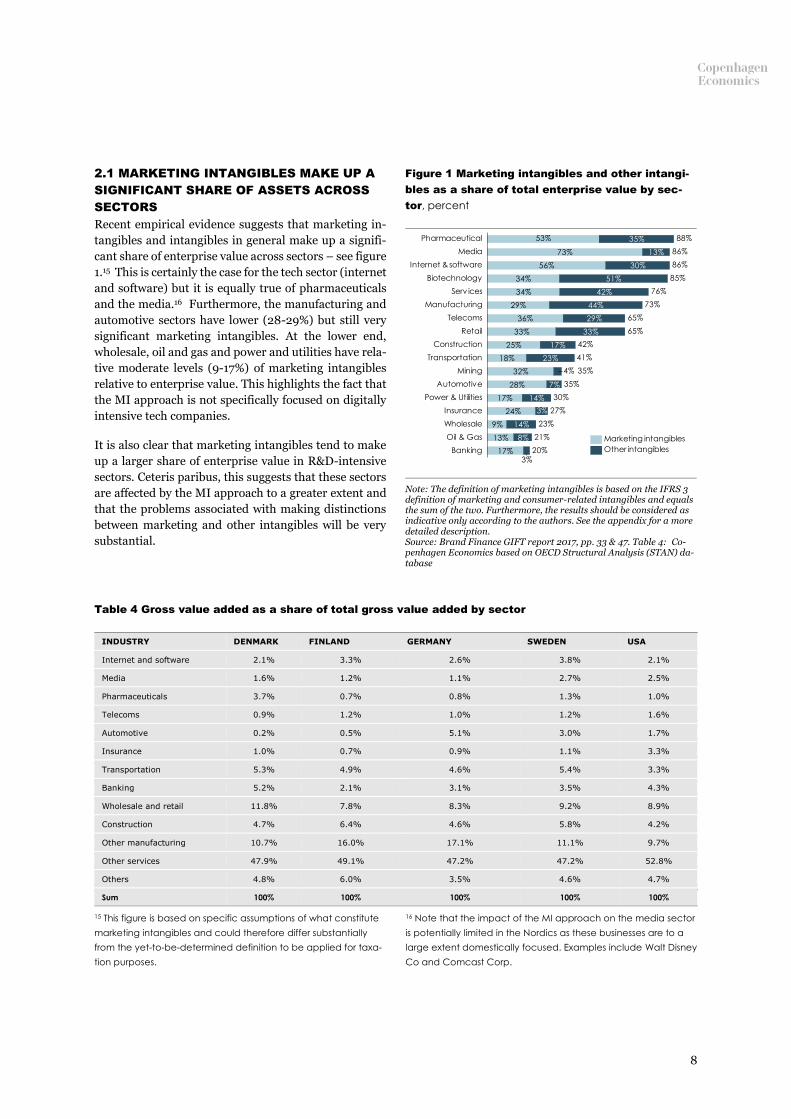
Recent empirical evidence suggests that marketing in-
tangibles and intangibles in general make up a signifi-
cant share of enterprise value across sectors – see figure
1.15 This is certainly the case for the tech sector (internet
and software) but it is equally true of pharmaceuticals
and the media.16 Furthermore, the manufacturing and
automotive sectors have lower (28-29%) but still very
significant marketing intangibles. At the lower end,
wholesale, oil and gas and power and utilities have rela-
tive moderate levels (9-17%) of marketing intangibles
relative to enterprise value. This highlights the fact that
the MI approach is not specifically focused on digitally
intensive tech companies.
It is also clear that marketing intangibles tend to make
up a larger share of enterprise value in R&D-intensive
sectors. Ceteris paribus, this suggests that these sectors
are affected by the MI approach to a greater extent and
that the problems associated with making distinctions
between marketing and other intangibles will be very
substantial.
15 This figure is based on specific assumptions of what constitute
marketing intangibles and could therefore differ substantially
from the yet-to-be-determined definition to be applied for taxa-
tion purposes.
16 Note that the impact of the MI approach on the media sector
is potentially limited in the Nordics as these businesses are to a
large extent domestically focused. Examples include Walt Disney
Co and Comcast Corp.
Figure 1 Marketing intangibles and other intangi-
bles as a share of total enterprise value by sec-
tor, percent
Note: The definition of marketing intangibles is based on the IFRS 3 definition of marketing and consumer-related intangibles and equals the sum of the two. Furthermore, the results should be considered as indicative only according to the authors. See the appendix for a more detailed description. Source: Brand Finance GIFT report 2017, pp. 33 & 47. Table 4: Co-penhagen Economics based on OECD Structural Analysis (STAN) da-tabase
Table 4 Gross value added as a share of total gross value added by sector
INDUSTRY DENMARK FINLAND GERMANY SWEDEN USA
Internet and software 2.1% 3.3% 2.6% 3.8% 2.1%
Media 1.6% 1.2% 1.1% 2.7% 2.5%
Pharmaceuticals 3.7% 0.7% 0.8% 1.3% 1.0%
Telecoms 0.9% 1.2% 1.0% 1.2% 1.6%
Automotive 0.2% 0.5% 5.1% 3.0% 1.7%
Insurance 1.0% 0.7% 0.9% 1.1% 3.3%
Transportation 5.3% 4.9% 4.6% 5.4% 3.3%
Banking 5.2% 2.1% 3.1% 3.5% 4.3%
Wholesale and retail 11.8% 7.8% 8.3% 9.2% 8.9%
Construction 4.7% 6.4% 4.6% 5.8% 4.2%
Other manufacturing 10.7% 16.0% 17.1% 11.1% 9.7%
Other services 47.9% 49.1% 47.2% 47.2% 52.8%
Others 4.8% 6.0% 3.5% 4.6% 4.7%
Sum 100% 100% 100% 100% 100%
73%
56%
34%
34%
29%
36%
33%
25%
18%
32%
28%
17%
24%
9%
13%
17%
35%
13%
30%
51%
42%
44%
29%
33%
17%
23%
7%
14%
14%
8%
3%
65%Telecoms
Pharmaceutical
Biotechnology
Media
Internet & software
Construction
Serv ices
85%
Power & Utilities
Retail
Banking
Manufacturing
Transportation
Mining
Automotive
73%
3%
30%
35%
65%
Wholesale
Oil & Gas
88%
86%
76%
86%
20%
42%
41%
35%
53%
27%
23%
21%
4%
Insurance
Other intangibles
Marketing intangibles

9
The high dependence of marketing intangibles in spe-
cific sectors should not least be seen in the context of
high gross value added (GVA) in these sectors in the
Nordics, Germany and the US. For example, Denmark
relies disproportionately on pharmaceuticals, the US,
Finland and Sweden on the internet and software and
Germany on automotive – see table 4.
2.2 A SIGNIFICANT SHARE OF THE NORDIC
AND GERMAN CORPORATE TAX BASE IS AT
STAKE
A conservative estimate suggests that 18-21% of the cur-
rent corporate tax base in the Nordics came from for-
eign residual profits in 2017 – see figure 2.17 For Ger-
many, the share is approximately 17%. If the MI ap-
proach is introduced, the bulk of this CIT revenue would
be allocated to other countries.18
Based on a specific assumption about what constitutes
a normal return, the results suggest that routine profits
make up 33-48% of the overall return. This is generally
consistent but higher than existing literature suggests,
i.e. that 32-40% of corporate income is attributable to
the normal return on capital.19 A significant share of re-
sidual profits is, however, attributable to domestic
sales.20
The extent to which this will result in a loss of the cur-
rent corporate tax base will depend crucially on how
marketing intangibles are valued and defined relative to
other intangibles.21 At this point, no specific details re-
garding the split and methodology have been released
by the OECD.
A recent study suggests that marketing intangibles
make up 60-68% (depending on R&D intensity) of total
intangibles22, suggesting that more than half of residual
17 Note that this estimate is based on a restrictive set of assump-
tions and relies on proxies. Furthermore, the calculation is based
on a specific assumption of return allowed on routine functions.
However, the estimated impact is considered conservative for
multiple reasons, as discussed in detail in the appendix.
18 As discussed in more detail in section 3, this will depend on
what methodology is chosen for valuing marketing intangibles.
19 See Gentry and Hubbard (1996), Distributional Implications of
Introducing a Broad-Based Consumption Tax; Toder and Rueben
(2005), Should We Eliminate Taxation of Capital Income? and
Cronin et al. (2012), Distributing the Corporate Income Tax: Re-
vised U.S. Treasury Methodology. However, the methodology
profits related to foreign returns will be allocated to des-
tination markets.
2.3 THE NORDICS ARE LIKELY TO LOSE
TAX REVENUE WITH THE MARKETING
INTANGIBLES APPROACH
The MI approach potentially also allows the Nordics to
capture part of the corporate tax base currently paid
used in these studies differs substantially from the approach used
in this study.
20 Our approach potentially overestimates the share of residual
profits attributable to domestic sales as we rely on sector aver-
ages of exports – see appendix for a detailed discussion.
21 As discussed in section 3, there seem to be no stable eco-
nomic arguments to base such methodologies on currently.
22 See Brand Finance GIFT report 2017 assuming that both mar-
keting and consumer-related intangibles are captured in the
OECD MI approach.
Figure 2 Approximate distribution of tax revenue
from routine and residual profits by country, 2017
percent
Note: This assumes a normal return of 4% and uses average
export shares within R&D intensity sectors. The estimates
are based on a sample from 2010-2015 corrected for the real
change in corporate tax revenue from 2010-2015 to 2017. See
the appendix for a detailed description of the methodology.
Source: Copenhagen Economics based on Amadeus data-
base, input-output tables, OECD and Eurostat
1821
3748
19
42
Denmark
33
Finland
41
100
41
Sweden
17
35
48
Germany
Foreign residual return
Domestic residual return
Routine profits
100 100 100
10
abroad. However, this will likely not be enough to com-
pensate for the loss of tax base, as:
1. R&D-intensive industries have high returns and
hence substantial residual returns in the Nordics;
2. tax revenue is disproportionately large in R&D-in-
tensive sectors compared to gross value added
(GVA) in the Nordics;
3. marketing intangibles makes up a large share of en-
terprise value in R&D intensive sectors; and
4. the Nordics are net exporters in the R&D-intensive
industries that are most affected by the proposal
and rely more heavily on intangibles than im-
portant trading partners do.
In sum, this implies that outgoing CIT revenue is not
compensated by incoming CIT revenue, thus yielding a
net loss of CIT revenue for the Nordic countries. Next,
we go through the arguments one by one.
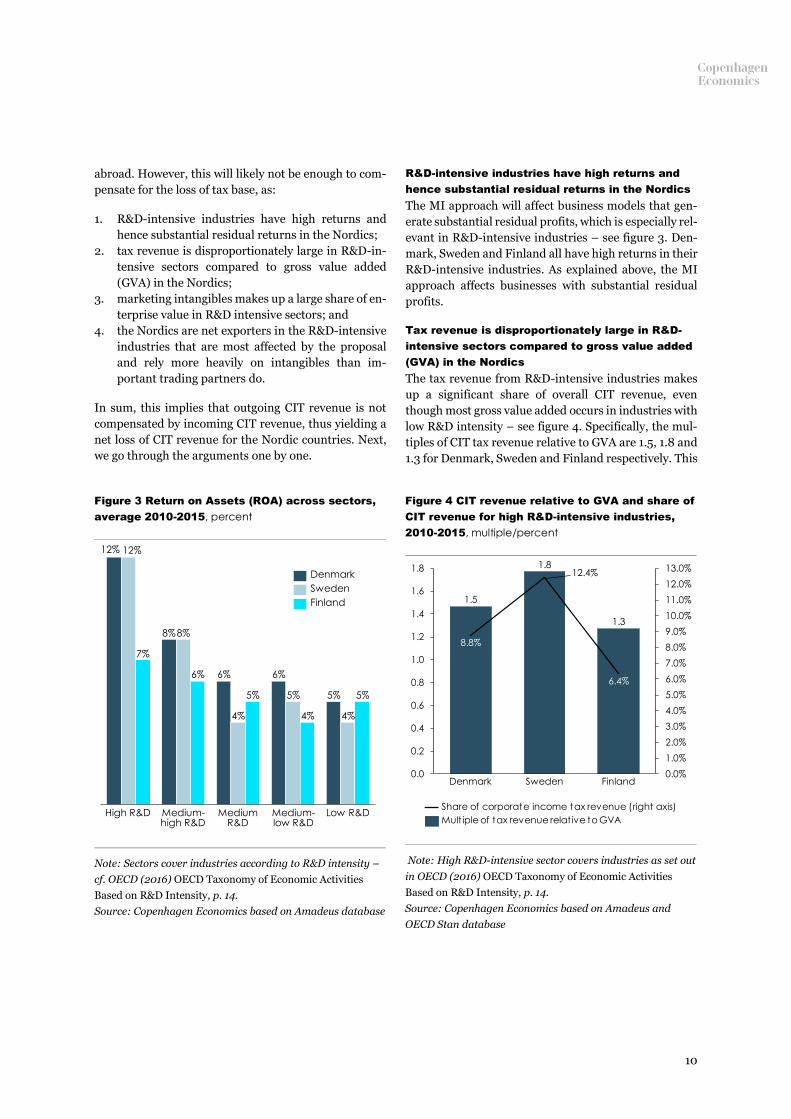
R&D-intensive industries have high returns and
hence substantial residual returns in the Nordics
The MI approach will affect business models that gen-
erate substantial residual profits, which is especially rel-
evant in R&D-intensive industries – see figure 3. Den-
mark, Sweden and Finland all have high returns in their
R&D-intensive industries. As explained above, the MI
approach affects businesses with substantial residual
profits.
Tax revenue is disproportionately large in R&D-
intensive sectors compared to gross value added
(GVA) in the Nordics
The tax revenue from R&D-intensive industries makes
up a significant share of overall CIT revenue, even
though most gross value added occurs in industries with
low R&D intensity – see figure 4. Specifically, the mul-
tiples of CIT tax revenue relative to GVA are 1.5, 1.8 and
1.3 for Denmark, Sweden and Finland respectively. This
Figure 3 Return on Assets (ROA) across sectors,
average 2010-2015, percent
Note: Sectors cover industries according to R&D intensity –
cf. OECD (2016) OECD Taxonomy of Economic Activities
Based on R&D Intensity, p. 14.
Source: Copenhagen Economics based on Amadeus database
Figure 4 CIT revenue relative to GVA and share of
CIT revenue for high R&D-intensive industries,
2010-2015, multiple/percent
Note: High R&D-intensive sector covers industries as set out
in OECD (2016) OECD Taxonomy of Economic Activities
Based on R&D Intensity, p. 14.
Source: Copenhagen Economics based on Amadeus and
OECD Stan database
8%
6% 6%
5%
12%
8%
4%
5%
4%
7%
6%
5%
4%
5%
Medium R&D
Medium-low R&D
High R&D Medium-high R&D
12%
Low R&D
Denmark
Sweden
Finland
1.8
0.0%
0.6
2.0%
8.0%
3.0%
6.0%
7.0%
10.0%
12.0%
11.0%
5.0%
13.0%
0.0
0.4
0.2
4.0%
0.8
1.0
1.2
1.4
9.0%
1.6
1.0%
8.8%
1.5
Denmark
12.4%
Sweden
6.4%
Finland
1.8
1.3
Share of corporate income tax revenue (right axis)
Mult iple of tax revenue relat ive to GVA

11
is equivalent to approximately 9% of Danish CIT reve-
nue, 12% Swedish CIT revenue and 6% of Finish CIT
revenue.
Marketing intangibles make up a large share of
enterprise value in R&D-intensive sectors
In high R&D-intensive industries, marketing intangi-
bles make up on average 40% of enterprise value – see
figure 5. This should be compared to 27-32% in less
R&D-intensive industries. This means, everything else
being equal, that businesses in R&D-intensive indus-
tries are affected to a larger extent by the MI approach.23
Figure 5 Marketing intangibles as a share of en-
terprise value, percent
Note: The definition of marketing intangibles is based on the
IFRS 3 definition of marketing and consumer-related intan-
gibles and equals the sum of the two. Furthermore, the re-
sults should be considered indicative only according to the
authors. The estimates are based on a global sample and
therefore do not account for differences across countries.
Source: Copenhagen Economics based on Brand Finance
GIFT report 2017, pp. 33 & 47
23 This is given the specific definition of marketing intangibles
used in this report.
The Nordics are net exporters in the R&D-
intensive industries the most affected by the
proposal
The key argument for why the Nordics are likely to lose
CIT revenue is that loss of CIT revenue from high R&D-
intensive industries is not compensated one on one by
foreign businesses having to pay more CIT in the Nor-
dics – see figure 6. Broadly speaking, the Nordics are
exporting high R&D-intensive goods and services (re-
sulting in a relatively large loss of their current tax base)
while importing low R&D-intensive goods and services
(that are affected by the MI approach only to a limited
extent).
Figure 6 Average net export in the Nordics as a
share of total output by R&D intensity, percent
Note: Sectors cover industries according to R&D intensity –
cf. OECD (2016) OECD Taxonomy of Economic Activities
Based on R&D Intensity, p. 14, but with specific amendments
– see appendix.
Source: Copenhagen Economics based on input-output ta-
bles
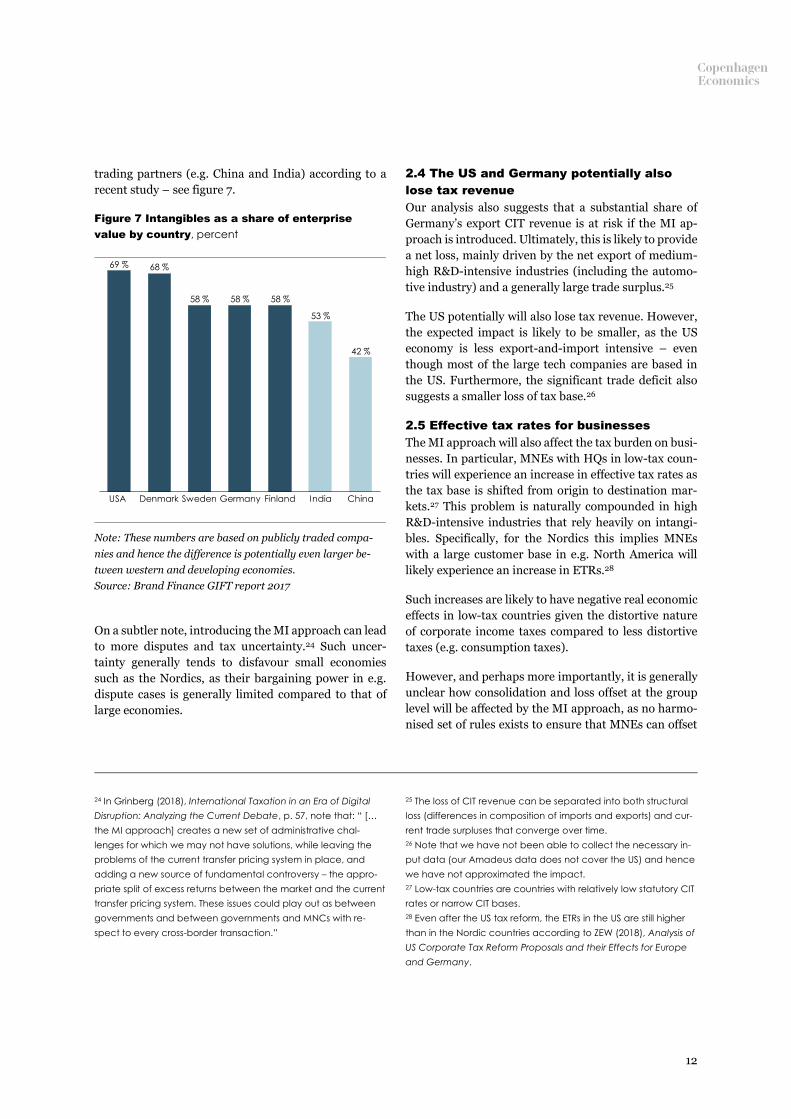
Furthermore, the Nordics, Germany and the US all rely
heavily on intangibles as compared with important
32%
Medium-high R&D
High R&D
Medium R&D
Medium-low R&D
Low R&D
40%
31%
26% 27%
+13pp
High R&D
2.1%
6.4%
Medium-high R&D
Medium R&D
Medium-low R&D
Low R&D
5.7% 5.6%
1.2%
12
trading partners (e.g. China and India) according to a
recent study – see figure 7.
Figure 7 Intangibles as a share of enterprise
value by country, percent
Note: These numbers are based on publicly traded compa-
nies and hence the difference is potentially even larger be-
tween western and developing economies.
Source: Brand Finance GIFT report 2017
On a subtler note, introducing the MI approach can lead
to more disputes and tax uncertainty.24 Such uncer-
tainty generally tends to disfavour small economies
such as the Nordics, as their bargaining power in e.g.
dispute cases is generally limited compared to that of
large economies.
24 In Grinberg (2018), International Taxation in an Era of Digital
Disruption: Analyzing the Current Debate, p. 57, note that: “ […
the MI approach] creates a new set of administrative chal-
lenges for which we may not have solutions, while leaving the
problems of the current transfer pricing system in place, and
adding a new source of fundamental controversy – the appro-
priate split of excess returns between the market and the current
transfer pricing system. These issues could play out as between
governments and between governments and MNCs with re-
spect to every cross-border transaction.”
2.4 The US and Germany potentially also
lose tax revenue
Our analysis also suggests that a substantial share of
Germany’s export CIT revenue is at risk if the MI ap-
proach is introduced. Ultimately, this is likely to provide
a net loss, mainly driven by the net export of medium-
high R&D-intensive industries (including the automo-
tive industry) and a generally large trade surplus.25
The US potentially will also lose tax revenue. However,
the expected impact is likely to be smaller, as the US
economy is less export-and-import intensive – even
though most of the large tech companies are based in
the US. Furthermore, the significant trade deficit also
suggests a smaller loss of tax base.26
2.5 Effective tax rates for businesses
The MI approach will also affect the tax burden on busi-
nesses. In particular, MNEs with HQs in low-tax coun-
tries will experience an increase in effective tax rates as
the tax base is shifted from origin to destination mar-
kets.27 This problem is naturally compounded in high
R&D-intensive industries that rely heavily on intangi-
bles. Specifically, for the Nordics this implies MNEs
with a large customer base in e.g. North America will
likely experience an increase in ETRs.28
Such increases are likely to have negative real economic
effects in low-tax countries given the distortive nature
of corporate income taxes compared to less distortive
taxes (e.g. consumption taxes).
However, and perhaps more importantly, it is generally
unclear how consolidation and loss offset at the group
level will be affected by the MI approach, as no harmo-
nised set of rules exists to ensure that MNEs can offset
25 The loss of CIT revenue can be separated into both structural
loss (differences in composition of imports and exports) and cur-
rent trade surpluses that converge over time.
26 Note that we have not been able to collect the necessary in-
put data (our Amadeus data does not cover the US) and hence
we have not approximated the impact.
27 Low-tax countries are countries with relatively low statutory CIT
rates or narrow CIT bases.
28 Even after the US tax reform, the ETRs in the US are still higher
than in the Nordic countries according to ZEW (2018), Analysis of
US Corporate Tax Reform Proposals and their Effects for Europe
and Germany.
69 %
53 %
42 %
IndiaUSA SwedenDenmark Germany Finland China
68 %
58 % 58 % 58 %

13
cross-border losses. For MNEs that will have a more dif-
fused tax liability under the MI approach, this could po-
tentially be problematic as this type of asymmetry tends
to increase the effective tax burden.
Key learning points from section 2
• While the marketing approach is being dis-
cussed as a proposal to address challenges
in taxing the digital economy, it has a much
larger scope, potentially affecting the ma-
jority of industries.
• A very substantial part of the current corpo-
rate tax base in the Nordics and Germany
will potentially be lost to other countries.
• The Nordic countries are not likely to be
compensated in full by new incoming CIT
revenue.
• Furthermore, larger countries – such as the
US and Germany – are also likely to lose cor-
porate income tax revenue, as they too rely
on R&D-intensive industries for generating
revenue.
• The proposal potentially hurts MNEs as effec-
tive tax rates increase, especially in low-tax
countries.
3 POLICY OPTIONS TO ADDRESS
CHALLENGES GOING FORWARD
In this section, we argue that problems and aims should
be defined before moving to solutions (section 3.1).
Next, some obvious drawbacks of the MI approach are
discussed (section 3.2) and finally we discuss an alter-
native going forwards (section 3.3).
3.1 DEFINE PROBLEMS AND AIMS BEFORE
MOVING TO SOLUTIONS
The global tax policy debate in the context of the OECD
BEPS project was focused initially on addressing trans-
fer pricing policy issues. Key elements have been
changes to transfer pricing guidelines, discussion of
principles for establishing permanent establishments
and strengthening effective regulation of foreign-con-
trolled companies (CFC), as well as policies versus so-
called “tax heavens”. More recently the debate has
moved beyond that, discussing and challenging notions
of where economic value is being created – the user con-
tribution principle.
We would also like to add two further objectives that
should be included in any discussion on the reform of
international tax policy: What is their effect on coun-
tries’ incentive to invest in growth-friendly policies?
And is it likely that proposed policies are de facto based
on meaningful and verifiable criteria not leading to sub-
stantial increases in compliance costs in a wider sense?
So, we suggest that policy reforms should:
• aim to reduce transfer pricing problems, taking into
account already implemented BEPS efforts as well as
national reforms of corporate tax regimes, notably in
the US;
• maintain/increase incentives for growth-friendly pol-
icies at the national level; and
• be based on meaningful, verifiable criteria with man-
ageable compliance costs.
Starting off with transfer pricing issues, we suggest that
the effect of the US tax reform should be fully digested
before new, untested ideas are added to the global cor-
porate tax arena. We make specific reference to key as-
pects of the US tax reform such as a lower rate as well as
the move towards an exemption tax combined with ef-
fective CFC rules that entail an effective minimum tax
rate on US-based companies.
These rules will seriously address a number of issues re-
lated to the taxation of US-based companies. There will
be:
• less risk of profits not being taxed, and
• less risk of tax inversions.
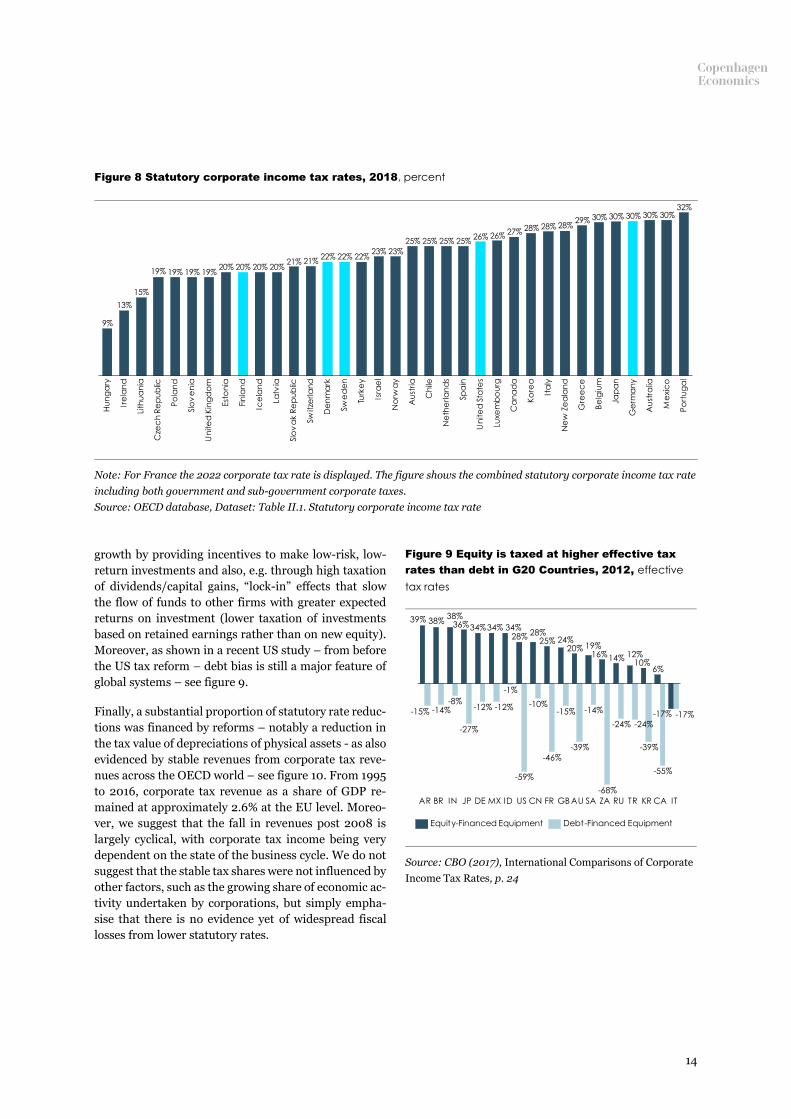
The convergence of global statutory rates will also tend
to reduce transfer pricing issues. The vast majority of
OECD countries now have formal rates in the range of
20 to 25% - see figure 8. Arguably the challenges are
greater for the remaining outliers with high formal rates
to introduce lower rates than to reform the global tax
system (including Germany).
In this context, we would also underline that the reduc-
tion in statutory rates seen over the last decades is not
mainly about a race to the bottom; it is also a response
to the huge debt bias in tax systems. This bias had al-
ready been identified in the early 1980s as impeding
14
growth by providing incentives to make low-risk, low-
return investments and also, e.g. through high taxation
of dividends/capital gains, “lock-in” effects that slow
the flow of funds to other firms with greater expected
returns on investment (lower taxation of investments
based on retained earnings rather than on new equity).
Moreover, as shown in a recent US study – from before
the US tax reform – debt bias is still a major feature of
global systems – see figure 9.
Finally, a substantial proportion of statutory rate reduc-
tions was financed by reforms – notably a reduction in
the tax value of depreciations of physical assets - as also
evidenced by stable revenues from corporate tax reve-
nues across the OECD world – see figure 10. From 1995
to 2016, corporate tax revenue as a share of GDP re-
mained at approximately 2.6% at the EU level. Moreo-
ver, we suggest that the fall in revenues post 2008 is
largely cyclical, with corporate tax income being very
dependent on the state of the business cycle. We do not
suggest that the stable tax shares were not influenced by
other factors, such as the growing share of economic ac-
tivity undertaken by corporations, but simply empha-
sise that there is no evidence yet of widespread fiscal
losses from lower statutory rates.
Figure 8 Statutory corporate income tax rates, 2018, percent
Note: For France the 2022 corporate tax rate is displayed. The figure shows the combined statutory corporate income tax rate
including both government and sub-government corporate taxes.
Source: OECD database, Dataset: Table II.1. Statutory corporate income tax rate
Figure 9 Equity is taxed at higher effective tax
rates than debt in G20 Countries, 2012, effective
tax rates
Source: CBO (2017), International Comparisons of Corporate
Income Tax Rates, p. 24
19% 19% 19%20% 20% 20% 20%
21% 21%22% 22% 22%
23% 23%
25% 25% 25% 25%26% 26%
27% 28% 28% 28%29% 30% 30% 30% 30% 30%
32%
Est
on
ia
Ire
lan
d
Po
lan
d
15%
Swe
de
n
Lith
ua
nia
13%
Slo
ve
nia
Po
rtu
ga
l
Gre
ec
e
Hu
ng
ary
Ko
rea
Cze
ch
Re
pu
blic
Ch
ile
Un
ite
d K
ing
do
m
Fin
lan
d
Ice
lan
d
Latv
ia
Slo
va
k R
ep
ub
lic
Au
stra
lia
Switze
rla
nd
De
nm
ark
Turk
ey
Luxe
mb
ou
rg
Isra
el
Au
stria
Be
lgiu
m
Ne
the
rla
nd
s
Spa
in
Un
ite
d S
tate
s
Ca
na
da
Ita
ly
Ne
w Z
ea
lan
d
Jap
an
19%
Ge
rma
ny
Me
xic
o
9%
No
rwa
y
38%36%34%34% 34%
28% 28%25% 24%
20% 19%16%14% 12%
10%6%
-15% -14%-8%
-27%
-12% -12%
-1%
-59%
-10%
-46%
-15%
-39%
-14%
-68%
-24%
-39%
-55%
-17%
AR BR RUDE TRIN MXJP ID US CN ZAFR GB AU SA KR CA IT
39%
-17%
-24%
38%
Equity-Financed Equipment Debt-Financed Equipment

15
Figure 10 Corporate tax revenue in the EU, 1995-
2016, percent of GDP
Source: European Commission
3.2 The marketing intangibles approach has
three obvious drawbacks
Reducing national incentives to support innovation.
The residual profits concept will to a very large extent
ship the profit from countries with high-risk, high-re-
turn industries to countries with low R&D intensity, as
discussed in section 2.
This will reduce countries’ incentive to implement inno-
vation-friendly policies. The basic driver is that getting
firms to deliver high returns requires significant public
investments. This obviously includes investment in
public R&D and complementary policies. These policies
are already partly enjoyed by other countries through
cross-border spillover effects, but now fiscal gains from
the successful innovation projects resulting from such
measures will also need to be shared with other coun-
tries.
Such effects are compounded in particular for the high
knowledge-based industry due to the “hockey stick” na-
ture of returns from such industries – see figure 11.
Around two thirds of all early-stage venture capital (VC)
investments generate a loss and only one third of the in-
vestments eventually generate a positive return. This
hockey stick nature implies that most venture busi-
nesses never generate any corporate tax revenue. Stated
differently, most VC-backed investments lead to nega-
tive returns, which likely leads to a concentration of fis-
cal losses in host countries as these firms never become
international. However, for the few businesses that
make it and become global players, the MI approach im-
plies that more of the tax revenue is shared globally.
Figure 11 Distribution of returns of early-stage
venture in the US, 2004-2013, return multiple
Note: The return multiple measured as TVPI is the total
value of the funds’ cumulative distributions compared to
paid-in capital.
Source: Industry Ventures (2017)
So, in essence, the residual profits scheme is very much
an asymmetric system: the fiscal spoils from successful
high-risk entrepreneurial projects are shared globally
while the costs of failures are borne by the host coun-
tries.
Key parameters have no solid empirical foundation.
Both routine and residual profits must be defined if the
MI approach is implemented. The problem is that there
is no clear definition of what constitutes a routine or
0.5
1.0
201520101995
0.0
2.5
3.5
2.0
1.5
3.0
2000 2005
2.6%
2.6%
100%0% 25% 50% 75%
0.4%
64.8%
50x+
1.1%20-50x
2.5%10-20x
5.9%5-10x
25.3%1-5x
0-1x

16
“normal” return, especially for taxation purposes.29 De-
fining such returns will run into practical problems, in-
cluding uncertainty, information asymmetry and heter-
ogeneity. There is simply no one-size-fits-all routine re-
turn.
Governments simply cannot observe businesses’ re-
quired or actual returns. In practice, policymakers
therefore have to set some (arbitrary) level that poten-
tially deviates substantially from the returns that busi-
nesses require in order to commit their capital. This can
potentially have negative economic consequences, such
as a decline in investment and, ultimately, lower tax rev-
enue.30
In addition, it is unclear how to value marketing relative
to other intangibles. One argument could be that no
value can be created without customers, suggesting that
all value across all sectors is driven by marketing intan-
gibles. On the other hand, one could argue that any pos-
itive image in the minds of customers comes down to
businesses providing superior services or goods. This
would suggest that very limited value should be as-
signed to marketing intangibles.
In practice, the division of marketing and other intangi-
ble will have to be accomplished in the absence of mean-
ingful yardsticks based on sound economics.31
High compliance costs and requirement for unrealistic
levels of international co-operation. The MI approach
creates new administrative challenges for which no ob-
vious solutions exist, while at the same time keeping in
place the challenges of the current transfer pricing re-
gime. This could potentially add new sources of funda-
mental controversy between governments.32 Ultimately,
it requires unrealistic levels of international co-opera-
tion.
29 See OECD (2016), Distinguishing between normal and excess
returns in tax policy.
30 OECD (2016), Distinguishing between normal and excess re-
turns in tax policy, p. 28.
31 Grinberg (2018), International Taxation in an Era of Digital Dis-
ruption, p. 54, states: “That said, if policymakers consider the
compromise that is the [MI approach], they should abandon the
notion of measuring the relative value of marketing and non-
marketing intangibles and accept a simple formulary split be-
tween the two residual return categories. It seems to me that in
For businesses, as well as for tax administrations, the
additional compliance burden is potentially high. If con-
sumers are perceived to generate value, many busi-
nesses will have to comply with tax legislation in multi-
ple countries – even if they are based almost solely in
one country and currently have no transfer pricing is-
sues (having a tax liability in only one country). Such
challenges should be analysed in detail before moving
ahead.
3.3 A minimum taxation regime: targeted
and realistic
A minimum taxation regime could, in principle, take
many forms. One prominent example is a minimum tax
solution that denies deduction on outbound payments if
a certain effective tax rate (ETR) threshold of the payee
is not met.
This is generally in line with the BEPS efforts to limit
base erosion and create a level playing field. It also
seems consistent with the GILTI and BEAT introduced
in the US tax reform, which are attempts to have out-
bound and inbound minimum taxes. In principle, these
could be reimagined to suggest a workable alternative
for the medium-term future of the international tax sys-
tem.33
Depending on how ambitious they are, most OECD
countries already have a high degree of convergence in
CIT rates, as documented in figure 8, providing a solid
foundation for the discussions going forwards.
Even more importantly from a policy-efficiency per-
spective, a minimum taxation regime would stop indus-
try-specific distortions. Especially within the EU, the
differences in effective taxation are really driven by in-
dustry-specific regimes, e.g. the IP box regime in
France.34
a [MI] system, a formulary approach, ideally backstopped by
mandatory binding arbitration, is the only way to control the ex-
tent of tax controversy.”
32 See Grinberg (2018), International Taxation in an Era of Digital
Disruption, p. 54.
33 As suggested by Grinberg (2018) in International Taxation in an
Era of Digital Disruption, p. 45.
34 See e.g. Copenhagen Economics (2018), The proposed EU
digital services tax: Effects on welfare, growth and revenues.
17
Finally, while making a minimum tax regime work is not
necessarily a walk in the park, it appears to be infinitely
more manageable and meaningful than the other alter-
natives on the table.35 Any attempts to ring-fence digital
sectors are inherently meaningless, as documented in a
wealth of studies, while also lacking a real rationale.36
The residual profit concept linked to the marketing in-
tangibles approach avoids the ring-fencing but, as doc-
umented, raises a number of other questions.
So, in our opinion, if the aim is to review further reforms
of the global tax system that promote innovation and
protect the tax base of individual countries – and that
go beyond the already implemented BEPS process and
national tax reforms – then a well-designed global min-
imum tax regime is the proposal that has the most to
offer and merits further study.
Key learning points from section 3
• The challenges should be better understood
and clearly defined before solutions are
considered.
• The marketing intangibles approach has
three obvious drawbacks: it reduces na-
tional incentives to support innovation, key
parameters have no solid empirical founda-
tion, and high compliance costs require un-
realistic levels of international co-operation.
• A minimum taxation regime seems more tar-
geted and realistic.
35 A minimum taxation regime could trigger a need to identify
the beneficial owner, which could prove complicated.
36 This is documented most clearly in OECD (2015), Addressing
the Tax Challenges of the Digital Economy, Action 1 - 2015 Final
Report.
18
References
Andrus and Oosterhuis (2017), Transfer Pricing After
BEPS: Where Are We and Where Should We Be Going
Boulogne (2018), Transfer Pricing of Intangibles: A
Comparison between the Netherlands and the United
States
Brand Finance (2017), GIFT report
Brown et al. (2016), Stock markets, credit markets and
technology-led growth
CBO (2017), International comparisons of corporate
income tax rates
CBO (2018), How taxes affect the incentive to invest in
new intangible assets
Chen (2016), Cross-Country Income Differences Revis-
ited: Accounting for the Role of Intangible Capital
Copenhagen Economics (2018), The proposed EU digi-
tal services tax: Effects on welfare, growth and reve-
nues
Cronin et al. (2012), Distributing the Corporate Income
Tax: Revised U.S. Treasury Methodology
Crouzet and Eberly (2018), Understanding weak capi-
tal investment: the role of market concentration and
intangibles
Gentry and Hubbard (1996), Distributional Implica-
tions of Introducing a Broad-Based Consumption Tax
Grinberg (2018), International Taxation in an Era of
Digital Disruption
Industry Ventures (2017), The Venture Capital Risk
and Return Matrix. See http://www.industryventu-
res.com/2017/02/07/the-venture-capital-risk-and-re-
turn-matrix/
Keightley (2014), The Corporate Income Tax System:
Overview and Options for Reform
OECD (2015), Addressing the Tax Challenges of the
Digital Economy, Action 1 – 2015 Final Report
OECD (2015), Aligning Transfer Pricing Outcomes
with Value Creation
OECD (2015), Designing Effective Controlled Foreign
Company Rules – Action 3
OECD (2016), Fiscal incentives for R&D and innova-
tion in a diverse world
OECD (2016), Distinguishing between normal and ex-
cess returns in tax policy
OECD (2018), OECD taxonomy of economic activities
based on R&D intensity
OECD (2018), Tax Challenges Arising from Digitalisa-
tion – Interim Report 2018
OECD (2018), Loss carryover provisions: Measuring
effects on tax symmetry and automatic stabilisation
OECD (2018), Statutory tax rates on dividends, inter-
est and capital gains: The debt equity bias at the per-
sonal level
OECD (2018), Corporate Effective Tax Rates: Model
Description and Results from 36 OECD and Non-OECD
Countries
OECD (2019), Addressing the Tax Challenges of the
Digitalisation of the Economy – Policy Note
Phillipson (2018), A primer on concentration, invest-
ment and growth
Ramey (2018), Increasing differences between firms
remarks on Reenen paper
Toder and Rueben (2005), Should We Eliminate Taxa-
tion of Capital Income?
van Reenen (2018), Increasing differences between
firms’ market power and the macro economy
World Bank (2017), “Topical Issue: Arms-length trade”
in Global Economic Prospects, June 2017
ZEW (2016), Effective tax levels using the Griffith Dev-
ereux methodology
ZEW (2018), Analysis of US Corporate Tax Reform
Proposals and their Effects for Europe and Germany

19
Appendix: Data & Methodology
This annex describes the methodological approach used
in this report.
Industry classification
In the report, we use an industry classification system
for R&D intensity defined by the OECD.37 Here the in-
dustries are clustered into the following five segments
based on R&D expenditures relative to the industry
value added:
1. High R&D intensity
2. Medium-high R&D intensity
3. Medium R&D intensity
4. Medium-low R&D intensity
5. Low R&D intensity
The OECD draws on the fourth revision of the Interna-
tional Standard Industrial Classification (ISIC), an in-
ternational reference classification of productive activi-
ties, which is compatible with other widely used classi-
fications such as the European Classification of Eco-
nomic Activities (NACE).
Assets by sector from STAN
To obtain data on gross value added (GVA) on an indus-
try level, we used the OECD Structural Analysis (STAN)
database. As mentioned above, the observations are
based on ISIC Rev. 4 on a two-digit level and are cate-
gorised by the five R&D segments.
The data used in our analysis are 2010-2015 averages
measured in local currency. Please note that small in-
consistencies potentially exist between the STAN data
and the Amadeus data described below due to the struc-
ture of the data.
Import and export shares from input-output
tables
The data are from 2014 (the newest available). The in-
put-output tables use the two-digit sector level, whereas
OECD (2016), OECD Taxonomy of Economic Activities
Based on R&D Intensity allows for classification at the
three-digit level. We have made the following assump-
tions regarding the classification. C25 is classified as
37 Galindo-Rueda, F. and F. Verger (2016), “OECD Taxonomy of
Economic Activities Based on R&D Intensity”, OECD Science,
Technology and Industry Working Papers, 2016/04, OECD Publish-
ing, Paris
medium-low, but C252 is medium-high. C30 is classi-
fied as high; however only C303 is high, whereas C302-
305 is medium-high and C301 is medium. C31-C32 is
classified as medium, though C325 is medium-high and
C31 is medium-low. J58 is classified as high; however
only J582 is high, and J581 is medium-low.
Tax base and return on assets by sector
from Amadeus database
Data on total assets, the tax base and tax revenue for
each R&D group are taken from the Amadeus database.
These data are classified using the NACE Rev. 2 specifi-
cations, and hence we have linked the NACE Rev. 2
specifications with the ISIC Rev. 4 specifications using
the EUROSTAT RAMON conversion tables and hereby
aggregated data on each of the R&D groups.38
The data used in the analysis are 2010-2015 averages
(2011-2015 for Denmark) and values are reported in
thousands of euros.
Methodology for approximating how much
current CIT revenue is potentially lost
The approximation is based on a six-step procedure:
1. For each firm and for each year we calculated the
return on assets for the period 2010-2015 based on
micro data from the Amadeus database.
2. To provide an estimate for 2017 we updated the re-
turns on assets by the real development in the CIT
tax base based on Eurostat and OECD data, implic-
itly assuming that the additional return in 2017 is
evenly split between all companies. Note that 2016
CIT revenue is used for Germany due to missing
data. Note also that this correction affects the re-
sults only to a limited extent.
3. For given assumptions about the “normal” return
on assets we calculated the yearly residual return
for each firm. Specifically, we applied a 4% normal
return.
4. We then calculated the average residual and routine
return for each R&D intensity.
5. Export shares of total output for each R&D intensity
were estimated on the basis of input-output ta-
bles.39
38 The aggregated micro data generally show high consistency
with aggregate statistics from Eurostat.
39 We acknowledge that import and export data are an imper-
fect proxy for MNEs’ global structures.
20
6. We then combined the information on routine and
residual returns, export shares and the share of the
CIT tax base for each R&D intensity to calculate the
approximate residual profits attributable to routine
and to domestic and foreign residual returns for
each country.
These estimates are considered conservative for two
main reasons:
• We also used average export shares for each R&D in-
tensity. However, it very likely that high return busi-
nesses have larger export shares than the average
business – i.e. “winning” business models are more
often taken global.
• Using total assets most likely captures too broad an
asset base compared to what is attributable to routine
functions. This, ceteris paribus, suggests that we un-
derestimated the residual returns and ultimately the
share of returns linked to foreign sales.

21
Contact for this study:
Sigurd Næss-Schmidt, Partner & Director of Econom-
ics
Tel: +45 5076 3030
About Copenhagen Economics
Copenhagen Economics is the leading economic consultancy in the Nordic region. Our econ-
omists provide advice and analyses in the fields of competition, regulation, international trade
and impact assessment.
We solve complex problems for clients in the areas of
We provide hard facts and clear stories, enabling our clients and their stakeholders to make
superior decisions based on sound analysis.
We advise companies, authorities and policy makers when markets meet regulations and con-
flicts arise. We help our private sector clients handle conflict cases and guide them on how to
prosper through regulatory management. We help our public sector clients evaluate and de-
vise new regulations.
Founded in 2000, the firm is based in offices in Brussels, Copenhagen, Helsinki and Stockholm
and
• is partner-owned
• counts more than 70 employees, most having a PhD or MSc in Economics
• includes economists of various nationalities and with different languages: Danish,
Dutch, English, Finnish, French, German, Hungarian, Italian, Lithuanian, Norwegian, Por-
tuguese, Spanish and Swedish, and
• operates across the world.
Global Competition Review (CGR) lists Copenhagen Economics as one of the top 20
economic consultancies in the world.
www.copenhageneconomics.com


![# Abrahao grinberg & bertha grinberg - a arte de envelhecer com sabedoria - [ espiritismo]](https://img.pdfslide.net/doc/110x75/55c882d3bb61eb1e4f8b4622/-abrahao-grinberg-bertha-grinberg-a-arte-de-envelhecer-com-sabedoria--55c886d31d964.jpg)


![[Grinberg tatyana y_eduardovna]_politicheskie_tehno(book_zz.org)](https://img.pdfslide.net/doc/110x75/58f137981a28ab77498b4591/grinberg-tatyana-yeduardovnapoliticheskietehnobookzzorg.jpg)