Embed Size (px)
Citation preview
HAL Id: jpa-00210699https://hal.archives-ouvertes.fr/jpa-00210699
Submitted on 1 Jan 1988
HAL is a multi-disciplinary open accessarchive for the deposit and dissemination of sci-entific research documents, whether they are pub-lished or not. The documents may come fromteaching and research institutions in France orabroad, or from public or private research centers.
L’archive ouverte pluridisciplinaire HAL, estdestinée au dépôt et à la diffusion de documentsscientifiques de niveau recherche, publiés ou non,émanant des établissements d’enseignement et derecherche français ou étrangers, des laboratoirespublics ou privés.
Gelation of aqueous gelatin solutions. I. Structuralinvestigation
Madeleine Djabourov, Jacques Leblond, Pierre Papon
To cite this version:Madeleine Djabourov, Jacques Leblond, Pierre Papon. Gelation of aqueous gelatin so-lutions. I. Structural investigation. Journal de Physique, 1988, 49 (2), pp.319-332.�10.1051/jphys:01988004902031900�. �jpa-00210699�
319
Gelation of aqueous gelatin solutions. I. Structural investigation
Madeleine Djabourov, Jacques Leblond and Pierre Papon
Laboratoire de Physique Thermique (*), ESPCI, 10, rue Vauquelin, 75231 Paris Cedex 05, France
(Requ le 25 juin 1987, accepte le 23 octobre 1987)
Résumé. - Nous avons étudié les modifications structurales des solutions de gélatine pour différentstraitements thermiques et différentes concentrations. La structure est explorée à plusieurs échelles
microscopiques, comprenant la transformation conformationnelle pelote ~ hélice des chaînes protéiques (parpolarimétrie) et l’organisation supramoléculaire du réseau (par microscopie électronique). Le rôle du solvantdans le processus de gélification est révélé à l’aide de la résonance magnétique nucléaire du proton. Le non-équilibre de la phase gel est clairement mis en évidence, ainsi que son désordre topologique. Nous proposonsune analyse phénoménologique de la cinétique de croissance des hélices, suivie d’une tentative de modélisationdes mécanismes microscopiques s’appuyant sur les données connues.
Abstract. 2014 We have investigated the structural modifications of aqueous gelatin solutions for various thermaltreatments and different concentrations. The structure is explored at different microscopic levels, putting intoevidence the conformational coil ~ helix transition of the proteic chains (by optical rotation), the
supramolecular structure of the network (by electron microscopy) and the role of solvent (by proton nuclearmagnetic resonance). The non-equilibrium nature of the gel phase is demonstrated as well as its disorderedcharacter. A phenomenological analysis of the kinetics of helix formation is proposed, followed by an attemptfor a microscopic modelling of the mechanisms, based on the data presently known.
J. Phys. France 49 (1988) 319-332 FÉVRIER 1988,
Classification
Physics Abstracts82.70 - 07.60F - 61.40
The gelation of aqueous gelatin solutions is a
process which has been widely investigated in thepast because of its important applications [1, 2].
In the last decade, the subject has regained a newstimulation arising both from the modern ideas onthe gelation phenomenon, derived from the modelsof percolation and the scaling concepts - and fromrefined experimental facilities.
Starting with low concentrations, half a percent,and rising up to 50 %, the gelatin + water solutionsform homogeneous systems which gel by loweringthe temperature below 30 °C, say roughly at roomtemperature.
Gelatin is a biopolymer : it is a protein : it is
denaturated collagen.Due to the remarkable mechanical properties of
the gels and to the natural biological origin of
gelatin, the gels have been used for long in phar-macology, food, cosmetic applications, but also inquite different fields, such as photography, glues,composite materials.
(*) Unite associee au Centre National de la RechercheScientifique UA 836.
Understanding the gelation process of this biom-aterial is a quite delicate problem. Many factors areknown to affect the properties of the gels : the ionicforce, the pH of the solution, the molecular weight,the concentration, the origin of collagen itself...
However, for all the systems, the gelation mechan-ism in basically related to the change of only onethermodynamical parameter: temperature.
Clearly, gelation is a thermal effect. The gels arethermoreversible.
This work is mainly concerned with the influenceof temperature on the structural and rheologicalparameters of the gelling solutions. Our aim is toelucidate the mechanisms of gelation in moderatelyconcentrated solutions (c - a few percent), to
determine the most relevant structural parameters ofthe network and to relate them to the rheologicalmeasurements.
The phenomenological behaviour of the process isinvestigated.From a more general point of view, gelation for
gelatin gels is a physical process : whether it can beanalysed within the same theoretical framework as
Article published online by EDP Sciences and available at http://dx.doi.org/10.1051/jphys:01988004902031900
320
chemical gelation - i.e. using scaling laws - is anopen question. We have tried also to answer to thisquestion taking gelatin as an example.We shall deal with the subject in two parts : the
first one - this paper - is devoted to the structural
investigation and to the microscopic mechanismswhich are involved ; in the second part, we examinethe rheological modifications during gelation, inrelation with a critical phenomenon.We start by recalling the main results on collagen
and gelatin, at a molecular level, which are neededfor explaining the mechanism of gelation. Then wepresent our experimental investigation, using mainlyoptical rotation methods and some proton nuclearmagnetic resonance measurements. Observations ofthe gel network structure obtained by electron
microscopy are also reported.The interpretation of the data contains first a
phenomenological analysis of the kinetics of structur-al changes (helix growth), followed by a microscopicmodel which can explain the overall process.
Collagen and gelatin.As we said, gelatin is denatured collagen. Collagenis the major component of skin, tendons, bones,etc...
The chemical composition of collagen varies withits origin. There are as many as twenty differentamino-acids which enter the composition of collagenin variable proportions. However, for this proteinsequences of -(Gly-X-Pro)- or -(Gly-X-Hypro)- areoften repeated. As a general rule every three residueis Gly. As a typical composition, one can think of33 % Gly, 21 % Pro + Hypro, 10 % Ala, and the rest(36 %) being composed of many other X amino-acids in small proportions. Gly is the smallest amino-acid as its lateral group is only one hydrogen atom,while Pro and Hypro, with rigid lateral pyrrolidinerings have important sterical hindrances. It has beenestablished by Ramachandran [1] that the molecularcomposition of the protein, and mainly the distribu-tion of Gly along the chain is responsible for theconformation of the protein in the native state.
Indeed, the collagen unit is a rod of 300 nm length,made of three strands, each having a molecularweight of 100 000. Each strand is twisted into a left-handed helix of about 0.9 nm pitch and all three arewrapped into a super-right-handed helix with a pitchof approximately 8.6 nm (roughly ten times longerthan the left-handed helix). The presence of Gly isrequired to allow the three polypeptide chains tocome closely together, while the Pro and Hyproresidues enhance rigidity. The latter also contributesto stabilize the structure by additional hydrogenbonds [3]. The gradual right handed twist of theindividual strands allows the side groups of amino-
acids, of variable sizes, to come into the structure.Thus the triple helix structure, with nearly the same
parameters, is observed in synthetic poly-tripeptides[4] of variable lengths like the -(Gly-Pro-Pro)n or-(Gly-Pro-Hypro)n-.The poly-proline polypeptides in aqueous solu-
tions adopt the poly-L-proline II conformation,which is a single left-handed helix almost identical tothe collagen left-handed helix, while the poly-glycinepolypeptides form insoluble crystals made of left-handed helices (poly-glycine II) aligned parallel toeach other.
Collagen obviously achieves a compromise be-tween these two structures, which is due to itsmolecular composition and to the requirements of itshydrogen-bond stabilization. So, the collagen triplehelix is stabilized by interchain hydrogen bondswhich are perpendicular to the chain axes. The
hydrogen bonds can be of several types: either
directly between CO and NH groups belonging totwo adjacent backbones, or via water molecules
bridging between two CO groups or between COand NH groups. The type and the number of
hydrogen bonds per helix turn is still debated [5].Additional covalent crosslinks bind the chains
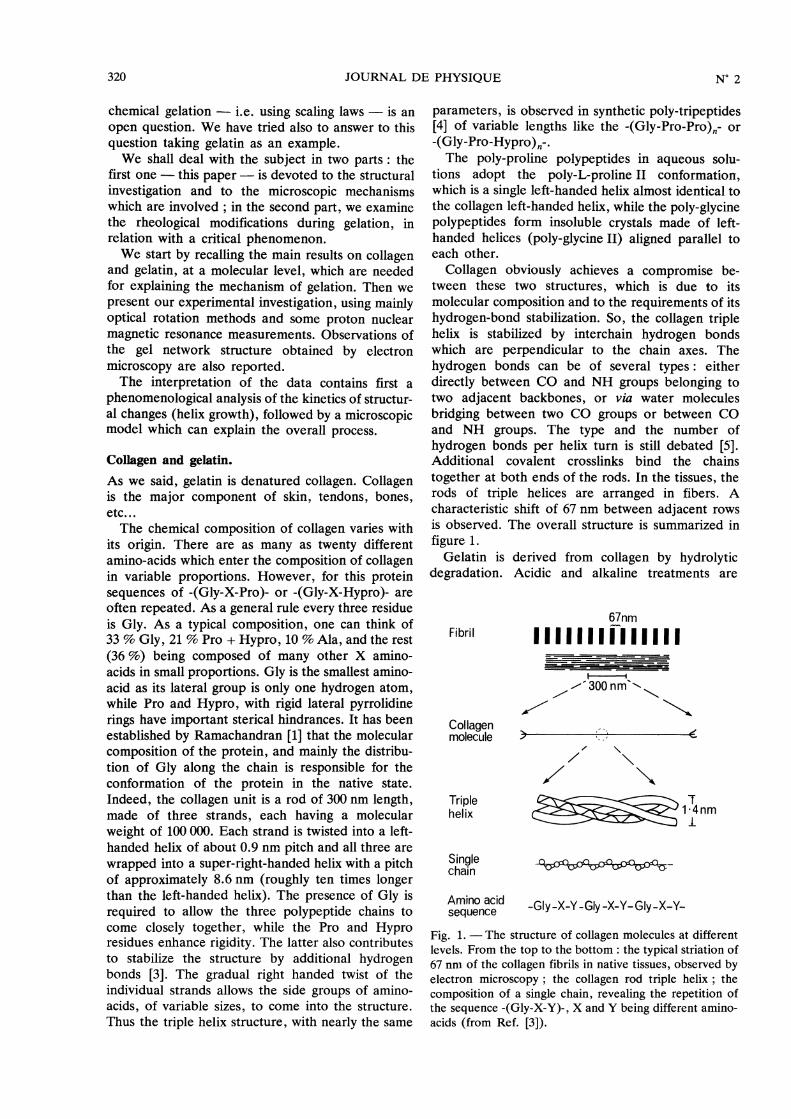
together at both ends of the rods. In the tissues, therods of triple helices are arranged in fibers. Acharacteristic shift of 67 nm between adjacent rowsis observed. The overall structure is summarized in
figure 1.Gelatin is derived from collagen by hydrolytic
degradation. Acidic and alkaline treatments are
Fig. 1. - The structure of collagen molecules at differentlevels. From the top to the bottom : the typical striation of67 nm of the collagen fibrils in native tissues, observed byelectron microscopy ; the collagen rod triple helix ; thecomposition of a single chain, revealing the repetition ofthe sequence -(Gly-X-Y)-, X and Y being different amino-acids (from Ref. [3]).
321
used in industrial processes [2]. The chemical treat-ment mainly breaks crosslinks between strands, butalso may hydrolyse the strands into fragments. Thusa broad molecular weight distribution is obtained forgelatin.
In some cases, it is possible to extract the collagenrod without denaturing it [2]. Then it can bedissolved in acidic aqueous solutions. When thelatter are heated, a helix - coil transition is observedfor the protein around 36 °C.How do the gelatin gels form ?Gelatin is easily dissolved in water by heating the
solutions at about 40 to 50 °C.Then the gelatin chains are believed to be in the
coil conformation [6]. When solutions are cooledbelow 30 °C a reverse coil ->+ helix transition takes
place which can be detected by important modifi-cations of the optical rotation, mainly due to the left-handed helix conformation. As we said, helices haveto be stabilized by hydrogen bonds which are
perpendicular to their axes. Thus, at very lowconcentrations c- 10- 4 to 10- 3 w/w intramolecularhydrogen bonds are formed preferentially by a backrefolding of the single chains [7]. At higher concen-trations, c > 1 % w/w, the helix growth induceschain association and three-dimensional networkformation. Basically, two different models of chainassociation have been proposed :- a conformational coil -> helix transition by
local association of three different chains (inter-molecular bonds) along short helical sequences [7] ;- a crystallization mechanism leading to fiber
growth, similar to the fringed micelle model of
synthetic polymers crystallization. The diameter ofthe fibers would depend on temperature and concen-tration [8].We shall refer to these models further on in this
paper.The basic ideas concerning the molecular charac-
teristics and the structure of collagen, as well as themechanisms of gelation, being now introduced wecan proceed with the experimental details of gelpreparation and with the description of our investi-gations.
Sample characterization and gel preparation.
Our gelatin samples come from lime processeddemineralized ossein, kindly provided by SocieteRousselot (Isle-sur-Sorgue). The molecular charac-terization and purity analysis has been publishedpreviously [9]. The polydispersity is given byMW , ,2013 = 2.6. The molecular weight distribution is wellMncentred around M, = 100 000. Although the polydis-persity is important it represents one of a high gradegelatin sample (photographic grade).
The sample preparation has also been describedelsewhere [9].The solvent is an aqueous solution 0.1 M NaCl.
The pH was adjusted to 7 to avoid the isoelectricpoint (pH = 5).The presence of NaCl fixes the ionic force of the
solution and screens out the electrostatic interactionsbetween the charged groups of the protein chains. Asmall amount of sodium azide is also added ; it
prevents from bacterial contamination.
Experimental methods.
We use optical rotation measurements as a powerfulmethod of detecting the conformational changes ofthe gelatin chains in solution. The optical rotationangle a is automatically measured with a PerkinElmer 241 MC Polarimeter working at wavelengths303 A 579 nm, with a precision of ± 0.001°. Thecells have an optical path of 0.1 dm and a volume of0.1 or 0.5 ml. Their temperature is controlled by anexternal bath circulating into the jacketed cells andmeasured with a thermocouple inserted into the cell,with an accuracy of ± 0.1 °C.The proton NMR results, briefly recalled in this
paper are obtained by using a Varian wide line
spectrometer operating at 7.5 MHz and a pulsedBRUKER SXP-4-60 spectrometer operating at 15and 40 MHz.The sample preparation for electron microscopy
observation is outlined in section 3.
1. Optical rotation of collagen solutions and gelatingels.
1.1 THE METHOD. - In the ultraviolet or the visible
range, protein solutions exhibit optical rotationeffects which are due to electronic transitions involv-
ing delocalized 7r electrons of the peptide bond or ofsome lateral groups [10]. If the protein undergoes acoil -> helix transition, specific interactions betweenthe peptide units appear, modifying the nature of theelectronic transitions. The optical rotatory dispersiongenerally provides valuable information about poss-ible conformations of the chains. Both the opticalrotatory dispersion of native collagen in dilutesolutions and of gelatin are known [11].
Native collagen exhibits a strong negative Cottoneffect corresponding to an absorption band centredaround
A similar behaviour is observed for poly-L-pro-line II solutions, meaning that the measurement is
mainly sensitive to left-handed conformation of thesingle chains. The triple helix association gives amarginal distorsion to the chains which seems tohave little effect on the optical rotatory dispersion[12].
322
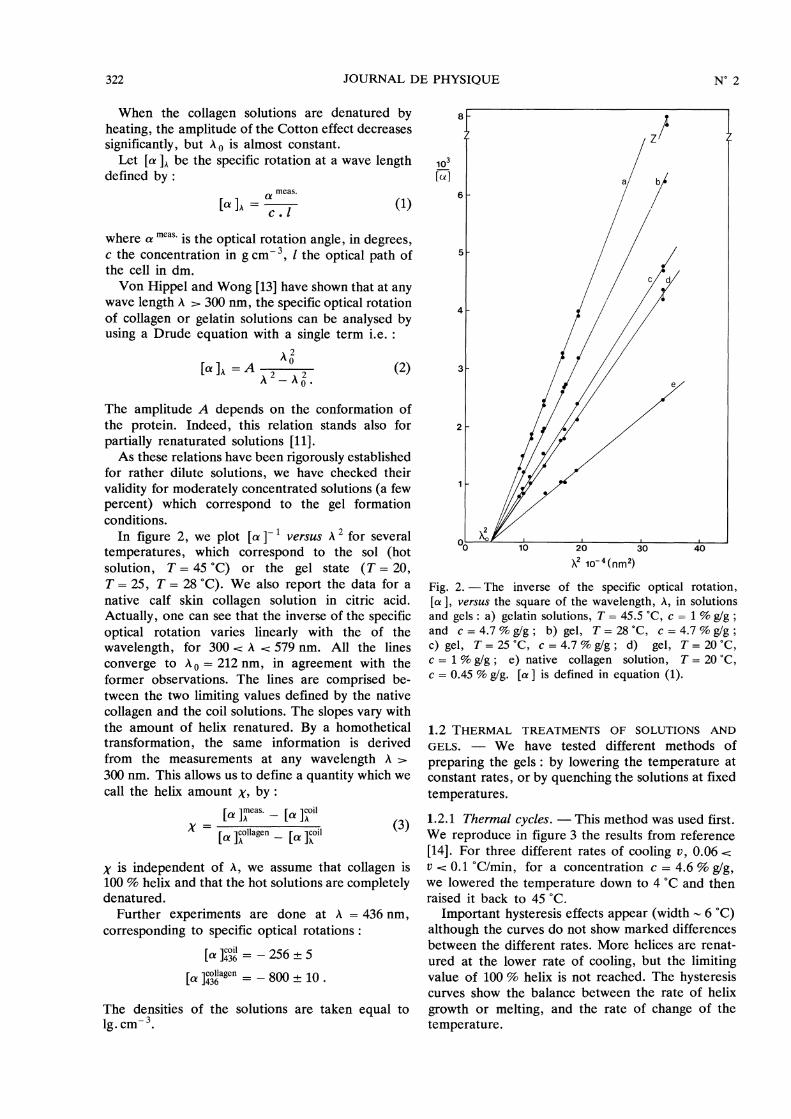
When the collagen solutions are denatured byheating, the amplitude of the Cotton effect decreasessignificantly, but A o is almost constant.
Let [a ]A be the specific rotation at a wave lengthdefined by :
where « meas. is the optical rotation angle, in degrees,c the concentration in g cm- 3, I the optical path ofthe cell in dm.Von Hippel and Wong [13] have shown that at any
wave length A > 300 nm, the specific optical rotationof collagen or gelatin solutions can be analysed byusing a Drude equation with a single term i.e. :
The amplitude A depends on the conformation ofthe protein. Indeed, this relation stands also for
partially renaturated solutions [11].As these relations have been rigorously established
for rather dilute solutions, we have checked theirvalidity for moderately concentrated solutions (a fewpercent) which correspond to the gel formationconditions.
In figure 2, we plot [a ]-1 1 versus À 2 for severaltemperatures, which correspond to the sol (hotsolution, T = 45 °C) or the gel state (T = 20,T = 25, T = 28 °C). We also report the data for anative calf skin collagen solution in citric acid.
Actually, one can see that the inverse of the specificoptical rotation varies linearly with the of the
wavelength, for 300 A 579 nm. All the lines
converge to A o = 212 nm, in agreement with theformer observations. The lines are comprised be-tween the two limiting values defined by the nativecollagen and the coil solutions. The slopes vary withthe amount of helix renatured. By a homotheticaltransformation, the same information is derivedfrom the measurements at any wavelength A >
300 nm. This allows us to define a quantity which wecall the helix amount X, by :
X is independent of A, we assume that collagen is100 % helix and that the hot solutions are completelydenatured.
Further experiments are done at A = 436 nm,
corresponding to specific optical rotations :
The densities of the solutions are taken equal to19. em - 3.
Fig. 2. - The inverse of the specific optical rotation,[a ], versus the square of the wavelength, A, in solutionsand gels : a) gelatin solutions, T = 45.5 °C, c = 1 % g/g ;and c = 4.7 9E g/g ; b) gel, T=28°C, c = 4.7 % g/g ;c) gel, T = 25 °C, c = 4.7 % g/g ; d) gel, T = 20 °C,c = 1 % g/g ; e) native collagen solution, T = 20 °C,c = 0.45 % g/g. [a ] is defined in equation (1).
1.2 THERMAL TREATMENTS OF SOLUTIONS AND
GELS. - We have tested different methods of
preparing the gels : by lowering the temperature atconstant rates, or by quenching the solutions at fixedtemperatures.
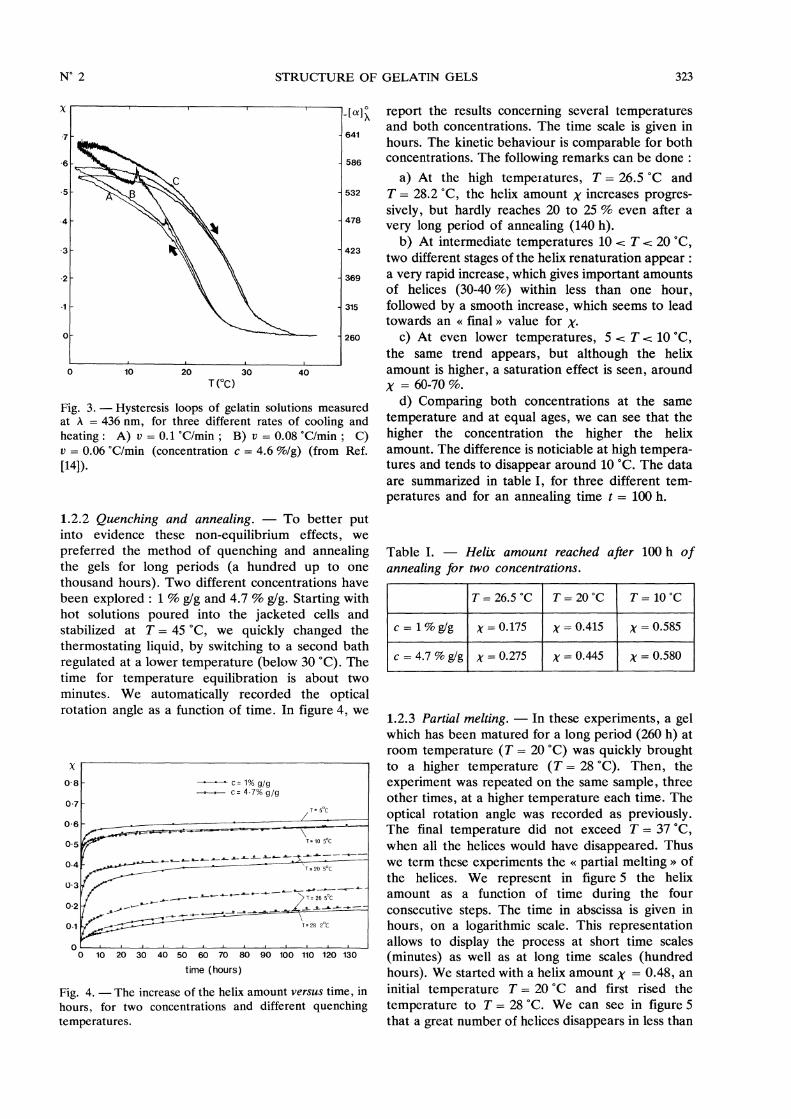
1.2.1 Thermal cycles. - This method was used first.We reproduce in figure 3 the results from reference[14]. For three different rates of cooling v, 0.06 U 0.1 °C/min, for a concentration c = 4.6 % g/g,we lowered the temperature down to 4 °C and thenraised it back to 45 °C.
Important hysteresis effects appear (width - 6 °C)although the curves do not show marked differencesbetween the different rates. More helices are renat-ured at the lower rate of cooling, but the limitingvalue of 100 % helix is not reached. The hysteresiscurves show the balance between the rate of helix
growth or melting, and the rate of change of thetemperature.
323
Fig. 3. - Hysteresis loops of gelatin solutions measuredat A = 436 nm, for three different rates of cooling andheating : A) v = 0.1 °C/min ; B) v = 0.08 °C/min ; C)v = 0.06 °C/min (concentration c = 4.6 %/g) (from Ref.[14]).
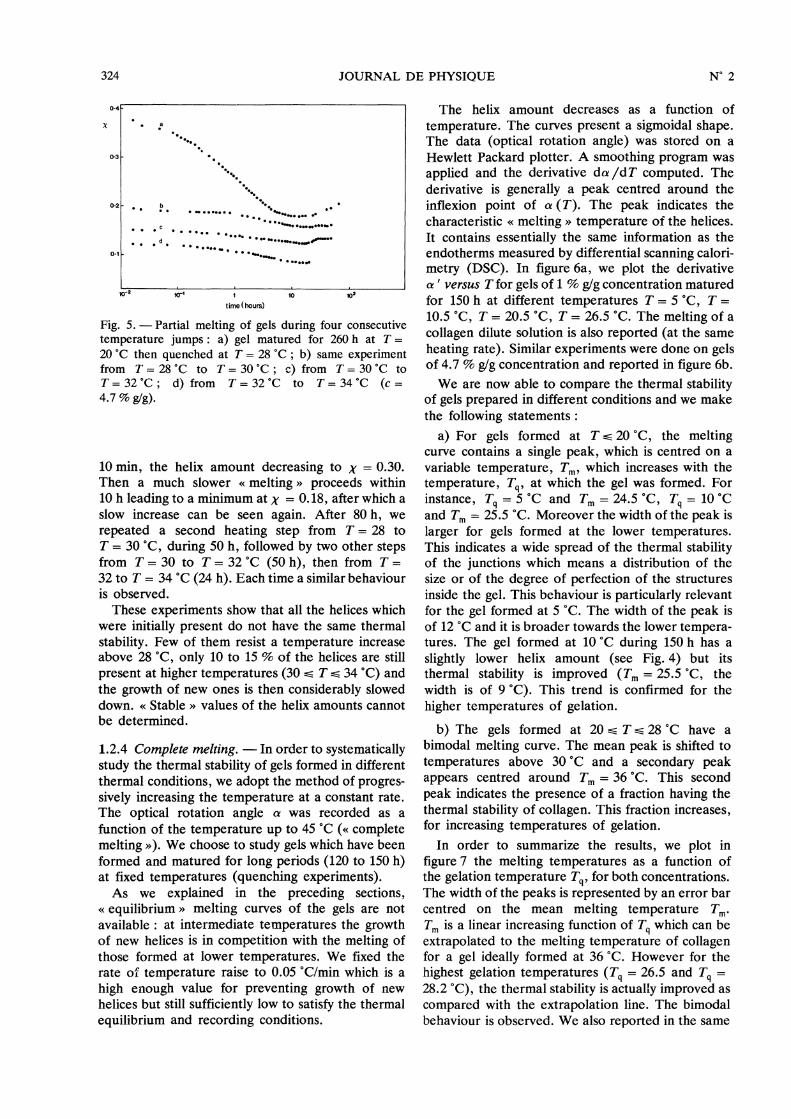
1.2.2 Quenching and annealing. - To better putinto evidence these non-equilibrium effects, wepreferred the method of quenching and annealingthe gels for long periods (a hundred up to onethousand hours). Two different concentrations havebeen explored : 1 % g/g and 4.7 % g/g. Starting withhot solutions poured into the jacketed cells andstabilized at T = 45 °C, we quickly changed thethermostating liquid, by switching to a second bathregulated at a lower temperature (below 30 °C). Thetime for temperature equilibration is about twominutes. We automatically recorded the opticalrotation angle as a function of time. In figure 4, we
Fig. 4. - The increase of the helix amount versus time, in
hours, for two concentrations and different quenchingtemperatures.
report the results concerning several temperaturesand both concentrations. The time scale is given inhours. The kinetic behaviour is comparable for bothconcentrations. The following remarks can be done :
a) At the high temperatures, T = 26.5 °C andT = 28.2 °C, the helix amount X increases progres-sively, but hardly reaches 20 to 25 % even after avery long period of annealing (140 h).
b) At intermediate temperatures 10 T 20 °C,two different stages of the helix renaturation appear :a very rapid increase, which gives important amountsof helices (30-40 %) within less than one hour,followed by a smooth increase, which seems to leadtowards an « final » value for x.
c) At even lower temperatures, 5 T 10 °C,the same trend appears, but although the helixamount is higher, a saturation effect is seen, aroundX = 60-70 %.
d) Comparing both concentrations at the same
temperature and at equal ages, we can see that thehigher the concentration the higher the helixamount. The difference is noticiable at high tempera-tures and tends to disappear around 10 °C. The dataare summarized in table I, for three different tem-peratures and for an annealing time t = 100 h.
Table I. - Helix amount reached after 100 h ofannealing for two concentrations.
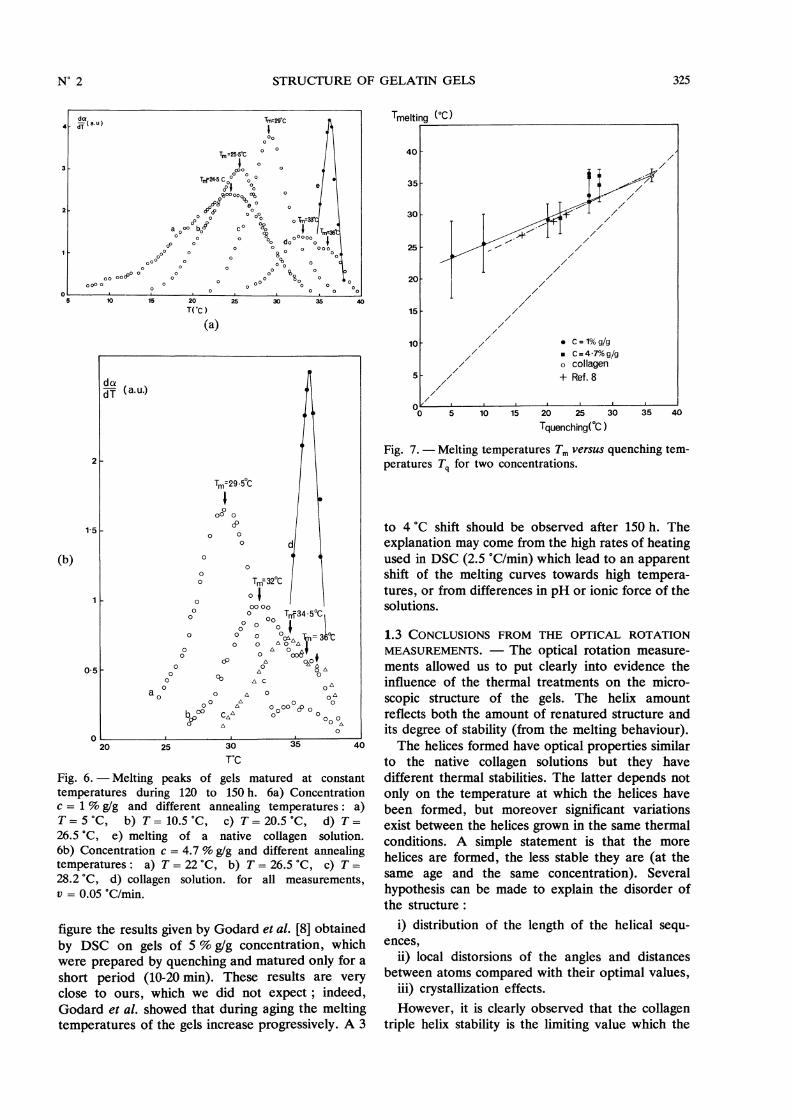
1.2.3 Partial melting. - In these experiments, a gelwhich has been matured for a long period (260 h) atroom temperature (T = 20 °C) was quickly broughtto a higher temperature ( T = 28 °C). Then, the
experiment was repeated on the same sample, threeother times, at a higher temperature each time. Theoptical rotation angle was recorded as previously.The final temperature did not exceed T = 37 °C,when all the helices would have disappeared. Thuswe term these experiments the « partial melting » ofthe helices. We represent in figure 5 the helixamount as a function of time during the fourconsecutive steps. The time in abscissa is given inhours, on a logarithmic scale. This representationallows to display the process at short time scales(minutes) as well as at long time scales (hundredhours). We started with a helix amount X = 0.48, aninitial temperature T = 20 °C and first rised the
temperature to T = 28 °C. We can see in figure 5that a great number of helices disappears in less than
324
Fig. 5. - Partial melting of gels during four consecutivetemperature jumps : a) gel matured for 260 h at T =
20 °C then quenched at T = 28 °C ; b) same experimentfrom T = 28 °C to T = 30 °C ; c) from T = 30 °C to
T = 32 °C ; d) from T = 32 °C to T = 34 °C (c =4.7 % g/g).
10 min, the helix amount decreasing to x = 0.30.Then a much slower « melting » proceeds within10 h leading to a minimum at y = 0.18, after which aslow increase can be seen again. After 80 h, werepeated a second heating step from T = 28 to
T = 30 °C, during 50 h, followed by two other stepsfrom T = 30 to T = 32 °C (50 h), then from T =32 to T = 34 °C (24 h). Each time a similar behaviouris observed.These experiments show that all the helices which
were initially present do not have the same thermalstability. Few of them resist a temperature increaseabove 28 °C, only 10 to 15 % of the helices are stillpresent at higher temperatures (30 , T::s:: 34 °C) andthe growth of new ones is then considerably sloweddown. « Stable » values of the helix amounts cannotbe determined.
1.2.4 Complete melting. - In order to systematicallystudy the thermal stability of gels formed in differentthermal conditions, we adopt the method of progres-sively increasing the temperature at a constant rate.The optical rotation angle a was recorded as a
function of the temperature up to 45 °C (« completemelting »). We choose to study gels which have beenformed and matured for long periods (120 to 150 h)at fixed temperatures (quenching experiments).As we explained in the preceding sections,
« equilibrium >> melting curves of the gels are notavailable : at intermediate temperatures the growthof new helices is in competition with the melting ofthose formed at lower temperatures. We fixed therate of temperature raise to 0.05 °C/min which is ahigh enough value for preventing growth of newhelices but still sufficiently low to satisfy the thermalequilibrium and recording conditions.
The helix amount decreases as a function of
temperature. The curves present a sigmoidal shape.The data (optical rotation angle) was stored on aHewlett Packard plotter. A smoothing program wasapplied and the derivative da /dT computed. Thederivative is generally a peak centred around theinflexion point of a (T). The peak indicates thecharacteristic « melting » temperature of the helices.It contains essentially the same information as theendotherms measured by differential scanning calori-metry (DSC). In figure 6a, we plot the derivativea’ versus T for gels of 1 % g/g concentration maturedfor 150 h at different temperatures T = 5 °C, T =10.5 °C, T = 20.5 °C, T = 26.5 °C. The melting of acollagen dilute solution is also reported (at the sameheating rate). Similar experiments were done on gelsof 4.7 % g/g concentration and reported in figure 6b.We are now able to compare the thermal stability
of gels prepared in different conditions and we makethe following statements :
a) For gels formed at T:::::: 20 °C, the meltingcurve contains a single peak, which is centred on avariable temperature, Tm, which increases with thetemperature, Tq, at which the gel was formed. Forinstance, Tq = 5 °C and Tm = 24.5 °C, Tq =10 °Cand Tm = 25.5 °C. Moreover the width of the peak islarger for gels formed at the lower temperatures.This indicates a wide spread of the thermal stabilityof the junctions which means a distribution of thesize or of the degree of perfection of the structuresinside the gel. This behaviour is particularly relevantfor the gel formed at 5 °C. The width of the peak isof 12 °C and it is broader towards the lower tempera-tures. The gel formed at 10 °C during 150 h has aslightly lower helix amount (see Fig. 4) but itsthermal stability is improved ( Tm = 25.5 °C, thewidth is of 9 °C). This trend is confirmed for the
higher temperatures of gelation.
b) The gels formed at 20 -- T:::::: 28 °C have a
bimodal melting curve. The mean peak is shifted totemperatures above 30 °C and a secondary peakappears centred around Tm = 36 °C. This second
peak indicates the presence of a fraction having thethermal stability of collagen. This fraction increases,for increasing temperatures of gelation.
In order to summarize the results, we plot in
figure 7 the melting temperatures as a function ofthe gelation temperature Tq, for both concentrations.The width of the peaks is represented by an error barcentred on the mean melting temperature Tm.Tm is a linear increasing function of Tq which can beextrapolated to the melting temperature of collagenfor a gel ideally formed at 36 °C. However for thehighest gelation temperatures (Tq = 26.5 and Tq =28.2 °C), the thermal stability is actually improved ascompared with the extrapolation line. The bimodalbehaviour is observed. We also reported in the same
325
Fig. 6. - Melting peaks of gels matured at constant
temperatures during 120 to 150 h. 6a) Concentrationc = 1 % g/g and different annealing temperatures : a)T = 5 °C, b) T =10.5 °C, c) T = 20.5 °C, d) T =26.5 °C, e) melting of a native collagen solution.
6b) Concentration c = 4.7 % g/g and different annealingtemperatures: a) T = 22 °C, b) T = 26.5 °C, c) T =28.2 °C, d) collagen solution. for all measurements,v = 0.05 °C/min.
figure the results given by Godard et al. [8] obtainedby DSC on gels of 5 % g/g concentration, whichwere prepared by quenching and matured only for ashort period (10-20 min). These results are veryclose to ours, which we did not expect ; indeed,Godard et al. showed that during aging the meltingtemperatures of the gels increase progressively. A 3
Fig. 7. - Melting temperatures Tm versus quenching tem-peratures Tq for two concentrations.
to 4 °C shift should be observed after 150 h. The
explanation may come from the high rates of heatingused in DSC (2.5 °C/min) which lead to an apparentshift of the melting curves towards high tempera-tures, or from differences in pH or ionic force of thesolutions.
1.3 CONCLUSIONS FROM THE OPTICAL ROTATIONMEASUREMENTS. - The optical rotation measure-ments allowed us to put clearly into evidence theinfluence of the thermal treatments on the micro-
scopic structure of the gels. The helix amountreflects both the amount of renatured structure andits degree of stability (from the melting behaviour).The helices formed have optical properties similar
to the native collagen solutions but they havedifferent thermal stabilities. The latter depends notonly on the temperature at which the helices havebeen formed, but moreover significant variationsexist between the helices grown in the same thermalconditions. A simple statement is that the morehelices are formed, the less stable they are (at thesame age and the same concentration). Several
hypothesis can be made to explain the disorder ofthe structure :
i) distribution of the length of the helical sequ-ences,
ii) local distorsions of the angles and distancesbetween atoms compared with their optimal values,
iii) crystallization effects.However, it is clearly observed that the collagen
triple helix stability is the limiting value which the

326
gels reached after 150 h at concentrations of a fewpercent.These observations corroborate those reported on
the renaturation of dilute collagen solutions (0.1 to0.4 % g/g), denatured just before by a mild heating[15-17].The method of forming the gels by quenching and
annealing at one temperature seems the best adaptedfor their systematic study. More complicate treat-ments such as repeated thermal cycles or alternateannealings, have also been reported in the literature[16]. Their analysis is more delicate, due to themixing of time and temperature effects.
Besides the helix amount, other parameters haveto be considered in order to understand the mechan-isms of helix formation. We have investigated therole of the solvent by proton nuclear magneticrelaxation NMR. We have also vizualized the sup-ramolecular structure of the gels by developpingultra rapid freezing technics. These experiments aredescribed in details elsewhere. Here, we shall recallthe principal results.
2. Role of the solvent.
The role of the solvent in stabilizing the helicalstructures can be put into evidence by means ofproton NMR.As we explained in the section « Collagen and
gelatin » water molecules are placed in interstitial
positions and stabilize the triple helices of native
collagen by establishing hydrogen bonds betweenadjacent chains. Also the polar groups such as OH,NH2, CO... and the charged NH+ or COO- groups,interact with water molecules in solution (coil confor-mation) by making hydrogen bonds or via dipolarinteractions.
Thus, we expected to put into evidence a modifi-cation of the relaxation properties of water protons,in solutions and in gels, compared to the bulk water.The water molecules interacting with the proteinshould be sensitive to the change of conformationwhich transforms their microscopic environment.The wide line NMR technique is unable to dis-
tinguish at « normal >> temperatures (5 to 40 °C)different water populations : bound water and freewater.
However, when the samples were cooled to tem-peratures below - 8 °C, when part of the waterfreezes, then we could see that a fraction of protonsstill remains mobile [18]. These protons are partlythose of the macromolecules and partly those of thebound water (water interacting with the protein).Our results, corroborating those obtained by othertechniques on gelatin and collagen [19], gave anestimation of the fraction of bound water of 0.45 g/gof gelatin (which represents approximately 2.7 watermolecules per amino acid residue).
By pulsed NMR, the spin-lattice relaxation timeTl and the spin-spin relaxation time T2 can bemeasured in solutions and gels. In both cases, singlerelaxation times were observed (exponential decays).This led us to the assumption that rapid exchangeexists between the different water populations. Thespin-lattice relaxation time is unaffected by the
gelation phenomenon (helix formation). On the
contrary, the spin-spin relaxation time T2 is modifiedby the conformational changes. We observed a
progressive decrease of T2 during the quenchingexperiments, indicating that an increasing fraction ofprotons is involved into a rigid structure (see Fig. 8).We called this fraction the structural water. Withinthe assumption of a rapid exchange between variousproton populations the inverse of the observedrelaxation time T2 is proportional to the fraction ofstructural water. Indeed, we showed that T2 1 is
proportional to the helix amount X, measured bypolarimetry. The fraction of structural water is thusrelated to the helix amount in the gel. Our theoreti-cal interpretation of the NMR data is compatiblewith the models of triple helix stabilization byhydrogen bonds via water molecules which wementioned at the beginning.
Fig. 8. - Decrease of the proton spin-spin relaxation
time T2 versus time during a quenching experiment(c = 21 % g/g, quenching temperature T = 24 °C) (fromRef. [18]).
3. The three dimensional structure.
Interpretations of the mechanical properties of poly-mer gels are invariably based on the assumption of athree dimensional connected network which extends
throughout the solution. Also the ability of gels tohold a substantial amount of solvent (up to 99 %) isstrongly related to their microstructure. The size ofthe pores has a direct influence on the capillary
327
forces which are especially strong for the smallestpores (range of 1-100 nm). A direct observation ofthe structure of the network is thus of primaryimportance. Moreover, a quantitative estimation ofthe parameters (for different concentrations or tem-peratures) might also help in elucidating the mechan-isms of network growth.So far, little information has been known about
the three dimensional structure of physical gels.Only recently, very performant techniques derived
from advanced methods of electron microscopy,developed by researchers in Life Sciences, becameavailable. The difficulties in performating electronmicrographs of the gels are similar to those encoun-tered in most biological specimens. First of all,comes the lack of contrast : the atomic numbers
along the macromolecules are not high enough toscatter electrons. Traditionaly, staining methodshave been applied [30], using solutions containingheavy atoms to create the contrast. These methodsusually include chemical fixing of the specimen andembedding with epoxy resins.When studying physical gels, like gelatin, other
major difficulties come from the high degree ofhydration and from the weakness of the bonds whichhold the network. The physical networks therefore,have to be « locked >> by chemical crosslinks or fixedby a physical method. In the latter case, quickfreezing techniques are used.Their application to electron microscopy became
possible only when ultrarapid rates of cooling couldbe achieved in order to avoid crystallization of water[20]. The growth of ice crystals damages the structure(of cells, tissues, etc.). The crystal size is mainly afunction of the freezing rate. The vitrous state ofwater can be attained for rates of cooling of theorder of 105 K sec - 1 [21]. We have’adapted a
method of quick freezing [22] by using a device firstdesigned and built by Escaig [23] and tested onbiological specimens. The device is commercialyavailable from Reichert-Young (the cryoblock). Inpractice, the gel is layed on a sample holder and anelectropneumatic system pushes it against a copperblock which was previously cooled with liquidHelium down to about 10 K. Over a depth of 10 Rmfrom the surface of the gel, the rate of coolingreaches 2 x 10⁴ to 3 x 10⁴ K sec-1. Ice crystals can-not be detected in this range, which means eitherthat water is actually vitrified or, if any ice crystalsare formed, their size is beyond the resolution ofelectron micrographs (a few angstroms). In this
range, the network is preserved. After freezing, thesample is stored in liquid nitrogen, then mounted ina Balzers equipment where the freeze etching isdone. As the sample is kept at - 100 °C undervacuum, the vitrous ice is sublimated over a depth of0.5 J.Lm. The polymeric network becomes apparent.The replica of the structure is realized by evaporating
Pt and C (rotatory shadowing). The coating stiffensthe structures and it is not altered by the electronbeam. The organic material remaining is removed byacid treatment. The replica is layed on a microscopicgrid and observed.We realized [24] replicas of dilute hot solutions
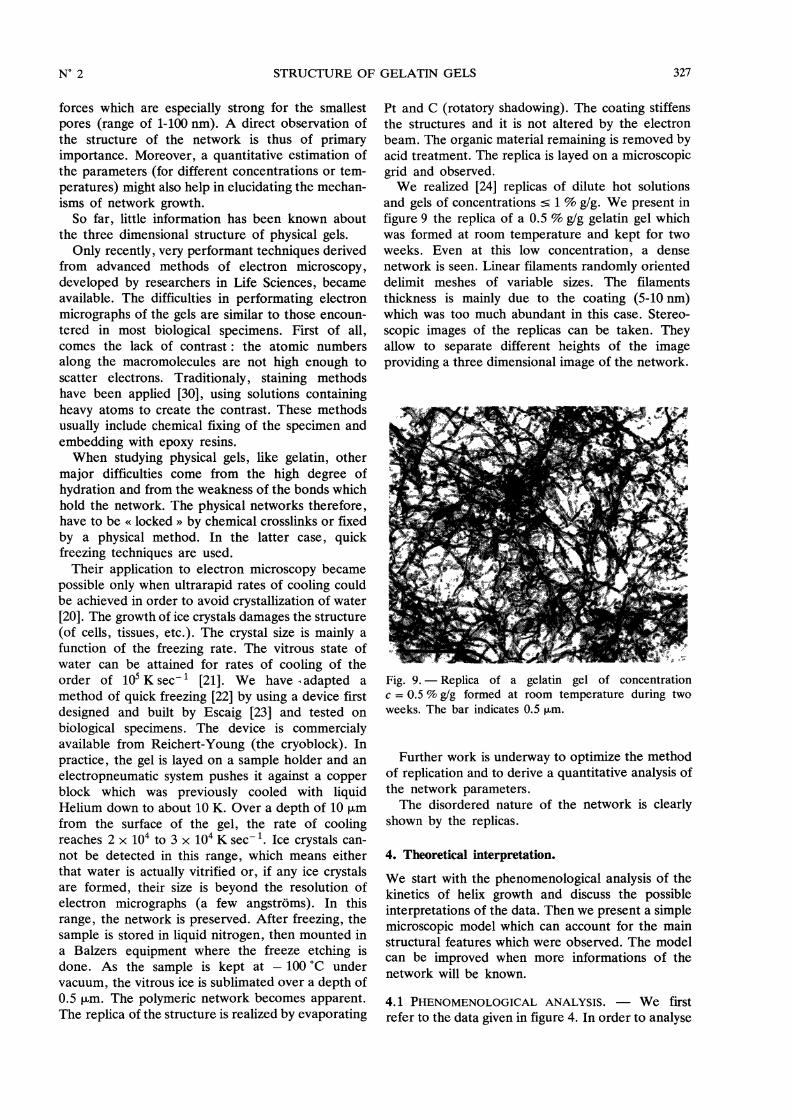
and gels of concentrations -% 1 % g/g. We present infigure 9 the replica of a 0.5 % g/g gelatin gel whichwas formed at room temperature and kept for twoweeks. Even at this low concentration, a densenetwork is seen. Linear filaments randomly orienteddelimit meshes of variable sizes. The filamentsthickness is mainly due to the coating (5-10 nm)which was too much abundant in this case. Stereo-
scopic images of the replicas can be taken. Theyallow to separate different heights of the imageproviding a three dimensional image of the network.
Fig. 9. - Replica of a gelatin gel of concentrationc = 0.5 % g/g formed at room temperature during twoweeks. The bar indicates 0.5 )JLm.
Further work is underway to optimize the methodof replication and to derive a quantitative analysis ofthe network parameters.The disordered nature of the network is clearly
shown by the replicas.
4. Theoretical interpretation.
We start with the phenomenological analysis of thekinetics of helix growth and discuss the possibleinterpretations of the data. Then we present a simplemicroscopic model which can account for the mainstructural features which were observed. The modelcan be improved when more informations of thenetwork will be known.
4.1 PHENOMENOLOGICAL ANALYSIS. - We firstrefer to the data given in figure 4. In order to analyse
328
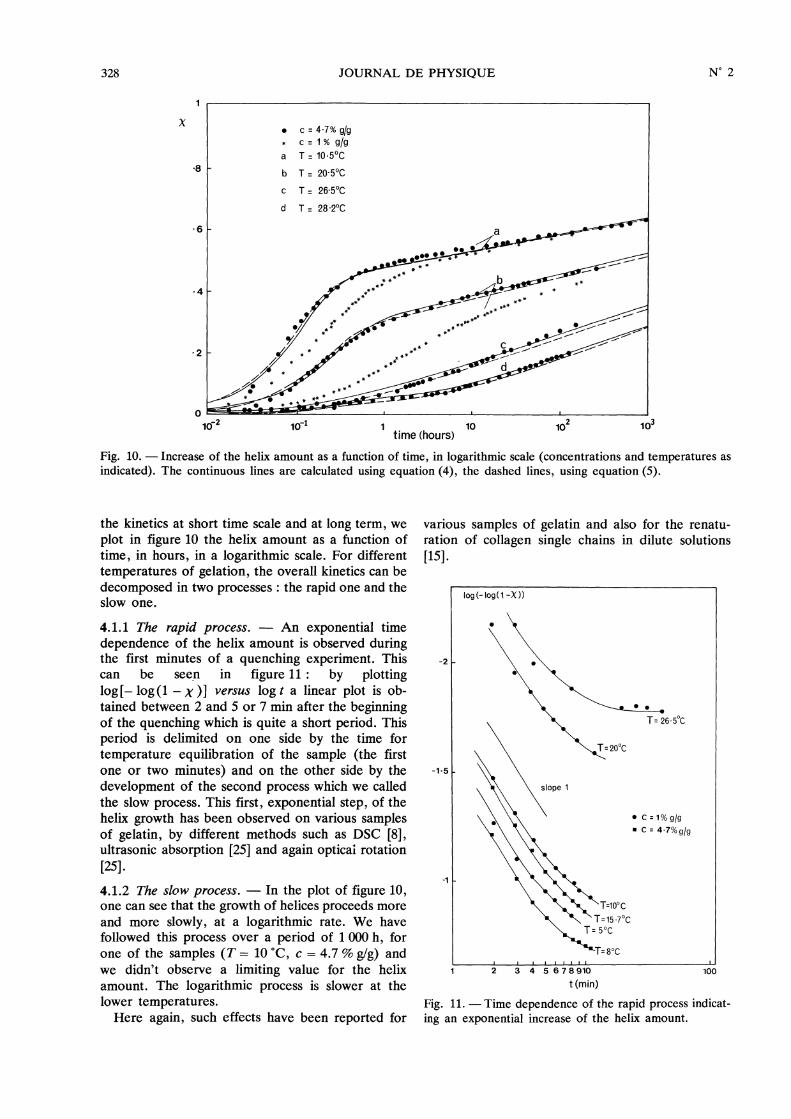
Fig. 10. - Increase of the helix amount as a function of time, in logarithmic scale (concentrations and temperatures asindicated). The continuous lines are calculated using equation (4), the dashed lines, using equation (5).
the kinetics at short time scale and at long term, weplot in figure 10 the helix amount as a function oftime, in hours, in a logarithmic scale. For differenttemperatures of gelation, the overall kinetics can bedecomposed in two processes : the rapid one and theslow one.
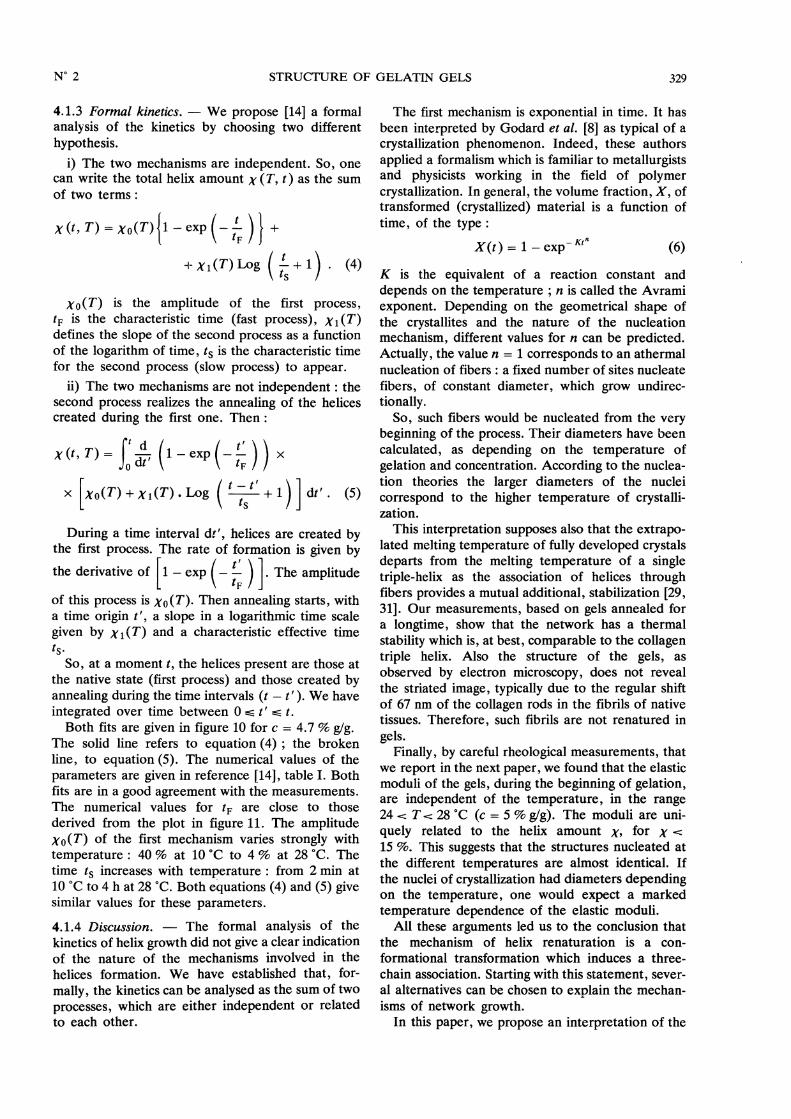
4.1.1 The rapid process. - An exponential timedependence of the helix amount is observed duringthe first minutes of a quenching experiment. Thiscan be seen in figure 11 : by plottinglog [- log ( 1- X ) ] versus log t a linear plot is ob-tained between 2 and 5 or 7 min after the beginningof the quenching which is quite a short period. Thisperiod is delimited on one side by the time fortemperature equilibration of the sample (the firstone or two minutes) and on the other side by thedevelopment of the second process which we calledthe slow process. This first, exponential step, of thehelix growth has been observed on various samplesof gelatin, by different methods such as DSC [8],ultrasonic absorption [25] and again opticai rotation[25].4.1.2 The slow process. - In the plot of figure 10,one can see that the growth of helices proceeds moreand more slowly, at a logarithmic rate. We havefollowed this process over a period of 1 000 h, forone of the samples (T = 10 °C, c = 4.7 % g/g) andwe didn’t observe a limiting value for the helixamount. The logarithmic process is slower at thelower temperatures.Here again, such effects have been reported for
various samples of gelatin and also for the renatu-ration of collagen single chains in dilute solutions[15].
Fig. 11. - Time dependence of the rapid process indicat-ing an exponential increase of the helix amount.
329
4.1.3 Formal kinetics. - We propose [14] a formalanalysis of the kinetics by choosing two differenthypothesis.
i) The two mechanisms are independent. So, onecan write the total helix amount X (T, t ) as the sumof two terms :
X o ( T) is the amplitude of the first process,tF is the characteristic time (fast process), X 1 ( T)defines the slope of the second process as a functionof the logarithm of time, ts is the characteristic timefor the second process (slow process) to appear.
ii) The two mechanisms are not independent: thesecond process realizes the annealing of the helicescreated during the first one. Then:
During a time interval dt’, helices are created bythe first process. The rate of formation is given bythe derivative of 1- exp - t . The amplitudeL B tFof this process is Xo (T ). Then annealing starts, witha time origin t’, a slope in a logarithmic time scalegiven by X1(T) and a characteristic effective timets.
So, at a moment t, the helices present are those atthe native state (first process) and those created byannealing during the time intervals (t - t’ ). We haveintegrated over time between 0 -- t’ :s:: t.Both fits are given in figure 10 for c = 4.7 % g/g.
The solid line refers to equation (4) ; the brokenline, to equation (5). The numerical values of theparameters are given in reference [14], table I. Bothfits are in a good agreement with the measurements.The numerical values for tF are close to thosederived from the plot in figure 11. The amplitudeXo(T ) of the first mechanism varies strongly withtemperature : 40 % at 10 °C to 4 % at 28 °C. Thetime ts increases with temperature : from 2 min at10 °C to 4 h at 28 °C. Both equations (4) and (5) givesimilar values for these parameters.
4.1.4 Discussion. - The formal analysis of the
kinetics of helix growth did not give a clear indicationof the nature of the mechanisms involved in the
helices formation. We have established that, for-
mally, the kinetics can be analysed as the sum of twoprocesses, which are either independent or relatedto each other.
The first mechanism is exponential in time. It hasbeen interpreted by Godard et al. [8] as typical of acrystallization phenomenon. Indeed, these authorsapplied a formalism which is familiar to metallurgistsand physicists working in the field of polymercrystallization. In general, the volume fraction, X, oftransformed (crystallized) material is a function of
time, of the type :
K is the equivalent of a reaction constant and
depends on the temperature ; n is called the Avramiexponent. Depending on the geometrical shape ofthe crystallites and the nature of the nucleationmechanism, different values for n can be predicted.Actually, the value n =1 corresponds to an athermalnucleation of fibers : a fixed number of sites nucleate
fibers, of constant diameter, which grow undirec-tionally.
So, such fibers would be nucleated from the verybeginning of the process. Their diameters have beencalculated, as depending on the temperature of
gelation and concentration. According to the nuclea-tion theories the larger diameters of the nuclei
correspond to the higher temperature of crystalli-zation.
This interpretation supposes also that the extrapo-lated melting temperature of fully developed crystalsdeparts from the melting temperature of a singletriple-helix as the association of helices throughfibers provides a mutual additional, stabilization [29,31]. Our measurements, based on gels annealed fora longtime, show that the network has a thermalstability which is, at best, comparable to the collagentriple helix. Also the structure of the gels, as
observed by electron microscopy, does not revealthe striated image, typically due to the regular shiftof 67 nm of the collagen rods in the fibrils of nativetissues. Therefore, such fibrils are not renatured ingels.
Finally, by careful rheological measurements, thatwe report in the next paper, we found that the elasticmoduli of the gels, during the beginning of gelation,are independent of the temperature, in the range24 T 28 °C (c = 5 % g/g). The moduli are uni-quely related to the helix amount y, for X 15 %. This suggests that the structures nucleated atthe different temperatures are almost identical. If
the nuclei of crystallization had diameters dependingon the temperature, one would expect a markedtemperature dependence of the elastic moduli.
All these arguments led us to the conclusion thatthe mechanism of helix renaturation is a con-
formational transformation which induces a three-chain association. Starting with this statement, sever-al alternatives can be chosen to explain the mechan-isms of network growth.
In this paper, we propose an interpretation of the
330
data which we do not consider as a definitive modelfor the gelatin gel network, but which accounts forthe main features reported here. Further exper-imental work is under way which will describe thenetwork more precisely and will help to refine themodel.
4.2 ATTEMPT FOR A MICROSCOPIC INTERPRE-
TATION. - The scheme that we propose for semi-dilute solutions is the following : when the tempera-ture is lowered, helices are nucleated along theindividual chains. For instance, sequences containingProline residues provide potential sites of nucleation[12]. If helices are nucleated on segments belongingto three different chains which are closely entangledthen a triple helix is able to start and grow.
Assuming that one chain is involved in several - atleast two - of these junctions, then a loose networkis created. This mechanism might correspond to thefirst rapid process of helix growth. The secondprocess should then be a slow reorganization of thenetwork towards the collagen rods renaturation.
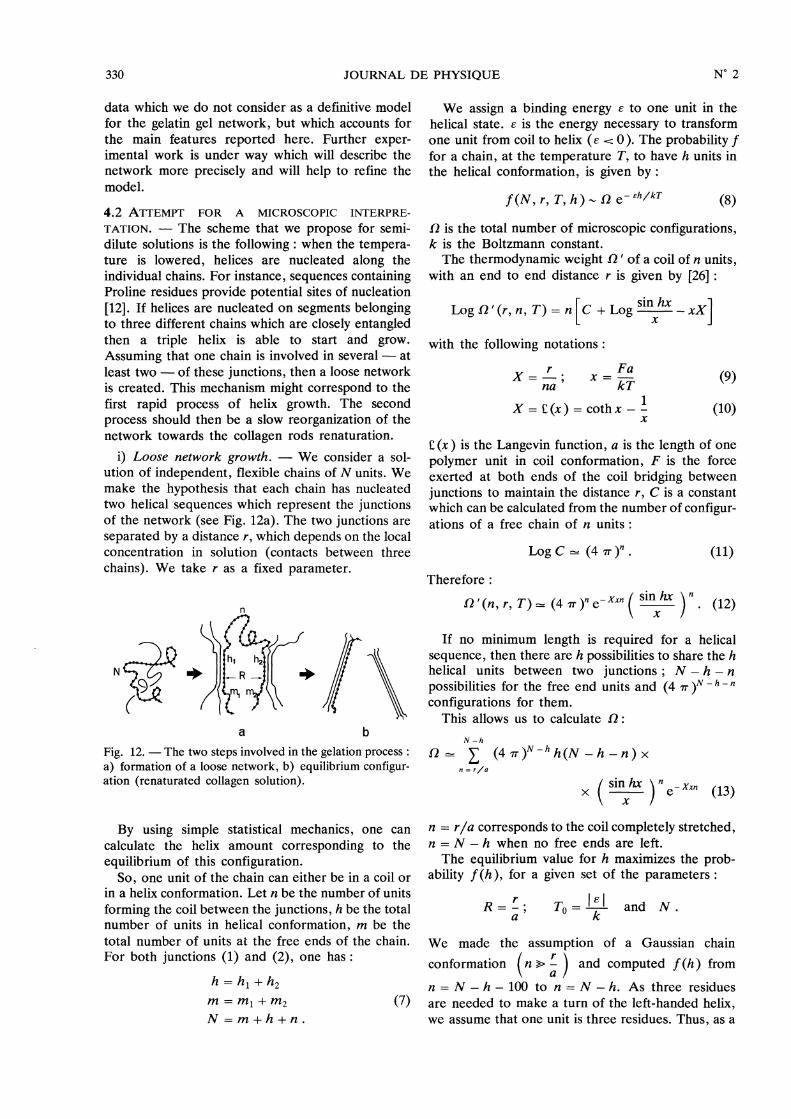
i) Loose network growth. - We consider a sol-ution of independent, flexible chains of N units. Wemake the hypothesis that each chain has nucleatedtwo helical sequences which represent the junctionsof the network (see Fig. 12a). The two junctions areseparated by a distance r, which depends on the localconcentration in solution (contacts between threechains). We take r as a fixed parameter.
Fig. 12. - The two steps involved in the gelation process :a) formation of a loose network, b) equilibrium configur-ation (renaturated collagen solution).
By using simple statistical mechanics, one cancalculate the helix amount corresponding to the
equilibrium of this configuration.So, one unit of the chain can either be in a coil or
in a helix conformation. Let n be the number of units
forming the coil between the junctions, h be the totalnumber of units in helical conformation, m be thetotal number of units at the free ends of the chain.For both junctions (1) and (2), one has :
We assign a binding energy E to one unit in thehelical state. E is the energy necessary to transformone unit from coil to helix (s 0). The probability ffor a chain, at the temperature T, to have h units inthe helical conformation, is given by :
Q is the total number of microscopic configurations,k is the Boltzmann constant.The thermodynamic weight Q ’ of a coil of n units,
with an end to end distance r is given by [26] :
with the following notations :
C (x ) is the Langevin function, a is the length of onepolymer unit in coil conformation, F is the forceexerted at both ends of the coil bridging betweenjunctions to maintain the distance r, C is a constantwhich can be calculated from the number of configur-ations of a free chain of n units :
Therefore :
If no minimum length is required for a helical
sequence, then there are h possibilities to share the hhelical units between two junctions ; N - h - npossibilities for the free end units and (4 ?r )N - h - nconfigurations for them.
This allows us to calculate f2:
n = r/a corresponds to the coil completely stretched,n = N - h when no free ends are left.The equilibrium value for h maximizes the prob-
ability f (h), for a given set of the parameters :
and
We made the assumption of a Gaussian chain
conformation n > r and computed f (h) froma
n = N - h - 100 to n = N - h. As three residuesare needed to make a turn of the left-handed helix,we assume that one unit is three residues. Thus, as a

331
chain has 1000 residues, N is of the order of400 units. Let X o be the helix amount given by :
Fig. 13. - Computed values of the helix amounts versustemperature. The influence of the chain length N and ofthe distance R between junctions is shown. Xo representsthe helix amount at the end of the first process.
acquit represents the hypothetical values reached if thesecond process could arrive to completion. Xo correspondsto the maximum of f (h } (Eq. (8)), X eq to the maximum off’ (h } (Eq. (15)).
h (max ) corresponds to the maximum of the com-puted probability f (h )max.We plot in figure 13, Xo as a function of tempera-
ture taking :To = 767 K ; N = 400 ; R = 40, or R = 50, or
R = 55 as well as N = 600 and R = 50, same
To.The length of a unit of three residues being around
0.9 nm, r is comprised between 40 and 50 nm.The values of Xo derived from equation (14) are
also reported in figure 13. They are in agreementwith this model when R = 50 (r = 45 nm), N =400 and To = 767 K. The corresponding bindingenergy, per mole is then :
I e (mole) I =1.5 kcallmole .
It has the order of magnitude of the hydrogen bond.The numerical values for N, R, E have to beconsidered as averages ; a large distribution is revea-led by the melting behaviour, the molecular weightanalysis, etc... However, these values are in a
reasonable agreement with the structural and ther-modynamical data which is known.When this first step is achieved, the system is not
truly in equilibrium. A second process reorganizesthe network and allows new helices to be created.The second process has a logarithmic time depen-dence, which is much slower than the first one.There is not at the moment a theoretical model
which can explain the logarithmic process. It mightrepresent a superposition of several mechanisms,having a distribution of the characteristic times. Ananalogy with the glass relaxation can be suggested[27].We may suppose that during this process local
constraints are released.
ii) Equilibrium configuration. - If the secondprocess could arrive to completion one chain wouldfree itself from one junction and form a continuoushelical sequence on the other one. The final equilib-rium would then correspond to independent triplehelices, like the native collagen rods in solution.
In this configuration (see Fig. 12b), one can
compute the most probable value Jrequil as a functionof temperature, for a chain of N units, by searchingthe maximum of :
The numerical values of X equ,l are also reported infigure 13, keeping the same data for N and To as inthe precedent section (N = 400, To = 767 K).The plot of Xequil(T) is similar to a step melting
curve such as :
Although the system proceeds towards this state,the final equilibrium is not reached within the
longest periods of observation.
Conclusion.
The aim of this paper is to make a statement ondifferent aspects involved in the structural modifi-cations of gelatin solutions, during gelation. Westressed upon the influence of thermal treatments,on solutions of various concentrations. We clearlyestablish that the gel state is not an equilibriumstate. The kinetic aspects have to be considered.
Although different interpretations of the kineticshave been proposed, we argue that the con-
formational transition of the protein chains is the
predominant mechanism of gelation.Several features appear through this investigation
which can be generalized to other physical gels:1) Gels have to be characterized at several micro-
scopic levels, starting from the local conformation (afew tenths of nanometers) to the overall threedimensional organization, in ranges of several hun-dreds of nanometers. The full scale is important tounderstand the mechanisms of gelation and to exp-lain the elastic properties of the gels and theirremarkable ability of holding large amounts ofsolvent. The observation by electron microscopy ofthe three dimensional structure of gels is now
possible. We propose a freeze etching and replication
332
method which is suitable for dilute gels (c =1 to 2 %gig).
2) In connection with the ability of gels to holdthe solvent, we know, first, that significant amountsof loosely bound water exist, in solution. We haveestablished, for aqueous gelatin solutions, that waterparticipates to the built up of the network (tightlybound, structural water). Although such properties
are to be expected in aqueous systems, similareffects have been reported recently for physical gelsof synthetic polymers, in apolar solvents (formationof polymer solvent complexes for atactic polystyrenein carbon disulfide [28]). Such observations are
encouraging for the search of a general descriptionof the physical gelation.
References
[1] Treatise on collagen, Ramachandran G. N. Ed. (N.Y.Acad. Press) 1967.
[2] WARD, A. G. and COURTS, A., The science andtechnology of gelatin (Acad. Press) 1977.
[3] EYRE, D. R., Sciences 207 (1980) 1317.[4] BROWN, F. R., HOPFINGER, A. J. and BLOUT, E. R.,
J. Mol. Biol. 63 (1972) 101.[5] RAMACHANDRAN, G. N. and CHANDRASEKHARAN,
R., Biopolymers 6 (1968) 1649.[6] BOEDKER, K. and DOTY, P., J. Phys. Chem. 58
(1954) 968.[7] HARRINGTON, W. F. and RAO, N. V., Biochem. 9
(1970) 3714.[8] GODARD, P., BIEBUYCK, J. J., DAUMERIE, M.,
NAVEAU, H., MERCIER, J. P., J. Polym. Sci.,Polym. Phys. Ed. 16 (1978) 1817.
[9] DJABOUROV, M. and PAPON, P., Polymer 24 (1983)539.
[10] WALTON, A. G. and BLACKWELL, J., Biopolymers(Acad. Press) 1973.
[11] BLOUT, E. R., CARVER, J. P., GROSS, J., J. Am.
Chem. Soc. 85 (1963) 644.[12] VON HIPPEL, P. H., reference [1], chap. VI.[13] VON HIPPEL, P. H. and WONG, K. Y., Biochem. 2
(1963) 1399.[14] DJABOUROV, M., MAQUET, J., THEVENEAU, H.,
LEBLOND, J., PAPON, P., Br. Polym. J. 17
(1985) 169.[15] BEIER, G. and ENGEL, J. Biochem. 5 (1966) 2744.[16] KUHN, K., ENGEL, J., ZIMMERMANN, B.,
GRASSMANN, W., Arch. Biochem. Biophys. 105(1964) 387.
[17] KUHN, K., ZIMMERMANN, B., Arch. Biochem.
Biophys. 109 (1965) 543.[18] MAQUET, J., THEVENEAU, H., DJABOUROV, M.,
LEBLOND, J., PAPON, P., Polymer 27 (1986)1103.
[19] MREVLISHVILI, G. M., SHARIMANOV, Yu. G.,Biofiz. 23 (1978) 242.
[20] Freeze etching techniques and applications, Benedetti,E. L. and Favard, P., Ed. (Soc. Franç. Microsc.Electron., Paris) 1973.
[21] GILKEY, J. C. and STRAEHELIN, L. A., J. Electron.Microsc. Technol. 3 (1986) 177.
[22] HEUSER, J., J. Cell. Biol. 79 (1978) 224a.[23] ESCAIG, J., J. Microsc. 126 (1982) 221.[24] FAVARD, P., FAVARD, N., DJABOLTROV, M., LE-
BLOND, J., to be published.[25] EMERY, J., CHATELIER, J. Y., DURAND, D., J. Phys.
France 47 (1986) 921 and related papers.[26] FLORY, P., Principles of polymer chemistry (Cornell
Univ. Press, N.Y.) 1953.[27] MEIJER, P. H. E., private communication.[28] FRANÇOIS, J., GAN, J. Y. S., GUENET, J. M.,
Macromolecules 19 (1986) 2755 and related
papers.[29] FLORY, P. and GARRETT, R. R., J. Am. Chem. Soc.
80 (1958) 4836.[30] TOMKA, I., BOHONEK, J., SPÜHLER, A. and
RIBEAND, M., J. Photogr. Sci. 23 (1975) 97.[31] BORCHARD, W., BREMER, W., KEESE, A., Colloid
Polym. Sci. 258 (1980) 516.