Embed Size (px)
Citation preview
Gene Expression17 March 2010
Rickard Sandberg
Department of Cell and Molecular Biology (CMB)
Karolinska Institutet
229 mars 2009Rickard Sandberg, CMB
Outline
Transcriptome Gene Expression Microarrays Gene Set Enrichment tests RNA-Sequencing Alternative Splicing
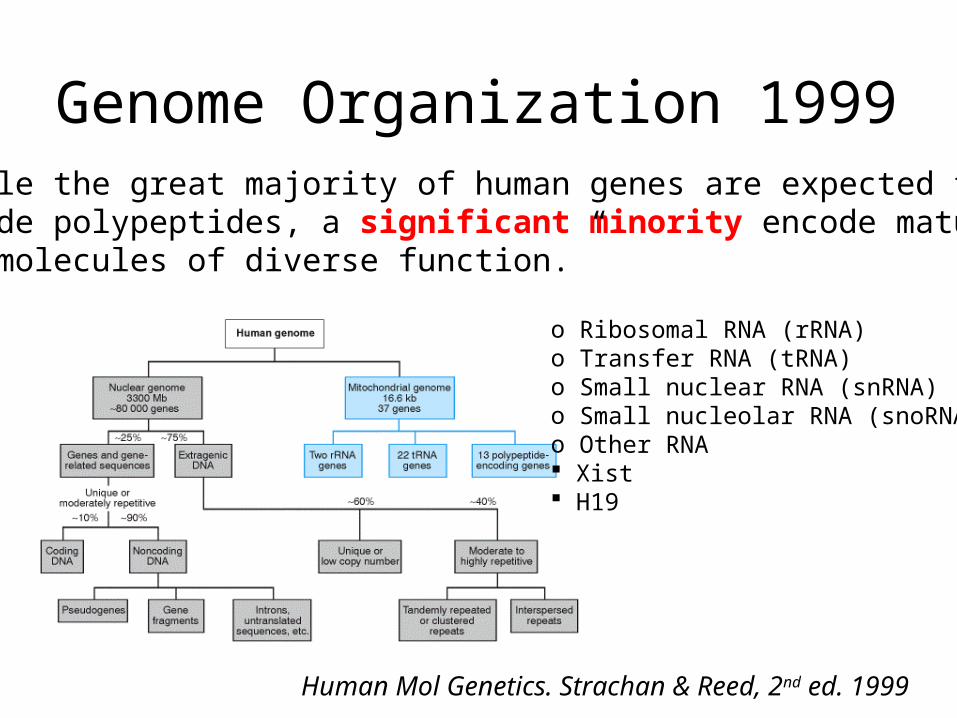
Genome Organization 1999“While the great majority of human genes are expected to encode polypeptides, a significant minority encode mature RNA molecules of diverse function.”
o Ribosomal RNA (rRNA)o Transfer RNA (tRNA)o Small nuclear RNA (snRNA)o Small nucleolar RNA (snoRNA)o Other RNA Xist H19
Human Mol Genetics. Strachan & Reed, 2nd ed. 1999
Genome Organization 2009
Noncoding RNAs (ncRNAs) are surprisingly prevalent. A systematic analysis of transcription observed ~10 times moretranscriptional activity than can be accounted for bypredicted protein-encoded genes. - Science May 2002
Computational analysis suggests that >50% of humangenes are regulated by ncRNAs known as microRNAs. - Lewis et al Cell 2005; Friedman et al. Genome Research 2008
microRNAs, a term not even mentioned in textbooks in 1999!
529 mars 2009Rickard Sandberg, CMB
What parts of genomes are transcribed?
GenbankExpressed Sequence TagsSequenced mRNAsSAGE
Microarray technologies
Deep RNA sequencing
629 mars 2009Rickard Sandberg, CMB
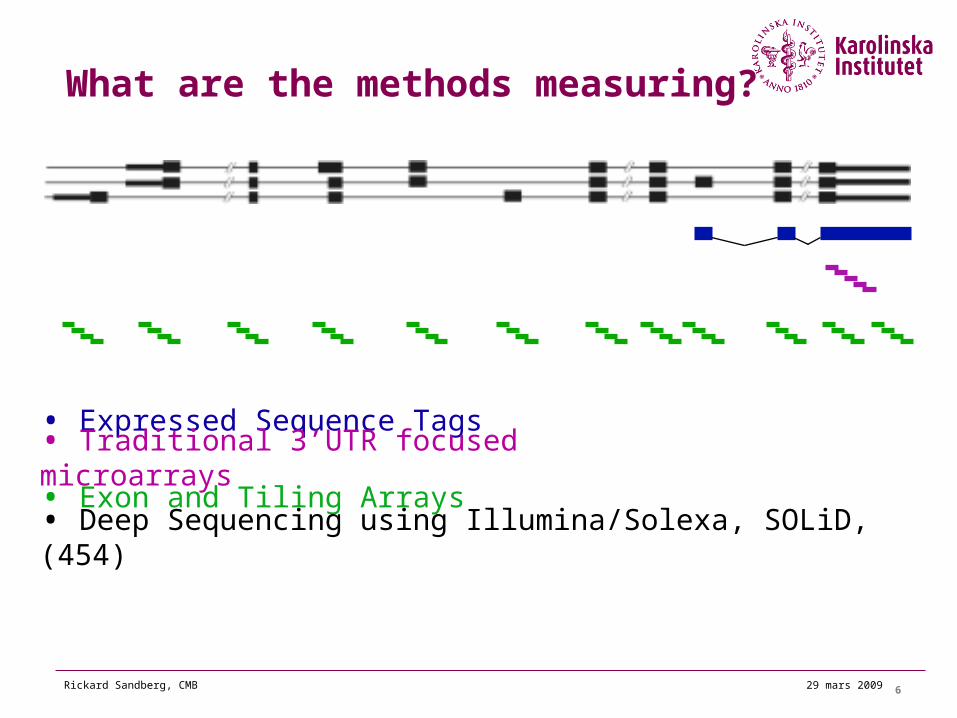
What are the methods measuring?
• Expressed Sequence Tags• Traditional 3’UTR focused microarrays• Exon and Tiling Arrays• Deep Sequencing using Illumina/Solexa, SOLiD, (454)
729 mars 2009Rickard Sandberg, CMB
Gene Expression - Microarrays
Repositories of raw and processed data:Gene Expression Omnibus (GEO)
http://www.ncbi.nlm.nih.gov/geo/ArrayExpress
http://www.ebi.ac.uk/microarray-as/ae/
Databases with Gene Expression AtlasesHuman, Mouse and Rat Tissue Atlas
Symatlas / BioGPShttp://biogps.gnf.org/
829 mars 2009Rickard Sandberg, CMB
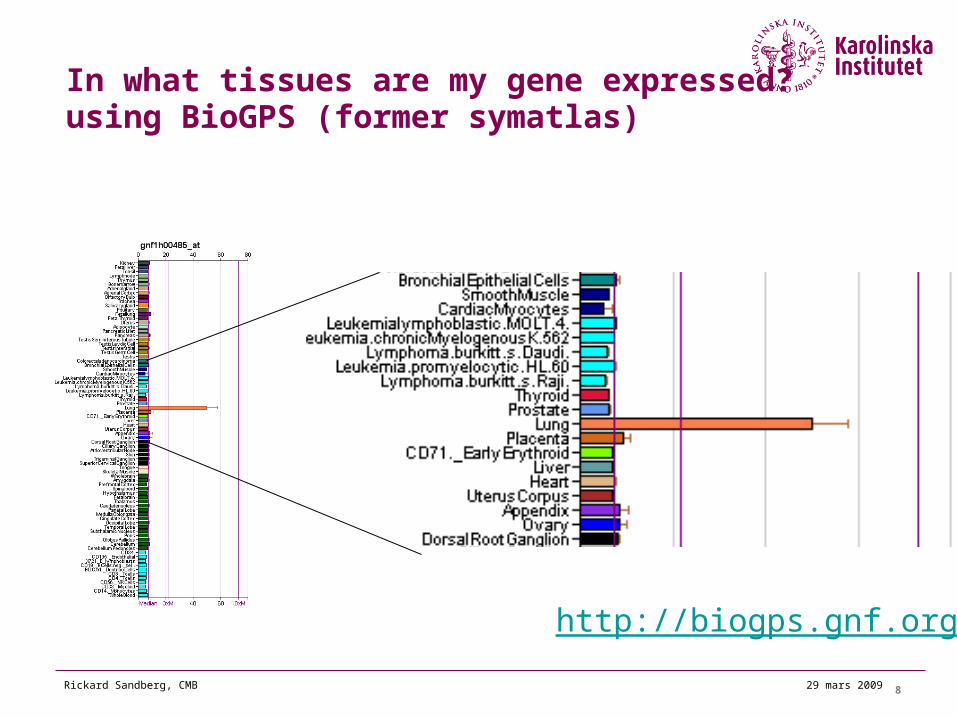
In what tissues are my gene expressed?using BioGPS (former symatlas)
http://biogps.gnf.org/
929 mars 2009Rickard Sandberg, CMB
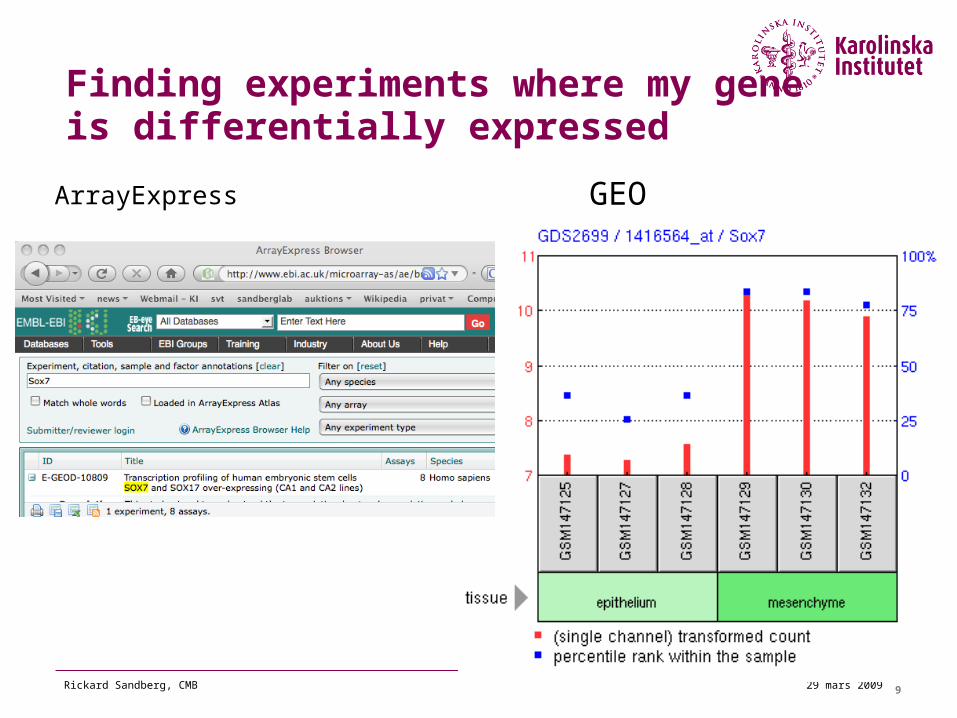
Finding experiments where my gene is differentially expressed
ArrayExpress GEO
10
29 mars 2009Rickard Sandberg, CMB
Important Considerations
Microarrays where designed based on EST-clusters Probes mapping at multiple locations Multiple probe sets mapping to the same gene
Many projects curated microarray probes to only allow for uniquely mapping ones, e.g. customCDF
http://brainarray.mbni.med.umich.edu/Brainarray/Database/CustomCDF/genomic_curated_CDF.asp
11
29 mars 2009Rickard Sandberg, CMB
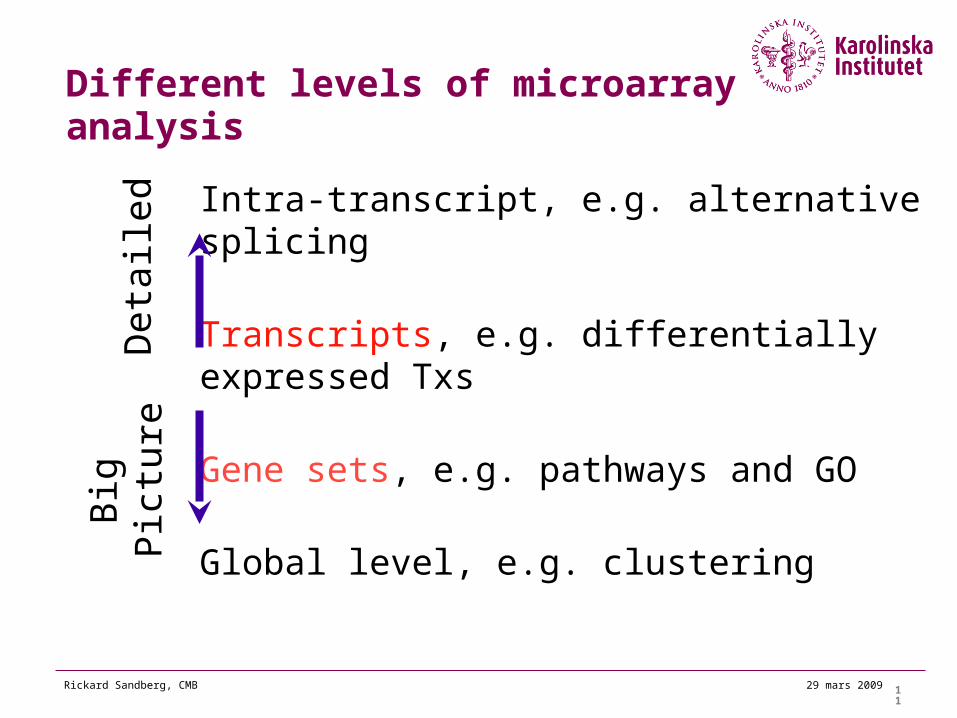
Different levels of microarray analysis
Intra-transcript, e.g. alternative splicing
Transcripts, e.g. differentially expressed Txs
Gene sets, e.g. pathways and GO
Global level, e.g. clustering
Deta
iled
Big
Pic
ture
12
29 mars 2009Rickard Sandberg, CMB
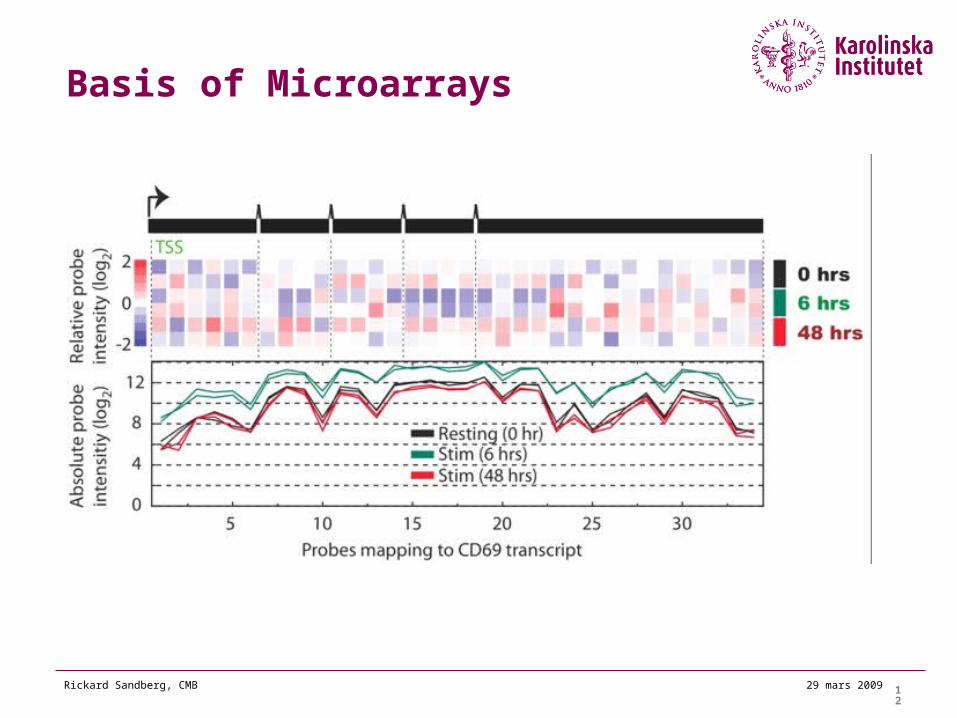
Basis of Microarrays
13
29 mars 2009Rickard Sandberg, CMB
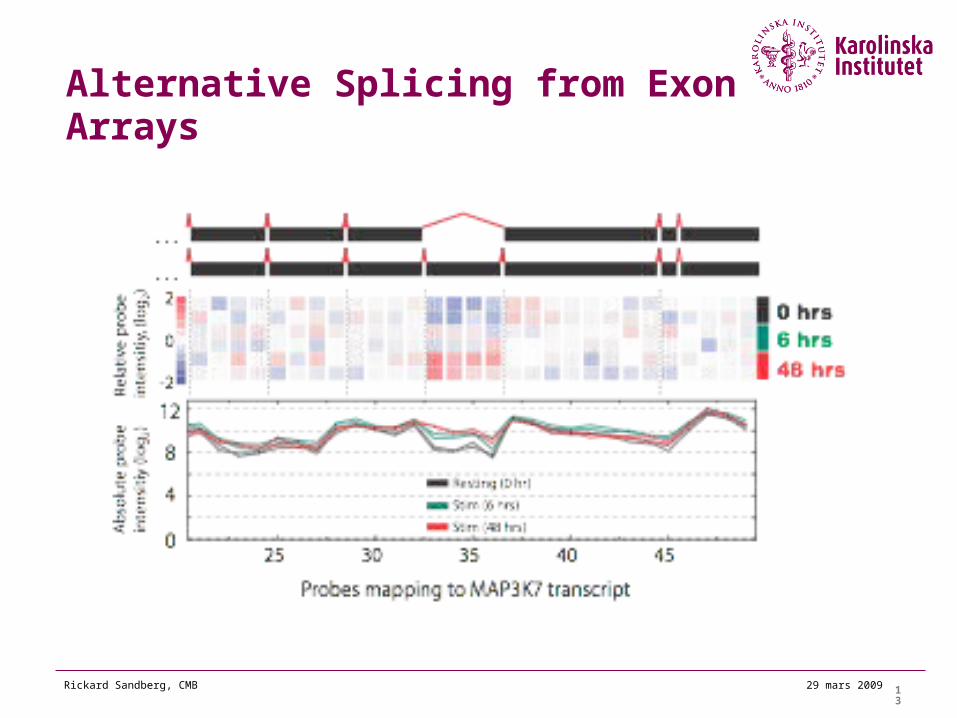
Alternative Splicing from Exon Arrays
14
29 mars 2009Rickard Sandberg, CMB
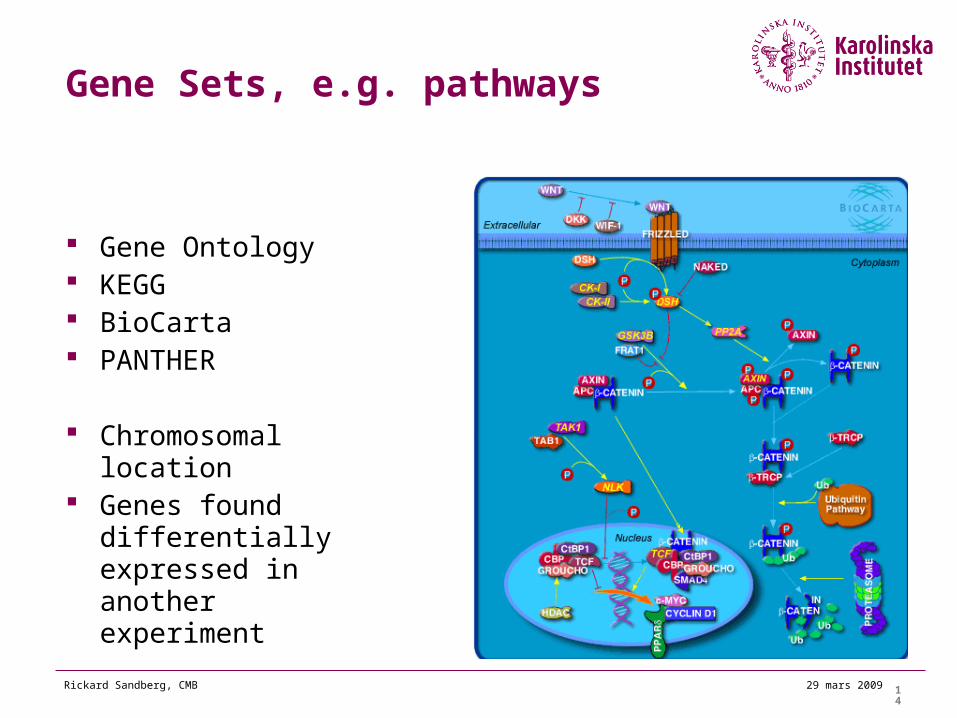
Gene Sets, e.g. pathways
Gene Ontology KEGG BioCarta PANTHER
Chromosomal location
Genes found differentially expressed in another experiment
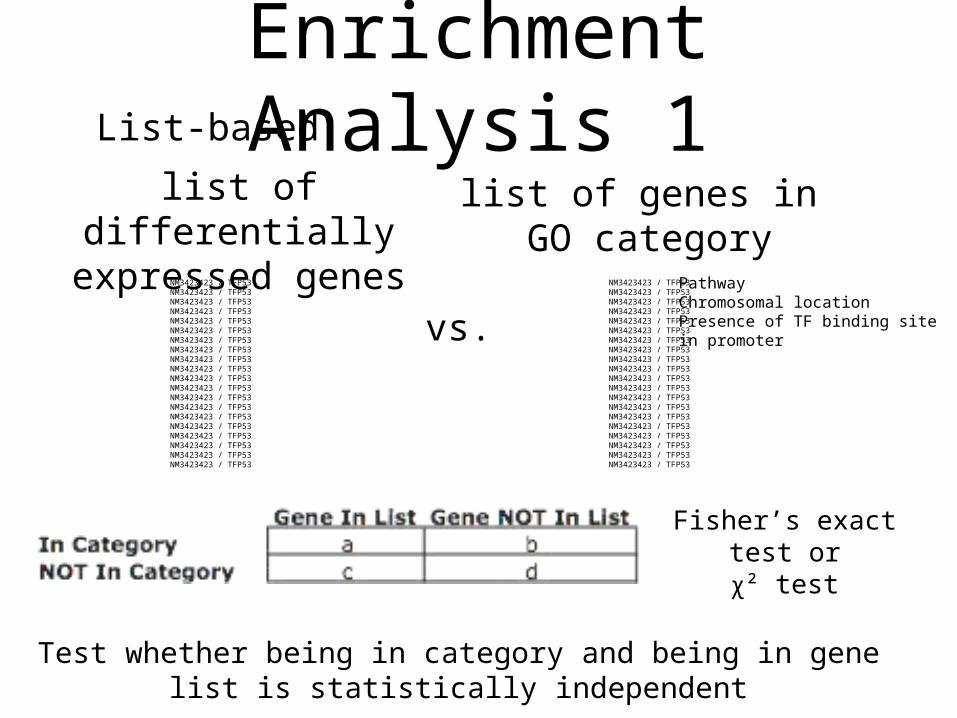
Enrichment Analysis 1List-based
NM3423423 / TFP53NM3423423 / TFP53NM3423423 / TFP53NM3423423 / TFP53NM3423423 / TFP53NM3423423 / TFP53NM3423423 / TFP53NM3423423 / TFP53NM3423423 / TFP53NM3423423 / TFP53NM3423423 / TFP53NM3423423 / TFP53NM3423423 / TFP53NM3423423 / TFP53NM3423423 / TFP53NM3423423 / TFP53NM3423423 / TFP53NM3423423 / TFP53NM3423423 / TFP53NM3423423 / TFP53
list of differentially expressed genes
NM3423423 / TFP53NM3423423 / TFP53NM3423423 / TFP53NM3423423 / TFP53NM3423423 / TFP53NM3423423 / TFP53NM3423423 / TFP53NM3423423 / TFP53NM3423423 / TFP53NM3423423 / TFP53NM3423423 / TFP53NM3423423 / TFP53NM3423423 / TFP53NM3423423 / TFP53NM3423423 / TFP53NM3423423 / TFP53NM3423423 / TFP53NM3423423 / TFP53NM3423423 / TFP53NM3423423 / TFP53
list of genes in GO category
vs.
Fisher’s exact test or
χ² test
Test whether being in category and being in gene list is statistically independent
PathwayChromosomal locationPresence of TF binding sitein promoter
What threshold to use?
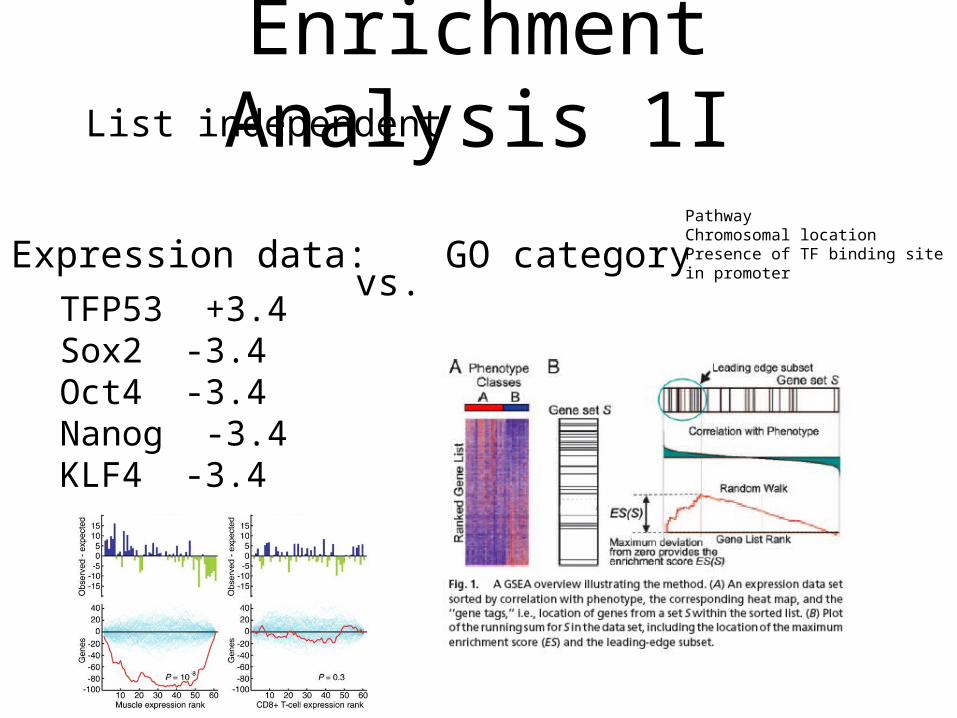
Enrichment Analysis 1IList independent
GO categoryvs.
PathwayChromosomal locationPresence of TF binding sitein promoter
TFP53 +3.4Sox2 -3.4Oct4 -3.4Nanog -3.4KLF4 -3.4
Expression data:
18
29 mars 2009Rickard Sandberg, CMB
Gene Ontology analyses
Note: Background matterschoosing the wrong background set of genes may affect/confound your results
List-dependente.g. DAVID, http://david.abcc.ncifcrf.gov/
List-independent methodse.g. GSEA, http://www.broad.mit.edu/gsea/
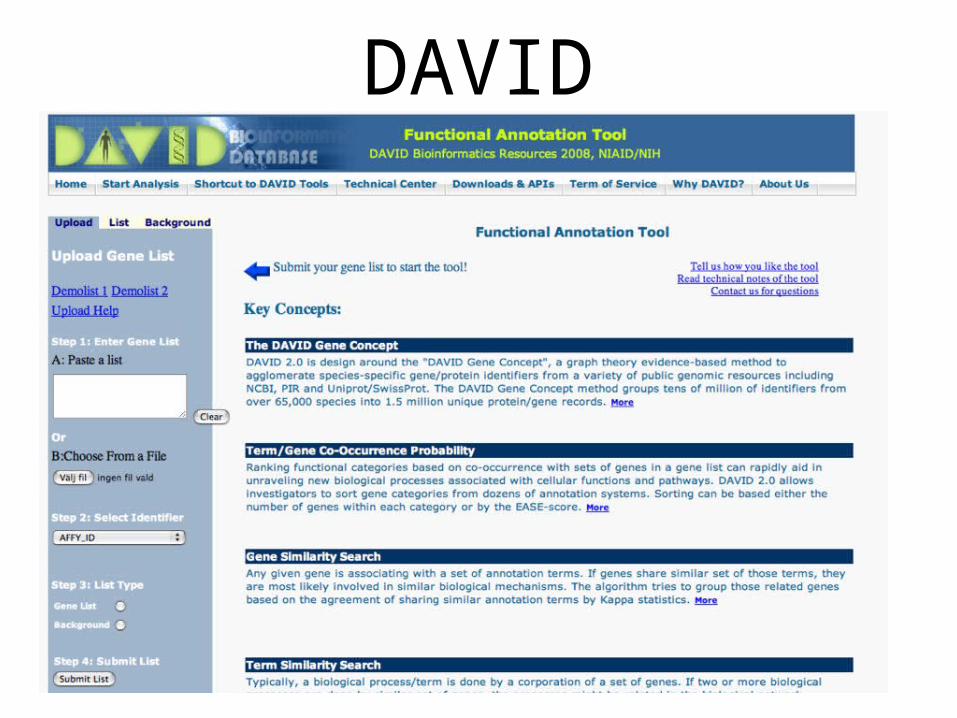
DAVID
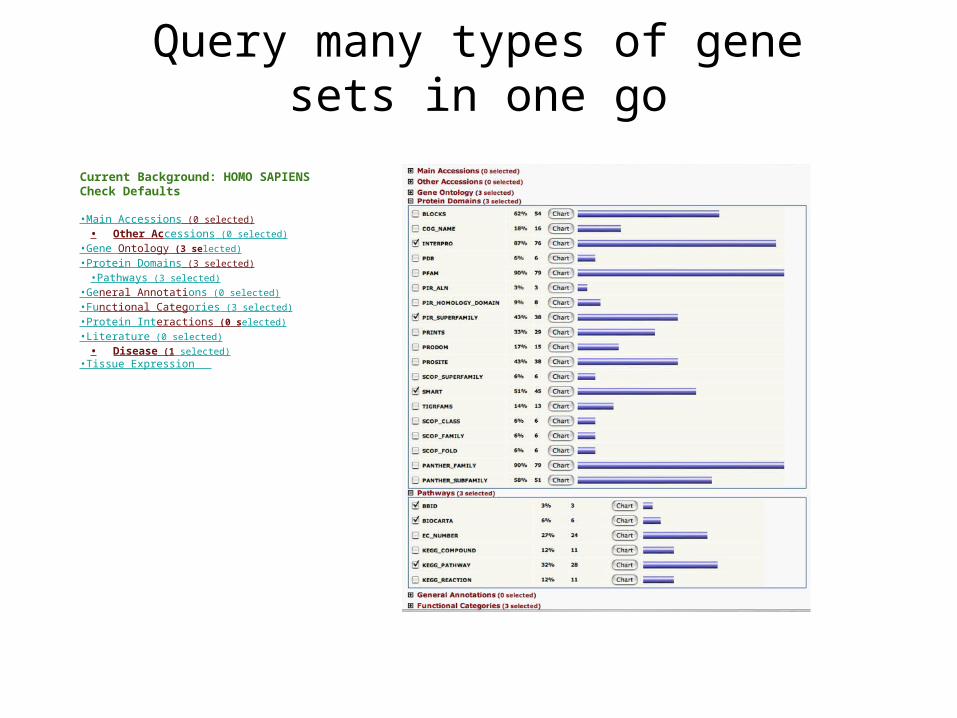
Query many types of gene sets in one go
Current Background: HOMO SAPIENSCheck Defaults
•Main Accessions (0 selected)• Other Accessions (0 selected)
•Gene Ontology (3 selected)•Protein Domains (3 selected)
•Pathways (3 selected)•General Annotations (0 selected)•Functional Categories (3 selected)•Protein Interactions (0 selected)•Literature (0 selected)
• Disease (1 selected)•Tissue Expression
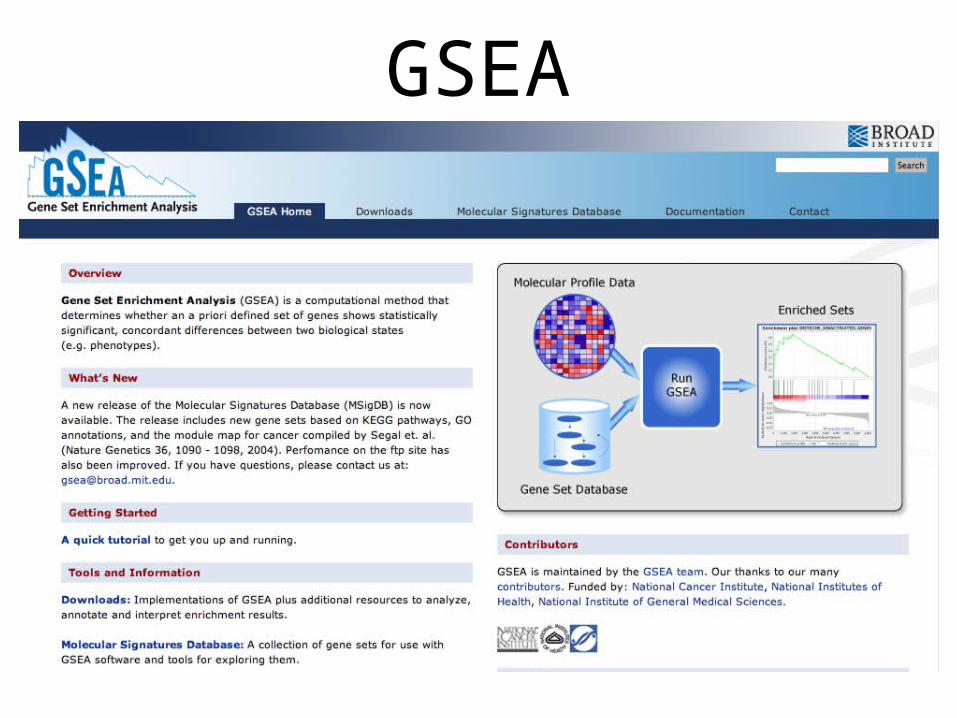
GSEA
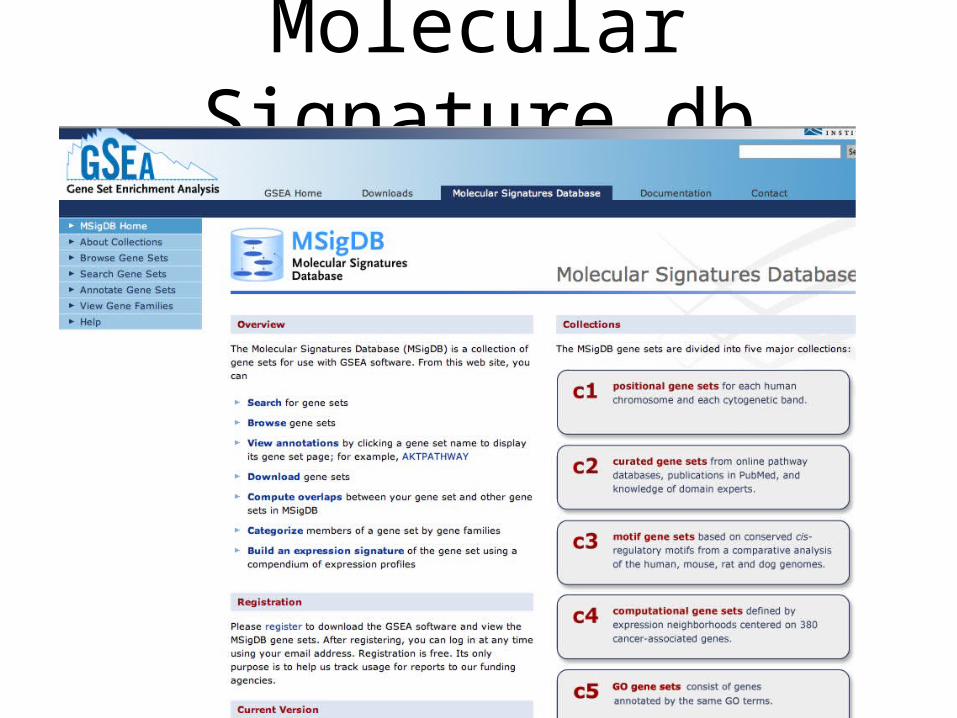
Molecular Signature db
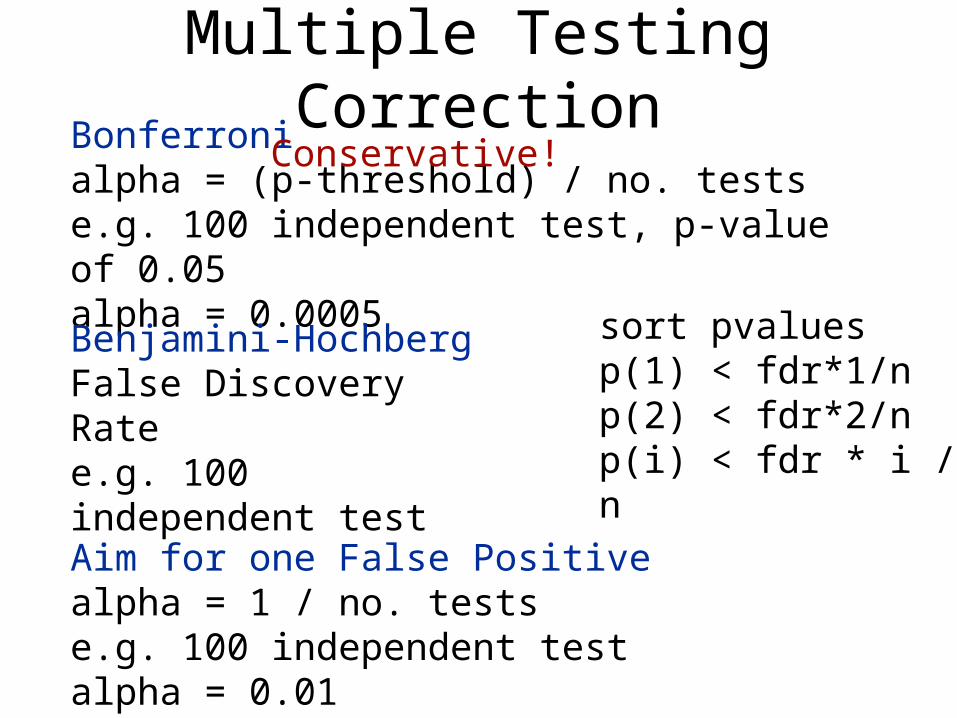
Multiple Testing CorrectionBonferroni
alpha = (p-threshold) / no. testse.g. 100 independent test, p-value of 0.05alpha = 0.0005
Conservative!
Benjamini-HochbergFalse Discovery Rate e.g. 100 independent test
Aim for one False Positivealpha = 1 / no. testse.g. 100 independent testalpha = 0.01
sort pvaluesp(1) < fdr*1/np(2) < fdr*2/np(i) < fdr * i / n
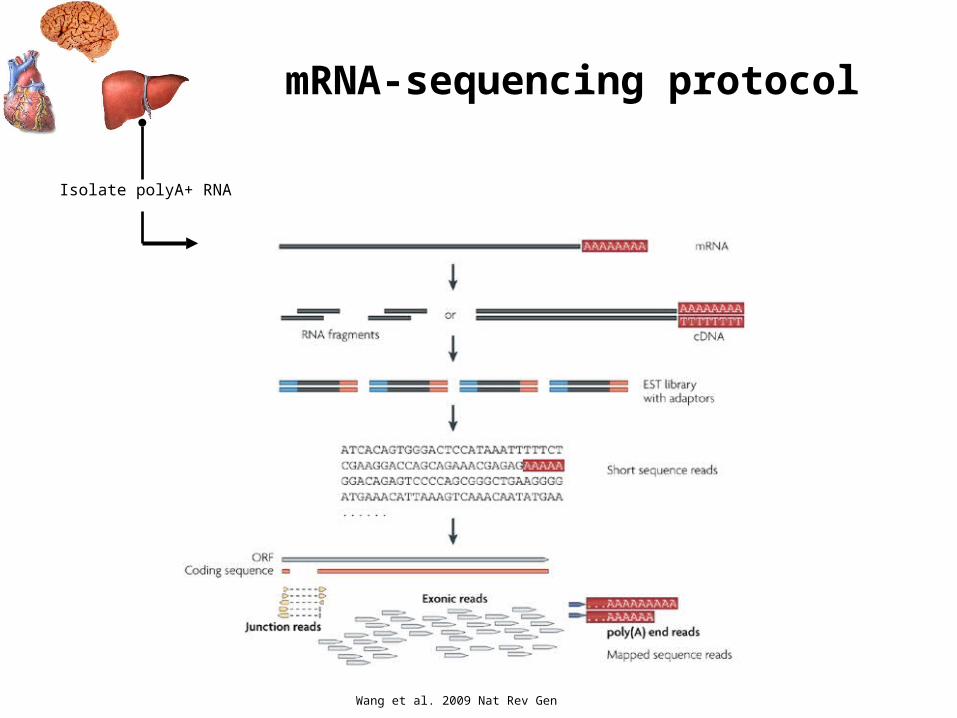
Isolate polyA+ RNA
mRNA-sequencing protocol
Wang et al. 2009 Nat Rev Gen
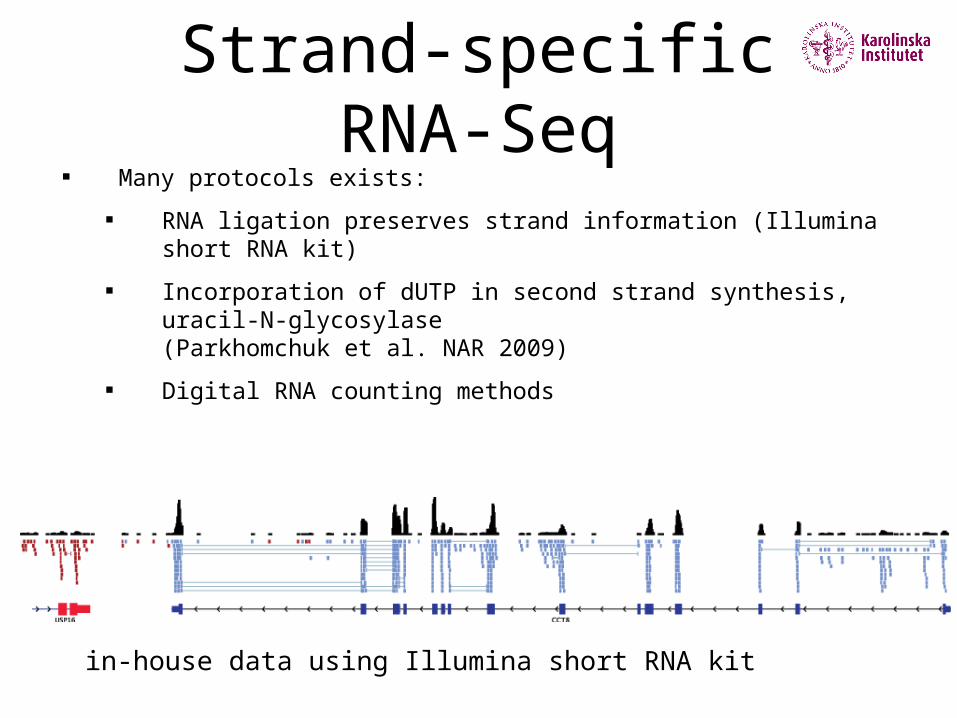
Strand-specific RNA-Seq
Many protocols exists:
RNA ligation preserves strand information (Illumina short RNA kit)
Incorporation of dUTP in second strand synthesis, uracil-N-glycosylase (Parkhomchuk et al. NAR 2009)
Digital RNA counting methods
in-house data using Illumina short RNA kit
Mapping of splice junctions
Compilation of known and putative junctions
More sensitive, relies on existing annotations
De novo splice junction identification
Unbiased, long introns, trans-splicing, computationally expensive
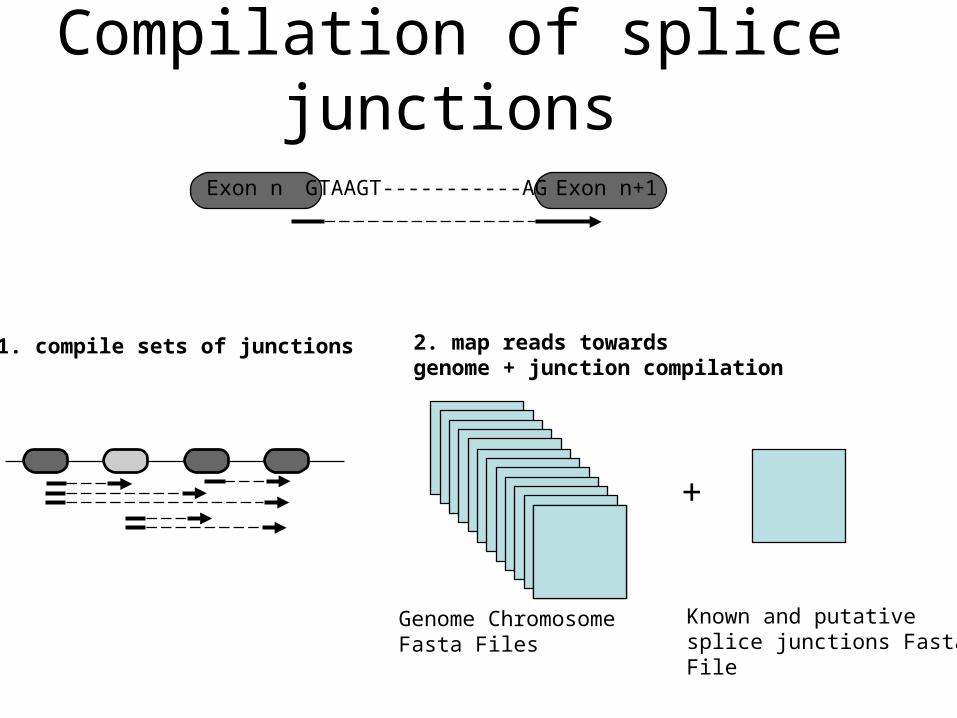
Genome Chromosome Fasta Files
+
Known and putative splice junctions Fasta File
2. map reads towardsgenome + junction compilation
GTAAGT-----------AG Exon n+1
1. compile sets of junctions
Exon n
Compilation of splice junctions
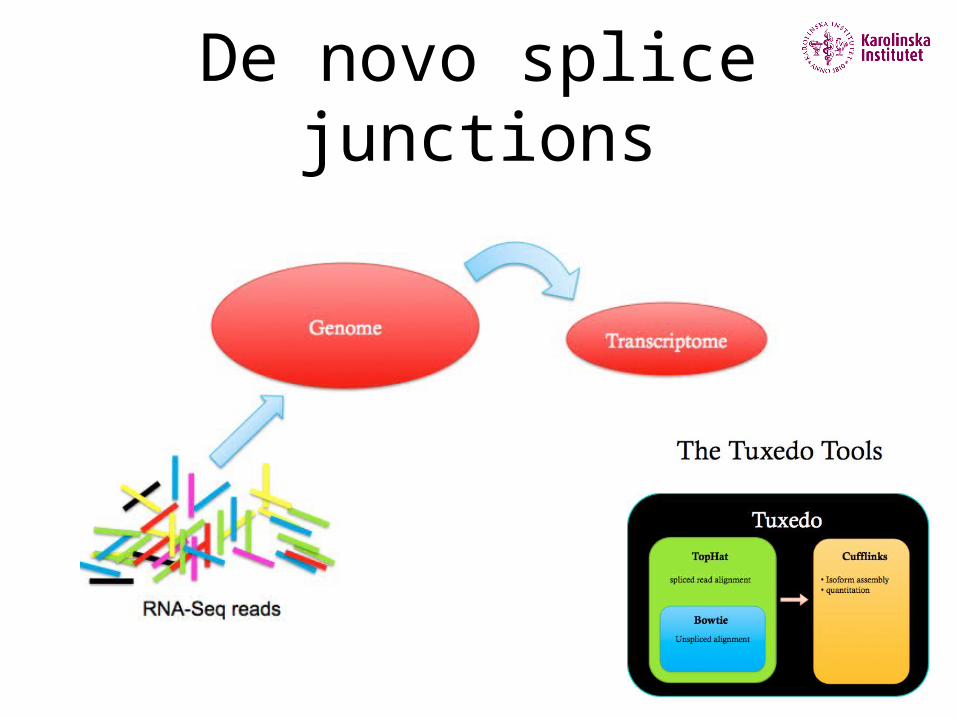
De novo splice junctions
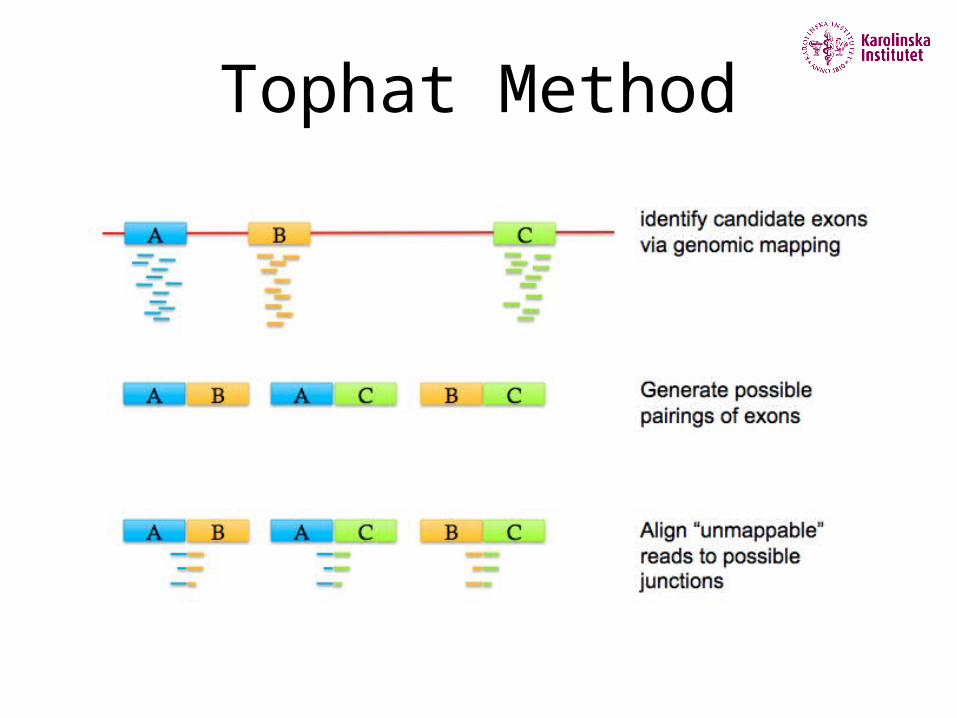
Tophat Method
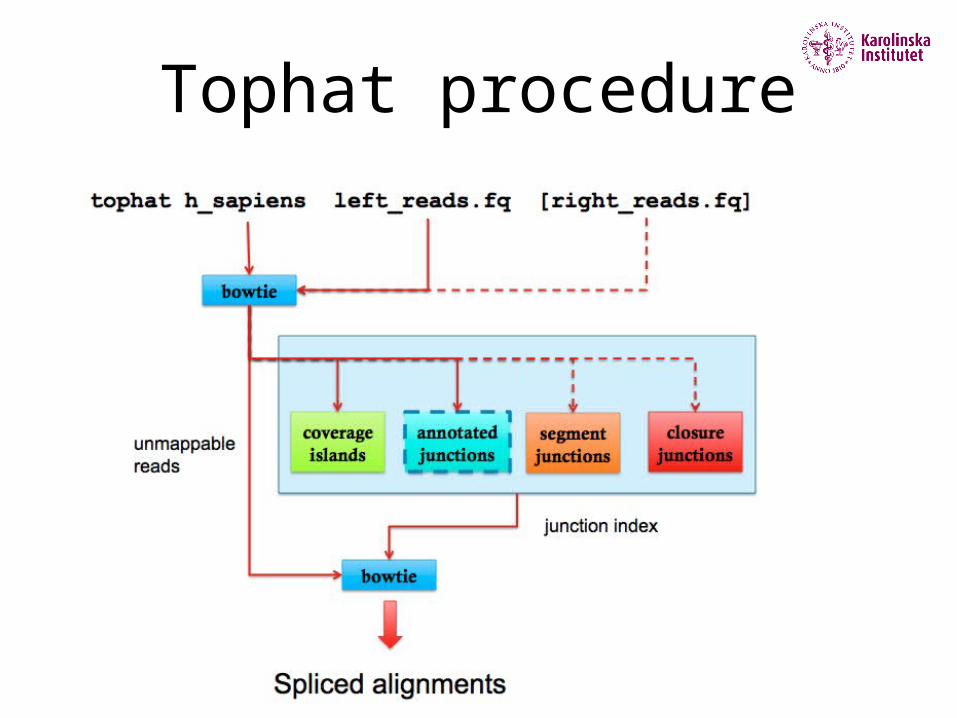
Tophat procedure
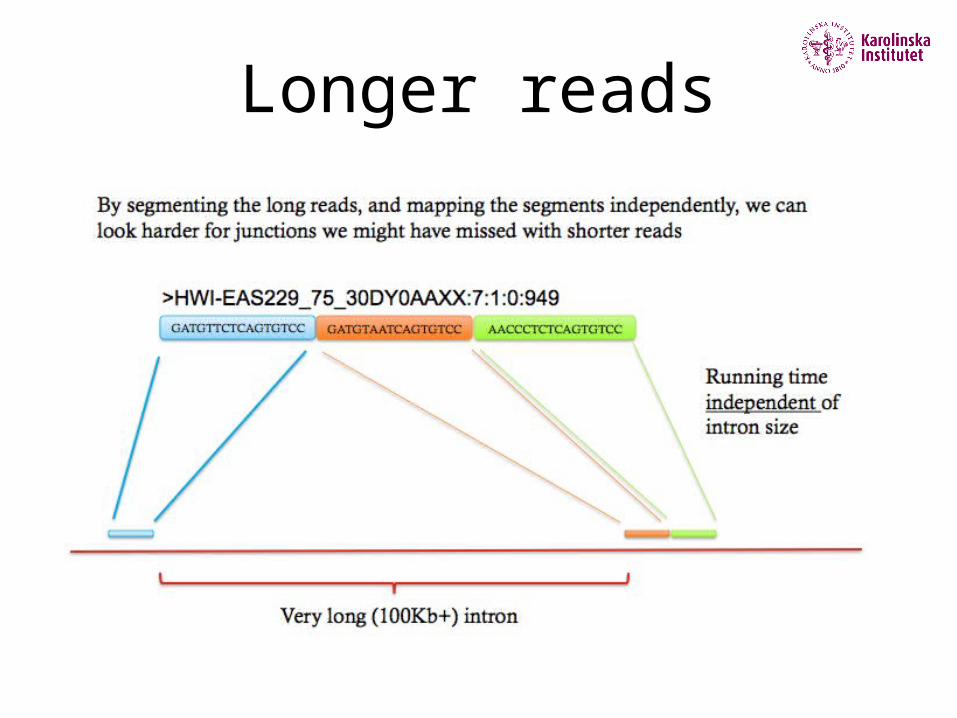
Longer reads
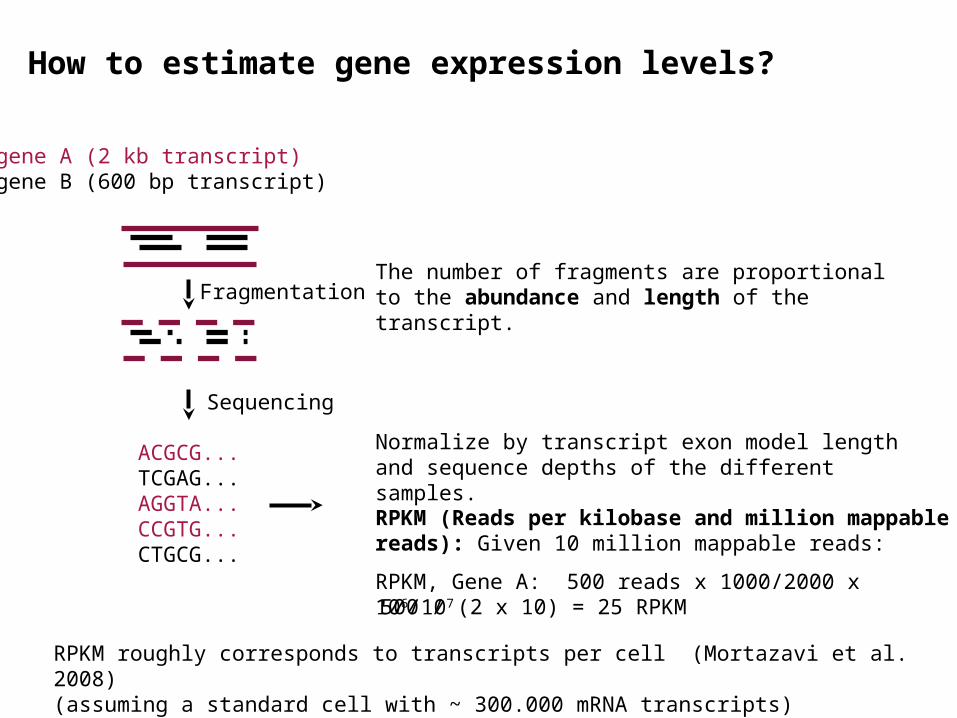
How to estimate gene expression levels?
gene A (2 kb transcript)gene B (600 bp transcript)
ACGCG...TCGAG...AGGTA...CCGTG...CTGCG...
Sequencing
FragmentationThe number of fragments are proportional to the abundance and length of the transcript.
Normalize by transcript exon model length and sequence depths of the different samples.
RPKM (Reads per kilobase and million mappable reads): Given 10 million mappable reads:
RPKM, Gene A: 500 reads x 1000/2000 x 106/107
500 / (2 x 10) = 25 RPKM
RPKM roughly corresponds to transcripts per cell (Mortazavi et al. 2008)(assuming a standard cell with ~ 300.000 mRNA transcripts)
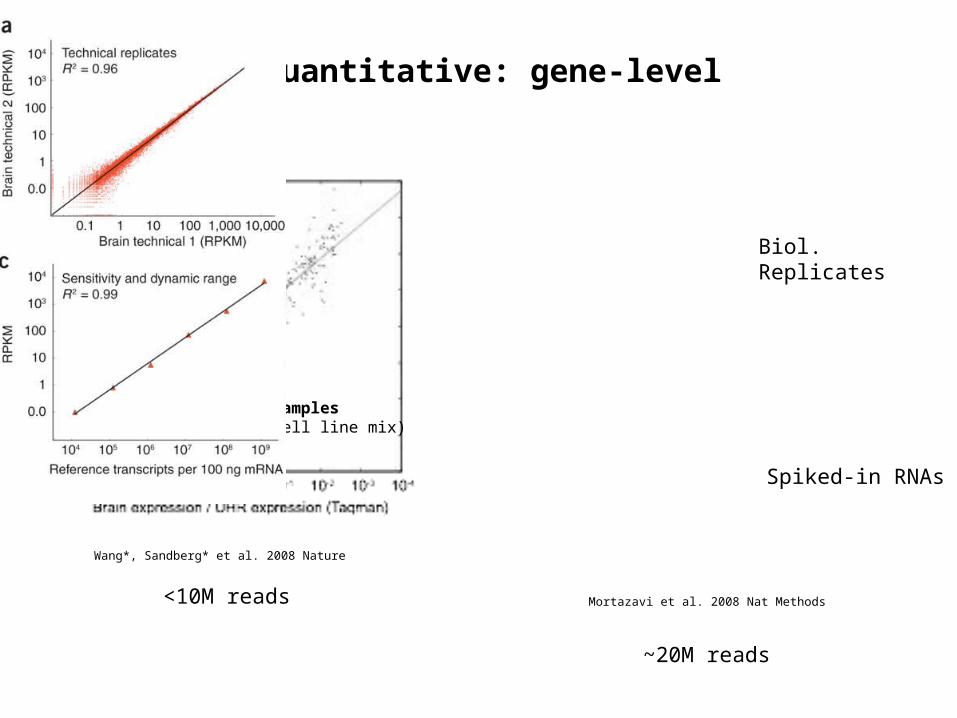
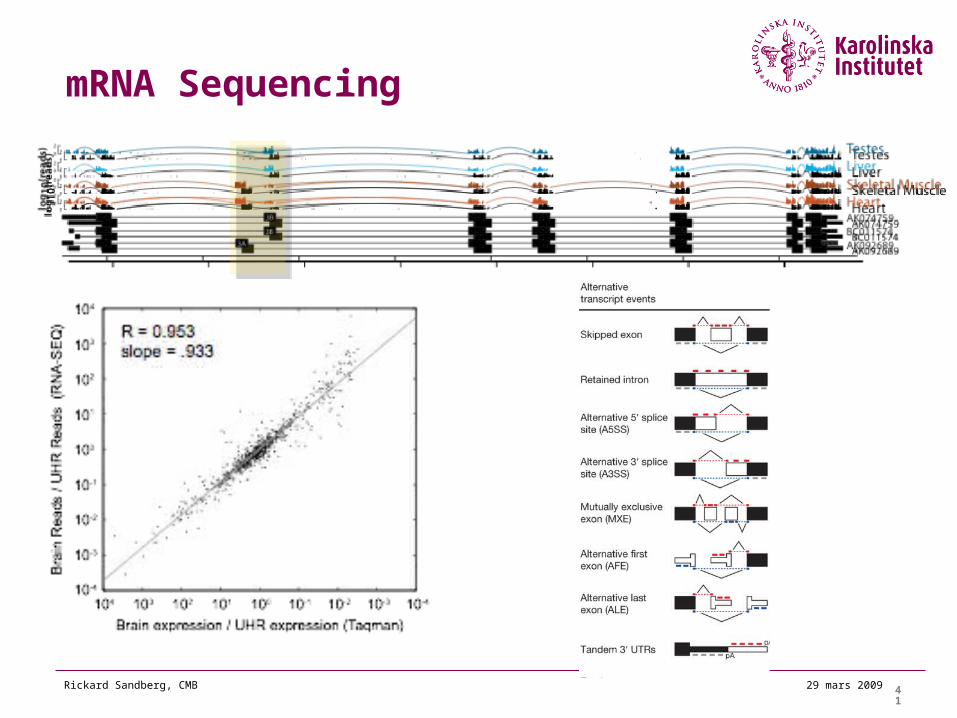
MAQC samplesUHR (cell line mix)Brain
mRNA-SEQ is quantitative: gene-level
Wang*, Sandberg* et al. 2008 Nature
Mortazavi et al. 2008 Nat Methods
Spiked-in RNAs
Biol. Replicates
<10M reads
~20M reads
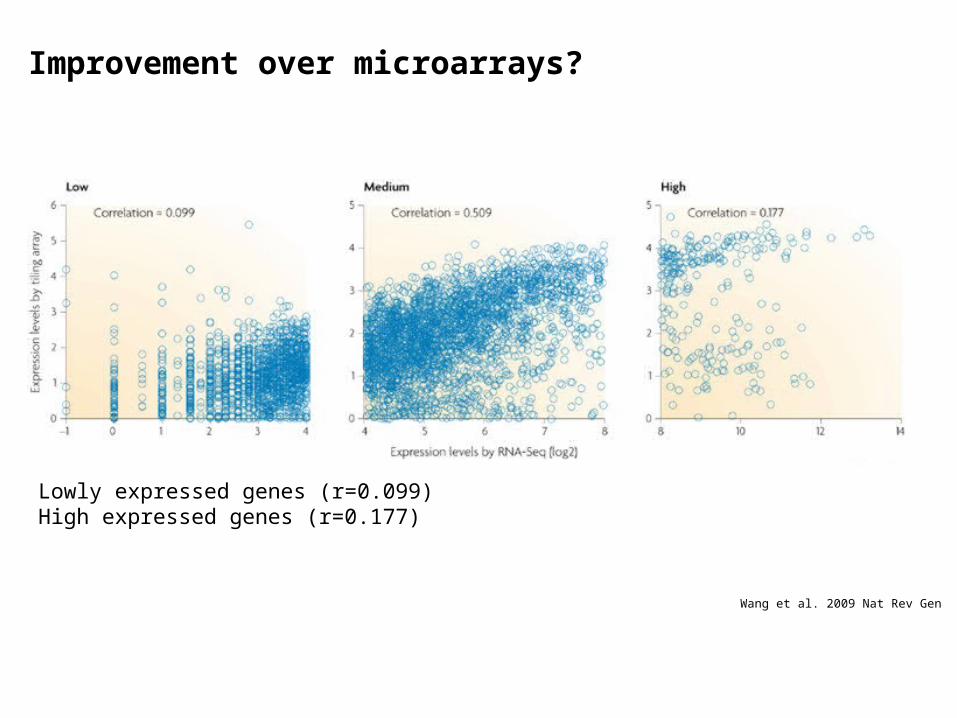
Wang et al. 2009 Nat Rev Gen
Improvement over microarrays?
Lowly expressed genes (r=0.099)High expressed genes (r=0.177)
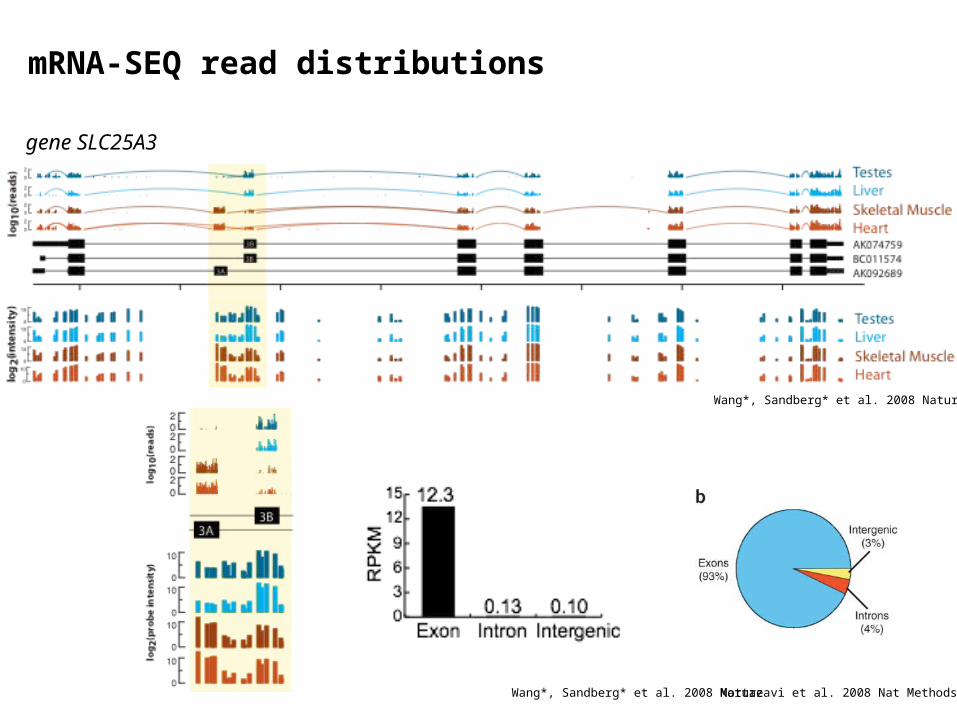
mRNA-SEQ read distributions
gene SLC25A3
Wang*, Sandberg* et al. 2008 Nature
Mortazavi et al. 2008 Nat MethodsWang*, Sandberg* et al. 2008 Nature
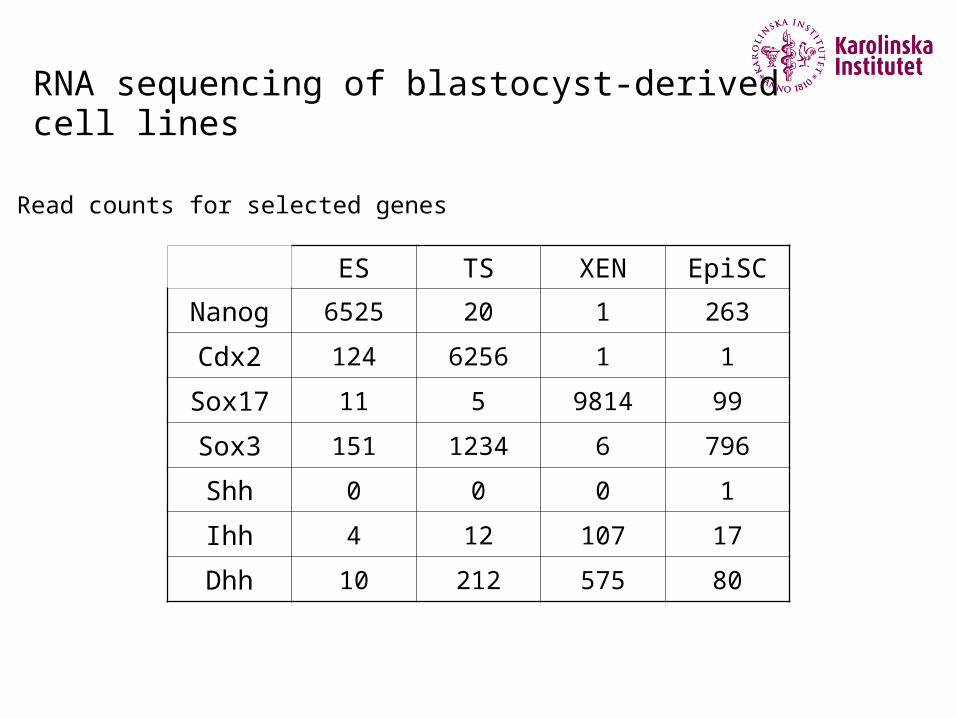
RNA sequencing of blastocyst-derived cell lines
Read counts for selected genes
ES TS XEN EpiSC
Nanog 6525 20 1 263
Cdx2 124 6256 1 1
Sox17 11 5 9814 99
Sox3 151 1234 6 796
Shh 0 0 0 1
Ihh 4 12 107 17
Dhh 10 212 575 80
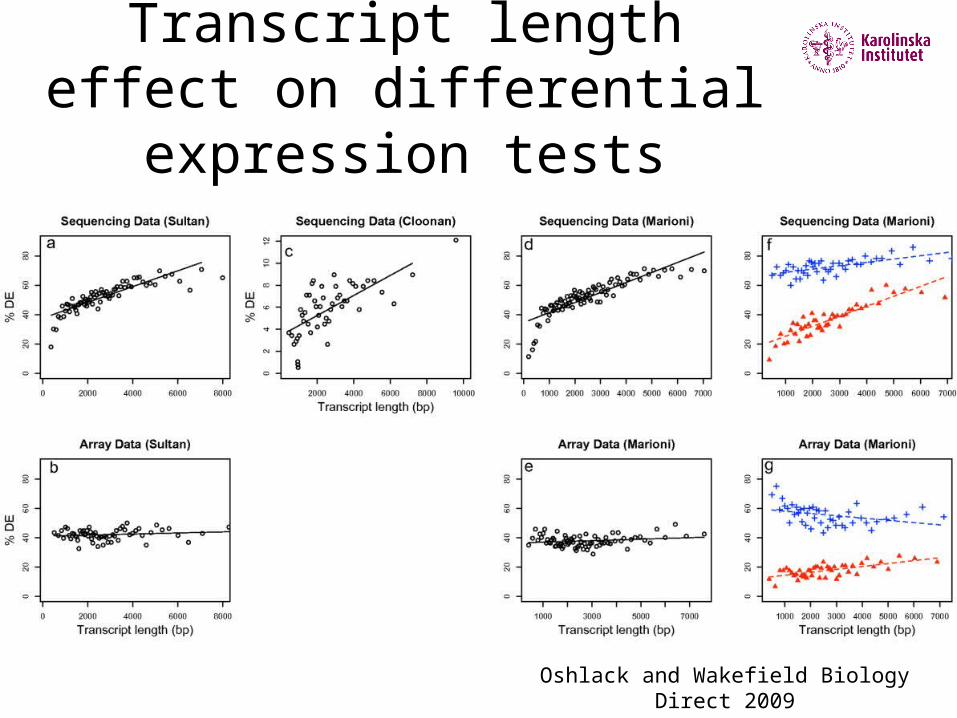
Transcript length effect on differential expression tests
Oshlack and Wakefield Biology Direct 2009
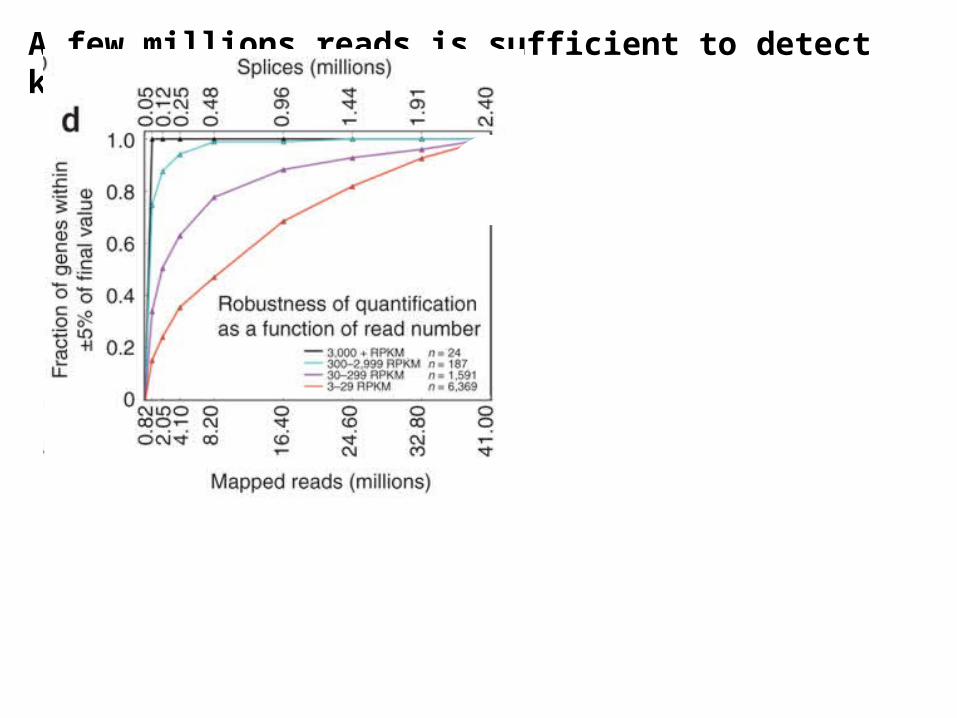
A few millions reads is sufficient to detect known mRNA transcripts
39
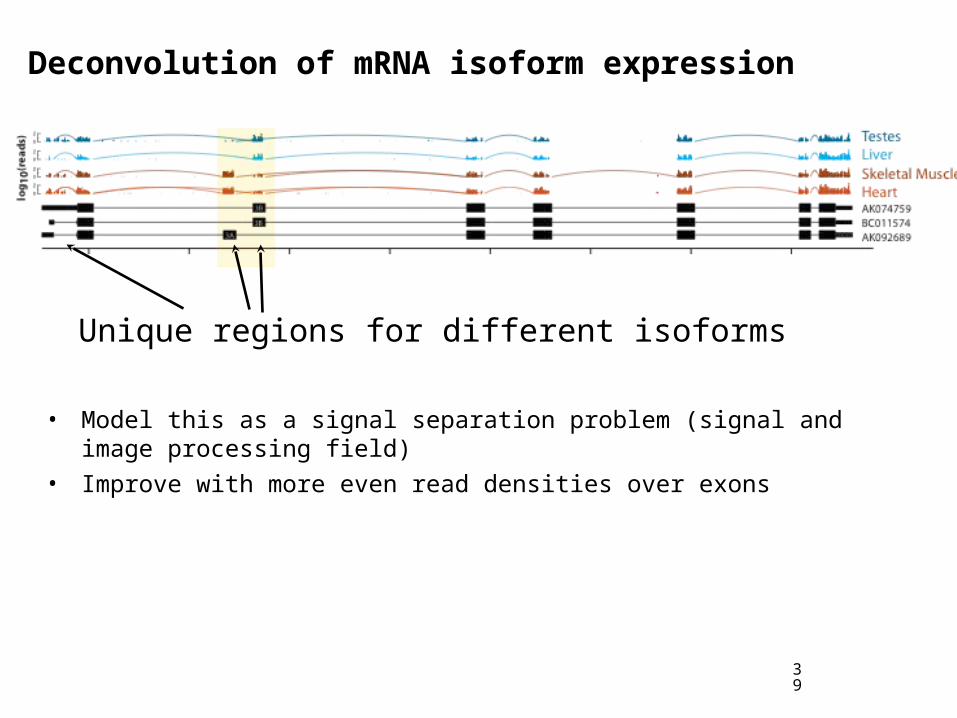
• Model this as a signal separation problem (signal and image processing field)
• Improve with more even read densities over exons
Deconvolution of mRNA isoform expression
Unique regions for different isoforms
Conclusions
• RNA-seq enables genome-wide transcriptome quantification with more accurate and absolute expression estimates
• Low background enables quantification of lowly expressed transcripts (~1 copy per cell)
• Investigate alternative promoters, splicing and polyadenylation, non-coding RNAs
41
29 mars 2009Rickard Sandberg, CMB
mRNA Sequencing
42
29 mars 2009Rickard Sandberg, CMB
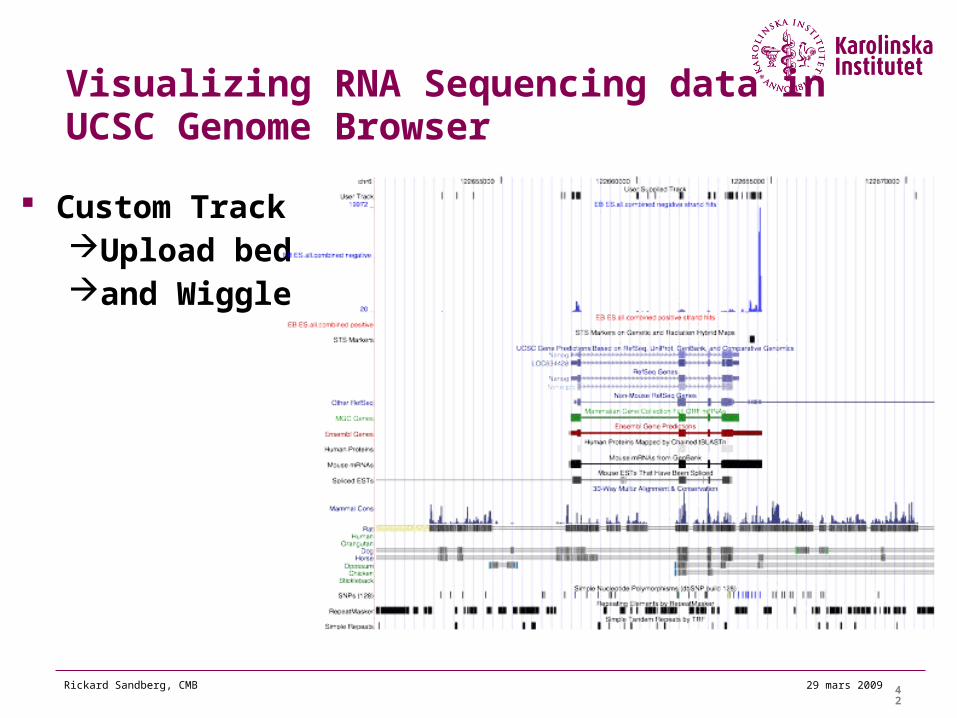
Visualizing RNA Sequencing data in UCSC Genome Browser
Custom TrackUpload bedand Wiggle
43
29 mars 2009Rickard Sandberg, CMB
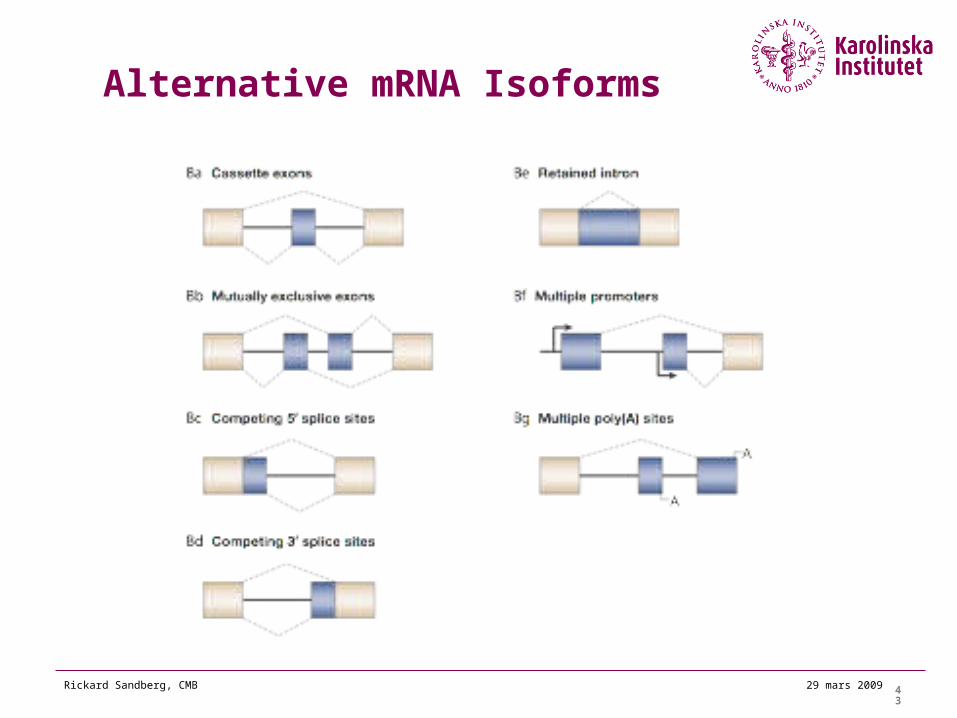
Alternative mRNA Isoforms
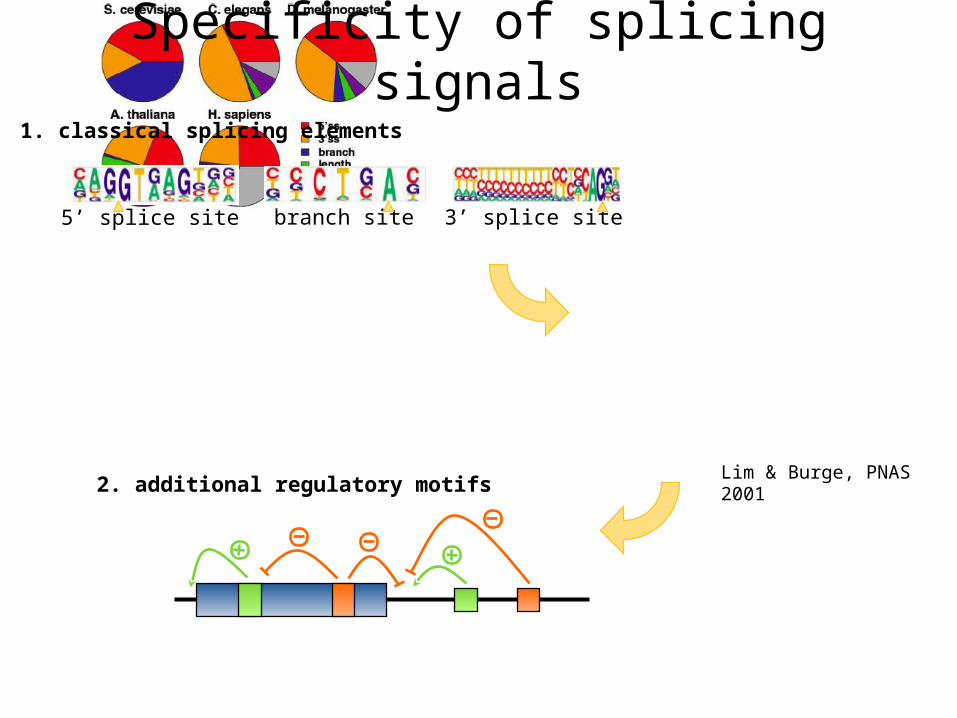
2. additional regulatory motifs
5’ splice site branch site 3’ splice site
Specificity of splicing signals1. classical splicing elements
Lim & Burge, PNAS 2001
3’ UTR
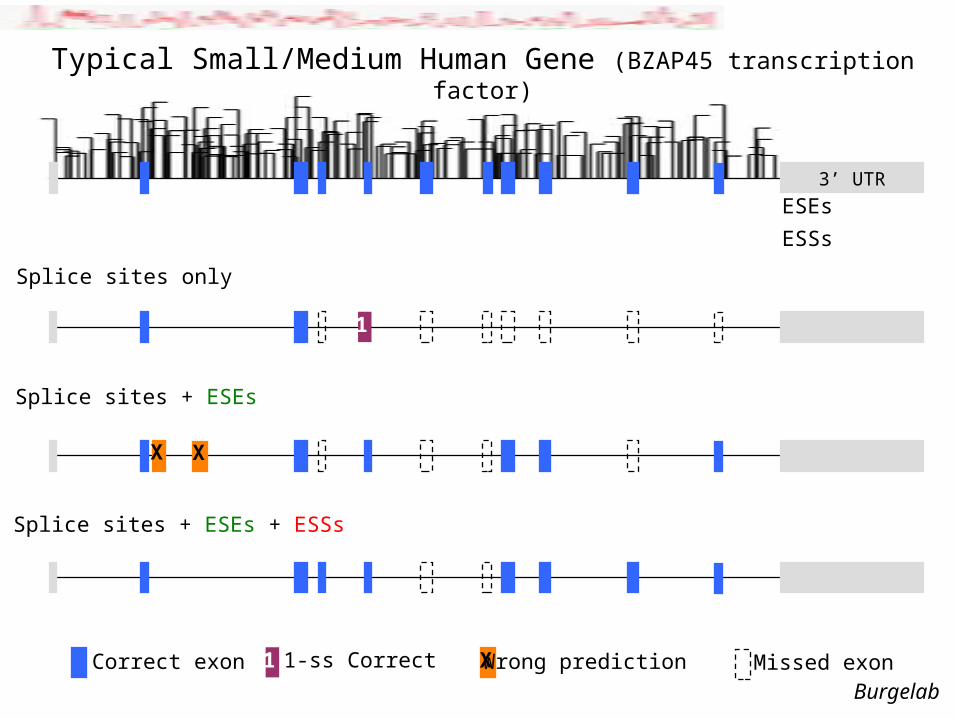
Correct exon
Splice sites + ESEs + ESSs
Typical Small/Medium Human Gene (BZAP45 transcription factor)
Splice sites + ESEs
XX
Wrong predictionX
ESEs
ESSs
Missed exon
Splice sites only
1
1 1-ss Correct
Burgelab
46
29 mars 2009Rickard Sandberg, CMB
Conclusions
Lots of experiments already done using microarrays
Statistical issues with genome-wide experiments
RNA-Sequencing is more quantitative and better suited for detecting mRNA isoforms
Computational predictions of splicing is still limited