Embed Size (px)
Citation preview
General Session IVUtilizing Big Data to Better Understand
Environment-related Research:Analytics and Genomic Health Disparities

JOIN OUR SOCIAL MEDIA DISCUSSIONS
#XUDisparitiesCollabs
Accreditation
Participation in this activity earns 1.50 contact hours. To receive credit, participants must complete an evaluation form at the
end of this session.
UAN: 0024-0000-17-006-L04-P

DISCLOSURE STATEMENTSpeakers for this session have nothing to disclose. Any updates
in disclosure will be made from the podium.

Michael A. Langston, PhDSPEAKER
Health Disparities Research: The Role of Big Data and Scalable Combinatorial Methods in
Latent Relationship Discovery
Xavier University of Louisiana College of PharmacyTenth Health Disparities Conference
Michael A. LangstonProfessor
Electrical Engineering and Computer ScienceUniversity of Tennessee
17 March 2017
55
Historical Perspective
Some have likened the male Fiddler Crab tothe current state of research balance.
Considerable effort has goneinto powerful omics tools.
Relatively little focus has beenshed on the analysis of riskfactors for health disparities.
Christopher P. Wild, Director, Int’lAgency for Research on Cancer
56
Some Things We Have Learned From Omics
The situation is seldom as simple as it seems at first• DNA is not the whole story• tissue types, environments, …
The central dogma is just a starting point• one gene may yield many proteins• then there is post translational modification• and also methylation, chromatin remodeling, …
One needs a “systems” approach• How do biological entities function at all levels of scale?• Linkage, communication, granularity and networks (graphs!)
Even crude tools can be useful• Knock outs, knock ins, knock downs, …• As reverse engineering methods, are they really so sophisticated?
57
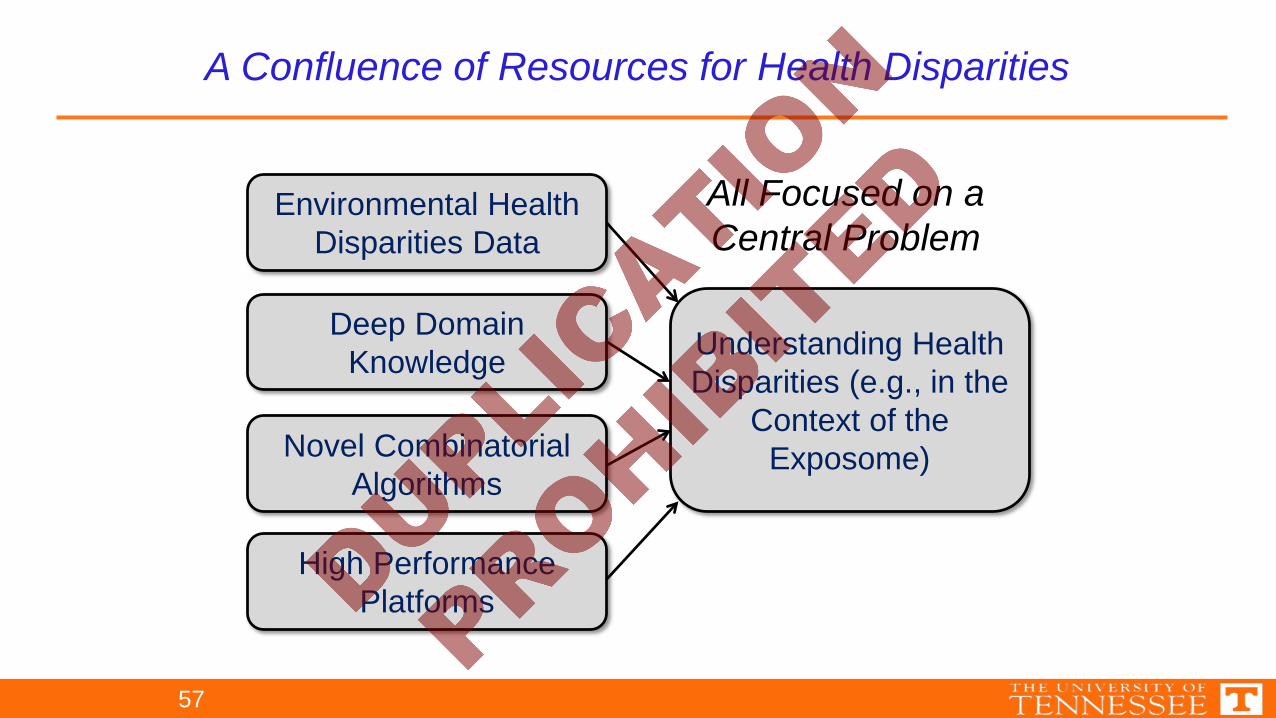
A Confluence of Resources for Health Disparities
Environmental Health Disparities Data
Deep Domain Knowledge
Novel Combinatorial Algorithms
High Performance Platforms
All Focused on a Central Problem
Understanding Health Disparities (e.g., in the
Context of the Exposome)
58
General Approach
Resources unique to the University of Tennessee• Hub for deep work in graph-theoretical algorithms• Home to well-known and widely used software products, such as MPI• Next door to ORNL, with access to leadership-class machines like Titan
Main Research Goal• Uncover relationships deeply hidden within high dimensional data• Exploit cutting-edge graph-theoretical algorithms, coupled with high
performance computing and extensive domain knowledge• Extract signal from noise in so-called real-world big data
Focus on Optimization• Solve computationally recalcitrant (usually NP-hard) problems• Employ mathematical abstraction, computational breakthroughs and extreme
scalability• Distill and extract dense subgraphs and patterns of connectivity• Augment with statistical tools whenever possible
59
General Approach
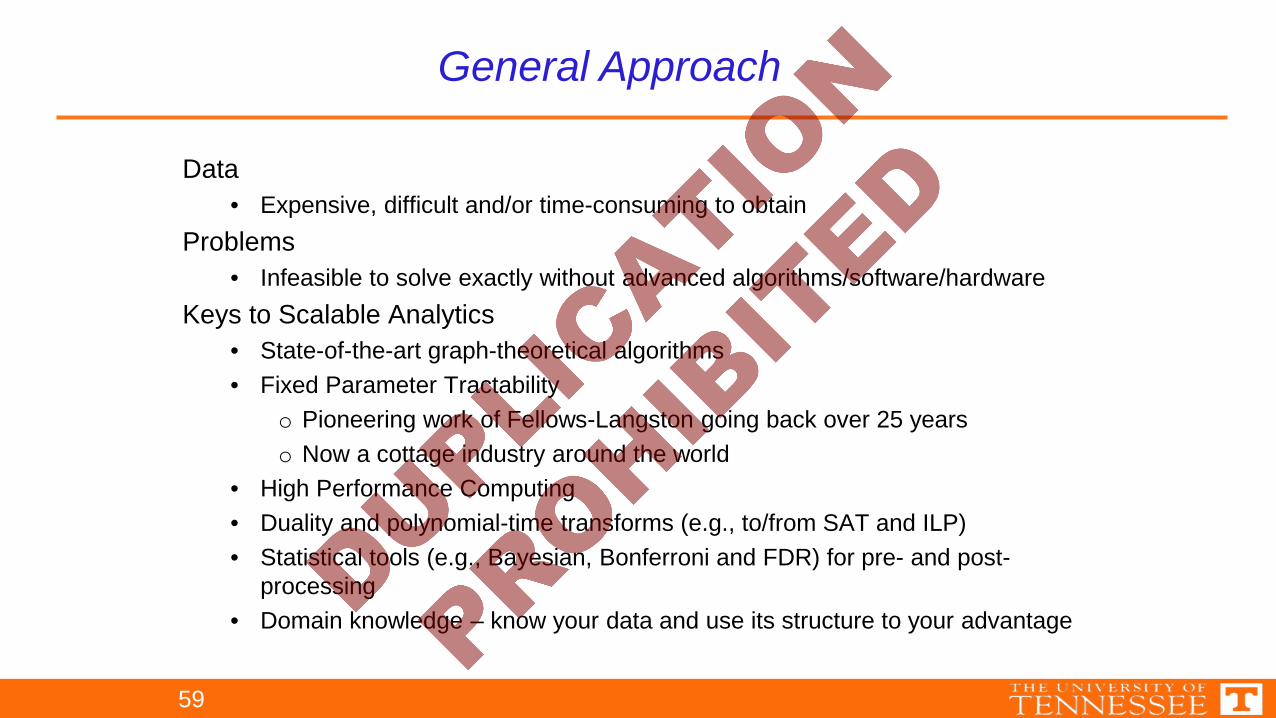
Data• Expensive, difficult and/or time-consuming to obtain
Problems• Infeasible to solve exactly without advanced algorithms/software/hardware
Keys to Scalable Analytics• State-of-the-art graph-theoretical algorithms• Fixed Parameter Tractability
o Pioneering work of Fellows-Langston going back over 25 yearso Now a cottage industry around the world
• High Performance Computing• Duality and polynomial-time transforms (e.g., to/from SAT and ILP)• Statistical tools (e.g., Bayesian, Bonferroni and FDR) for pre- and post-
processing• Domain knowledge – know your data and use its structure to your advantage
60
General Approach
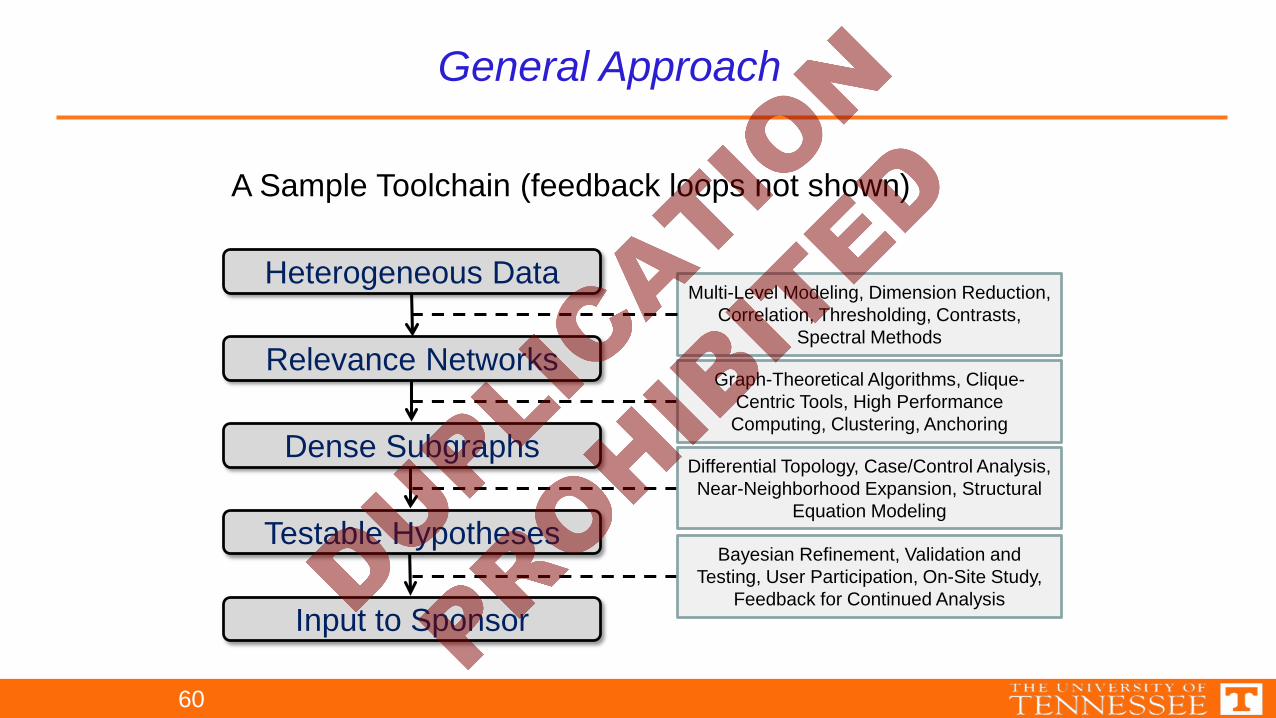
Input to Sponsor
Heterogeneous Data
Relevance Networks
Dense Subgraphs
Testable Hypotheses
Multi-Level Modeling, Dimension Reduction, Correlation, Thresholding, Contrasts,
Spectral Methods
Graph-Theoretical Algorithms, Clique-Centric Tools, High Performance Computing, Clustering, Anchoring
Differential Topology, Case/Control Analysis, Near-Neighborhood Expansion, Structural
Equation Modeling
Bayesian Refinement, Validation and Testing, User Participation, On-Site Study,
Feedback for Continued Analysis
A Sample Toolchain (feedback loops not shown)
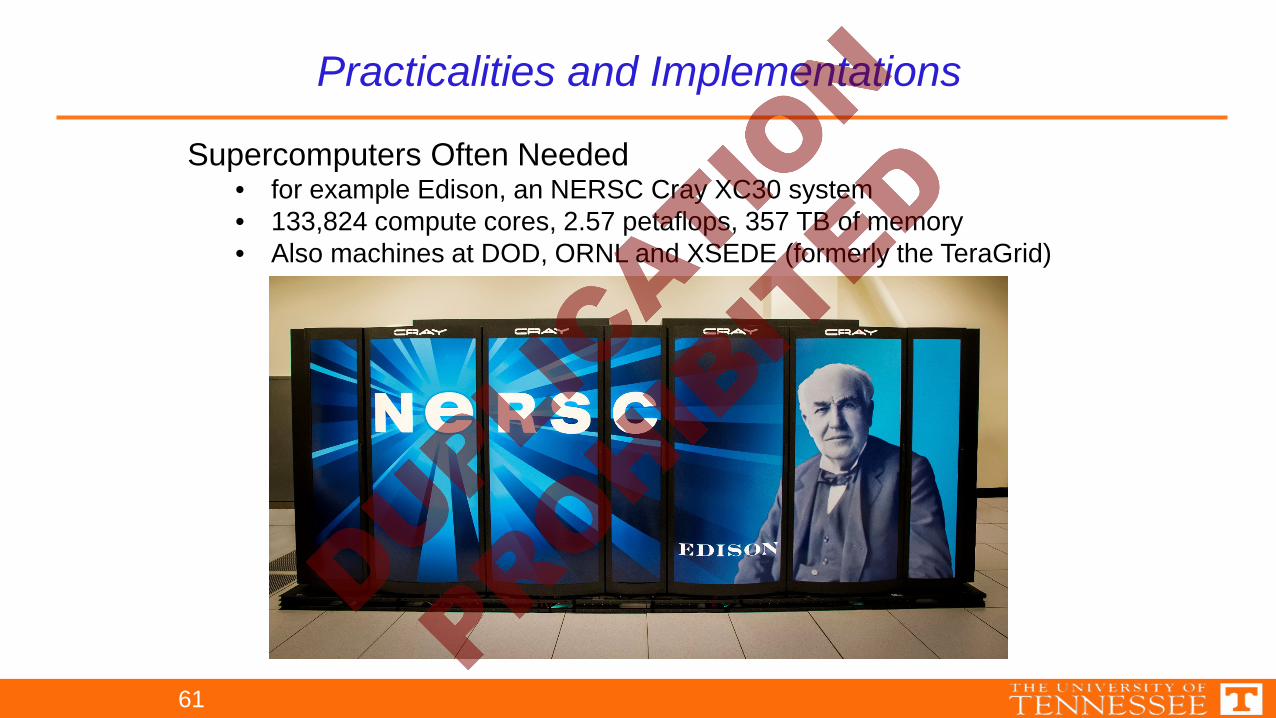
Supercomputers Often Needed• for example Edison, an NERSC Cray XC30 system• 133,824 compute cores, 2.57 petaflops, 357 TB of memory• Also machines at DOD, ORNL and XSEDE (formerly the TeraGrid)
61
Practicalities and Implementations
0
200
400
600
800
1000
1200
1400
0 200 400 600 800 1000 1200
spee
dup
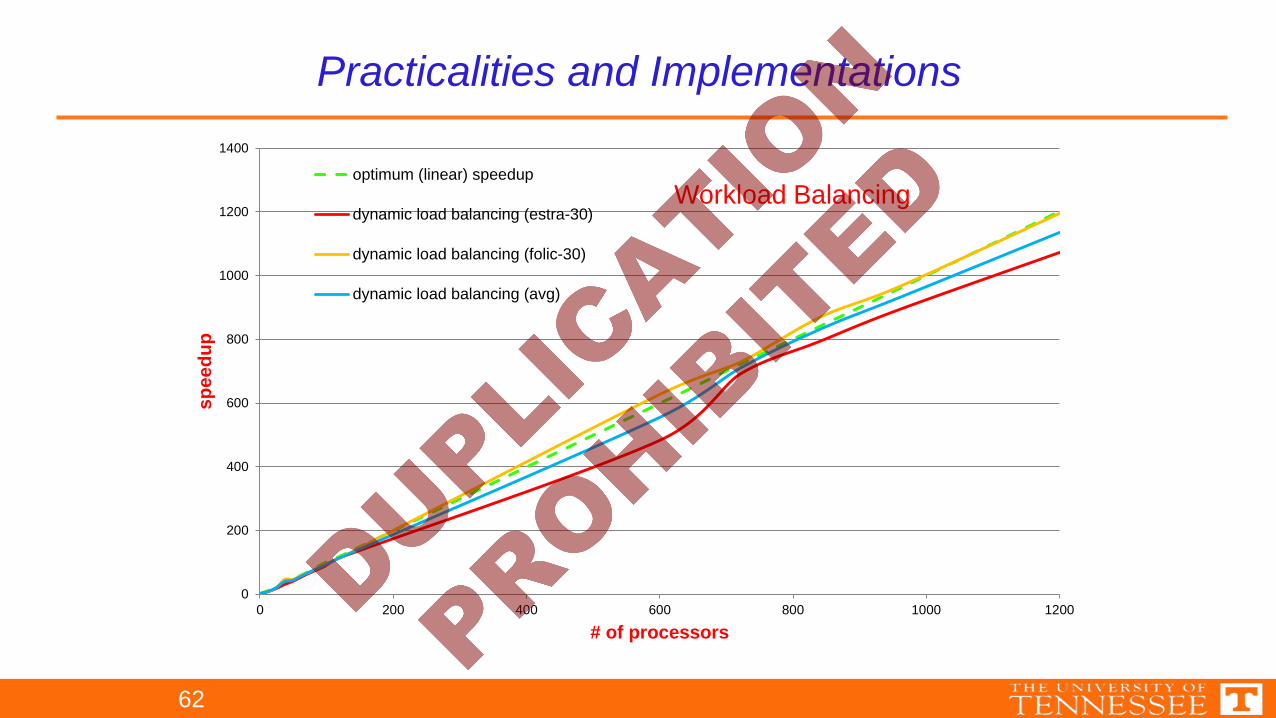
# of processors
optimum (linear) speedup
dynamic load balancing (estra-30)
dynamic load balancing (folic-30)
dynamic load balancing (avg)
Workload Balancing
62
Practicalities and Implementations
63
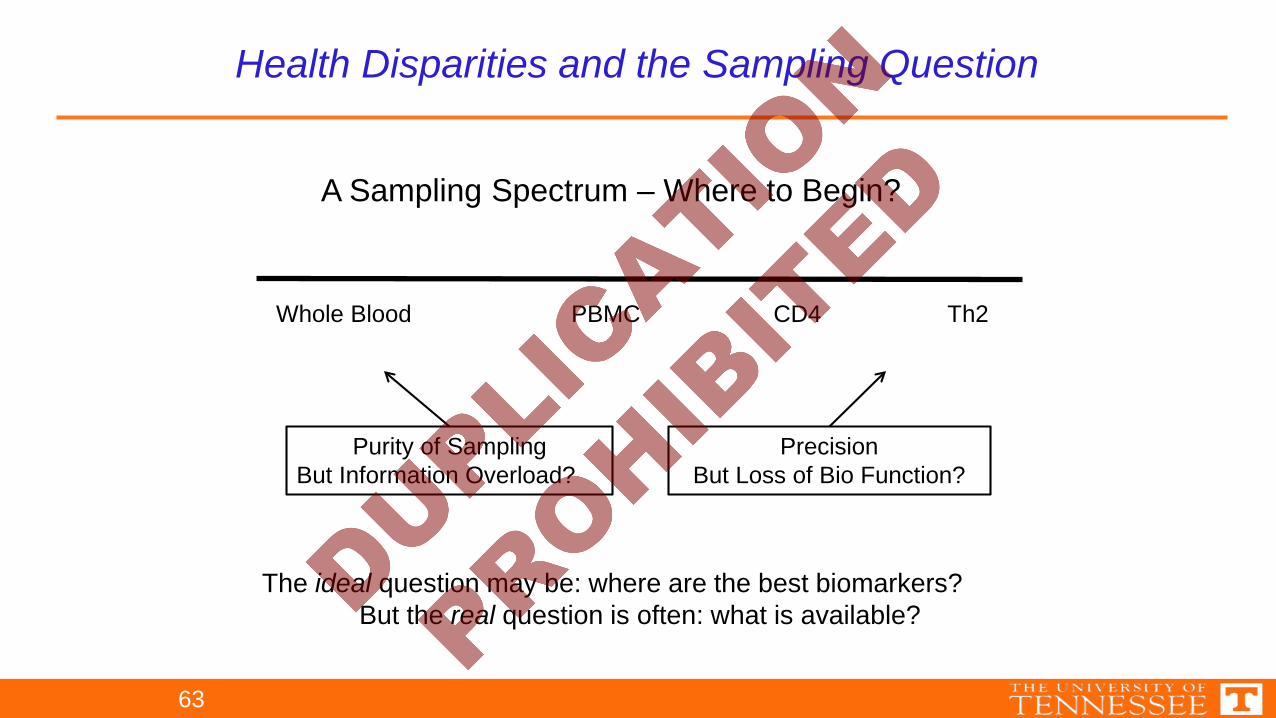
Health Disparities and the Sampling Question
A Sampling Spectrum – Where to Begin?
Whole Blood PBMC CD4 Th2
Purity of SamplingBut Information Overload?
PrecisionBut Loss of Bio Function?
The ideal question may be: where are the best biomarkers?But the real question is often: what is available?
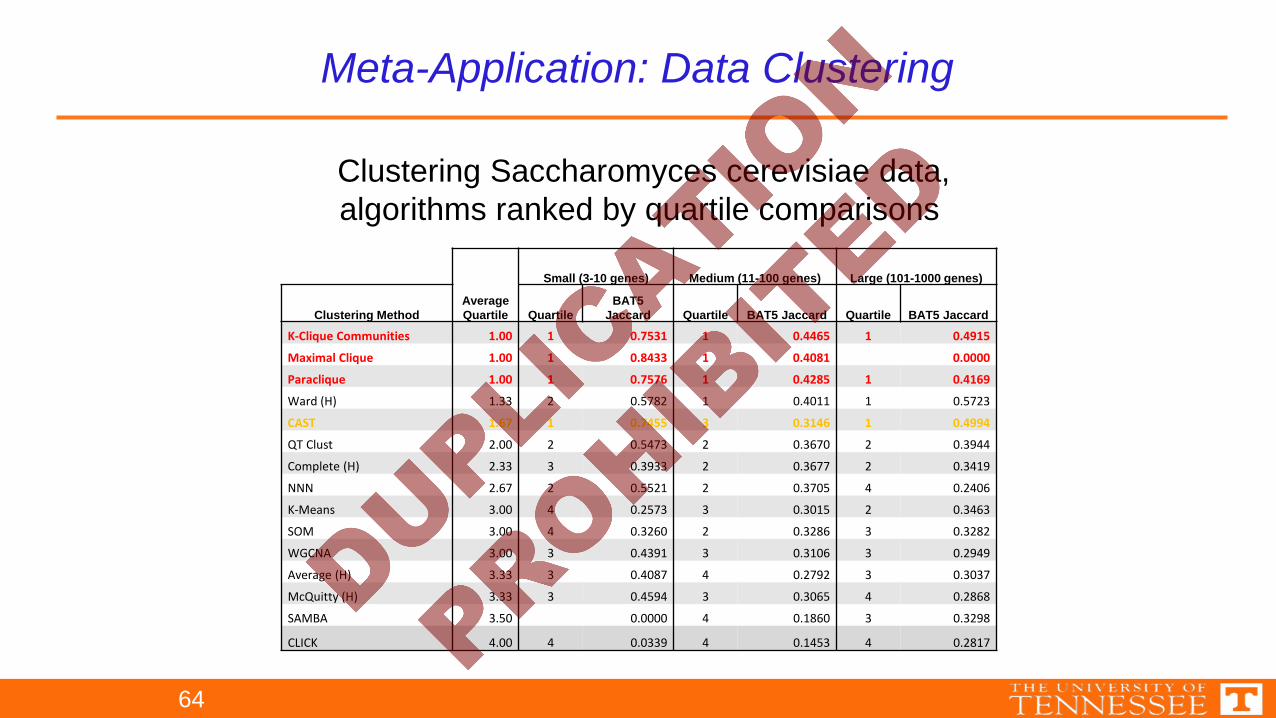
Meta-Application: Data Clustering
Average Quartile
Small (3-10 genes) Medium (11-100 genes) Large (101-1000 genes)
Clustering Method QuartileBAT5
Jaccard Quartile BAT5 Jaccard Quartile BAT5 Jaccard
K-Clique Communities 1.00 1 0.7531 1 0.4465 1 0.4915
Maximal Clique 1.00 1 0.8433 1 0.4081 0.0000
Paraclique 1.00 1 0.7576 1 0.4285 1 0.4169
Ward (H) 1.33 2 0.5782 1 0.4011 1 0.5723
CAST 1.67 1 0.7455 3 0.3146 1 0.4994
QT Clust 2.00 2 0.5473 2 0.3670 2 0.3944
Complete (H) 2.33 3 0.3933 2 0.3677 2 0.3419
NNN 2.67 2 0.5521 2 0.3705 4 0.2406
K-Means 3.00 4 0.2573 3 0.3015 2 0.3463
SOM 3.00 4 0.3260 2 0.3286 3 0.3282
WGCNA 3.00 3 0.4391 3 0.3106 3 0.2949
Average (H) 3.33 3 0.4087 4 0.2792 3 0.3037
McQuitty (H) 3.33 3 0.4594 3 0.3065 4 0.2868
SAMBA 3.50 0.0000 4 0.1860 3 0.3298
CLICK 4.00 4 0.0339 4 0.1453 4 0.2817
Clustering Saccharomyces cerevisiae data,algorithms ranked by quartile comparisons
64
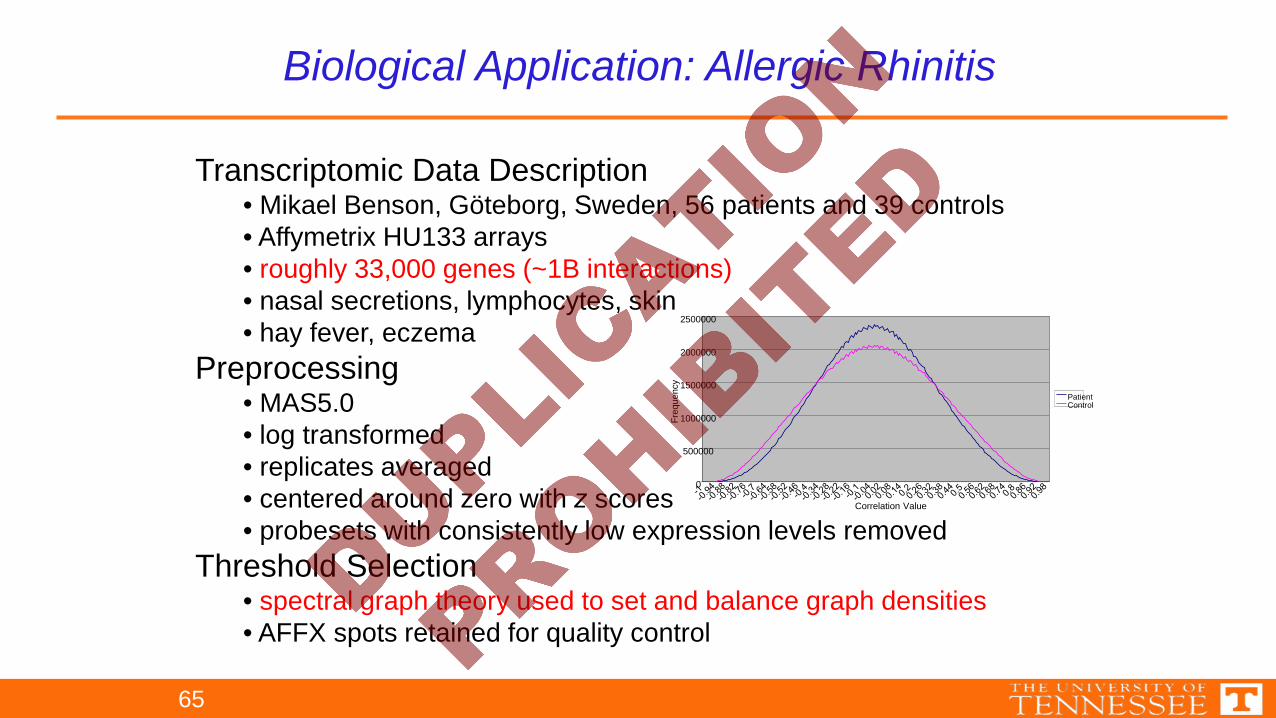
Biological Application: Allergic Rhinitis
Transcriptomic Data Description• Mikael Benson, Göteborg, Sweden, 56 patients and 39 controls• Affymetrix HU133 arrays• roughly 33,000 genes (~1B interactions)• nasal secretions, lymphocytes, skin• hay fever, eczema
Preprocessing• MAS5.0• log transformed• replicates averaged• centered around zero with z scores• probesets with consistently low expression levels removed
Threshold Selection• spectral graph theory used to set and balance graph densities• AFFX spots retained for quality control
0
500000
1000000
1500000
2000000
2500000
Correlation Value
Freq
uenc
y
PatientControl
65
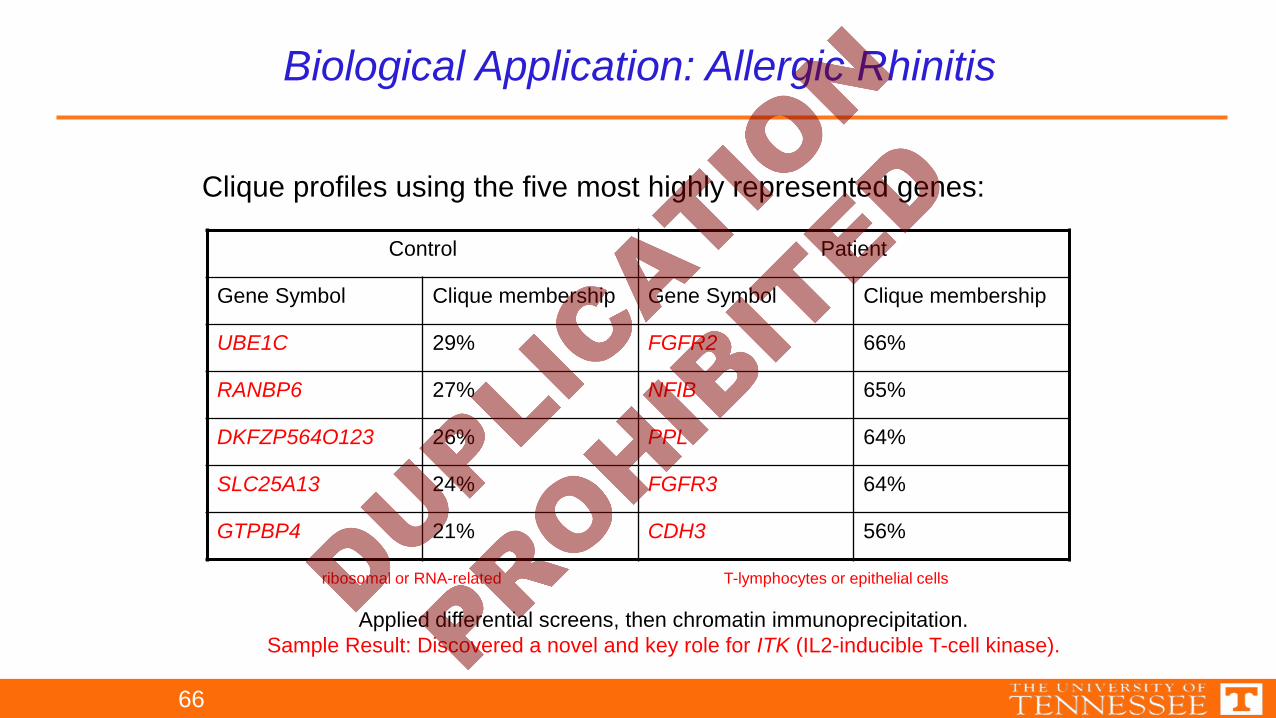
Clique profiles using the five most highly represented genes:
Control Patient
Gene Symbol Clique membership Gene Symbol Clique membership
UBE1C 29% FGFR2 66%
RANBP6 27% NFIB 65%
DKFZP564O123 26% PPL 64%
SLC25A13 24% FGFR3 64%
GTPBP4 21% CDH3 56%
ribosomal or RNA-related T-lymphocytes or epithelial cells
Applied differential screens, then chromatin immunoprecipitation.Sample Result: Discovered a novel and key role for ITK (IL2-inducible T-cell kinase).
66
Biological Application: Allergic Rhinitis
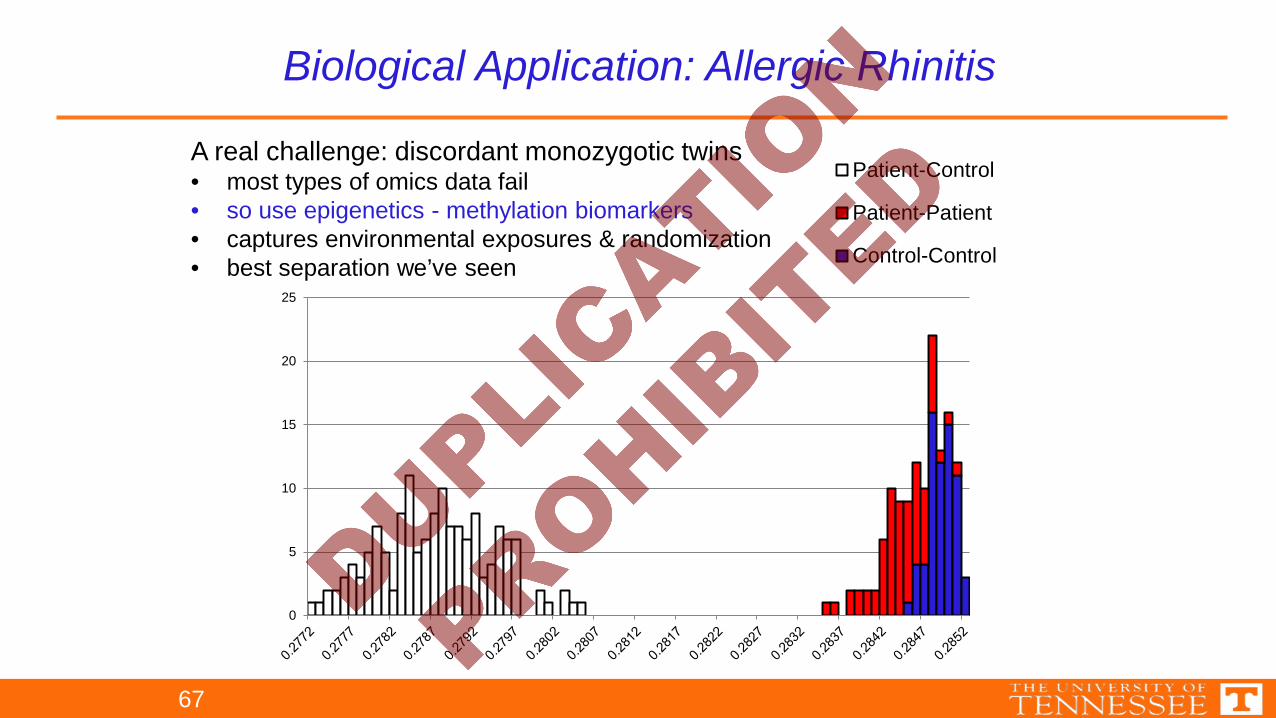
0
5
10
15
20
25
Patient-Control
Patient-Patient
Control-Control
A real challenge: discordant monozygotic twins• most types of omics data fail• so use epigenetics - methylation biomarkers• captures environmental exposures & randomization• best separation we’ve seen
67
Biological Application: Allergic Rhinitis
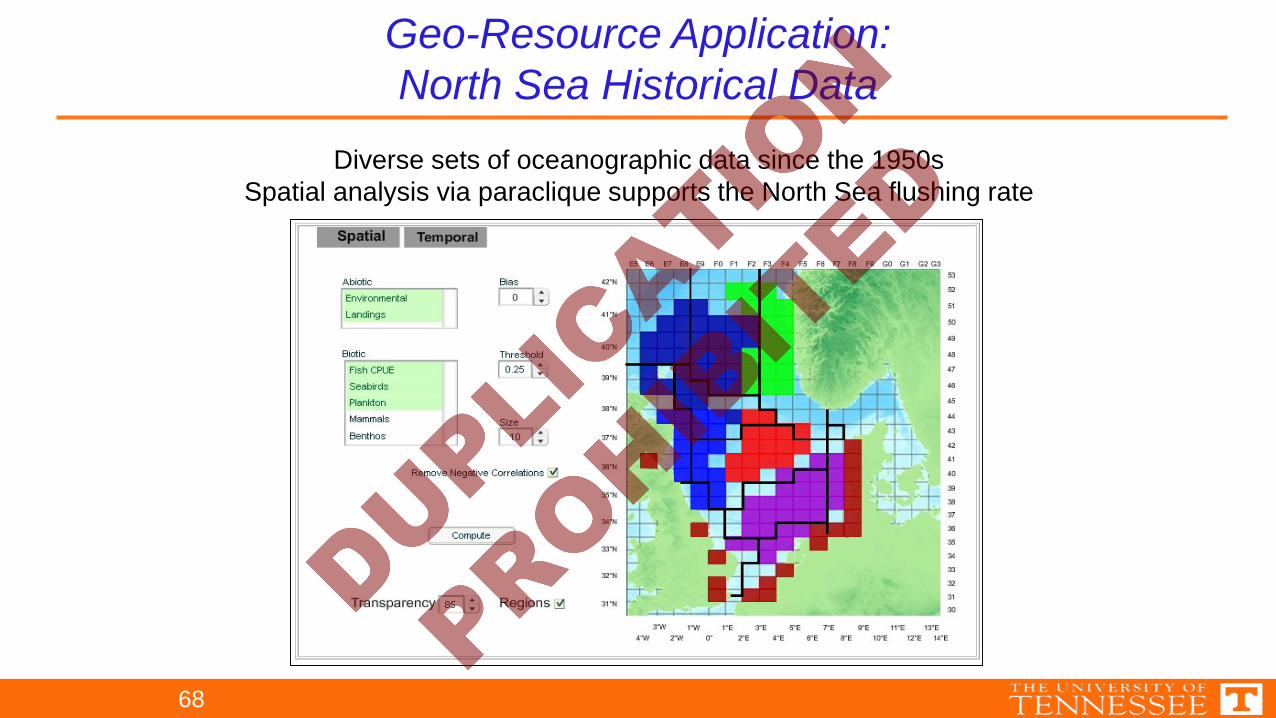
Geo-Resource Application:North Sea Historical Data
Diverse sets of oceanographic data since the 1950sSpatial analysis via paraclique supports the North Sea flushing rate
68
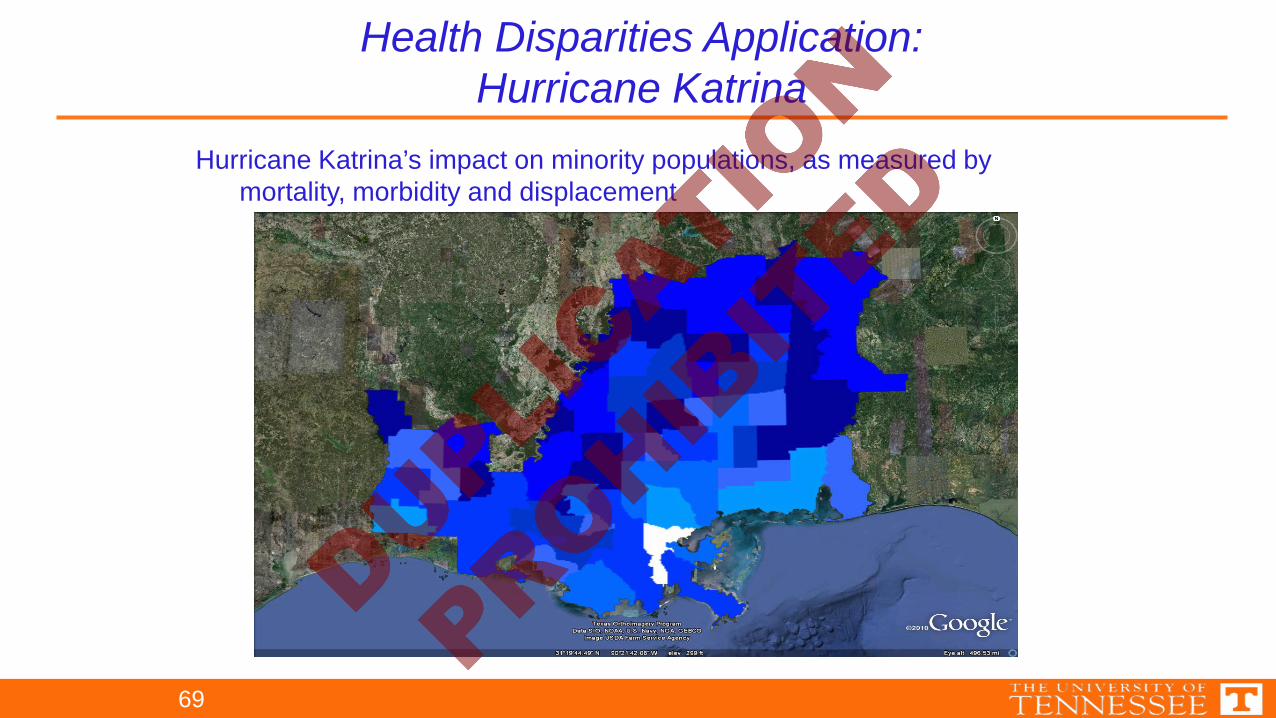
Hurricane Katrina’s impact on minority populations, as measured bymortality, morbidity and displacement
69
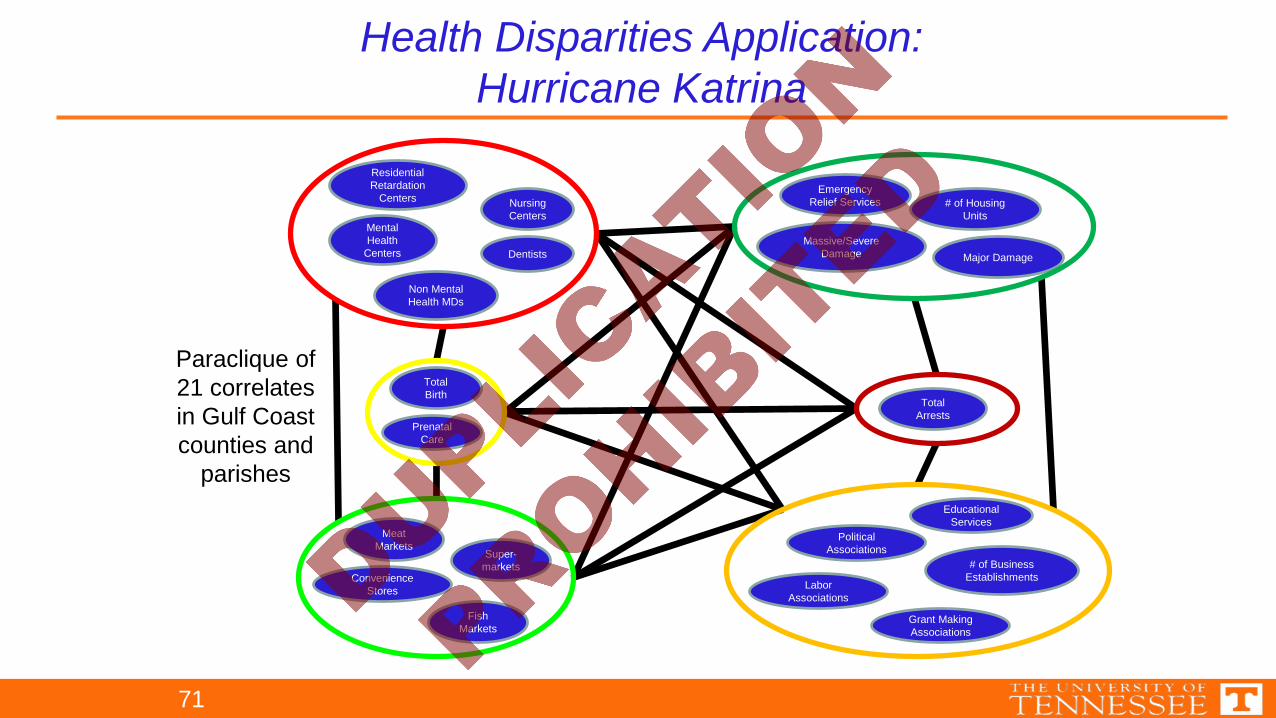
Health Disparities Application:Hurricane Katrina
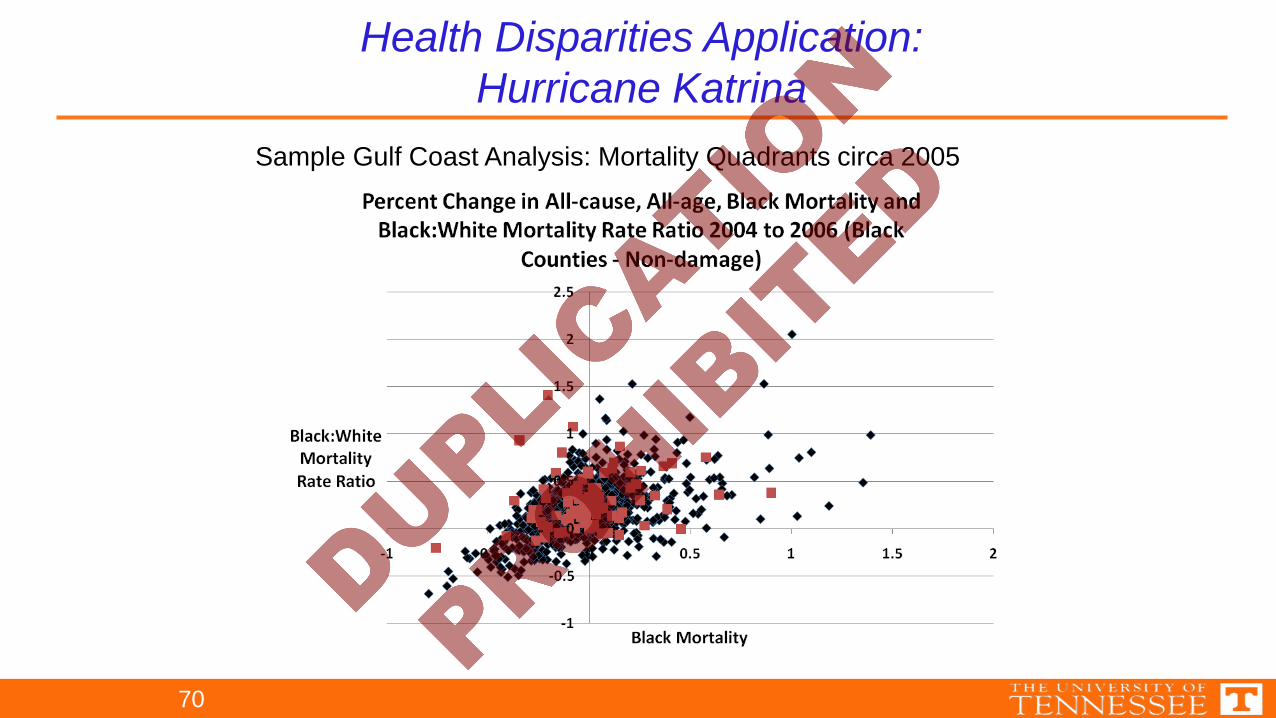
Sample Gulf Coast Analysis: Mortality Quadrants circa 2005
70
Health Disparities Application:Hurricane Katrina
Meat Markets
Total Arrests
Emergency Relief Services
EducationalServices
Total Birth
Convenience Stores
MentalHealth
Centers
Nursing Centers
Non Mental Health MDs
Prenatal Care
Residential Retardation
Centers
Dentists
Super-markets
Fish Markets
PoliticalAssociations
Grant MakingAssociations
LaborAssociations
# of Business Establishments
Massive/Severe Damage Major Damage
# of Housing Units
Paraclique of21 correlatesin Gulf Coastcounties and
parishes
71
Health Disparities Application:Hurricane Katrina
72
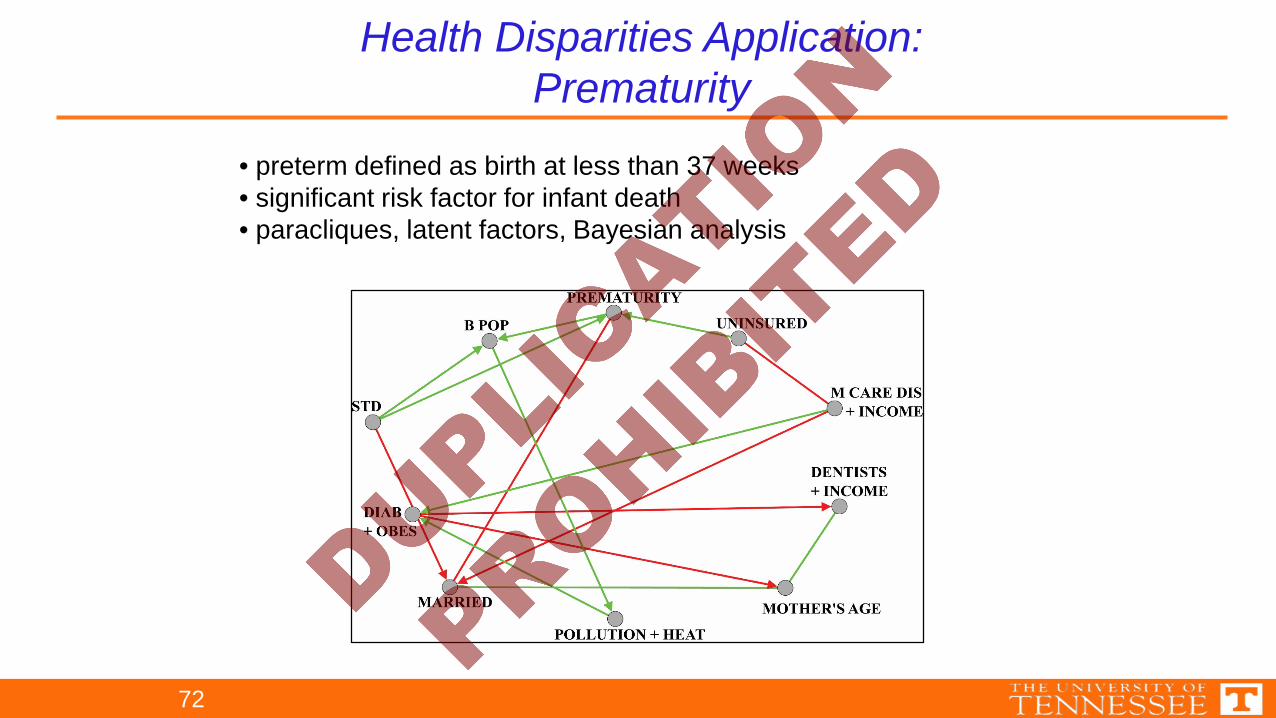
• preterm defined as birth at less than 37 weeks• significant risk factor for infant death• paracliques, latent factors, Bayesian analysis
Health Disparities Application:Prematurity
73
Data• 3143 county-equivalents in a four-case study design: BM, WM, BF, WF
Cigarette consumption a contributing factor for all four groupsBut smoking alone
• does not explain differences in race x gender mortality disparities• its relative contribution to lung cancer mortality and mortality disparities
• relatively high for WM and WF• much less so for BM and BF
Need to uncover pathways through which environmental exposures• increase risk for lung cancer mortality• lead to race x gender disparities• help identify populations at greatest risk• targeting appropriate interventions
Health Disparities Application:Lung Cancer
Recent Software Releases
74
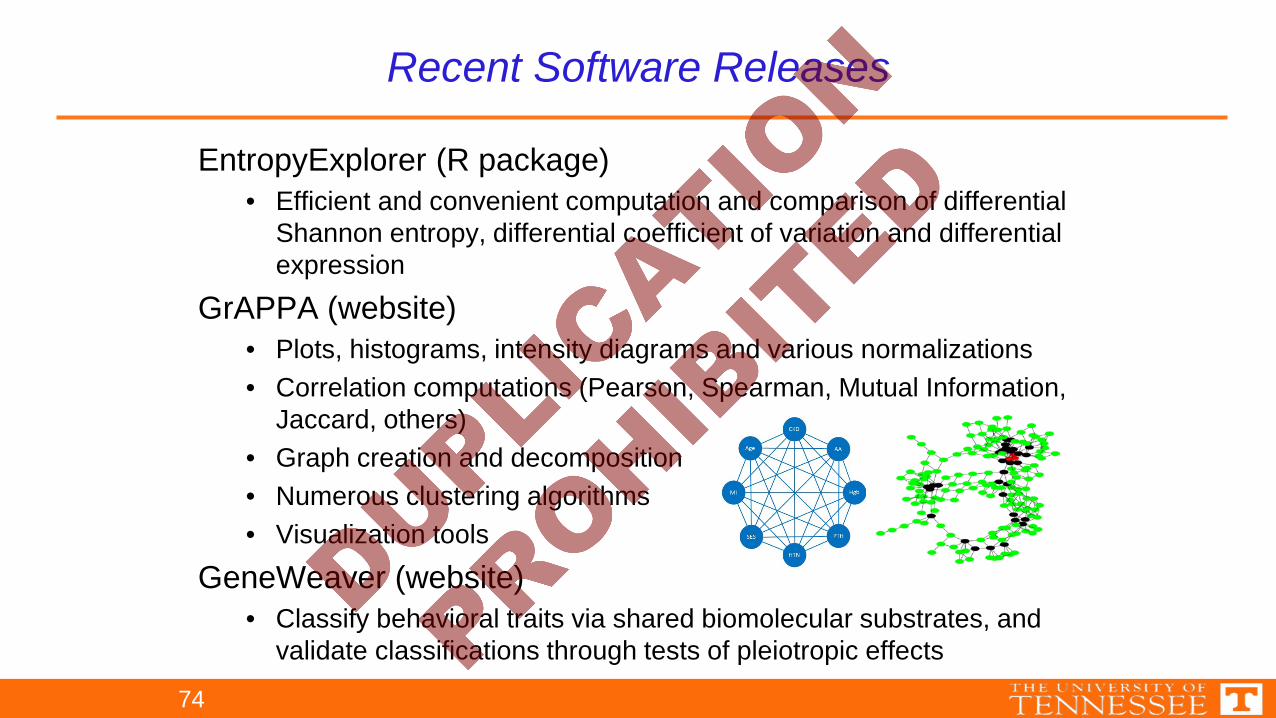
EntropyExplorer (R package)• Efficient and convenient computation and comparison of differential
Shannon entropy, differential coefficient of variation and differential expression
GrAPPA (website)• Plots, histograms, intensity diagrams and various normalizations• Correlation computations (Pearson, Spearman, Mutual Information,
Jaccard, others)• Graph creation and decomposition• Numerous clustering algorithms• Visualization tools
GeneWeaver (website)• Classify behavioral traits via shared biomolecular substrates, and
validate classifications through tests of pleiotropic effects
Health Disparities Brings with It Serious Data Issues• NDAs• CDC• NIH & HIPAA• DOD &TCPs• IRB• Non-de-identified data … even so-called de-identified data!
Support Gratefully Acknowledged• Domestic: AFRL, DOE (BER), NIH (NIAAA, NIDA, NIMHD), NRO• International: ARC, EU
Thanks for Listening!
Closing Remarks
75