Embed Size (px)
Citation preview

Supporting Geo-Ontology Engineering through Spatial Data Analytics
Gloria Re Calegari, Emanuela Carlino, Irene Celino and Diego Peroni
CEFRIEL – Milano, Italy
IntroductionNotion of place as a “situated concept”
Dependent on physical, natural, social, cultural and cognitive processes
Entities within a specific spatio-temporal context
Geospatial ontologies
General-purpose vs. location-specific
Top-down vs. bottom-up
(Re)engineering: evolution, repair and specialization
Can spatial data analytics help in geo-ontology engineering? (data=instances)
Objectives
O1: Re-engineering Spatial Features
Identifying concepts that play a different role in different cities, thus possibly indicating different cultural or pragmatic meanings
O2: Specifying Spatial Neighborhoods
Highlighting new potential concepts to characterize the urban neighborhoods of different cities
Experimental settingsSpatial objects from OpenStreetMap/LinkedGeoData
Described by the LinkedGeoData ontology general-purpose geo-ontology
Several spatial features considered (amenities, shops, etc.)
Data from two cities: Milano and London
Similarities as well as differences
Assumptions about the coverage and completeness of the data
Volunteered Geographic Information (VGI), reflecting the way in which the environment is experienced
Objective 1: Re-Engineering Spatial FeaturesAnalysis of the pattern distribution of each spatial feature
If spatial objects “instances” of a spatial feature are condensed in a specific area, that feature is a relevant element to characterize that area
Aim to verify whether the same concept plays a different role in different places
Two-step analysis:
1) Analysing Distribution of Spatial Objects
2) Clustering Spatial Objects
Objective 1: Re-Engineering Spatial Features
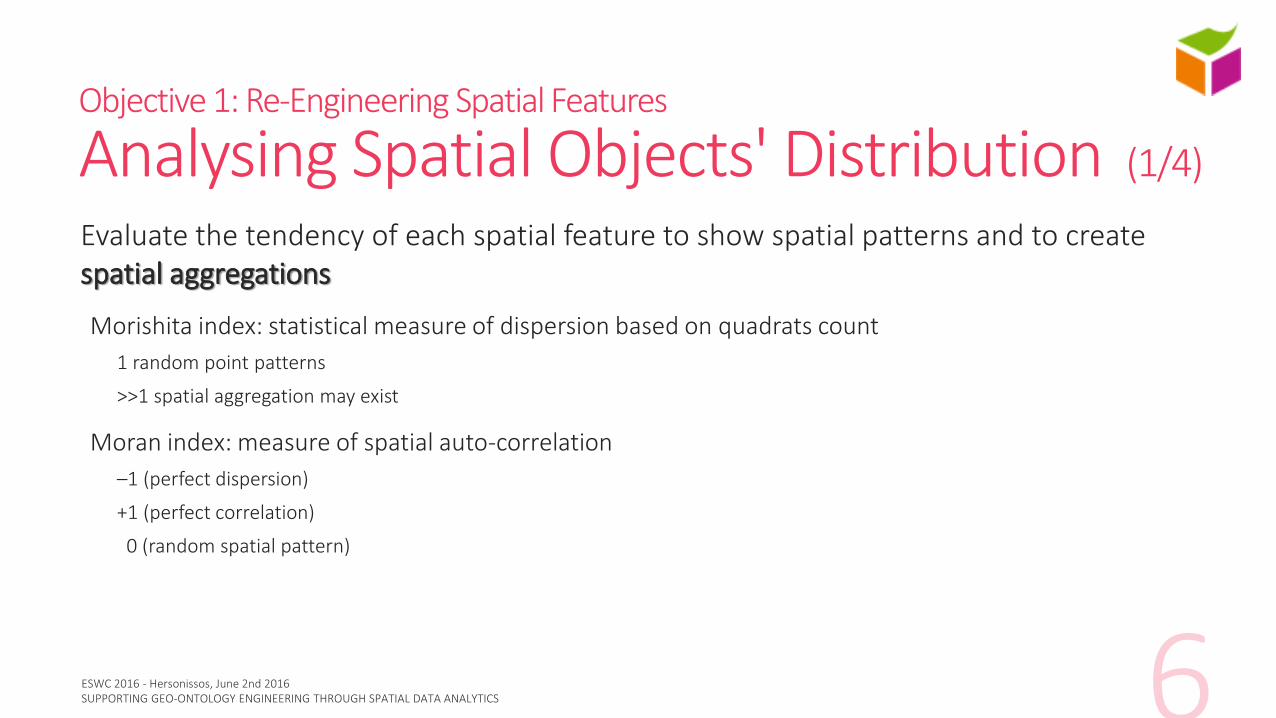
Analysing Spatial Objects' Distribution (1/4)
Evaluate the tendency of each spatial feature to show spatial patterns and to create spatial aggregations
Morishita index: statistical measure of dispersion based on quadrats count
1 random point patterns
>>1 spatial aggregation may exist
Moran index: measure of spatial auto-correlation
–1 (perfect dispersion)
+1 (perfect correlation)
0 (random spatial pattern)
Objective 1: Re-Engineering Spatial Features
Analysing Spatial Objects' Distribution (2/4)
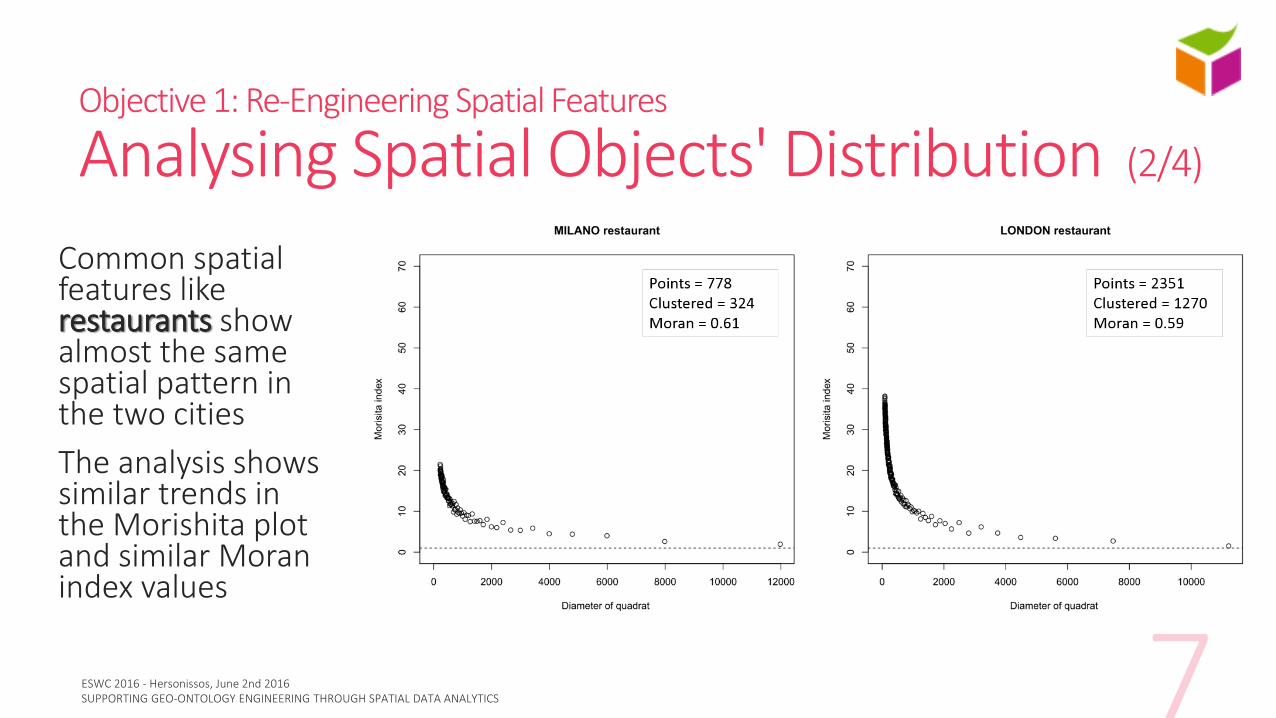
Common spatial features like restaurants show almost the same spatial pattern in the two cities
The analysis shows similar trends in the Morishita plot and similar Moran index values
Objective 1: Re-Engineering Spatial Features
Analysing Spatial Objects' Distribution (3/4)
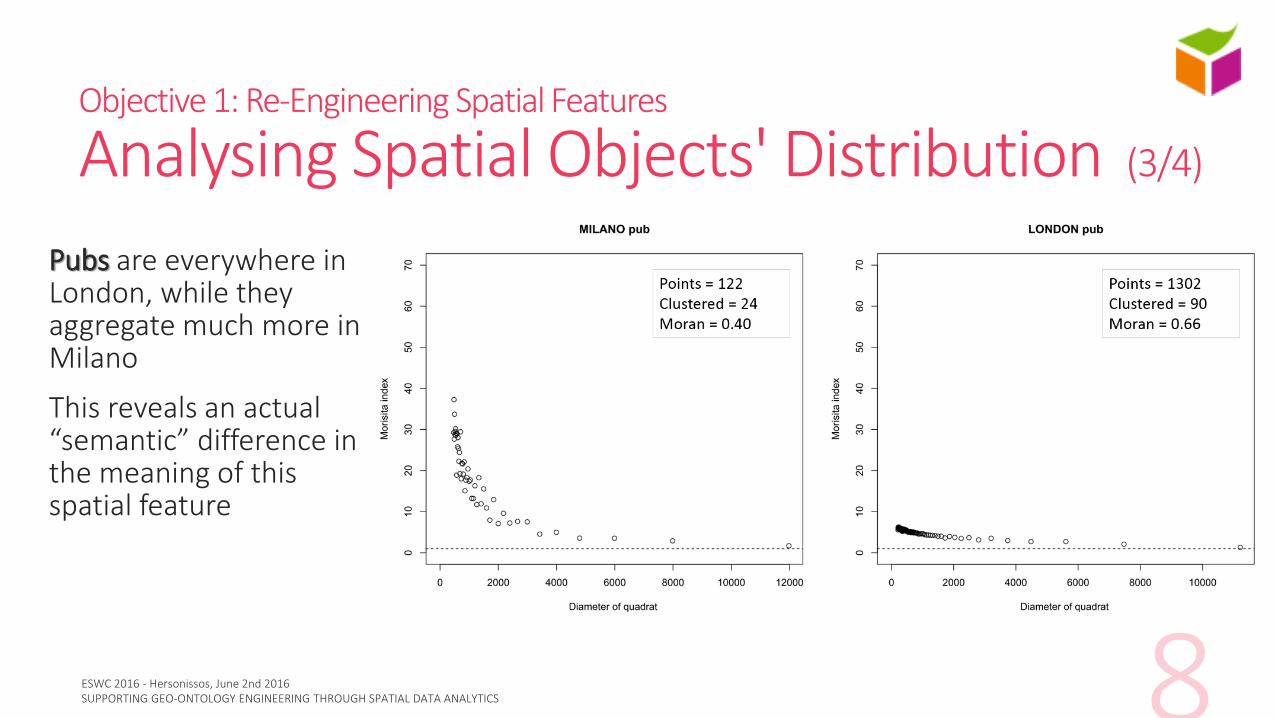
Pubs are everywhere in London, while they aggregate much more in Milano
This reveals an actual “semantic” difference in the meaning of this spatial feature
Objective 1: Re-Engineering Spatial Features
Analysing Spatial Objects' Distribution (4/4)
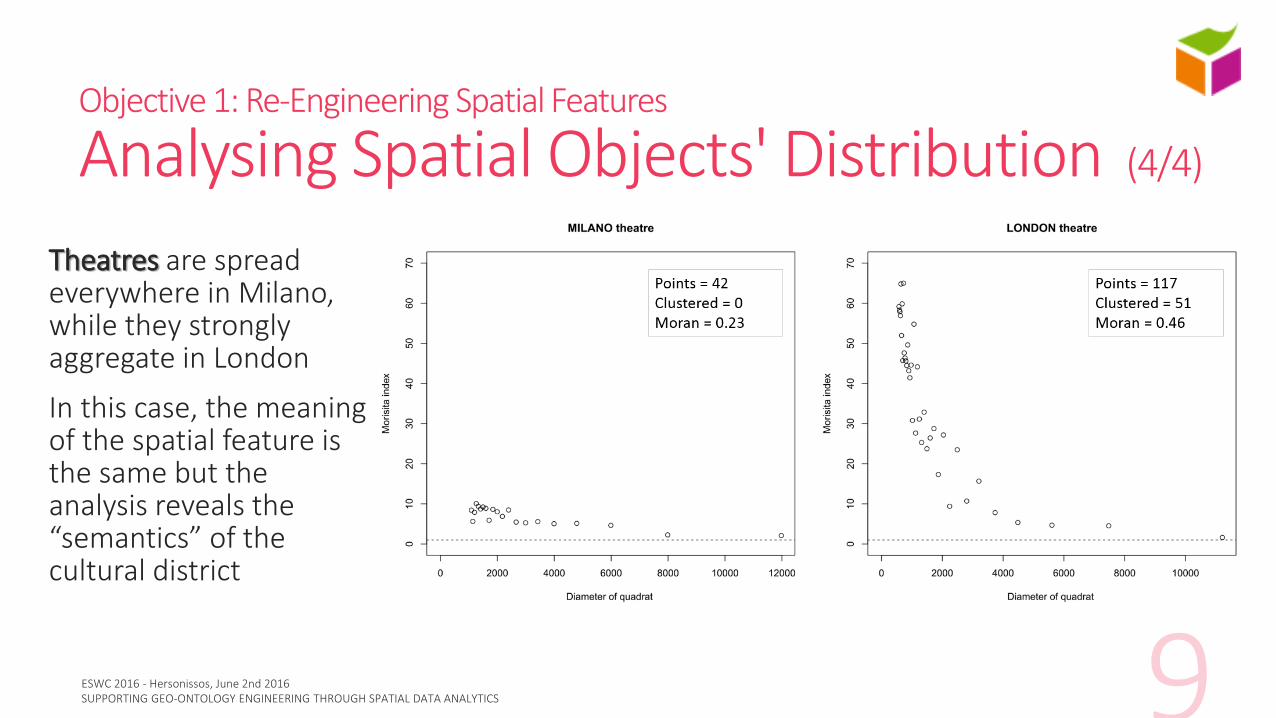
Theatres are spread everywhere in Milano, while they strongly aggregate in London
In this case, the meaning of the spatial feature is the same but the analysis reveals the “semantics” of the cultural district
Objective 1: Re-Engineering Spatial Features
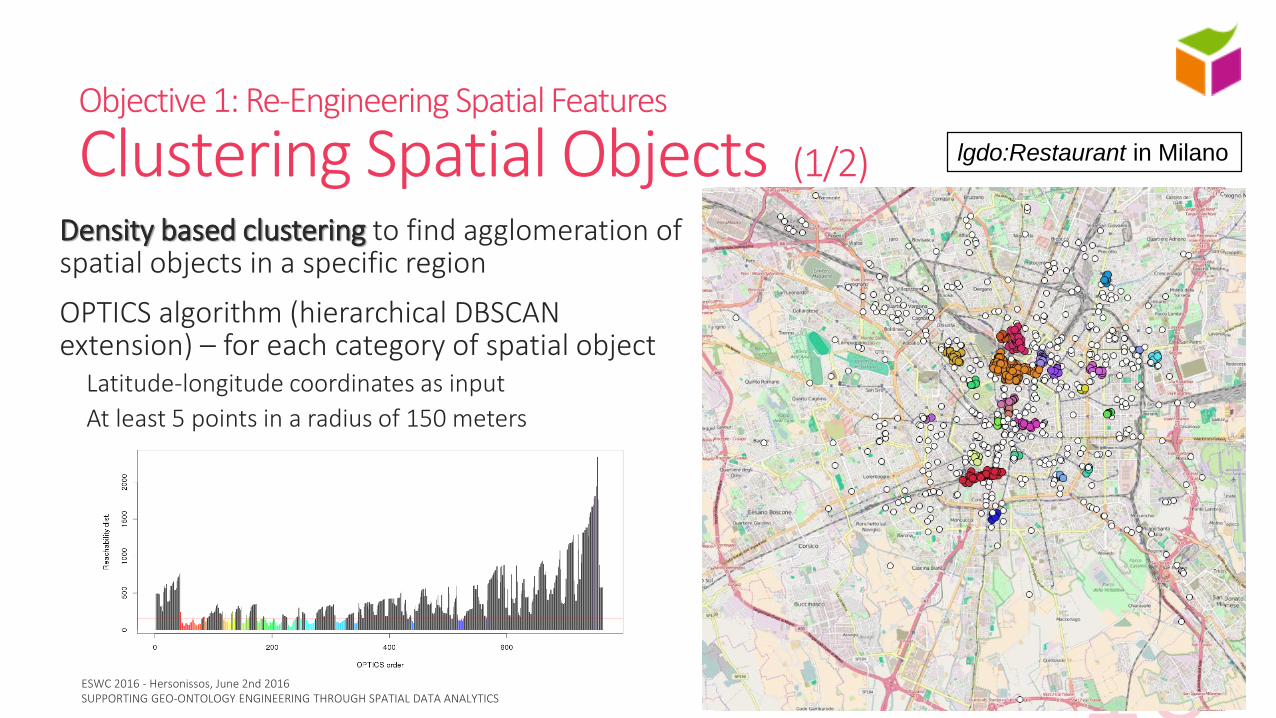
Clustering Spatial Objects (1/2)
Density based clustering to find agglomeration of spatial objects in a specific region
OPTICS algorithm (hierarchical DBSCAN extension) – for each category of spatial object
Latitude-longitude coordinates as input
At least 5 points in a radius of 150 meters
lgdo:Restaurant in Milano
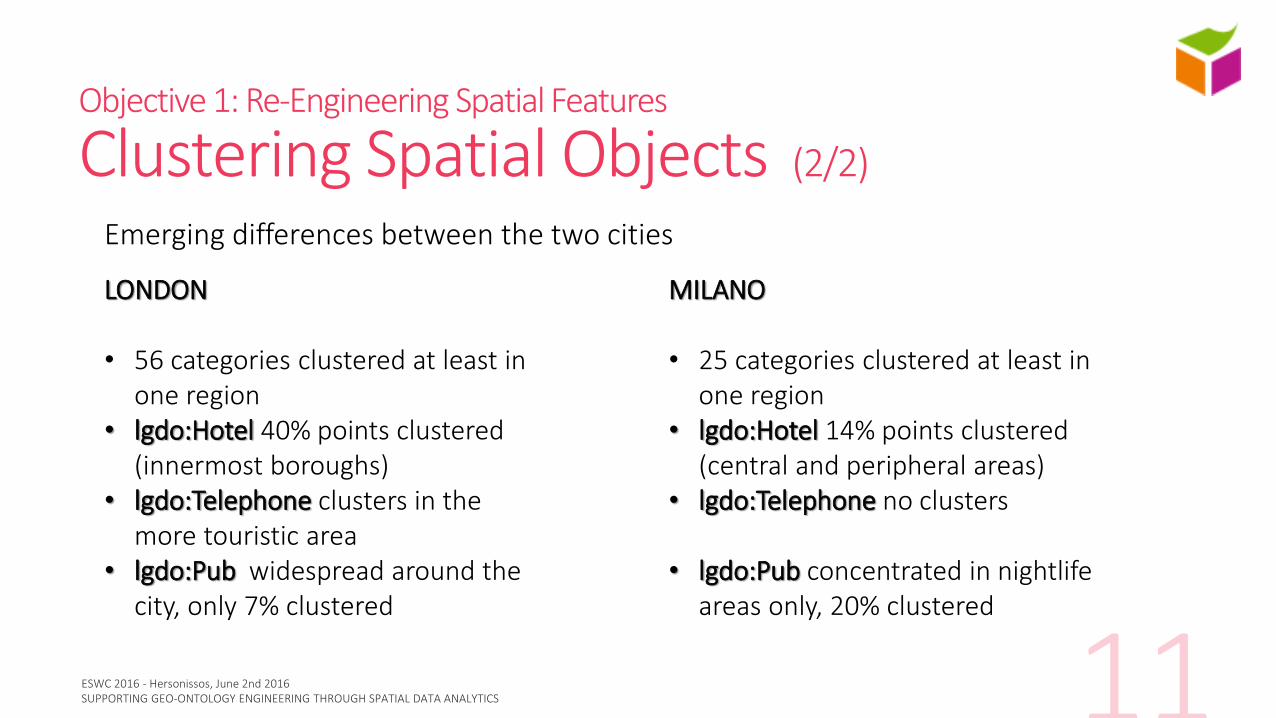
LONDON
• 56 categories clustered at least in one region
• lgdo:Hotel 40% points clustered (innermost boroughs)
• lgdo:Telephone clusters in the more touristic area
• lgdo:Pub widespread around the city, only 7% clustered
MILANO
• 25 categories clustered at least in one region
• lgdo:Hotel 14% points clustered (central and peripheral areas)
• lgdo:Telephone no clusters
• lgdo:Pub concentrated in nightlife areas only, 20% clustered
Emerging differences between the two cities
Objective 1: Re-Engineering Spatial Features
Clustering Spatial Objects (2/2)
Objective 1: Re-Engineering Spatial Features
What do clusters and feature distributions suggest to ontology engineers?Evaluation of the validity/applicability of a geo-ontology in different locations
Hints:
Spatial feature with the same behaviour in different locations ontology re-engineering is not required
Spatial feature with different behaviour in different locations ontology re-engineering may be required with location-specific extensions to the geo-ontology
Note: a pure numerical analysis of the spatial objects is meaningful (lgdo:Convenienceare ‘’outliers’’ in Milano, while in London are numerous)
Objective 2: Specifying Spatial NeighborhoodsWhich are the spatial features that occur together?
Is it possible to semantically characterize a region according to its semantic features co-occurrence?
3-step analysis:
1) Identifying Neighborhoods
2) Characterizing Neighborhoods
3) Semantically Querying Neighborhoods
Objective 2: Specifying Spatial Neighborhoods
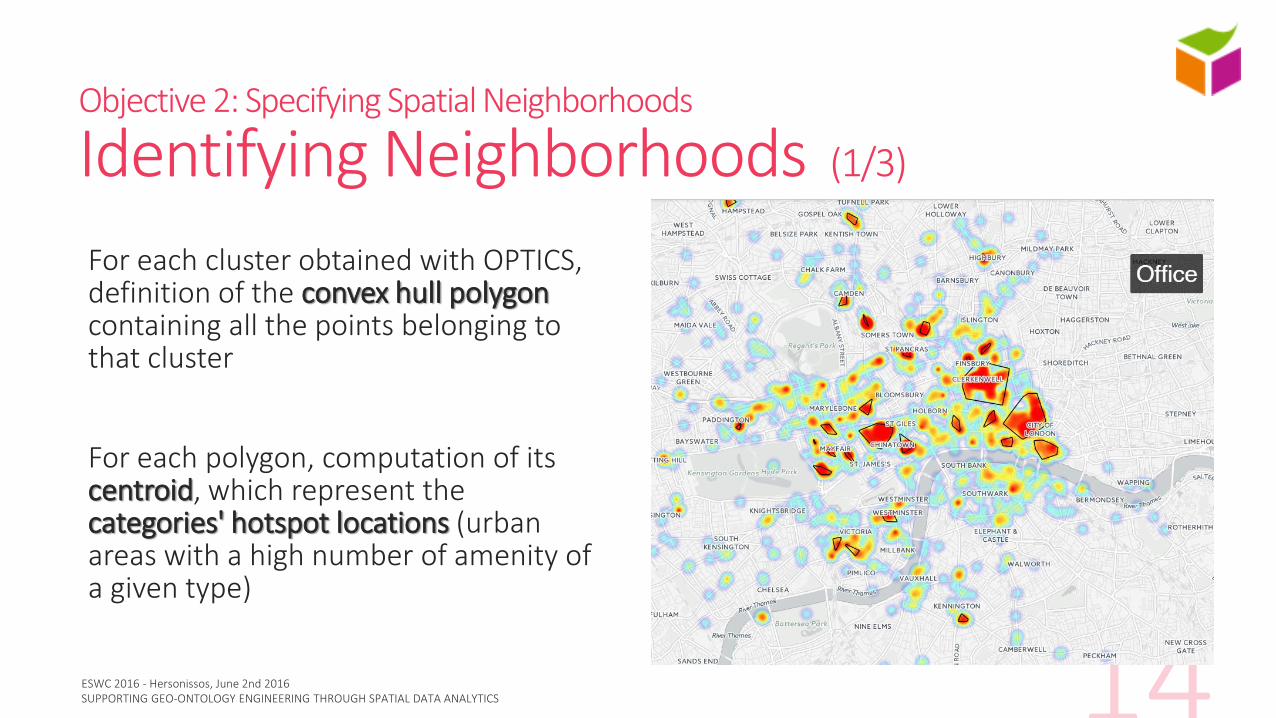
Identifying Neighborhoods (1/3)
For each cluster obtained with OPTICS, definition of the convex hull polygoncontaining all the points belonging to that cluster
For each polygon, computation of its centroid, which represent the categories' hotspot locations (urban areas with a high number of amenity of a given type)
Objective 2: Specifying Spatial Neighborhoods
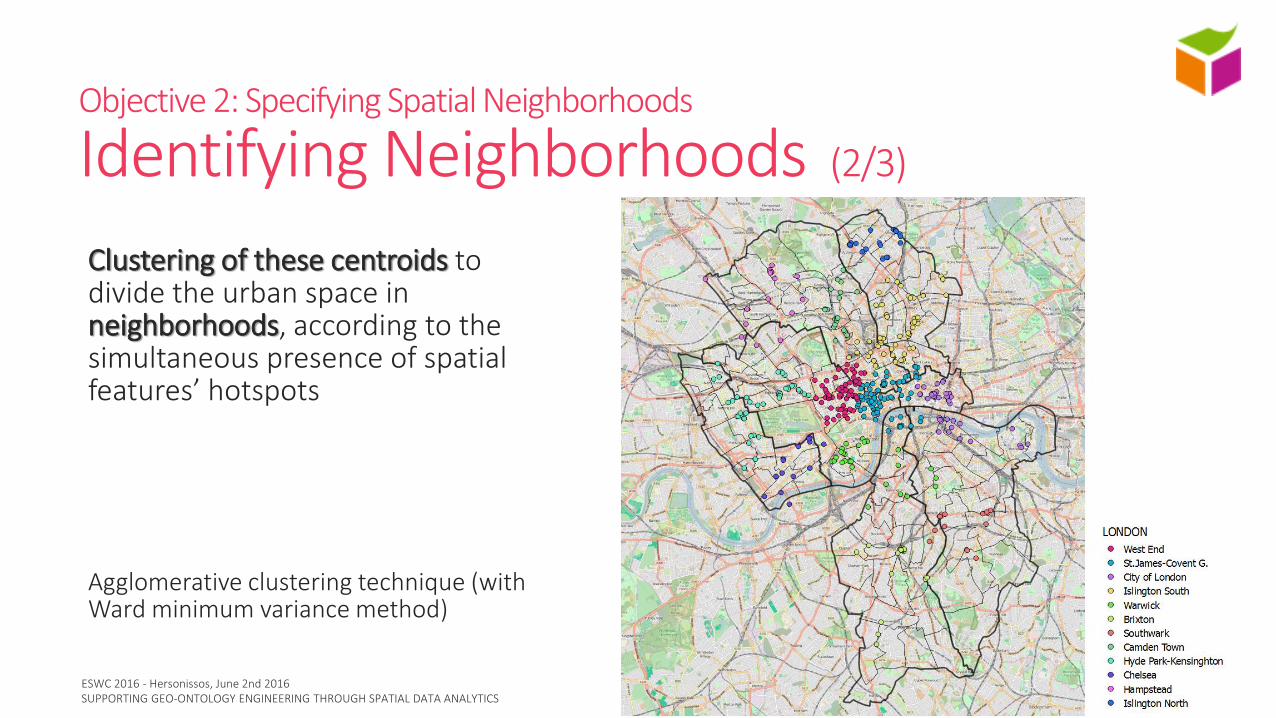
Identifying Neighborhoods (2/3)
Clustering of these centroids to divide the urban space in neighborhoods, according to the simultaneous presence of spatial features’ hotspots
Agglomerative clustering technique (with Ward minimum variance method)
Objective 2: Specifying Spatial Neighborhoods
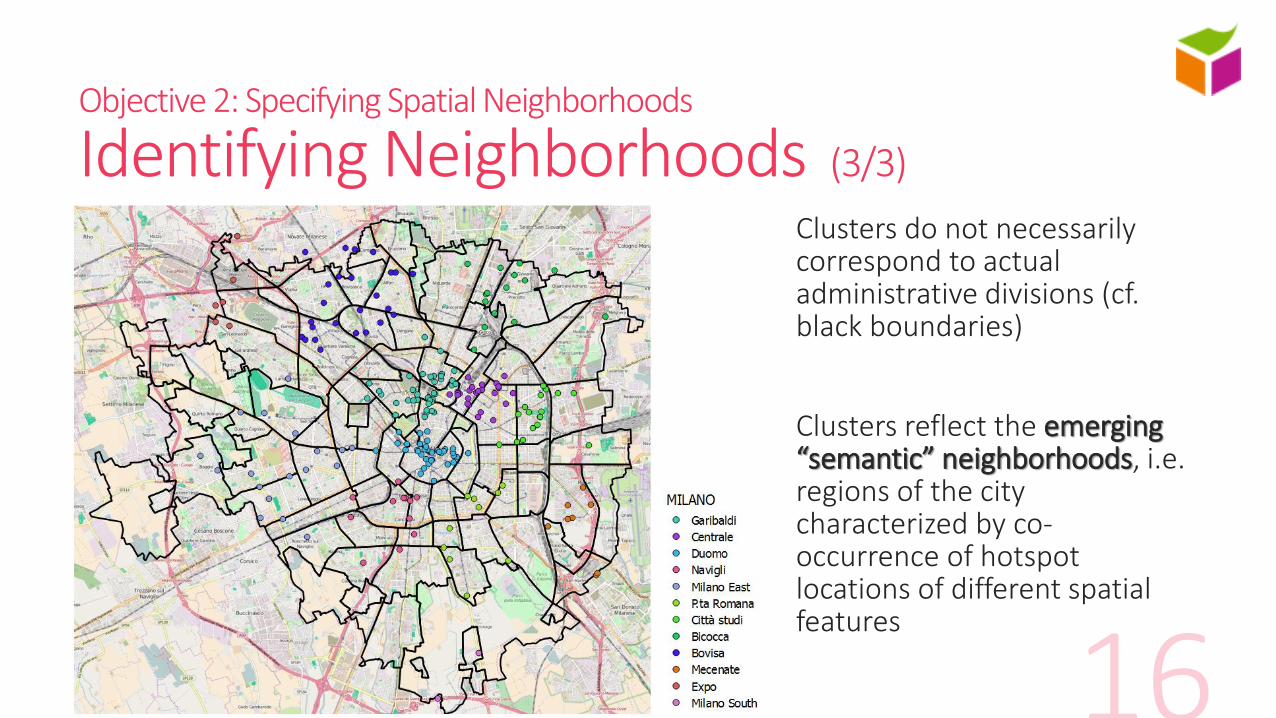
Identifying Neighborhoods (3/3)
Clusters do not necessarily correspond to actual administrative divisions (cf. black boundaries)
Clusters reflect the emerging “semantic” neighborhoods, i.e. regions of the city characterized by co-occurrence of hotspot locations of different spatial features
Objective 2: Specifying Spatial Neighborhoods
Characterizing Neighborhoods (1/3)
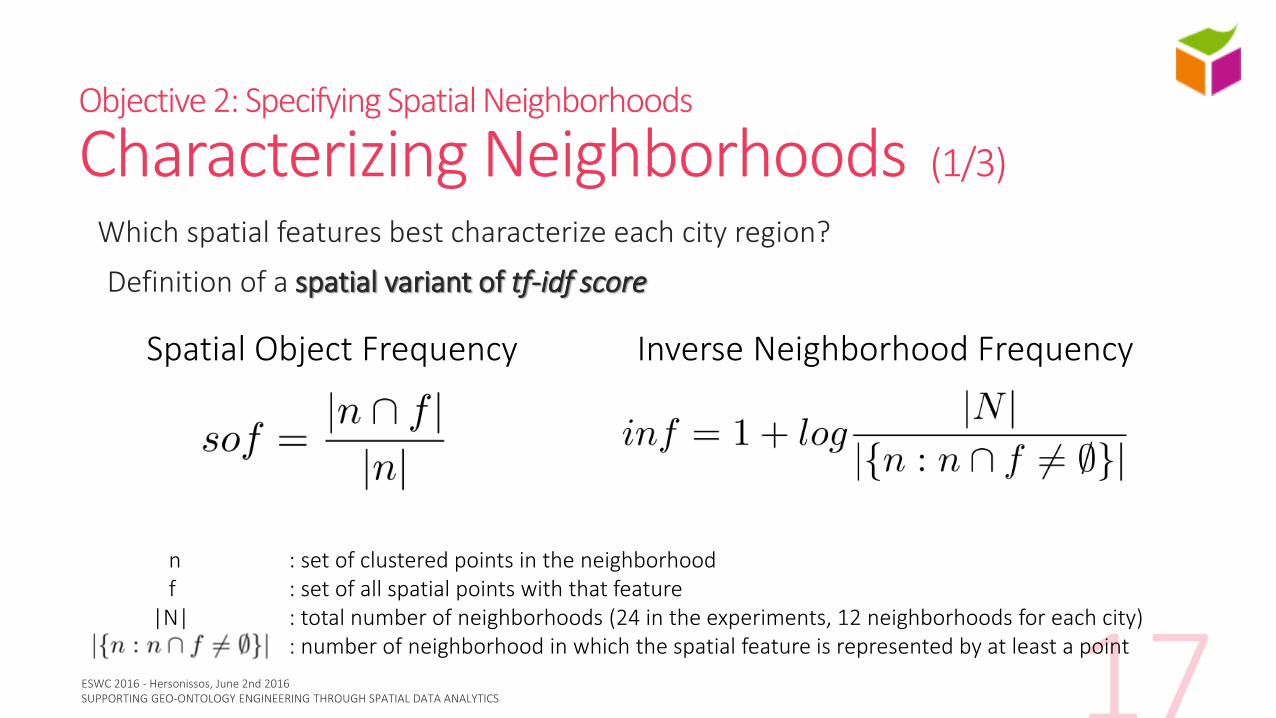
Which spatial features best characterize each city region?
Definition of a spatial variant of tf-idf score
n : set of clustered points in the neighborhoodf : set of all spatial points with that feature
|N| : total number of neighborhoods (24 in the experiments, 12 neighborhoods for each city): number of neighborhood in which the spatial feature is represented by at least a point
Spatial Object Frequency Inverse Neighborhood Frequency
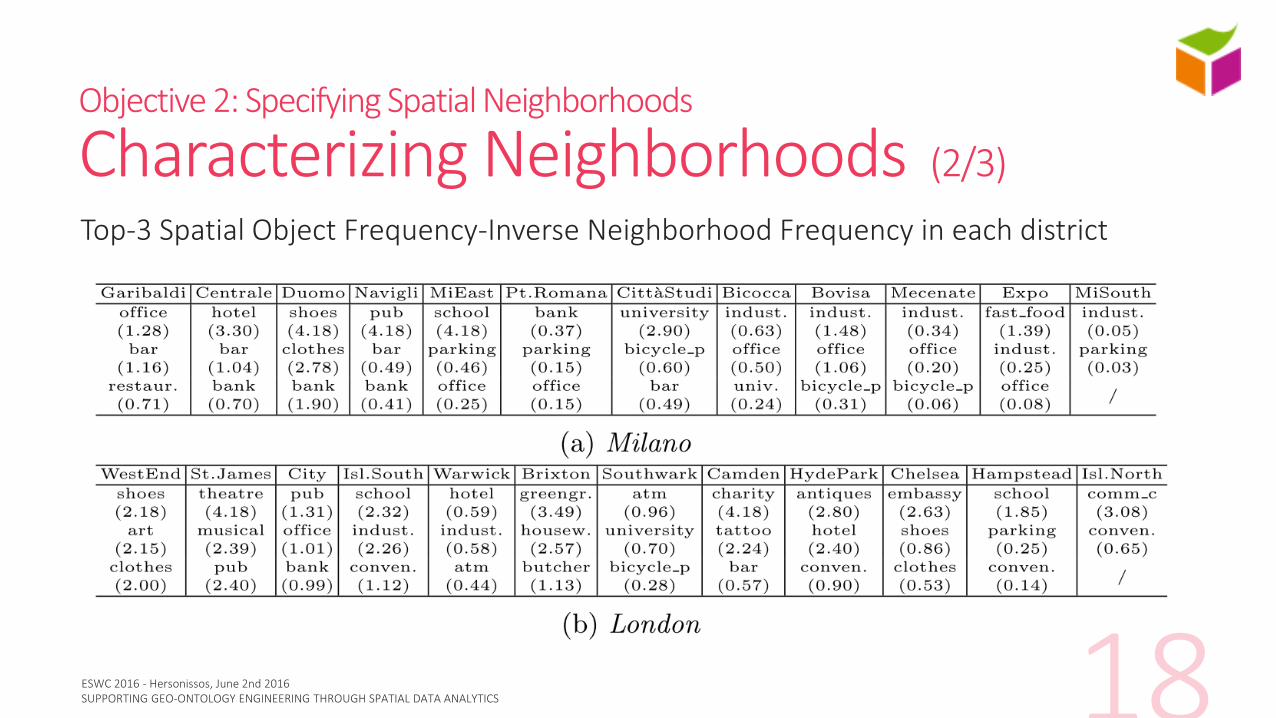
Objective 2: Specifying Spatial Neighborhoods
Characterizing Neighborhoods (2/3)
Top-3 Spatial Object Frequency-Inverse Neighborhood Frequency in each district
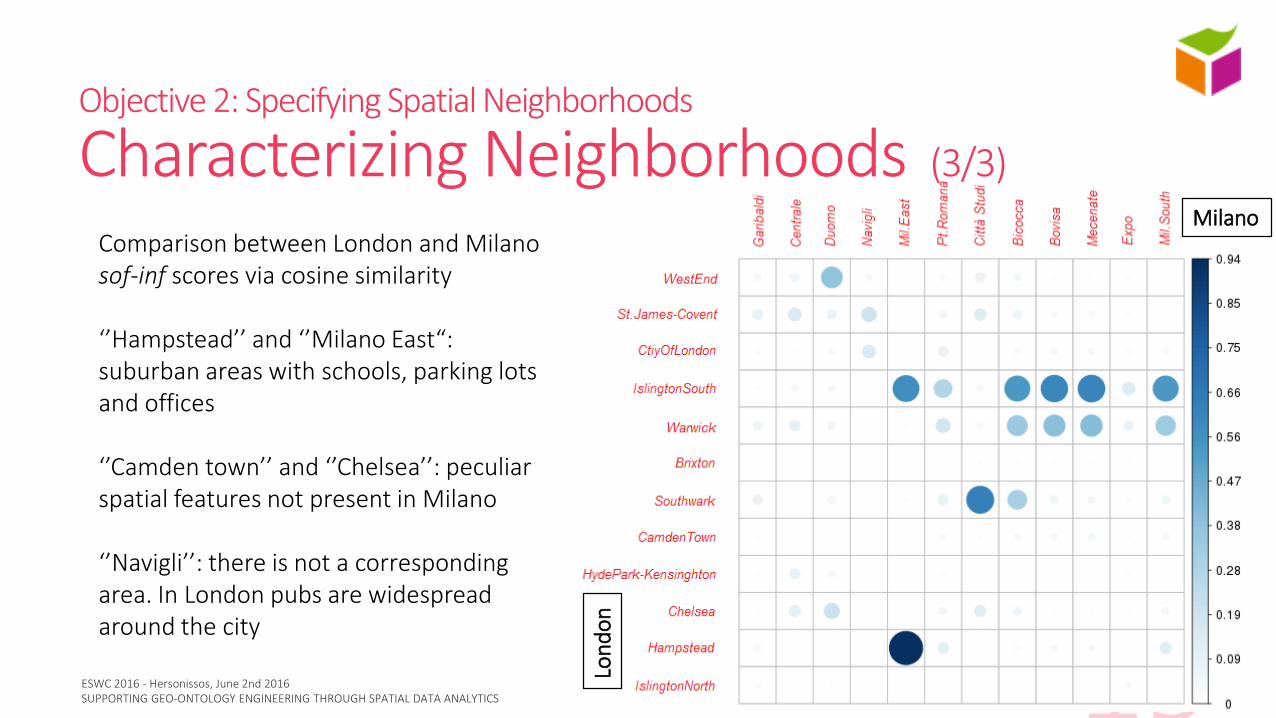
Comparison between London and Milano sof-inf scores via cosine similarity
‘’Hampstead’’ and ‘’Milano East“: suburban areas with schools, parking lots and offices
‘’Camden town’’ and ‘’Chelsea’’: peculiar spatial features not present in Milano
‘’Navigli’’: there is not a corresponding area. In London pubs are widespread around the city
Milano
Lon
do
n
Objective 2: Specifying Spatial Neighborhoods
Characterizing Neighborhoods (3/3)
Objective 2: Specifying Spatial Neighborhoods
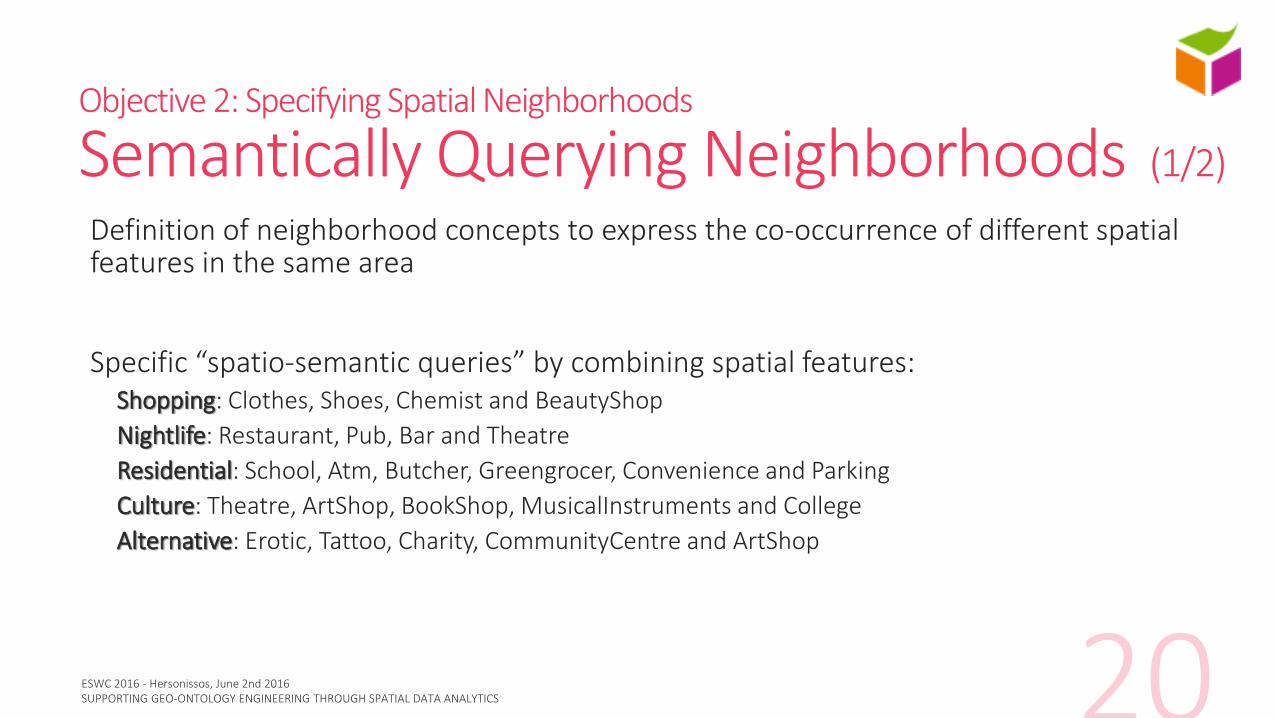
Semantically Querying Neighborhoods (1/2)
Definition of neighborhood concepts to express the co-occurrence of different spatial features in the same area
Specific “spatio-semantic queries” by combining spatial features:Shopping: Clothes, Shoes, Chemist and BeautyShop
Nightlife: Restaurant, Pub, Bar and Theatre
Residential: School, Atm, Butcher, Greengrocer, Convenience and Parking
Culture: Theatre, ArtShop, BookShop, MusicalInstruments and College
Alternative: Erotic, Tattoo, Charity, CommunityCentre and ArtShop
London
Milano
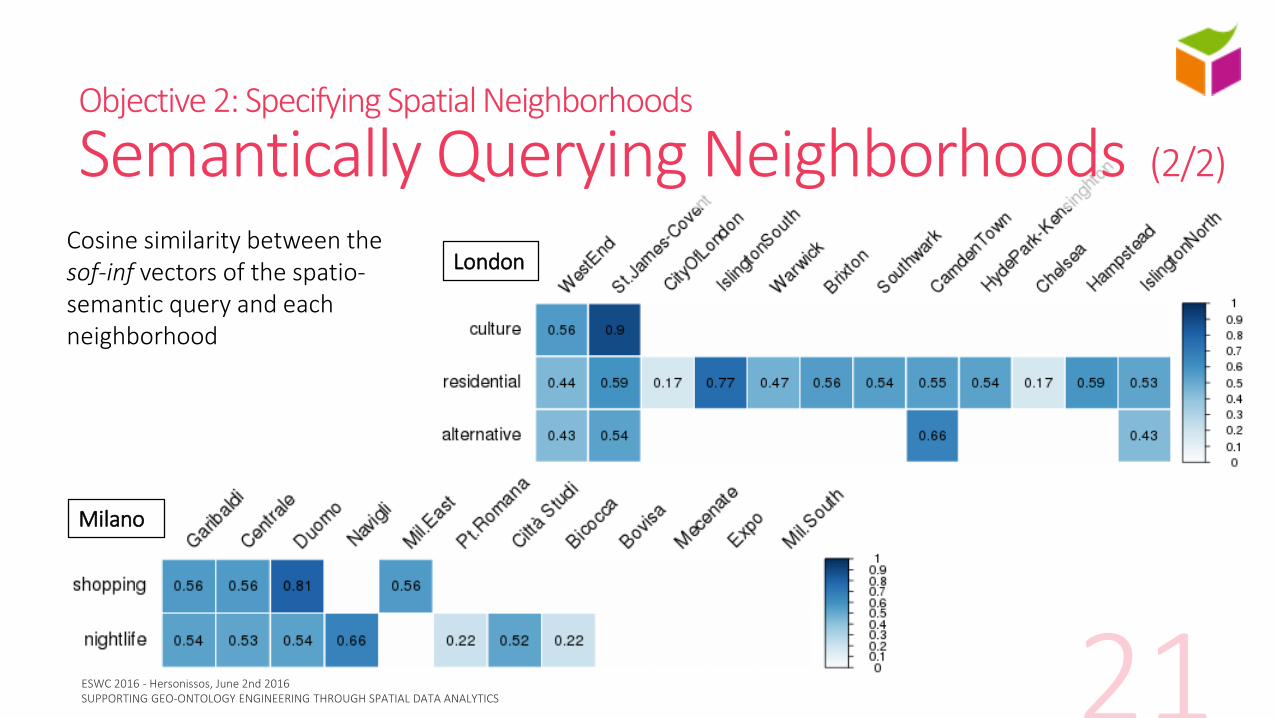
Cosine similarity between the sof-inf vectors of the spatio-semantic query and each neighborhood
Objective 2: Specifying Spatial Neighborhoods
Semantically Querying Neighborhoods (2/2)
Objective 2: Specifying Spatial Neighborhoods
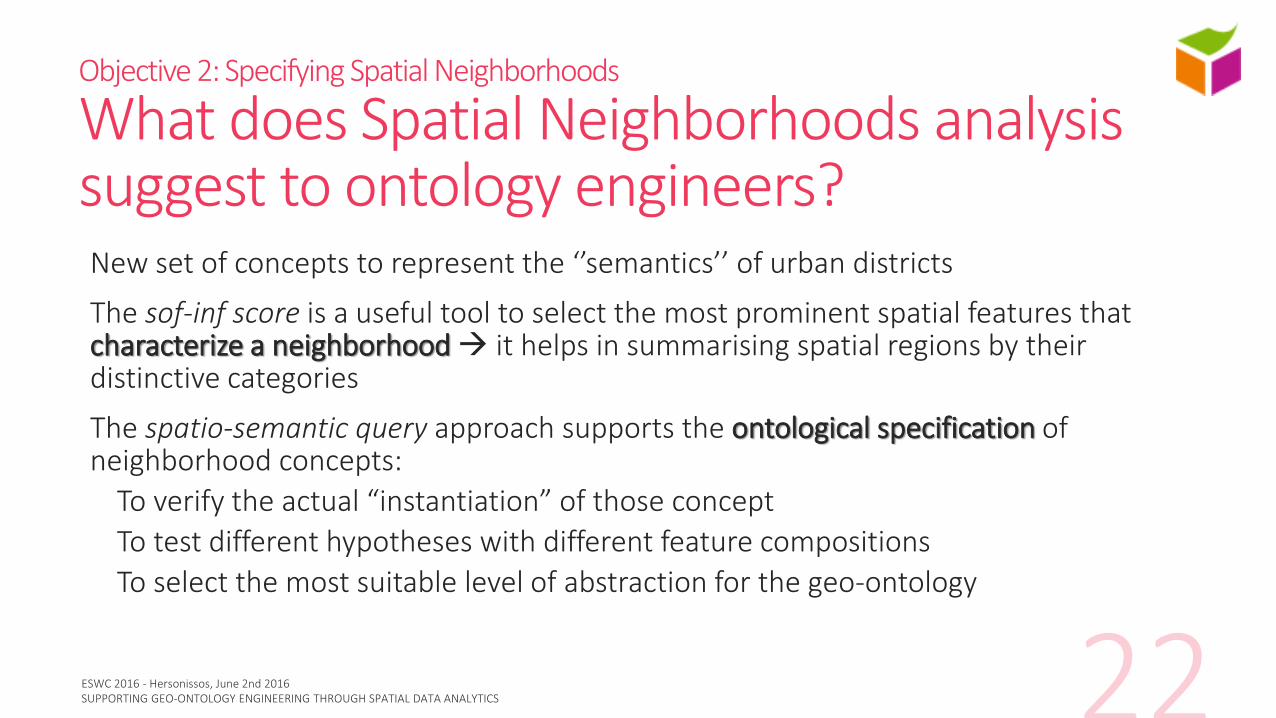
What does Spatial Neighborhoods analysis suggest to ontology engineers?New set of concepts to represent the ‘’semantics’’ of urban districts
The sof-inf score is a useful tool to select the most prominent spatial features that characterize a neighborhood it helps in summarising spatial regions by their distinctive categories
The spatio-semantic query approach supports the ontological specification of neighborhood concepts:
To verify the actual “instantiation” of those concept
To test different hypotheses with different feature compositions
To select the most suitable level of abstraction for the geo-ontology
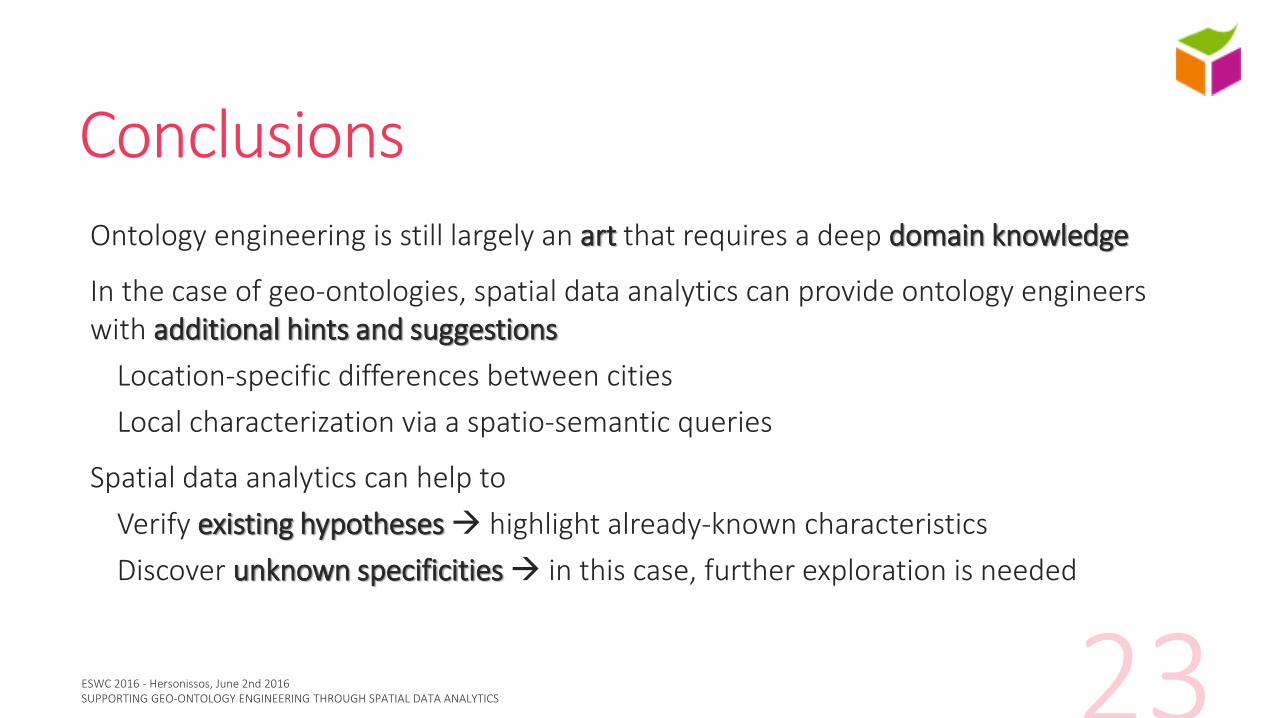
ConclusionsOntology engineering is still largely an art that requires a deep domain knowledge
In the case of geo-ontologies, spatial data analytics can provide ontology engineers with additional hints and suggestions
Location-specific differences between cities
Local characterization via a spatio-semantic queries
Spatial data analytics can help to
Verify existing hypotheses highlight already-known characteristics
Discover unknown specificities in this case, further exploration is needed
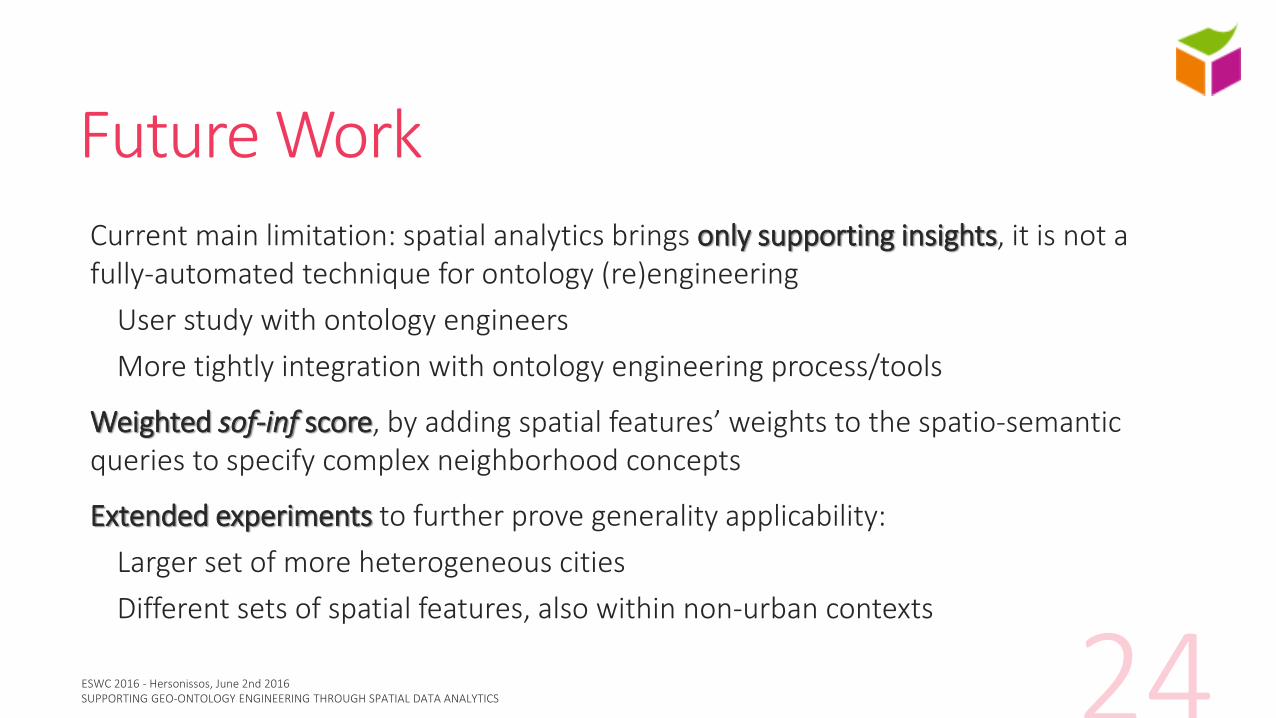
Future WorkCurrent main limitation: spatial analytics brings only supporting insights, it is not a fully-automated technique for ontology (re)engineering
User study with ontology engineers
More tightly integration with ontology engineering process/tools
Weighted sof-inf score, by adding spatial features’ weights to the spatio-semantic queries to specify complex neighborhood concepts
Extended experiments to further prove generality applicability:
Larger set of more heterogeneous cities
Different sets of spatial features, also within non-urban contexts
Supporting Geo-Ontology Engineering through Spatial Data Analytics
Gloria Re Calegari, Emanuela Carlino, Irene Celino and Diego Peroni
Thank you!
Additional material can be found at http://swa.cefriel.it/geo/eswc2016.html